
User-3e39fa49
7 පෝස්ටු

User-3e39fa49
0 හඹා යමින්
1 හඹා යන්නන්
0 කැමති විය
පෝස්ටු
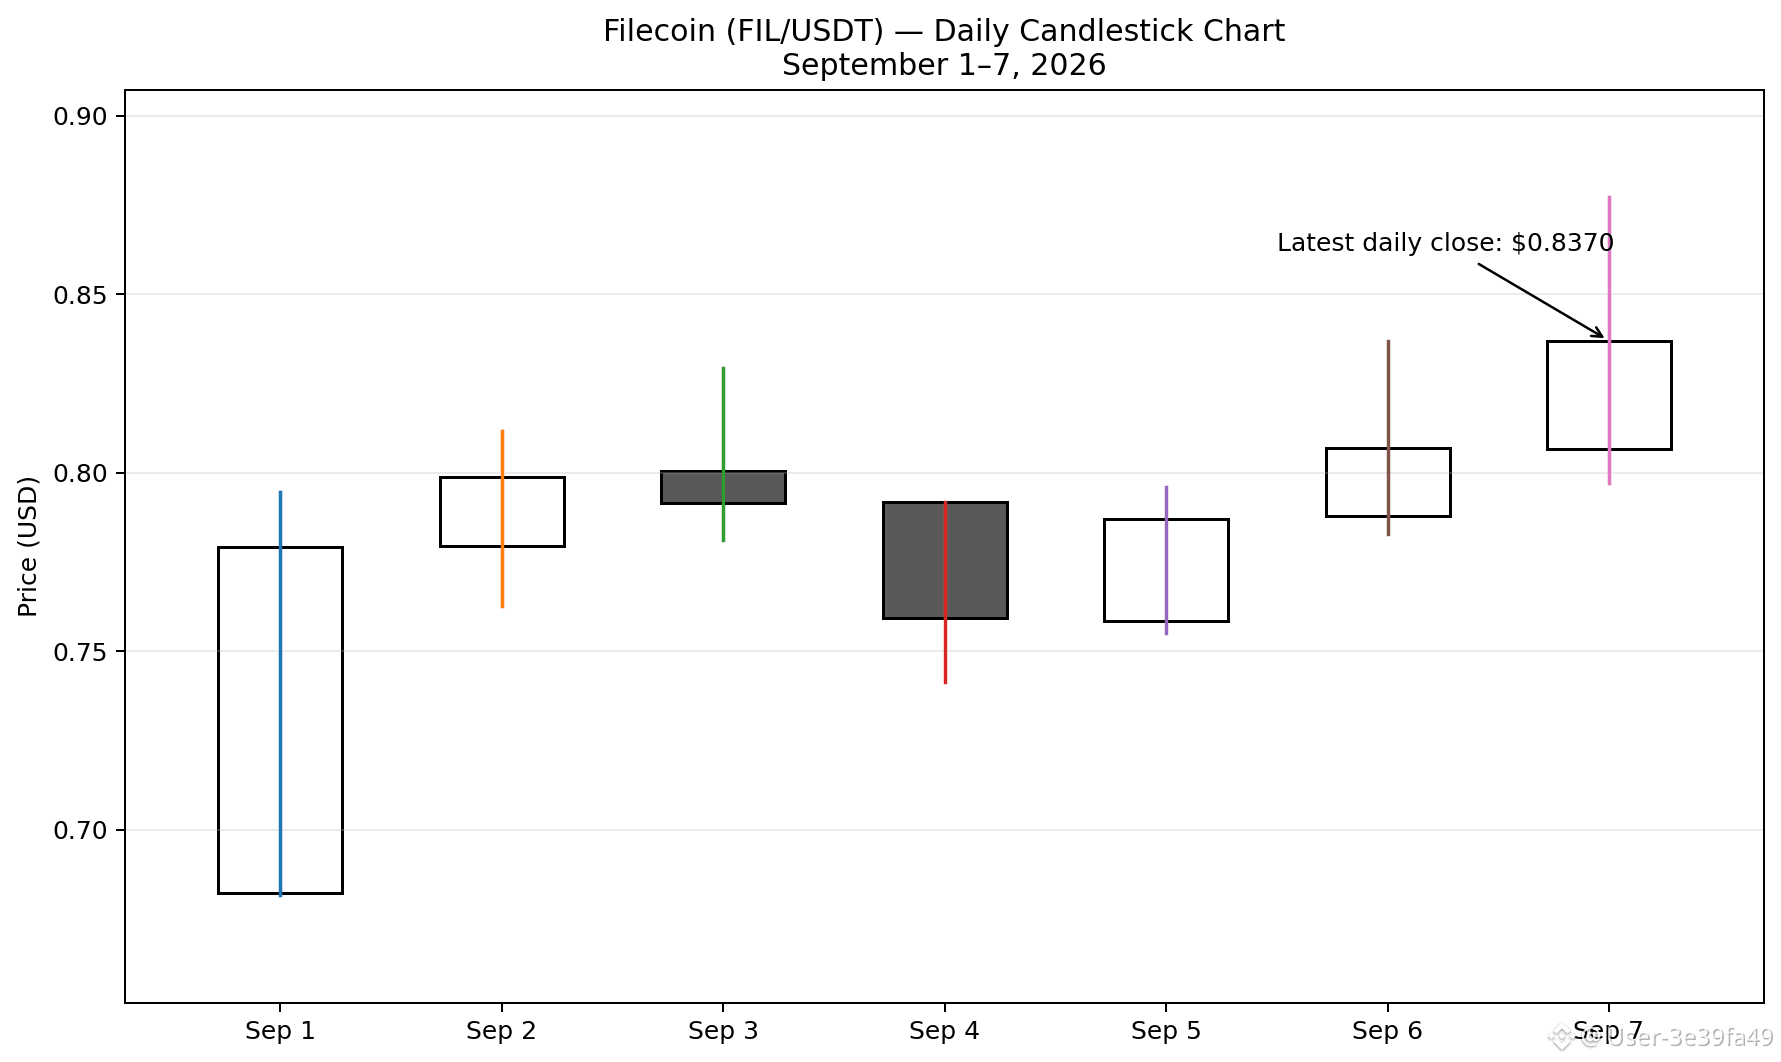
$FIL کے لیے දළ වශයෙන් $0.84–$0.85
වෙළඳපල ප්රාග්ධනය: දළ වශයෙන් $0.69–$0.70 බිලියන
පසුගිය පැය 24 වോളියම: දළ වශයෙන් $140–$155 මිලියන
වෙළඳපල දැක්ම:
FIL පසුගිය කාලයේ දැඩි කෙටි කාලීන ප්රතිස්ථාපනයක් පෙන්වා ඇති අතර පසුගිය දින 7 තුළ දළ වශයෙන් 21% ක වර්ධනයක් ලබා ඇත.
නවතම ඉටිපන්දම් (candles) වැඩිවෙමින් ඇති bullish මොමෙන්ටම් එකක් පෙන්වයි; සැප්තැම්බර් 7 දින දෛනික ඉටිපන්දම ආසන්න වශයෙන් $0.837 දක්වා වසා දැමූ අතර එය $0.877 පමණට ළඟා විය.
ප්රතිරෝධය: ~$0.86–$0.88. මෙම කලාපය ඉක්මවා පැහැදිලි ලෙස බිඳී යාම bullish ගමන ශක්තිමත් කළ හැක.
සහාය: ~$0.81–$0.82. මෙම ප්රදේශය අහිමි වුවහොත් ~$0.79 වෙත පසුබැසීමක් සිදුවිය හැක.
මුළුමනින්ම, කෙටි කාලීන මොමෙන්ටම් එක bullish වේ; නමුත් FIL තවමත් ඉතා අස්ථාවර (highly volatile) වන අතර තම ඓතිහාසික ඉහළම මට්ටමෙන් තව බොහෝ දුරින් පවතී.
#FILUSDT #bitcoin #CanadaToImpose15%To50%TariffsOnUSGoods #SaudiHaltsSouthernEnergySitesAfterAttacks #IMFSaysElSalvadorBTCNoPublicFunds
වෙළඳපල ප්රාග්ධනය: දළ වශයෙන් $0.69–$0.70 බිලියන
පසුගිය පැය 24 වോളියම: දළ වශයෙන් $140–$155 මිලියන
වෙළඳපල දැක්ම:
FIL පසුගිය කාලයේ දැඩි කෙටි කාලීන ප්රතිස්ථාපනයක් පෙන්වා ඇති අතර පසුගිය දින 7 තුළ දළ වශයෙන් 21% ක වර්ධනයක් ලබා ඇත.
නවතම ඉටිපන්දම් (candles) වැඩිවෙමින් ඇති bullish මොමෙන්ටම් එකක් පෙන්වයි; සැප්තැම්බර් 7 දින දෛනික ඉටිපන්දම ආසන්න වශයෙන් $0.837 දක්වා වසා දැමූ අතර එය $0.877 පමණට ළඟා විය.
ප්රතිරෝධය: ~$0.86–$0.88. මෙම කලාපය ඉක්මවා පැහැදිලි ලෙස බිඳී යාම bullish ගමන ශක්තිමත් කළ හැක.
සහාය: ~$0.81–$0.82. මෙම ප්රදේශය අහිමි වුවහොත් ~$0.79 වෙත පසුබැසීමක් සිදුවිය හැක.
මුළුමනින්ම, කෙටි කාලීන මොමෙන්ටම් එක bullish වේ; නමුත් FIL තවමත් ඉතා අස්ථාවර (highly volatile) වන අතර තම ඓතිහාසික ඉහළම මට්ටමෙන් තව බොහෝ දුරින් පවතී.
#FILUSDT #bitcoin #CanadaToImpose15%To50%TariffsOnUSGoods #SaudiHaltsSouthernEnergySitesAfterAttacks #IMFSaysElSalvadorBTCNoPublicFunds
පරිවර්තනය බලන්න
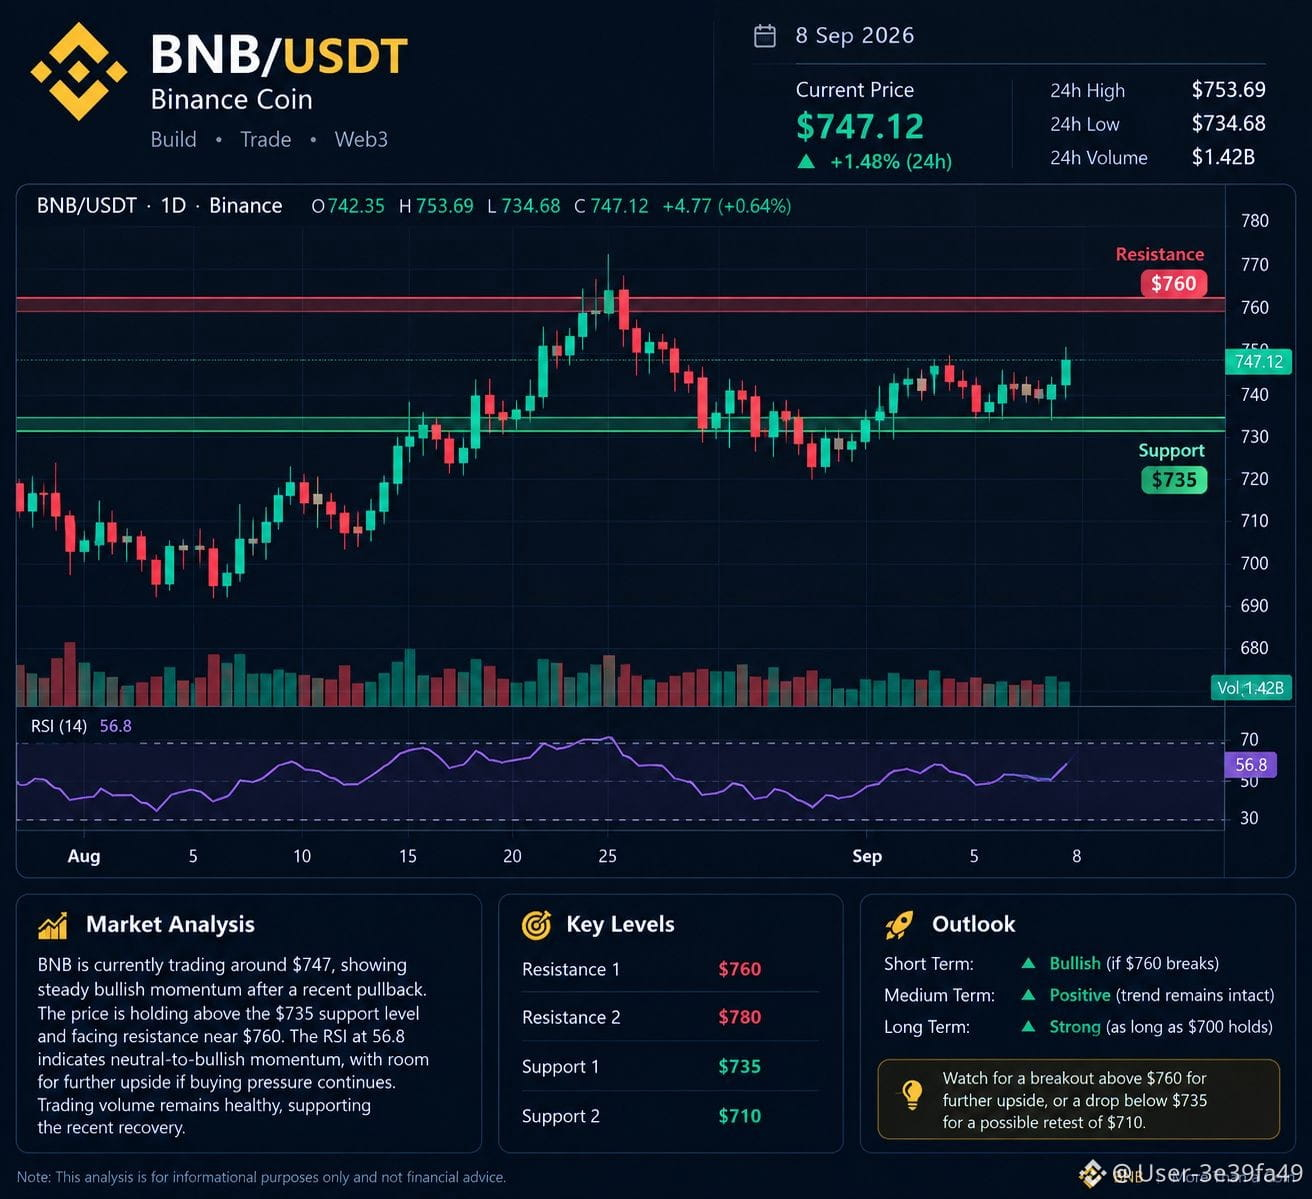
$BNB is currently around $748, with intraday trading roughly between $735–$754. Recent momentum remains positive, although the price is volatile after its strong early-September rally.
Technical view:
🟢 Trend: Bullish / positive momentum
🛡️ Support: $720–$735
🔥 Resistance: $760
🚀 Breakout above $760: Could open the way toward $800–$825
⚠️ Below $720: Risk of a deeper correction toward $685–$700
BNB's moving averages are currently bullish, with the 5-, 20-, 50-, 100- and 200-day averages all indicating bullish conditions.
🟢 Bullish, but cautious. A confirmed daily close above $760 with strong volume would strengthen the bullish setup. Failure to hold the $720–$735 area could lead to profit-taking.#YenBreaks155NearingYearHigh #BNB_Market_Update #ZcashRises45%WeeklyToHighestSince2016
Technical view:
🟢 Trend: Bullish / positive momentum
🛡️ Support: $720–$735
🔥 Resistance: $760
🚀 Breakout above $760: Could open the way toward $800–$825
⚠️ Below $720: Risk of a deeper correction toward $685–$700
BNB's moving averages are currently bullish, with the 5-, 20-, 50-, 100- and 200-day averages all indicating bullish conditions.
🟢 Bullish, but cautious. A confirmed daily close above $760 with strong volume would strengthen the bullish setup. Failure to hold the $720–$735 area could lead to profit-taking.#YenBreaks155NearingYearHigh #BNB_Market_Update #ZcashRises45%WeeklyToHighestSince2016
පරිවර්තනය බලන්න
$ETH
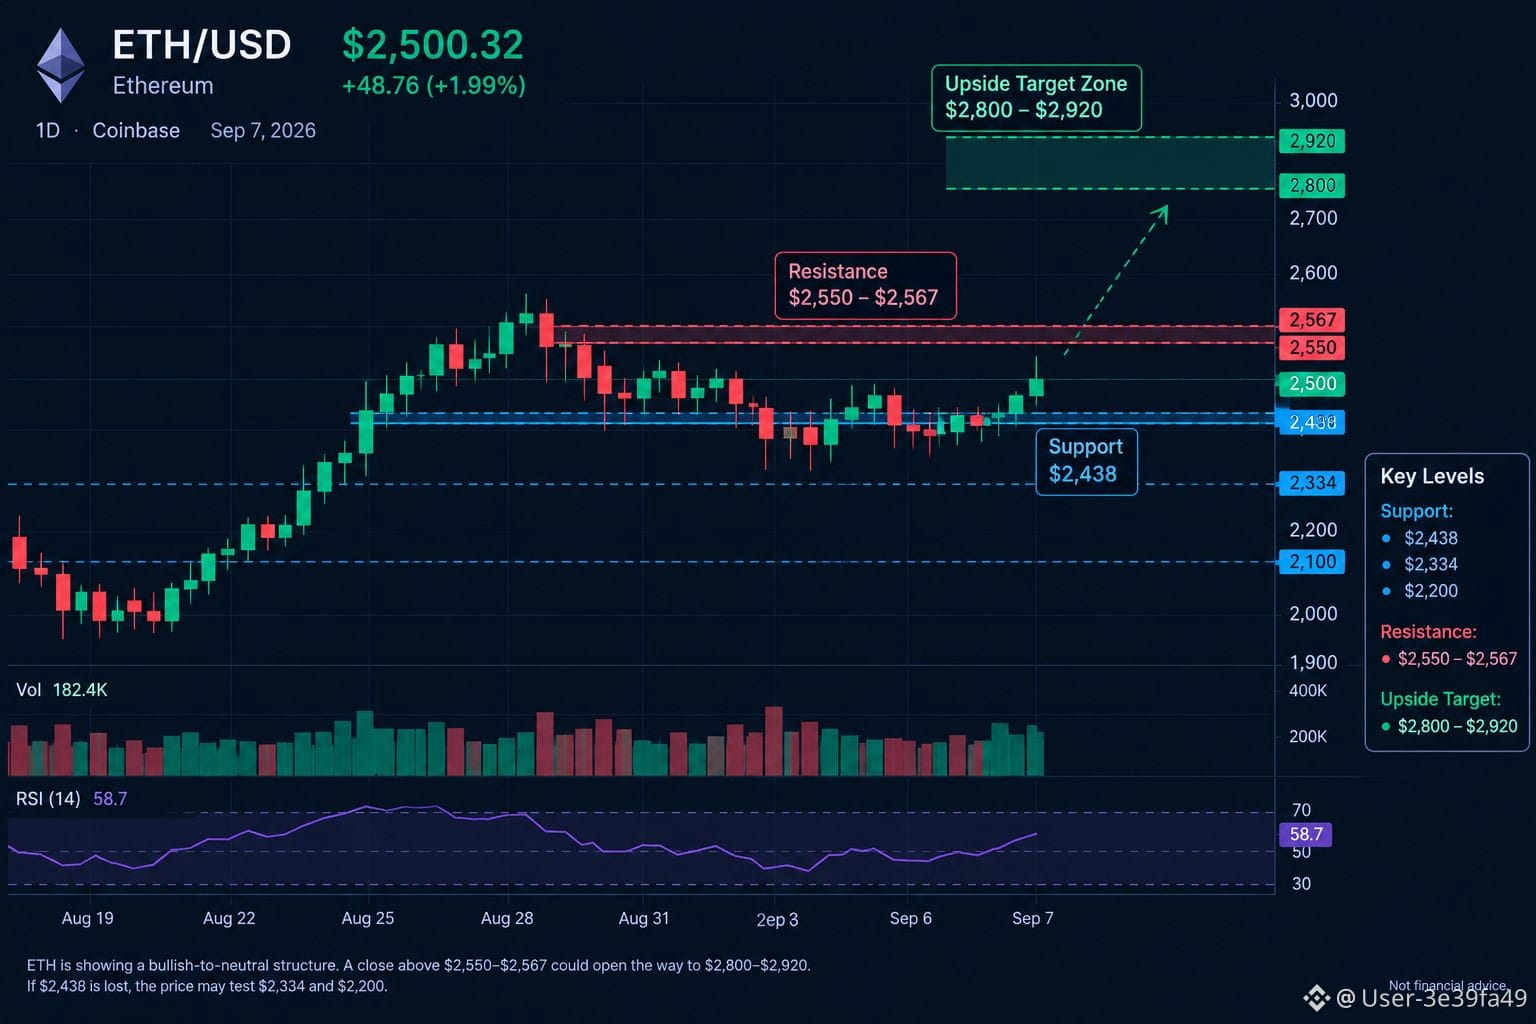
is showing a bullish-to-neutral short-term structure. ETH is currently around $2,500, after recovering strongly from the August breakout. Recent analysis puts $2,440–$2,480 as an important support area, while $2,550–$2,600 is the key resistance zone.
Key levels:
🟢 Support: $2,440 → $2,334 → $2,200
🔴 Resistance: $2,550 → $2,600
🚀 Bullish target: $2,800–$2,920 if ETH breaks and holds above resistance.
⚠️ Bearish scenario: A sustained break below $2,440 could expose $2,220 and potentially $2,000.
Overall, ETH looks cautiously bullish, but confirmation above $2,550–$2,600 would make the upside setup stronger.#ETHETFsApproved #ETHERİUM #IranSaysItHit3USShips3Tankers
is showing a bullish-to-neutral short-term structure. ETH is currently around $2,500, after recovering strongly from the August breakout. Recent analysis puts $2,440–$2,480 as an important support area, while $2,550–$2,600 is the key resistance zone.
Key levels:
🟢 Support: $2,440 → $2,334 → $2,200
🔴 Resistance: $2,550 → $2,600
🚀 Bullish target: $2,800–$2,920 if ETH breaks and holds above resistance.
⚠️ Bearish scenario: A sustained break below $2,440 could expose $2,220 and potentially $2,000.
Overall, ETH looks cautiously bullish, but confirmation above $2,550–$2,600 would make the upside setup stronger.#ETHETFsApproved #ETHERİUM #IranSaysItHit3USShips3Tankers
පරිවර්තනය බලන්න
$LINK
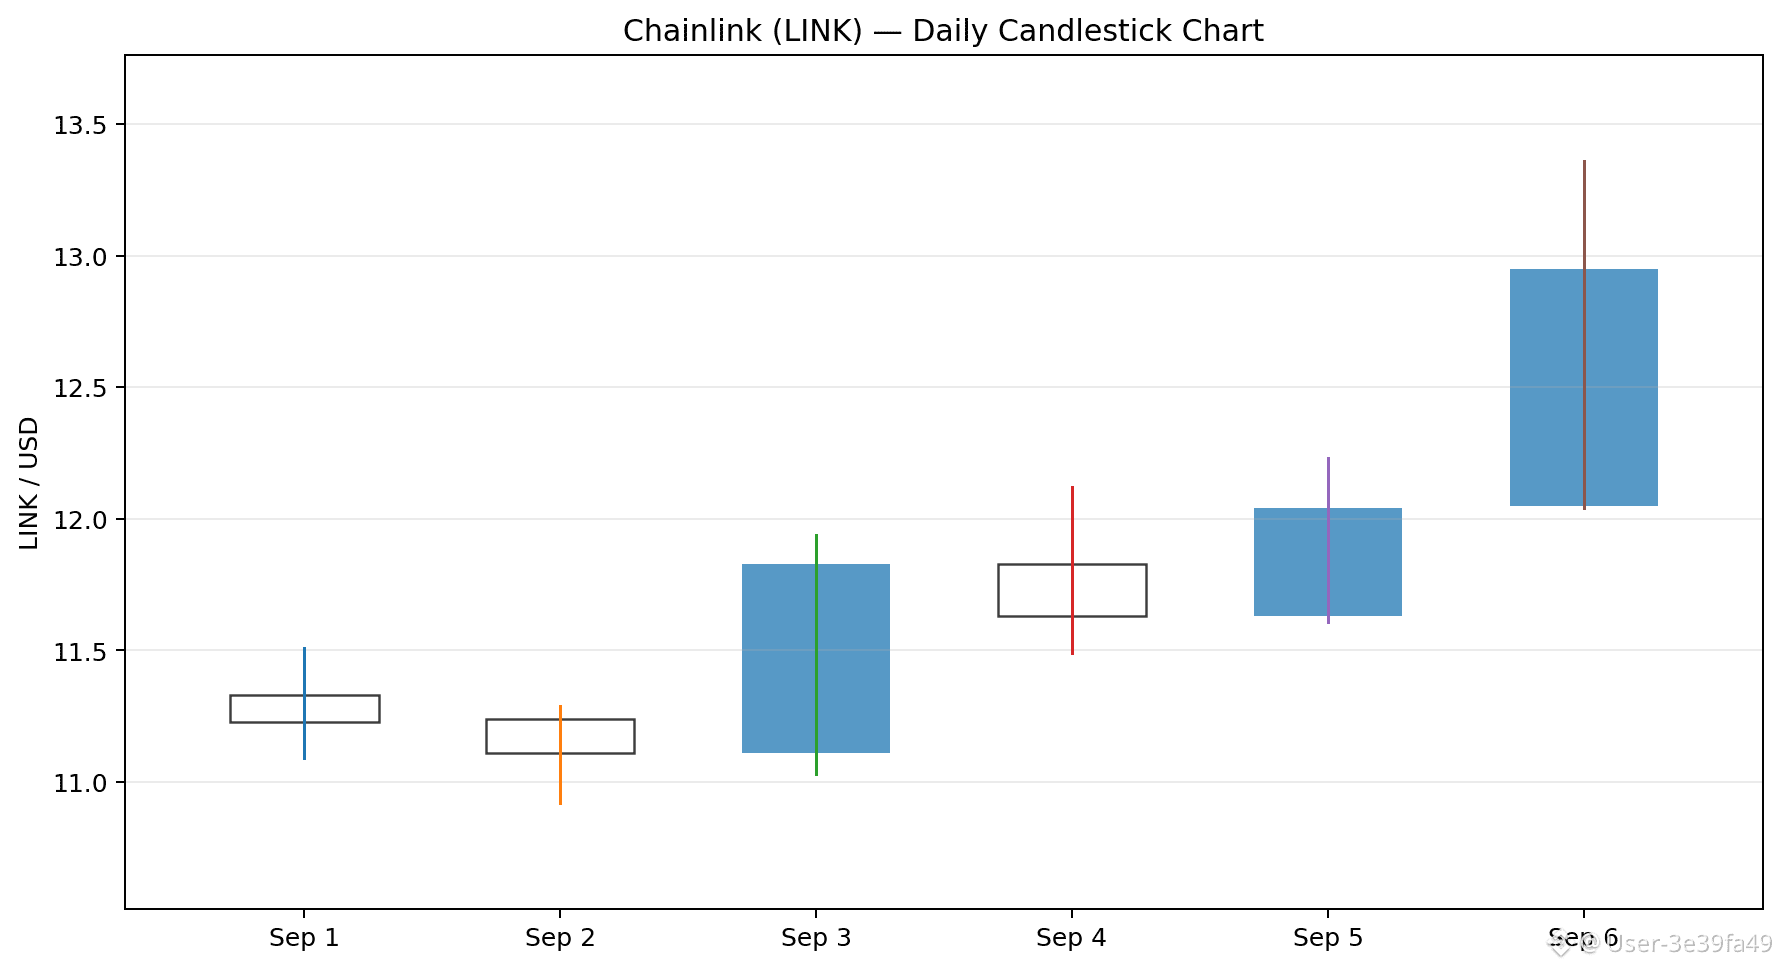
$ is trading around $13, after a strong move from roughly $11.1–$11.3 at the start of September. On Sept. 6, LINK reached an intraday high around $13.36, showing renewed bullish momentum.
Technical outlook:
🟢 Bullish: A sustained move above $13.30–$13.50 could open the way toward $14.50–$15.00.
🟡 Support: The first important zone is around $12.00–$12.20, followed by $11.00–$11.30.
🔴 A break below $11 could weaken the short-term bullish setup.
Fundamentals: Chainlink's outlook remains interesting because LINK powers payments, network security and incentives within the Chainlink ecosystem. Chainlink reports more than $33T in cumulative transaction value enabled, while CCIP adoption continues to expand.
Future outlook
If the broader crypto market remains bullish and Chainlink continues gaining adoption in DeFi, cross-chain infrastructure and institutional finance, LINK could have strong long-term potential. Chainlink also reported significant CCIP growth, including 78% quarter-over-quarter transfer-volume growth in Q1 2026.
My scenario:
Short term: Bullish above $12
Medium term: $15–$20 possible if momentum continues
Strong crypto bull markyet: $20+ is possible, but this is a speculative scenario, not a guaranteed target.
#LINK #USStrikesIranTankersTehranRestrictsHormuz #ChainlinkUpdate
$ is trading around $13, after a strong move from roughly $11.1–$11.3 at the start of September. On Sept. 6, LINK reached an intraday high around $13.36, showing renewed bullish momentum.
Technical outlook:
🟢 Bullish: A sustained move above $13.30–$13.50 could open the way toward $14.50–$15.00.
🟡 Support: The first important zone is around $12.00–$12.20, followed by $11.00–$11.30.
🔴 A break below $11 could weaken the short-term bullish setup.
Fundamentals: Chainlink's outlook remains interesting because LINK powers payments, network security and incentives within the Chainlink ecosystem. Chainlink reports more than $33T in cumulative transaction value enabled, while CCIP adoption continues to expand.
Future outlook
If the broader crypto market remains bullish and Chainlink continues gaining adoption in DeFi, cross-chain infrastructure and institutional finance, LINK could have strong long-term potential. Chainlink also reported significant CCIP growth, including 78% quarter-over-quarter transfer-volume growth in Q1 2026.
My scenario:
Short term: Bullish above $12
Medium term: $15–$20 possible if momentum continues
Strong crypto bull markyet: $20+ is possible, but this is a speculative scenario, not a guaranteed target.
#LINK #USStrikesIranTankersTehranRestrictsHormuz #ChainlinkUpdate
පරිවර්තනය බලන්න
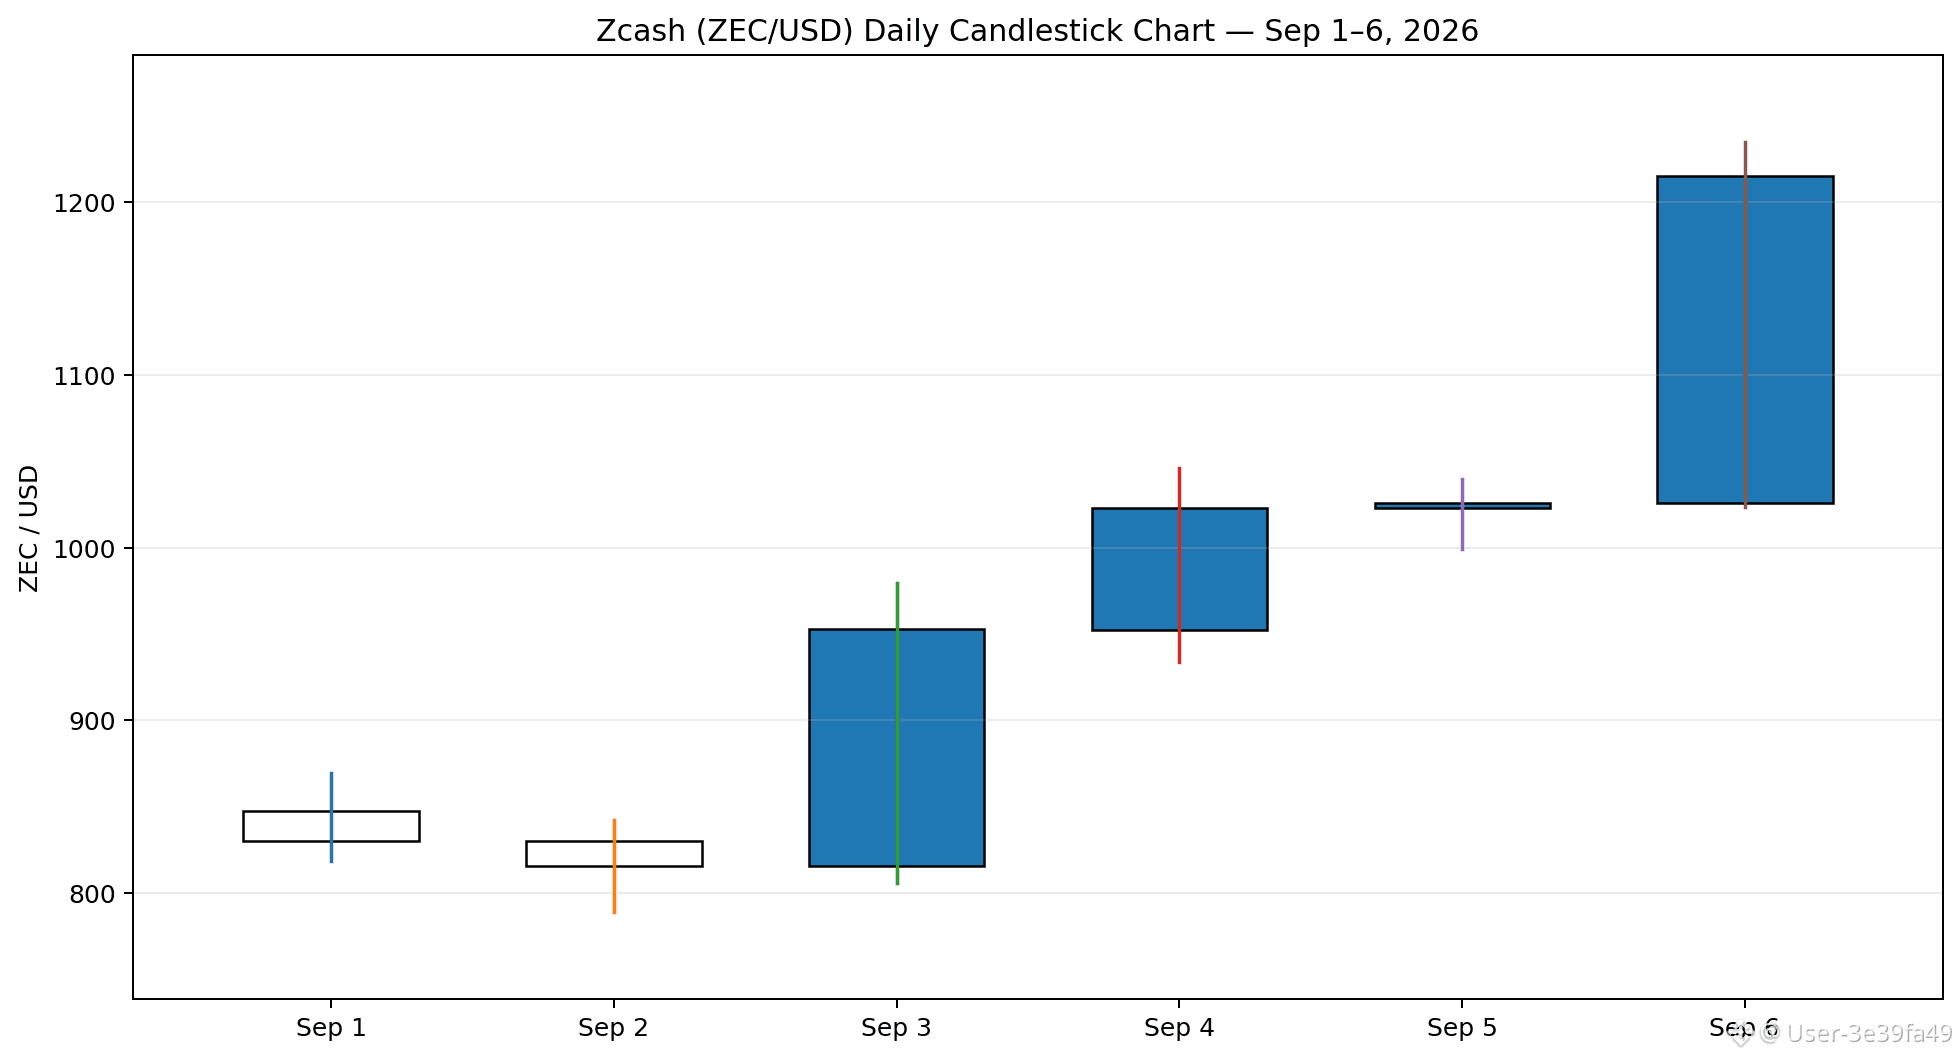
$ZEC is showing very strong bullish momentum. As of September 7, 2026, it is trading around $1,200–$1,230, after rising sharply from around $830 at the start of September. Recent 7-day performance is roughly +45%, with trading volume also elevated.
🟢 Trend: Strong bullish
🔥 Momentum: Very high; risk of short-term correction is increasing
📈 Resistance: ~$1,250, followed by ~$1,400–$1,500
🛡️ Support: ~$1,020–$1,050, then ~$950
⚠️ A break below $1,000 could lead to a deeper pullback.
Zcash's privacy technology and renewed market interest are major positives. Its maximum supply is capped at 21 million ZEC, which also gives it a scarcity narrative.
🔮 Future outlook
These are scenario estimates, not guaranteed prices:
Scenario Possible ZEC range
🐻 Bearish correction $800–$950
🟡 Normal bullish continuation $1,300–$1,600
🟢 Strong bull market $1,800–$2,500+
🚀 Extreme hype/altseason $3,000+
My short-term bias: Bullish, but after such a rapid move, I would expect volatility and possible profit-taking before another major leg higher.
#zec #IMFSaysElSalvadorBTCNoPublicFunds #SideSwapSuspendsLiquidServices #ZECUSDT
🟢 Trend: Strong bullish
🔥 Momentum: Very high; risk of short-term correction is increasing
📈 Resistance: ~$1,250, followed by ~$1,400–$1,500
🛡️ Support: ~$1,020–$1,050, then ~$950
⚠️ A break below $1,000 could lead to a deeper pullback.
Zcash's privacy technology and renewed market interest are major positives. Its maximum supply is capped at 21 million ZEC, which also gives it a scarcity narrative.
🔮 Future outlook
These are scenario estimates, not guaranteed prices:
Scenario Possible ZEC range
🐻 Bearish correction $800–$950
🟡 Normal bullish continuation $1,300–$1,600
🟢 Strong bull market $1,800–$2,500+
🚀 Extreme hype/altseason $3,000+
My short-term bias: Bullish, but after such a rapid move, I would expect volatility and possible profit-taking before another major leg higher.
#zec #IMFSaysElSalvadorBTCNoPublicFunds #SideSwapSuspendsLiquidServices #ZECUSDT
පරිවර්තනය බලන්න
$BTC
is trading around $79.6K–$80K. After a strong rally toward $82K, Bitcoin has pulled back slightly and is currently consolidating around the $80K area.
📊 Key Levels
🟢 Support: $79K → $75.7K → $71.8K
🔴 Resistance: $82K–$82.8K
🚀 Bullish breakout: A strong daily close above ~$82.8K could open the path toward $85K–$90K.
⚠️ Bearish warning: Losing $75.7K would weaken the current bullish setup.
🔥 What's Driving BTC?
Bitcoin's recent rally was supported by improving risk sentiment and expectations around U.S. monetary policy. However, stronger-than-expected U.S. jobs data has increased uncertainty about the Federal Reserve's next move.
The September 11 U.S. CPI report is now one of the biggest near-term catalysts. Lower inflation could support BTC, while hotter inflation could pressure risk assets.
#USAugustNonfarmPayrollsDueToday #USAugustAvgHourlyEarningsRise3.1% #BitcoinETFsBiggestDailyInflowSinceJanuary
is trading around $79.6K–$80K. After a strong rally toward $82K, Bitcoin has pulled back slightly and is currently consolidating around the $80K area.
📊 Key Levels
🟢 Support: $79K → $75.7K → $71.8K
🔴 Resistance: $82K–$82.8K
🚀 Bullish breakout: A strong daily close above ~$82.8K could open the path toward $85K–$90K.
⚠️ Bearish warning: Losing $75.7K would weaken the current bullish setup.
🔥 What's Driving BTC?
Bitcoin's recent rally was supported by improving risk sentiment and expectations around U.S. monetary policy. However, stronger-than-expected U.S. jobs data has increased uncertainty about the Federal Reserve's next move.
The September 11 U.S. CPI report is now one of the biggest near-term catalysts. Lower inflation could support BTC, while hotter inflation could pressure risk assets.
#USAugustNonfarmPayrollsDueToday #USAugustAvgHourlyEarningsRise3.1% #BitcoinETFsBiggestDailyInflowSinceJanuary
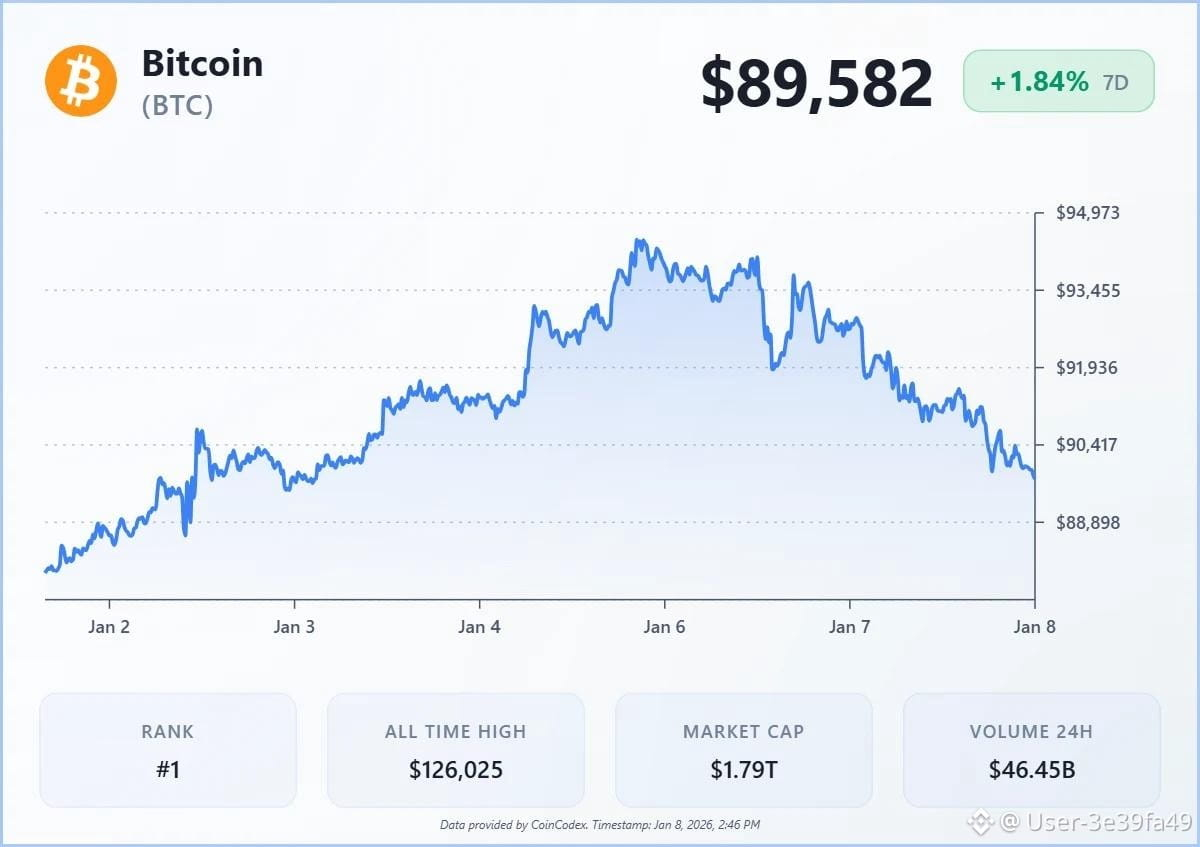
සැප්තැම්බර් 6, 2026 වනදා වනවිට ඩොලර් $79,900ක් පමණ වූ වත්මන් මිල.
වෙළඳපොළ දැක්ම: 📈 පරිස්සමෙන් බලාපොරොත්තු සහිත (Cautiously bullish)
$BTC මෑතකදී දැඩි ලෙස ඉහළ ගොස් ප්රධාන චලිත සාමාන්යයන් මතින් ගොස්, කෙටි කාලීන ප්රවණතාවය වැඩිදියුණු කර ඇත.
සහාය: ඩොලර් $79,000–$75,000 පමණ.
ප්රතිරෝධය: ඩොලර් $82,000–$83,000, ඉන්පසු ඩොලර් $85,000–$90,000.
$83K–$85K මතින් ස්ථාවරව කැඩීමක් (break) සිදුවේ නම්, බලාපොරොත්තු සහිත ගමන ශක්තිමත් විය හැක.
BTC $75K අහිමි කළහොත්, එම බලාපොරොත්තු සහිත සැකසුම දුර්වල වන අතර ගැඹුරු සංශෝධනයක් (correction) අනුගමනය විය හැක.
සැප්තැම්බර් 11 වෙනිදා එන එක්සත් ජනපද CPI උද්ධමන වාර්තාව බිට්කොයින් සඳහා වැදගත් ළඟින්ම බලපාන හේතුවක් (near-term catalyst) වේ.
#RussiaUkraine72-hourCeasefire #ZECHitsANewAllTimeHigh #LululemonTumbles20%OnWeakGuidance #BitcoinETFsBiggestDailyInflowSinceJanuary
වෙළඳපොළ දැක්ම: 📈 පරිස්සමෙන් බලාපොරොත්තු සහිත (Cautiously bullish)
$BTC මෑතකදී දැඩි ලෙස ඉහළ ගොස් ප්රධාන චලිත සාමාන්යයන් මතින් ගොස්, කෙටි කාලීන ප්රවණතාවය වැඩිදියුණු කර ඇත.
සහාය: ඩොලර් $79,000–$75,000 පමණ.
ප්රතිරෝධය: ඩොලර් $82,000–$83,000, ඉන්පසු ඩොලර් $85,000–$90,000.
$83K–$85K මතින් ස්ථාවරව කැඩීමක් (break) සිදුවේ නම්, බලාපොරොත්තු සහිත ගමන ශක්තිමත් විය හැක.
BTC $75K අහිමි කළහොත්, එම බලාපොරොත්තු සහිත සැකසුම දුර්වල වන අතර ගැඹුරු සංශෝධනයක් (correction) අනුගමනය විය හැක.
සැප්තැම්බර් 11 වෙනිදා එන එක්සත් ජනපද CPI උද්ධමන වාර්තාව බිට්කොයින් සඳහා වැදගත් ළඟින්ම බලපාන හේතුවක් (near-term catalyst) වේ.
#RussiaUkraine72-hourCeasefire #ZECHitsANewAllTimeHigh #LululemonTumbles20%OnWeakGuidance #BitcoinETFsBiggestDailyInflowSinceJanuary
තවත් අන්තර්ගතයන් ගවේෂණය කිරීමට ඇතුල් වන්න