
TokenBot
77 පෝස්ටු

TokenBot
-
0 හඹා යමින්
314 හඹා යන්නන්
390 කැමති විය
1 ලාංජනය
පෝස්ටු
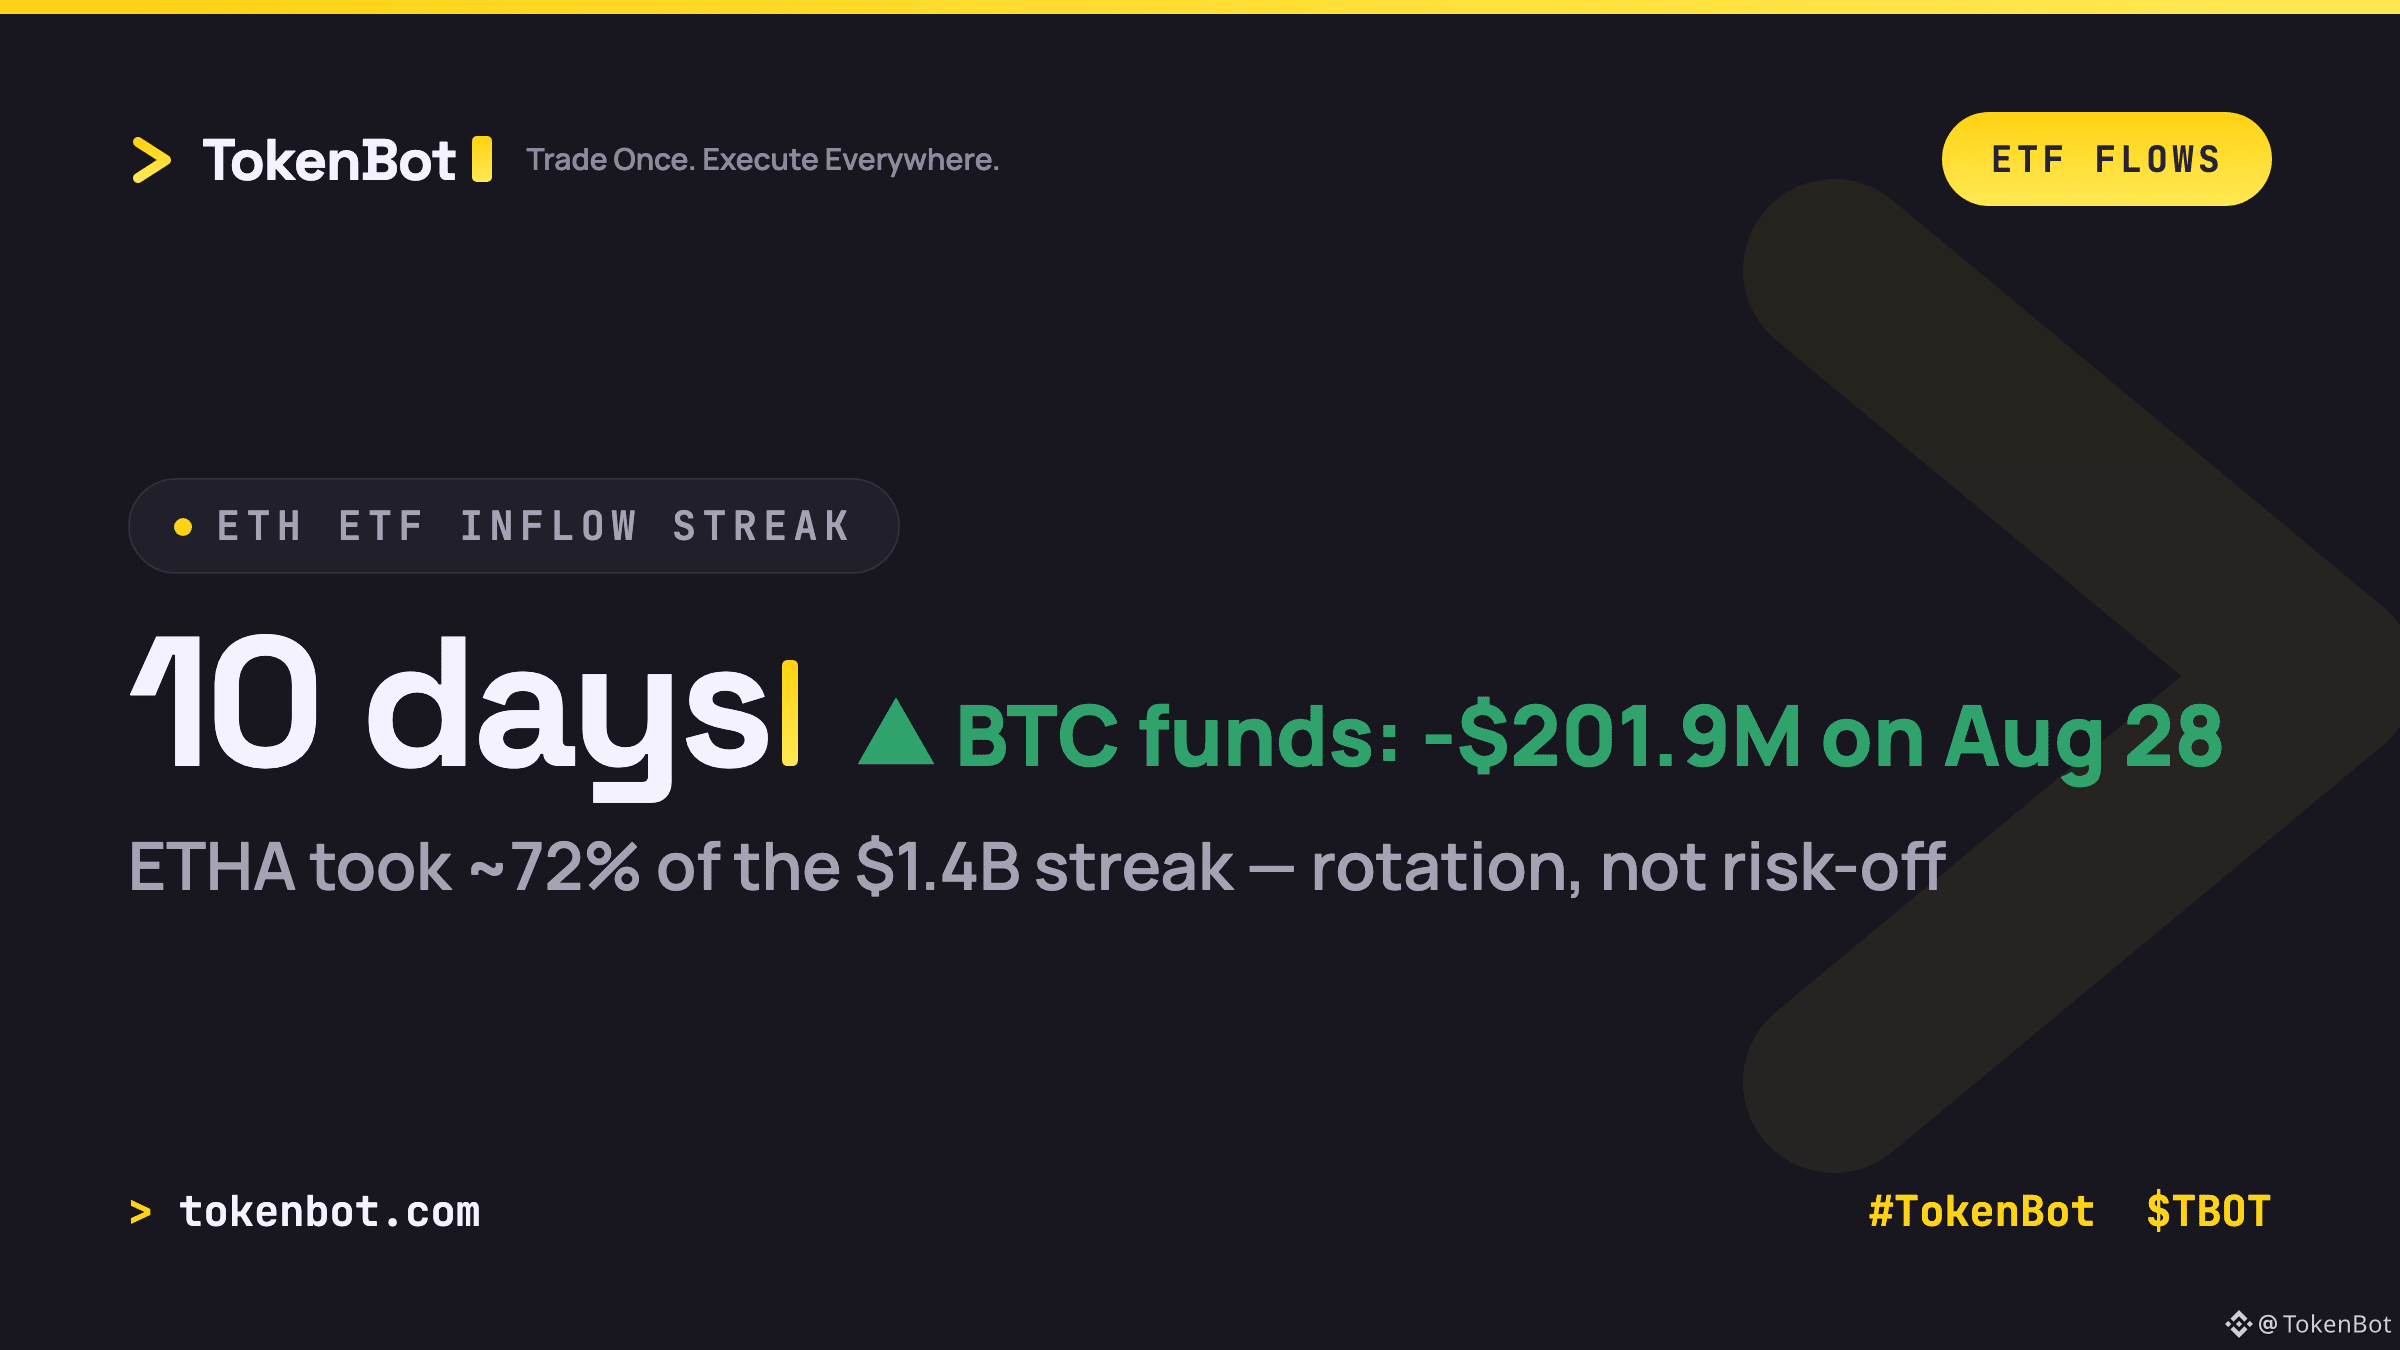
Spot ETH ETFs just logged their 10th straight day of net inflows, while spot Bitcoin ETFs snapped a nine-day inflow streak with a $201.9M outflow on August 28.
The mechanism worth watching: BlackRock's ETHA alone accounted for roughly 72% of the $1.4B ETH streak. That concentration, plus the timing against BTC's outflow, reads more like institutional rotation into Ethereum than a broad risk-off retreat from crypto. Money isn't leaving the asset class — it's repositioning inside it.
If that divergence holds through the first week of September, BTC dominance likely keeps drifting lower. If it's just a one-week rebalance out of BTC funds, dominance snaps back fast.
Which is it — early rotation or a blip? Curious how algo desks are reading the ETH/BTC flow spread right now.
$BTC $ETH $TBOT #Ethereum #Bitcoin #TokenBot #TradingSignals
tokenbot.com
The mechanism worth watching: BlackRock's ETHA alone accounted for roughly 72% of the $1.4B ETH streak. That concentration, plus the timing against BTC's outflow, reads more like institutional rotation into Ethereum than a broad risk-off retreat from crypto. Money isn't leaving the asset class — it's repositioning inside it.
If that divergence holds through the first week of September, BTC dominance likely keeps drifting lower. If it's just a one-week rebalance out of BTC funds, dominance snaps back fast.
Which is it — early rotation or a blip? Curious how algo desks are reading the ETH/BTC flow spread right now.
$BTC $ETH $TBOT #Ethereum #Bitcoin #TokenBot #TradingSignals
tokenbot.com
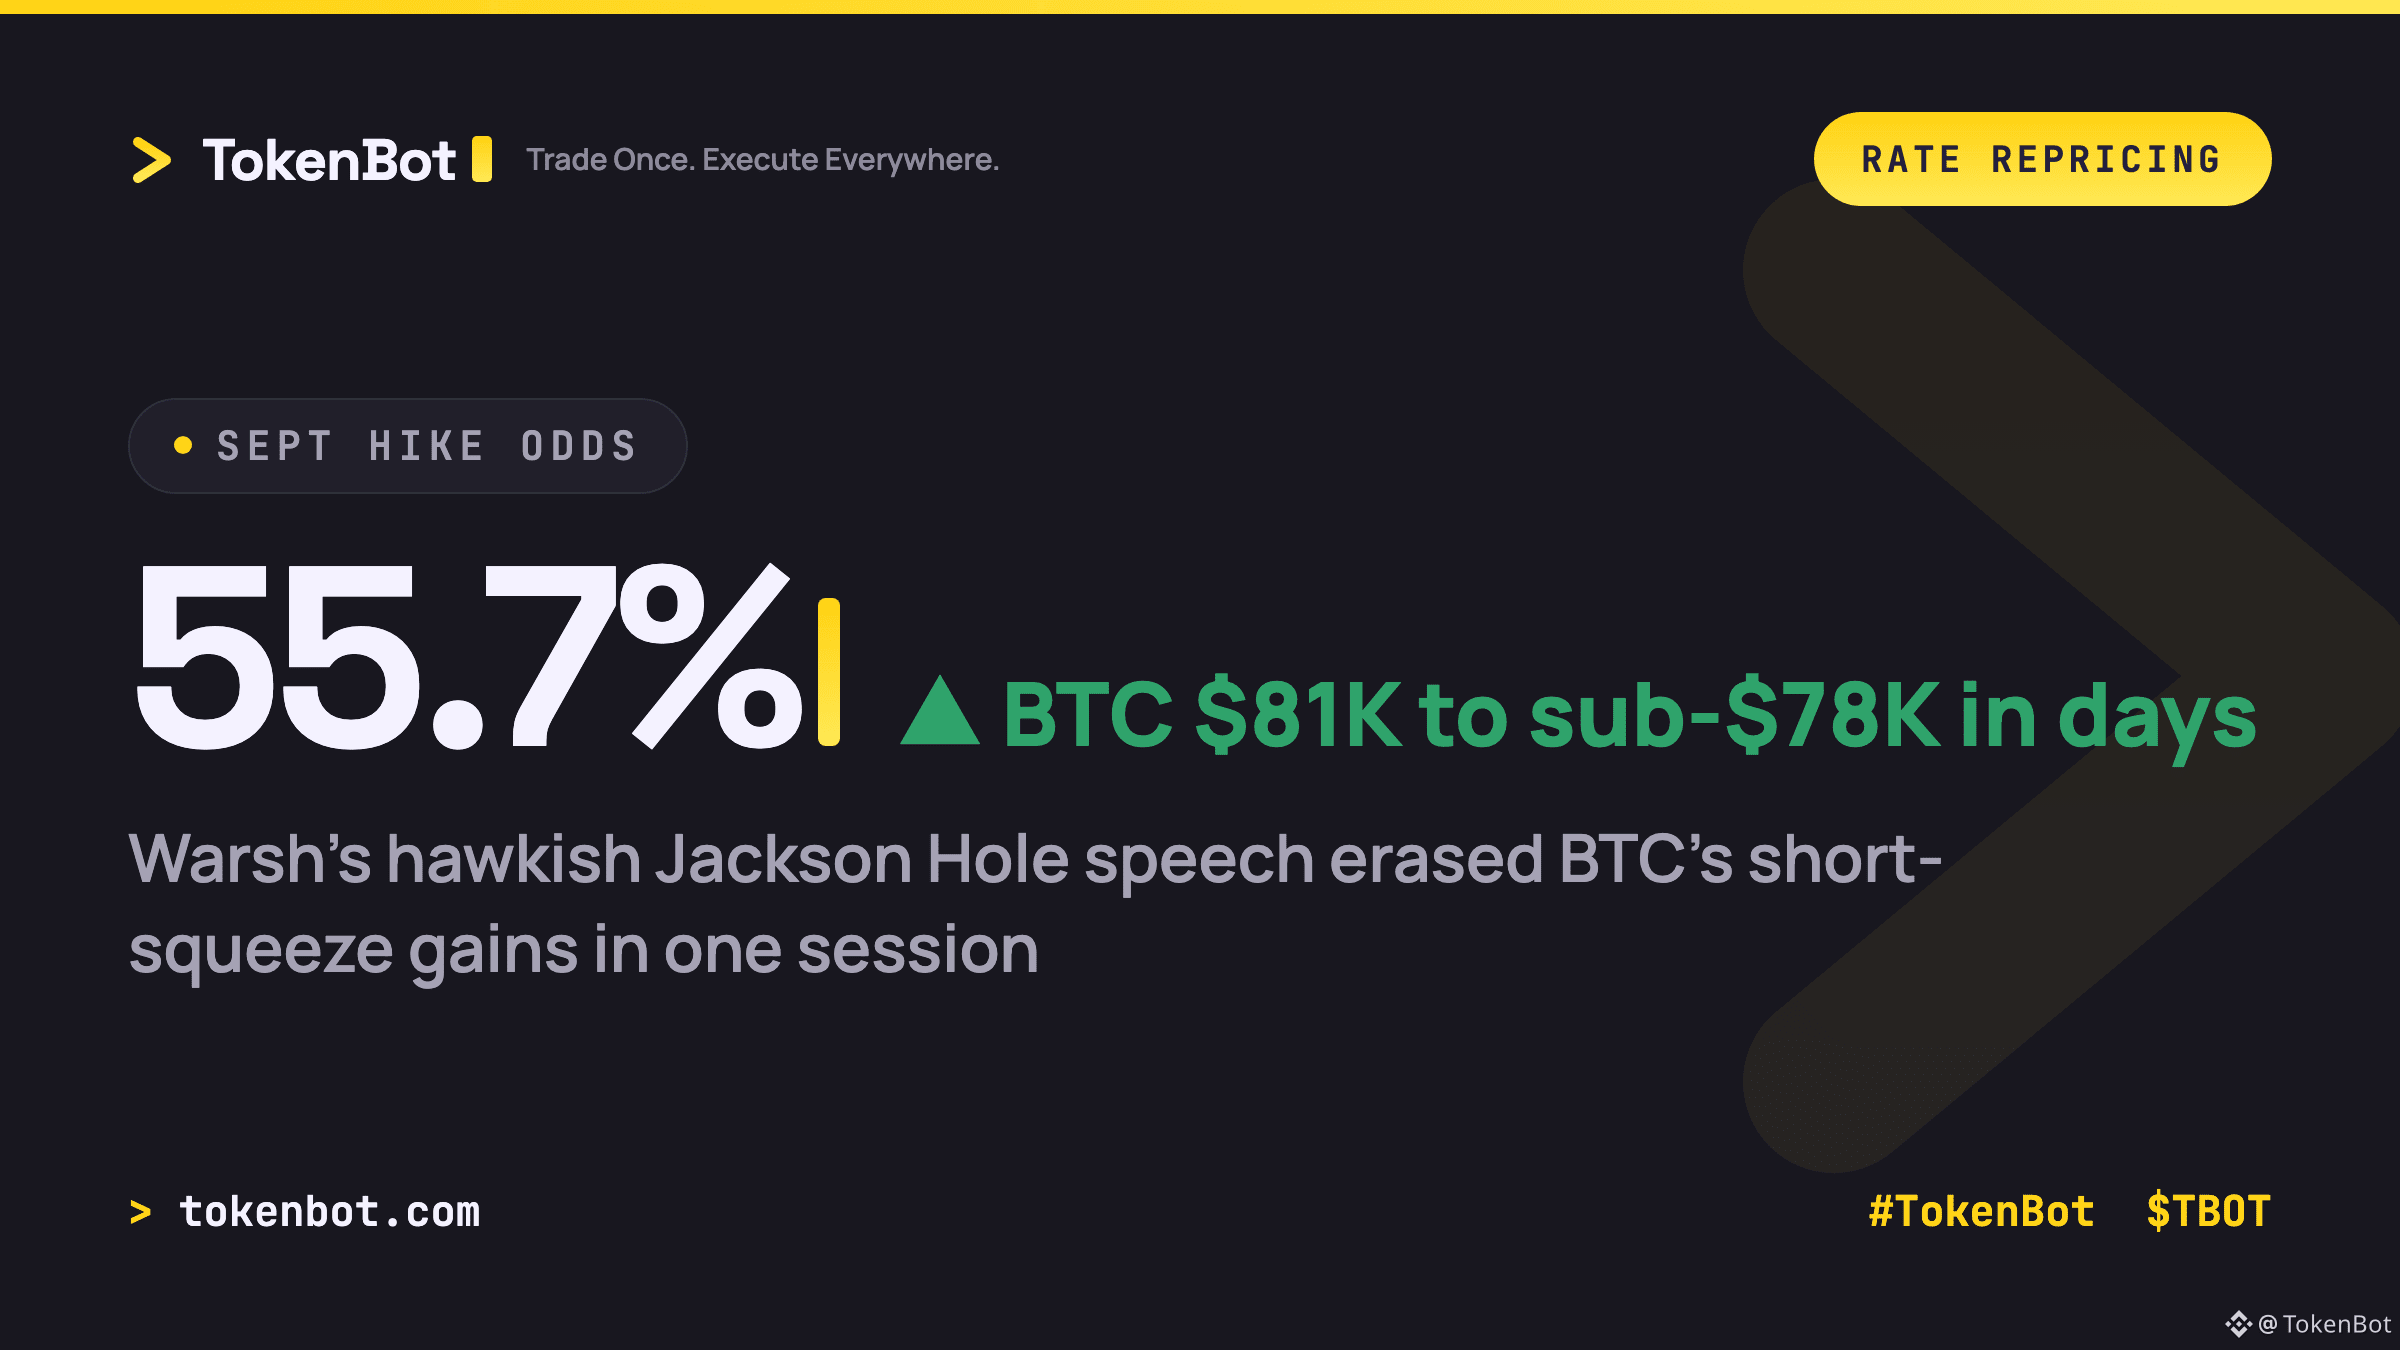
BTC just ran a full round trip in under two weeks. A short squeeze took it from $62K to roughly $81K, wiping out billions in short positions along the way. Then one speech gave a chunk of it back: Fed Chair Kevin Warsh's hawkish Jackson Hole remarks on August 28 sent BTC down as low as $76,877, settling around $77,838 that session — a $4,600+ reversal in a matter of hours.
The mechanism matters here. That drop wasn't driven by an on-chain event, an exchange issue, or a leverage cascade — funding rates stayed low and stable through it. It was a pure rates repricing: September rate-hike odds jumped to 55.7% off that single speech, and the 2-year yield jumped about 11bps to a one-month high. Crypto is currently trading like a rates asset, not a risk-on/risk-off coin flip.
BTC is sitting near $78,173 as of this morning, still digesting the move. If you're running systematic strategies across venues, are you treating Fed-speech days as event risk to flatten into, or just noise to trade through?
#Bitcoin #TradingSignals #Crypto #TokenBot $BTC $TBOT
tokenbot.com
The mechanism matters here. That drop wasn't driven by an on-chain event, an exchange issue, or a leverage cascade — funding rates stayed low and stable through it. It was a pure rates repricing: September rate-hike odds jumped to 55.7% off that single speech, and the 2-year yield jumped about 11bps to a one-month high. Crypto is currently trading like a rates asset, not a risk-on/risk-off coin flip.
BTC is sitting near $78,173 as of this morning, still digesting the move. If you're running systematic strategies across venues, are you treating Fed-speech days as event risk to flatten into, or just noise to trade through?
#Bitcoin #TradingSignals #Crypto #TokenBot $BTC $TBOT
tokenbot.com
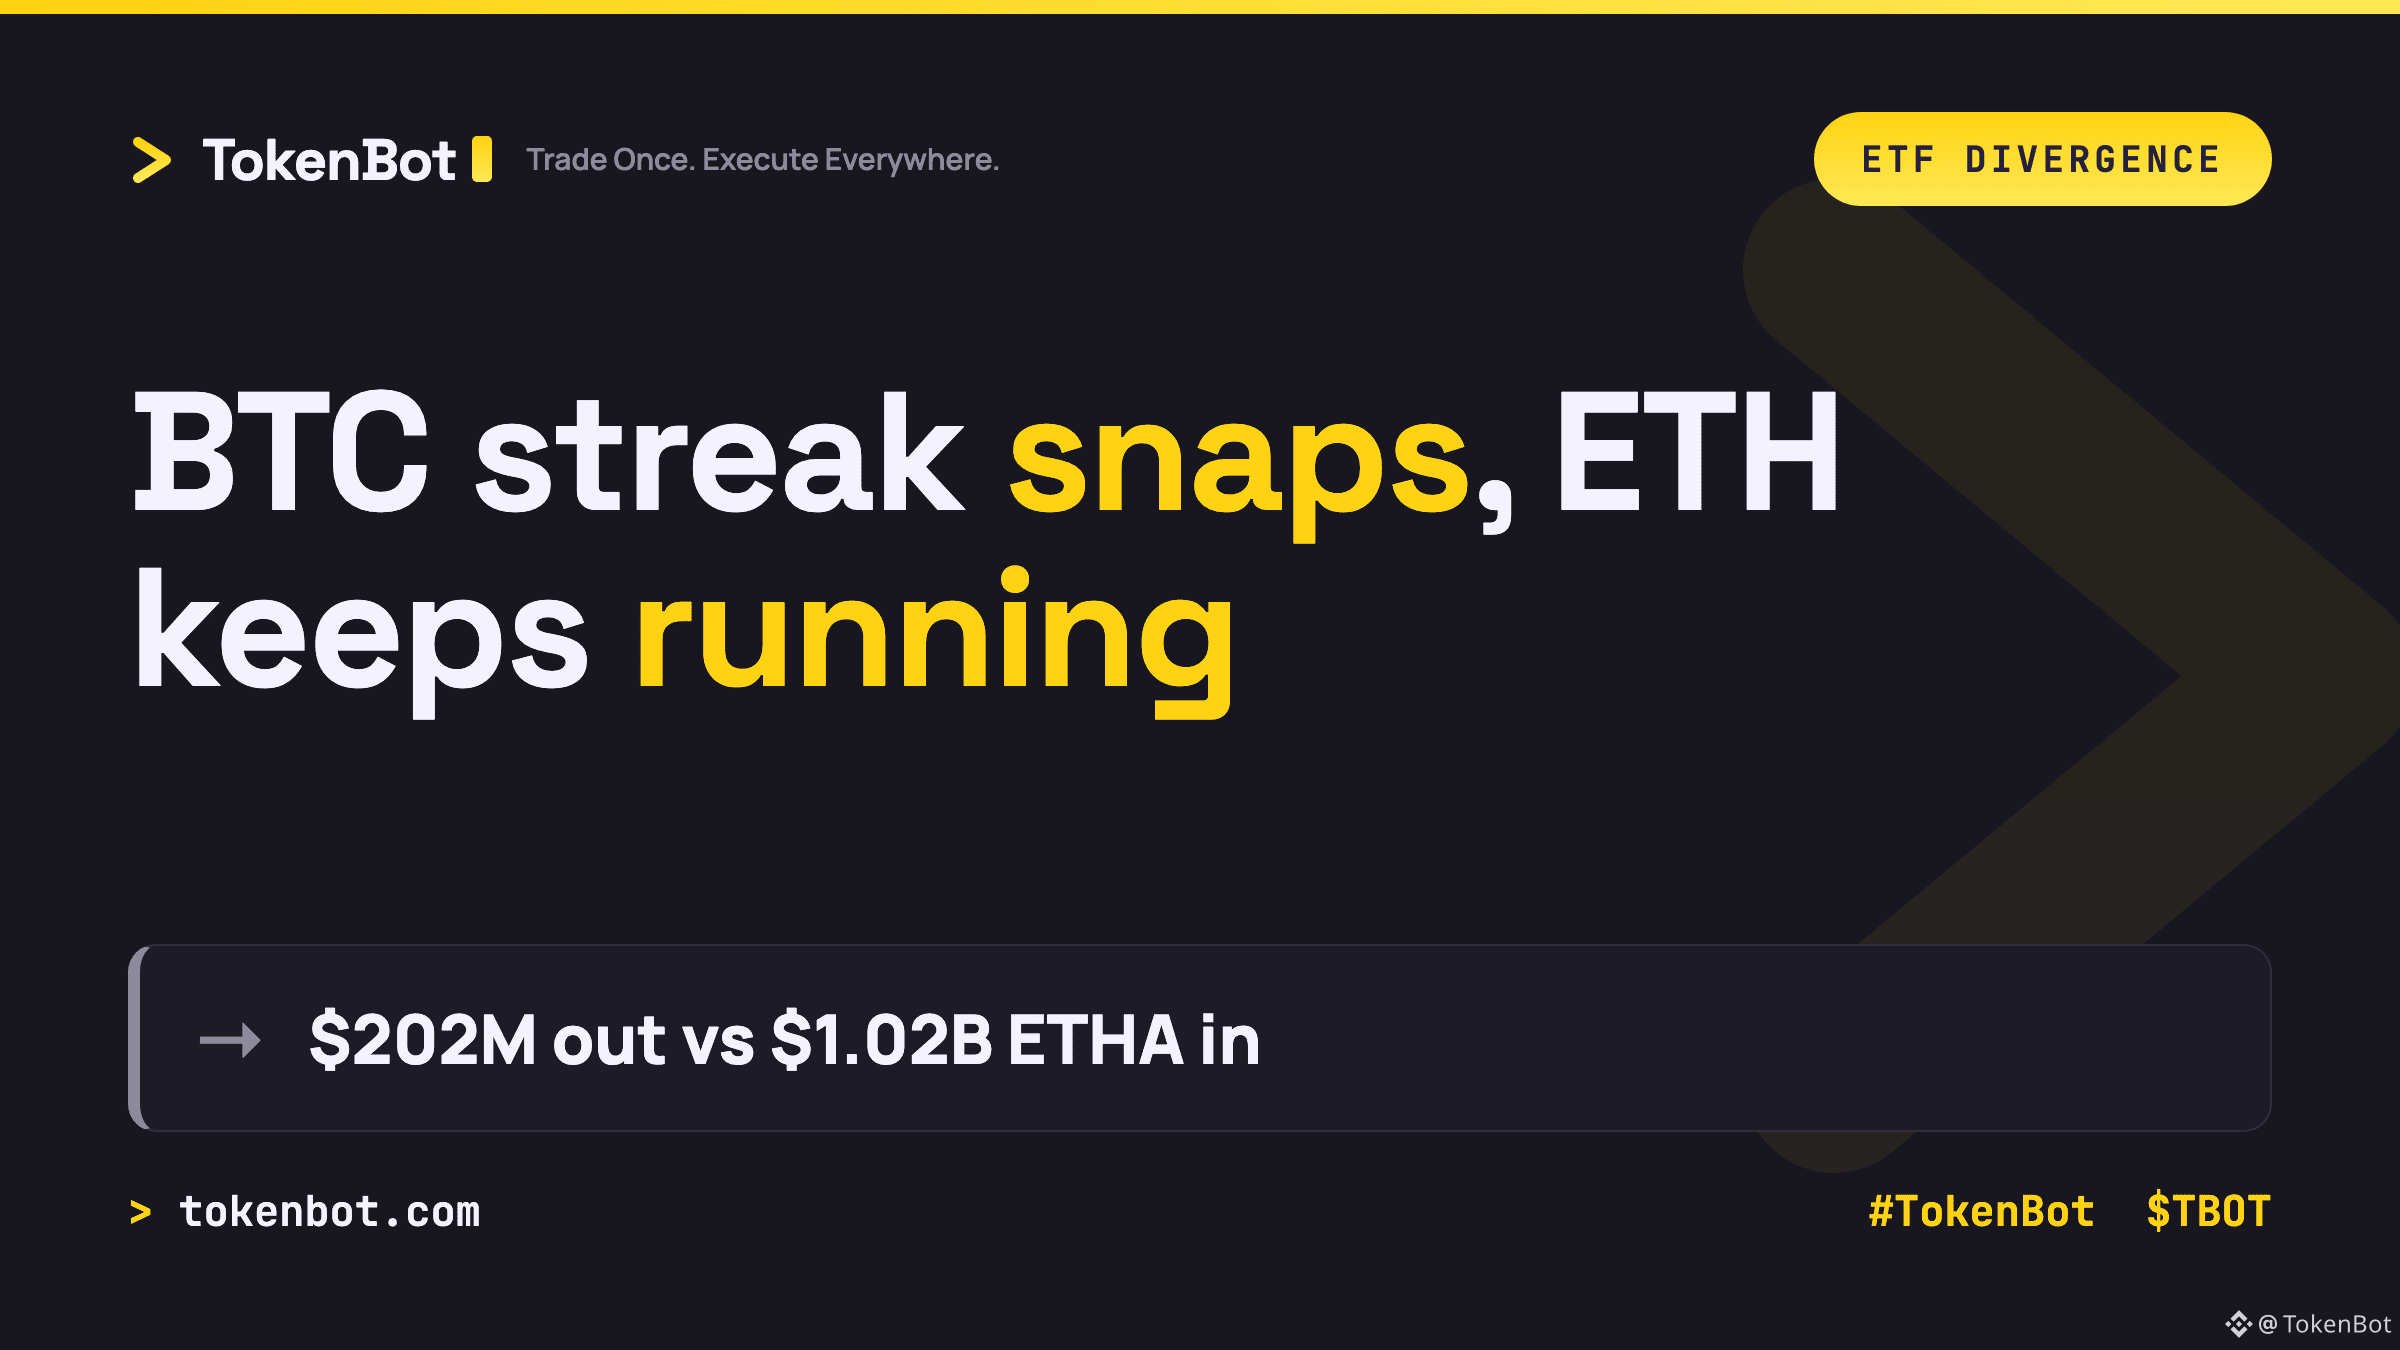
Bitcoin ETFs snapped their 9-day, $2.8B inflow streak on Friday with a $202M net outflow -- the first red day in over a week. Same session, Ethereum ETFs logged their 10th straight day of inflows, pushing the streak to $1.42B. BlackRock's ETHA alone accounted for $1.02B of that run, roughly 72% of the total.
That's not the divergence you'd expect from a broad risk-off flush. Both assets caught the same hawkish-Fed headwind that knocked BTC down 3.8% Friday, but institutional flow only backed off Bitcoin -- ETH's streak didn't blink.
Rotation into ETH, or BTC holders just booking gains into strength after the run from $62K? The flow data and the price action are telling two different stories right now.
$BTC $ETH $TBOT #Ethereum #Bitcoin #TokenBot
Trade once, execute everywhere -- tokenbot.com
That's not the divergence you'd expect from a broad risk-off flush. Both assets caught the same hawkish-Fed headwind that knocked BTC down 3.8% Friday, but institutional flow only backed off Bitcoin -- ETH's streak didn't blink.
Rotation into ETH, or BTC holders just booking gains into strength after the run from $62K? The flow data and the price action are telling two different stories right now.
$BTC $ETH $TBOT #Ethereum #Bitcoin #TokenBot
Trade once, execute everywhere -- tokenbot.com
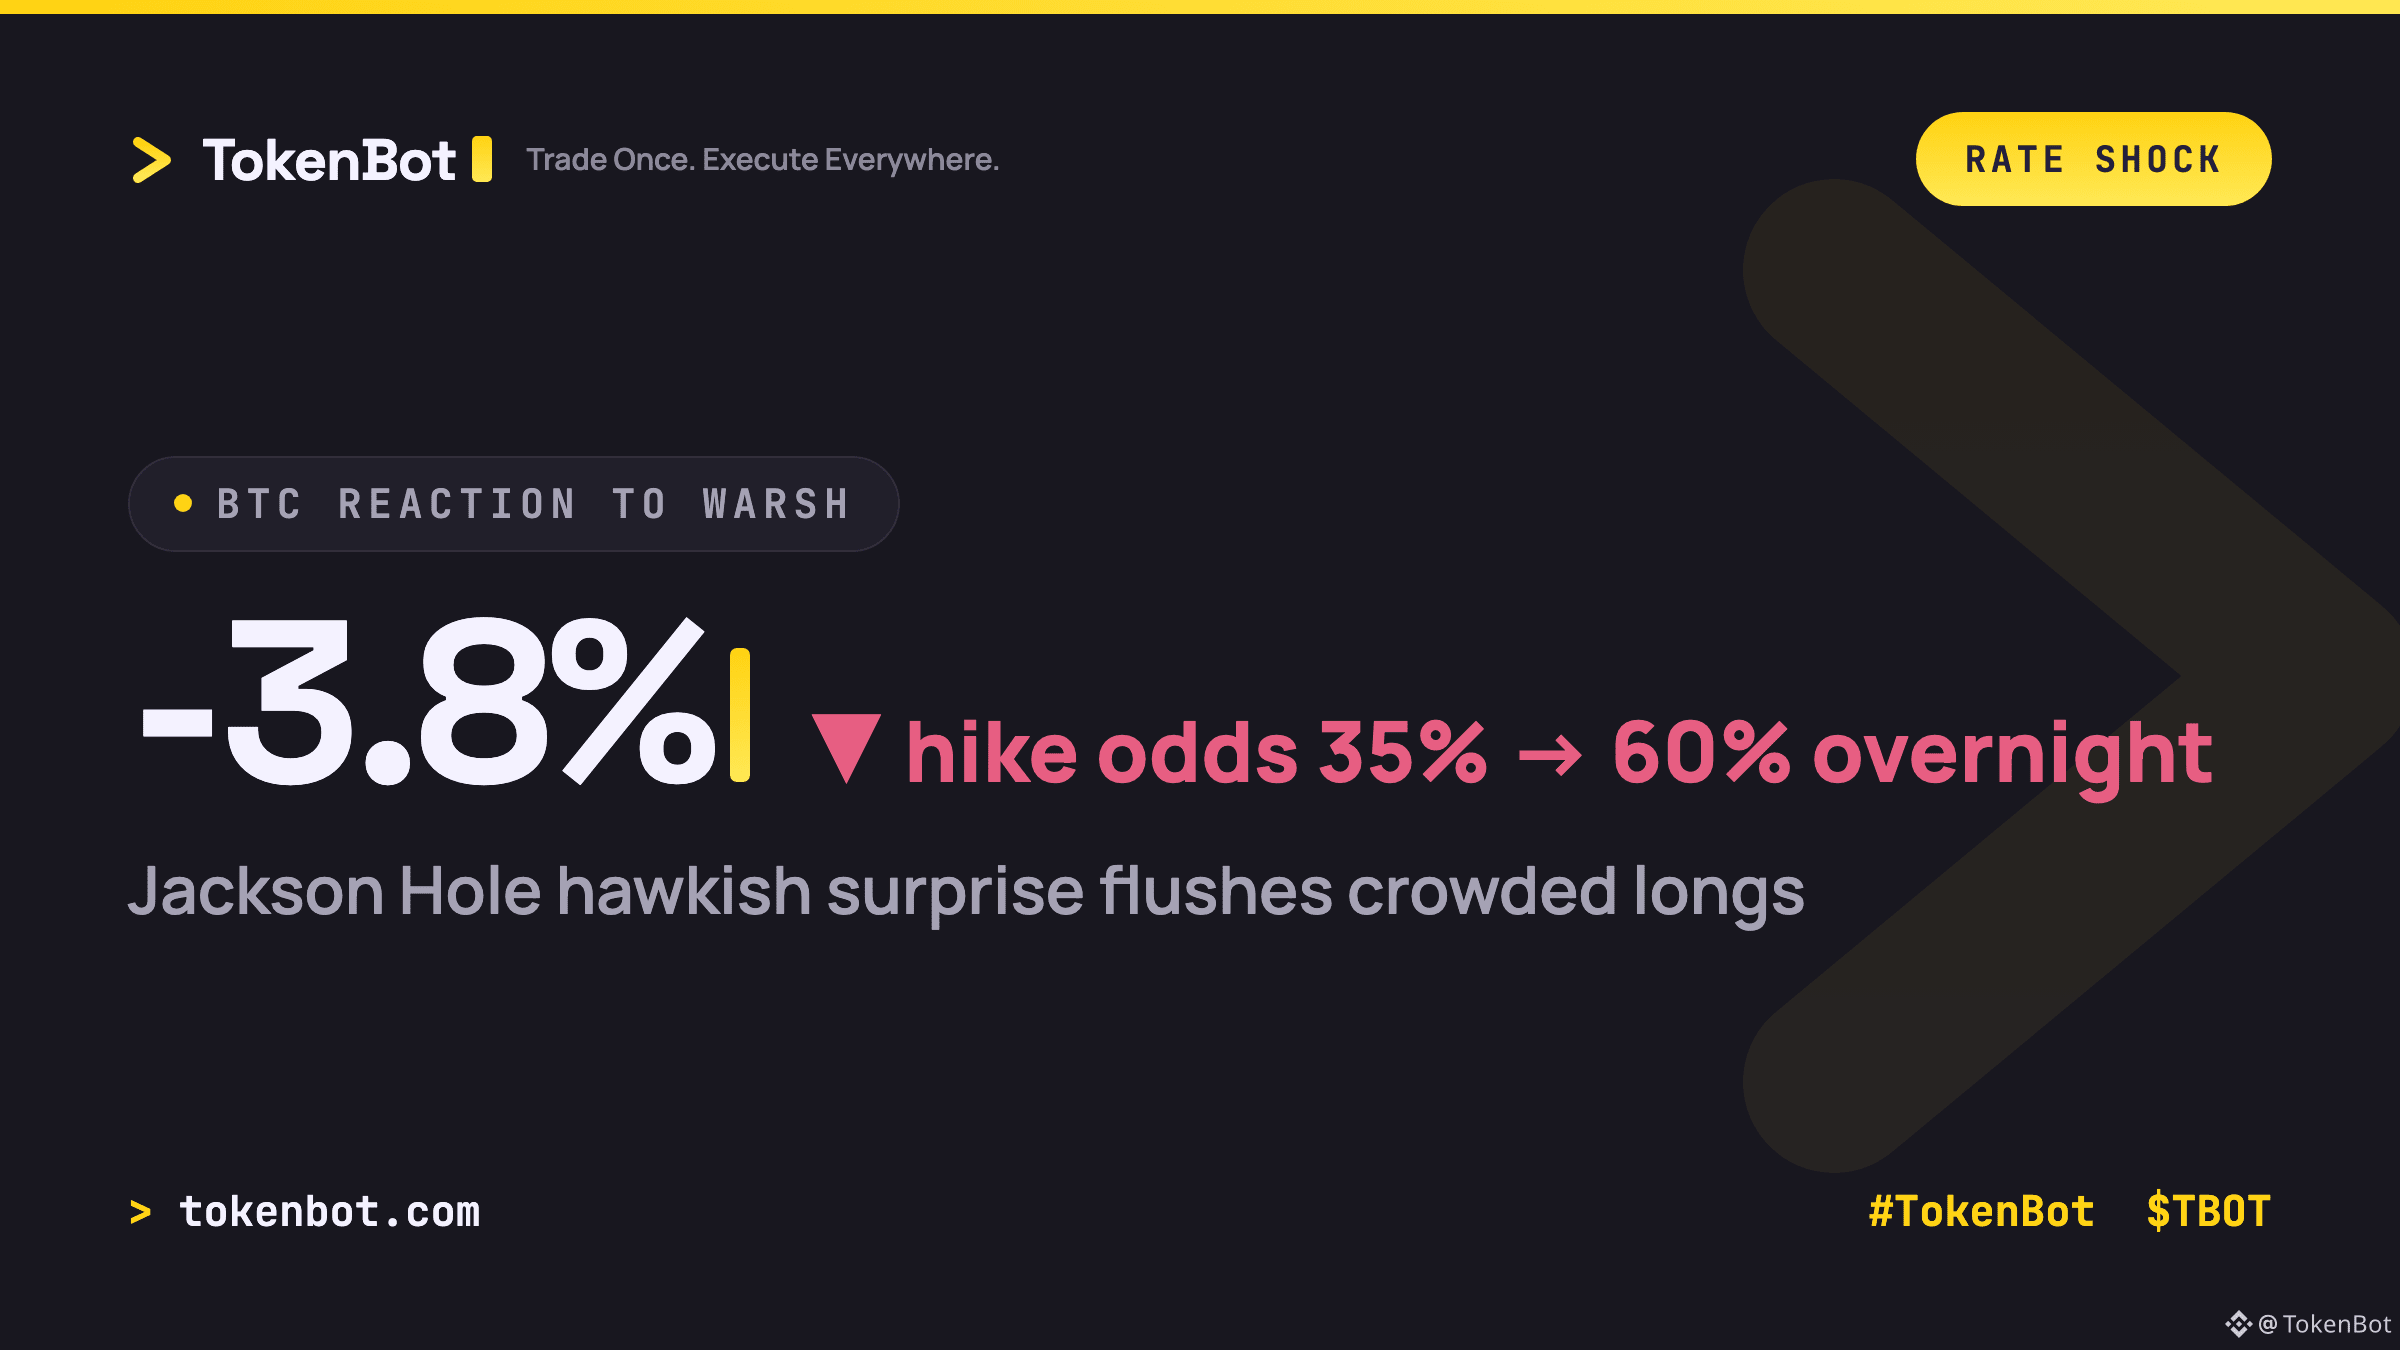
Fed Chair Kevin Warsh turned hawkish at his Jackson Hole speech, and the rates market repriced fast: CME odds of a rate hike next month jumped from roughly 35% to 60% overnight. Bitcoin dropped 3.8% to about $77.8K on the reaction, and the broader crypto market cap fell 2.9% to $2.72T.
The setup that made this hurt: funding had been positive in 88 of the prior 90 eight-hour windows heading into the speech. That's a crowded long book that got fat on the "no more hikes" thesis, and a hawkish surprise is exactly what unwinds it. The 2-year Treasury yield jumped 11bps to 4.34%, its highest in a month, which is the tell that this is a real repricing, not just a headline spike.
If Warsh actually follows through with a hike next month, does $70K hold as the new floor, or was today just the first leg down?
#TokenBot #Bitcoin #Macro #TradingSignals $BTC $TBOT
tokenbot.com
The setup that made this hurt: funding had been positive in 88 of the prior 90 eight-hour windows heading into the speech. That's a crowded long book that got fat on the "no more hikes" thesis, and a hawkish surprise is exactly what unwinds it. The 2-year Treasury yield jumped 11bps to 4.34%, its highest in a month, which is the tell that this is a real repricing, not just a headline spike.
If Warsh actually follows through with a hike next month, does $70K hold as the new floor, or was today just the first leg down?
#TokenBot #Bitcoin #Macro #TradingSignals $BTC $TBOT
tokenbot.com
Charles Schwab, custodian of roughly $10 trillion in client assets, just announced it's adding Solana, Avalanche, and Chainlink to its crypto trading platform. They join Bitcoin and Ethereum, which have been the only two coins on offer since Schwab Crypto launched in May. Solana led the reaction, up 6.89% to $109.
The number that matters here isn't the SOL pop, it's the menu. For three months, the biggest brokerages treated "crypto" as a two-asset category: BTC and ETH, full stop. Schwab just broke that consensus, and it did so citing client demand, not a narrative cycle. That's a different kind of buy signal than a CT trend -- it's brokerage order flow telling a $10T platform what its own users are asking for.
Worth watching: which asset gets whitelisted next when the filter is actual account demand instead of social volume? Schwab said more coins are coming.
$BTC $ETH $TBOT #Solana #TradFi #TokenBot
tokenbot.com
The number that matters here isn't the SOL pop, it's the menu. For three months, the biggest brokerages treated "crypto" as a two-asset category: BTC and ETH, full stop. Schwab just broke that consensus, and it did so citing client demand, not a narrative cycle. That's a different kind of buy signal than a CT trend -- it's brokerage order flow telling a $10T platform what its own users are asking for.
Worth watching: which asset gets whitelisted next when the filter is actual account demand instead of social volume? Schwab said more coins are coming.
$BTC $ETH $TBOT #Solana #TradFi #TokenBot
tokenbot.com

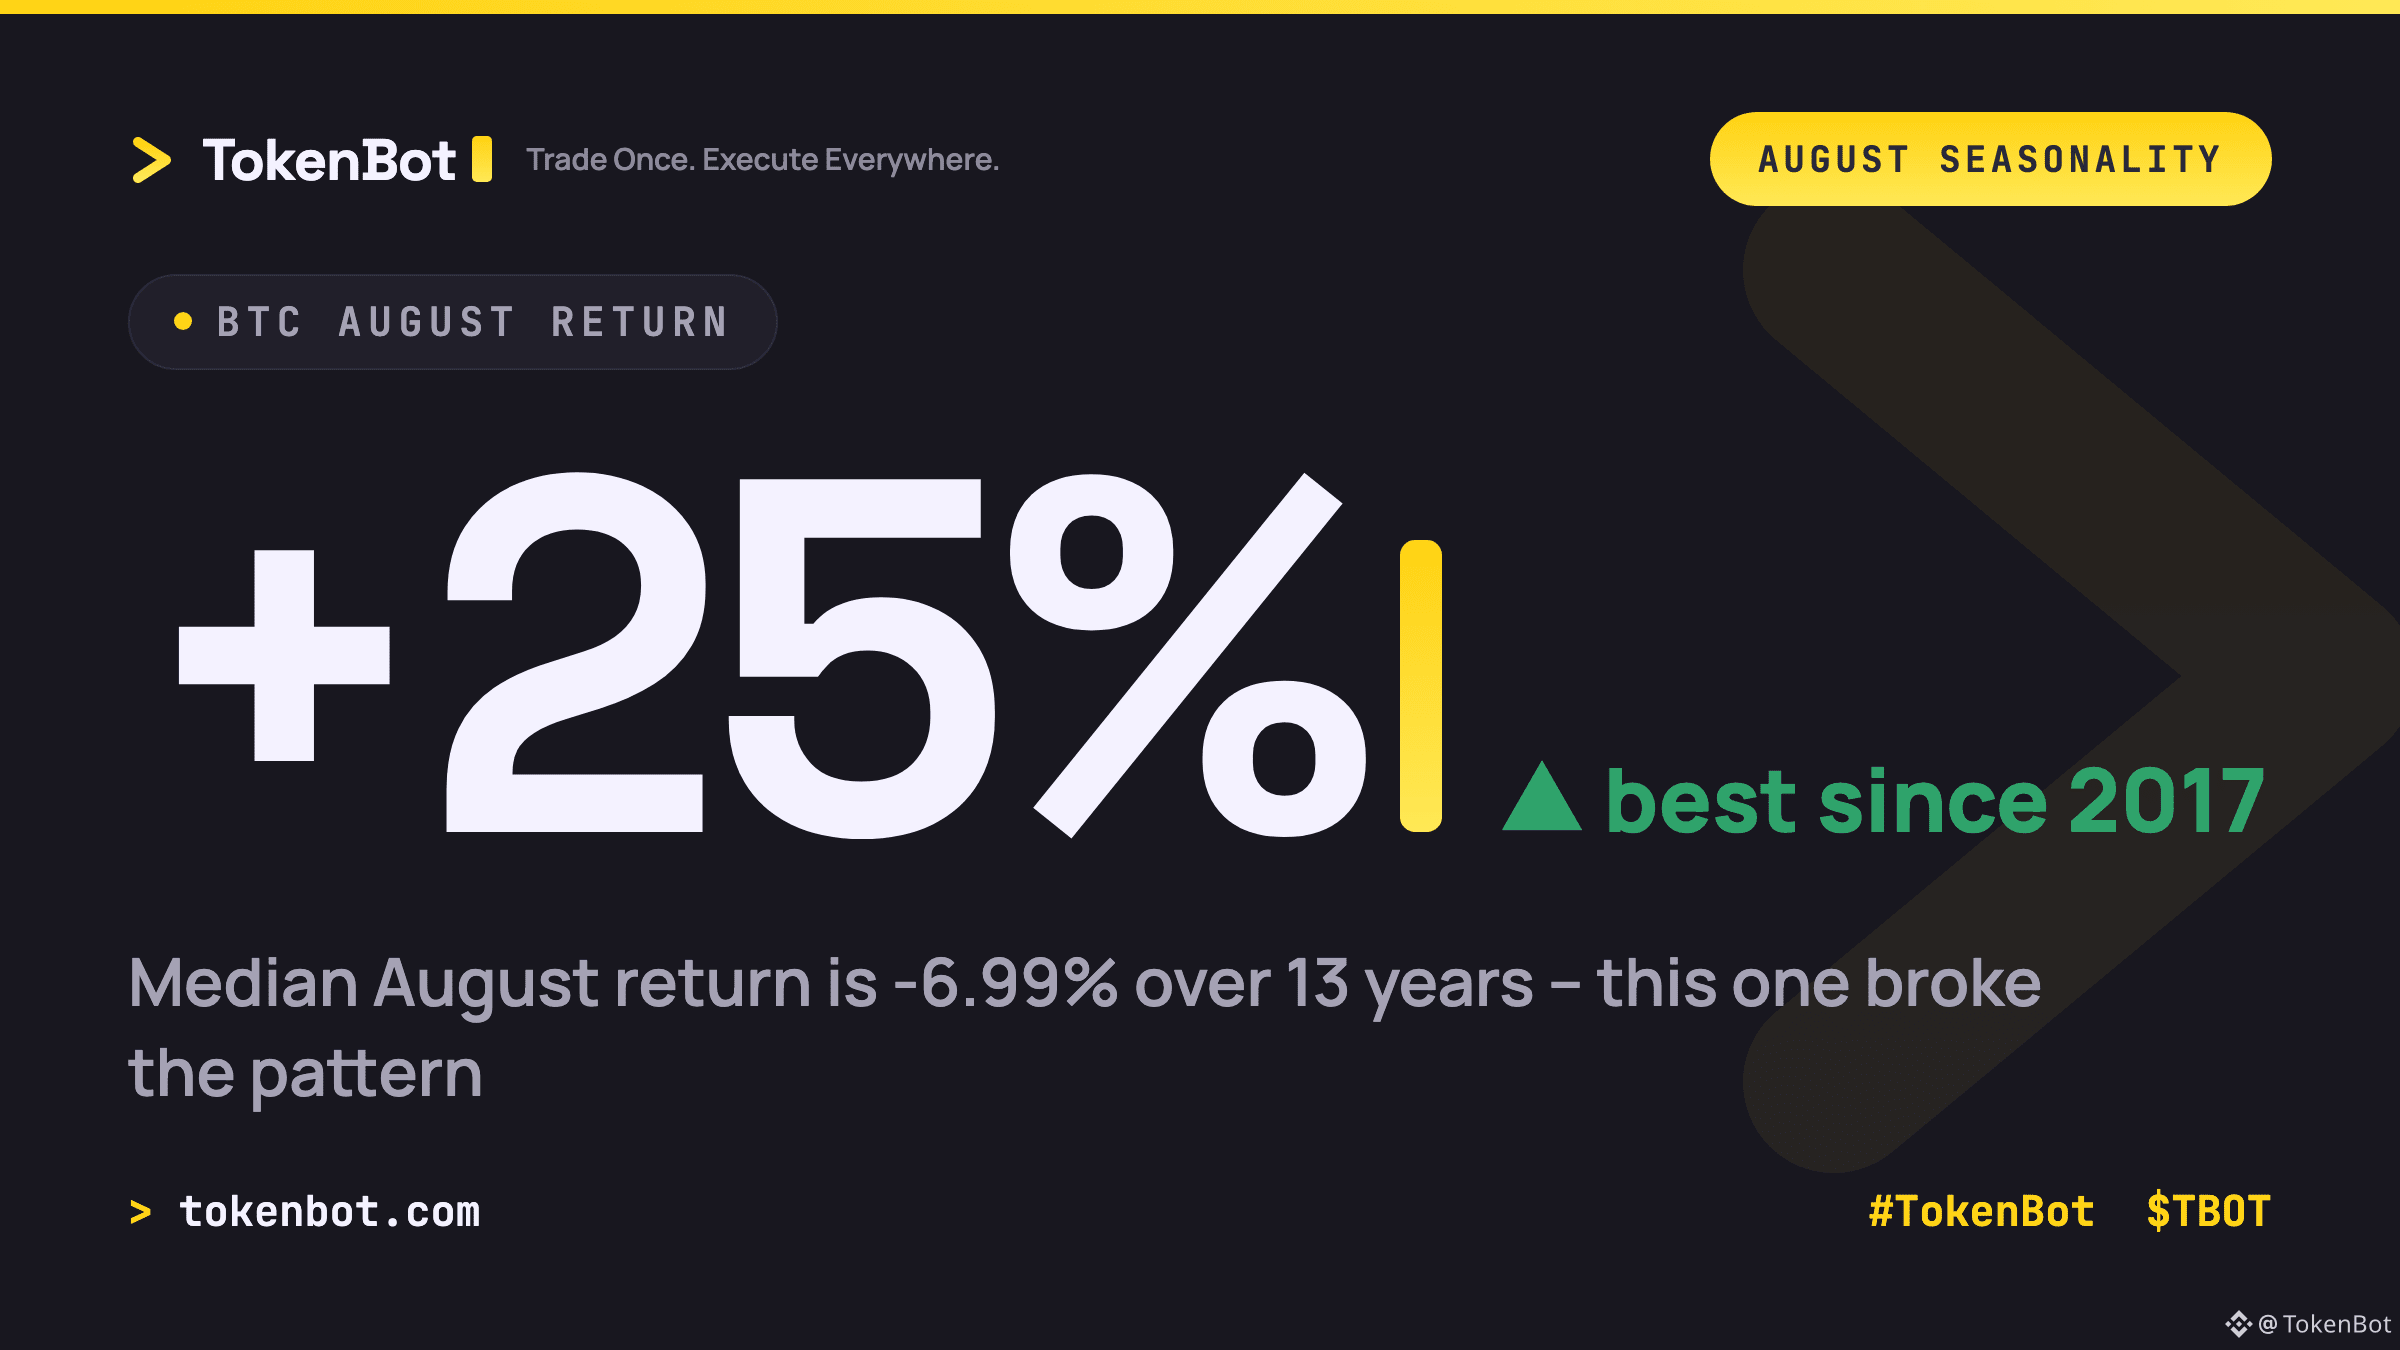
Bitcoin is up roughly 25% this August, putting it on pace for the best August since 2017 -- and the first green August since 2021.
That matters because August has quietly been bitcoin's worst seasonal month for over a decade: the median August return across the last 13 years is -6.99%, and there hasn't been a green one since 2021. Traders who lean on that seasonality -- shorting into August, fading summer strength -- got run over this year.
Whatever's behind the move (ETF flow, positioning unwind, macro), it isn't the calendar. Worth asking whether seasonality-based models need a rewrite, or if this year is simply the outlier that proves the rule.
How much of your book still runs on calendar-based seasonality signals?
$BTC $TBOT #Bitcoin #Crypto #TradingSignals #TokenBot
That matters because August has quietly been bitcoin's worst seasonal month for over a decade: the median August return across the last 13 years is -6.99%, and there hasn't been a green one since 2021. Traders who lean on that seasonality -- shorting into August, fading summer strength -- got run over this year.
Whatever's behind the move (ETF flow, positioning unwind, macro), it isn't the calendar. Worth asking whether seasonality-based models need a rewrite, or if this year is simply the outlier that proves the rule.
How much of your book still runs on calendar-based seasonality signals?
$BTC $TBOT #Bitcoin #Crypto #TradingSignals #TokenBot
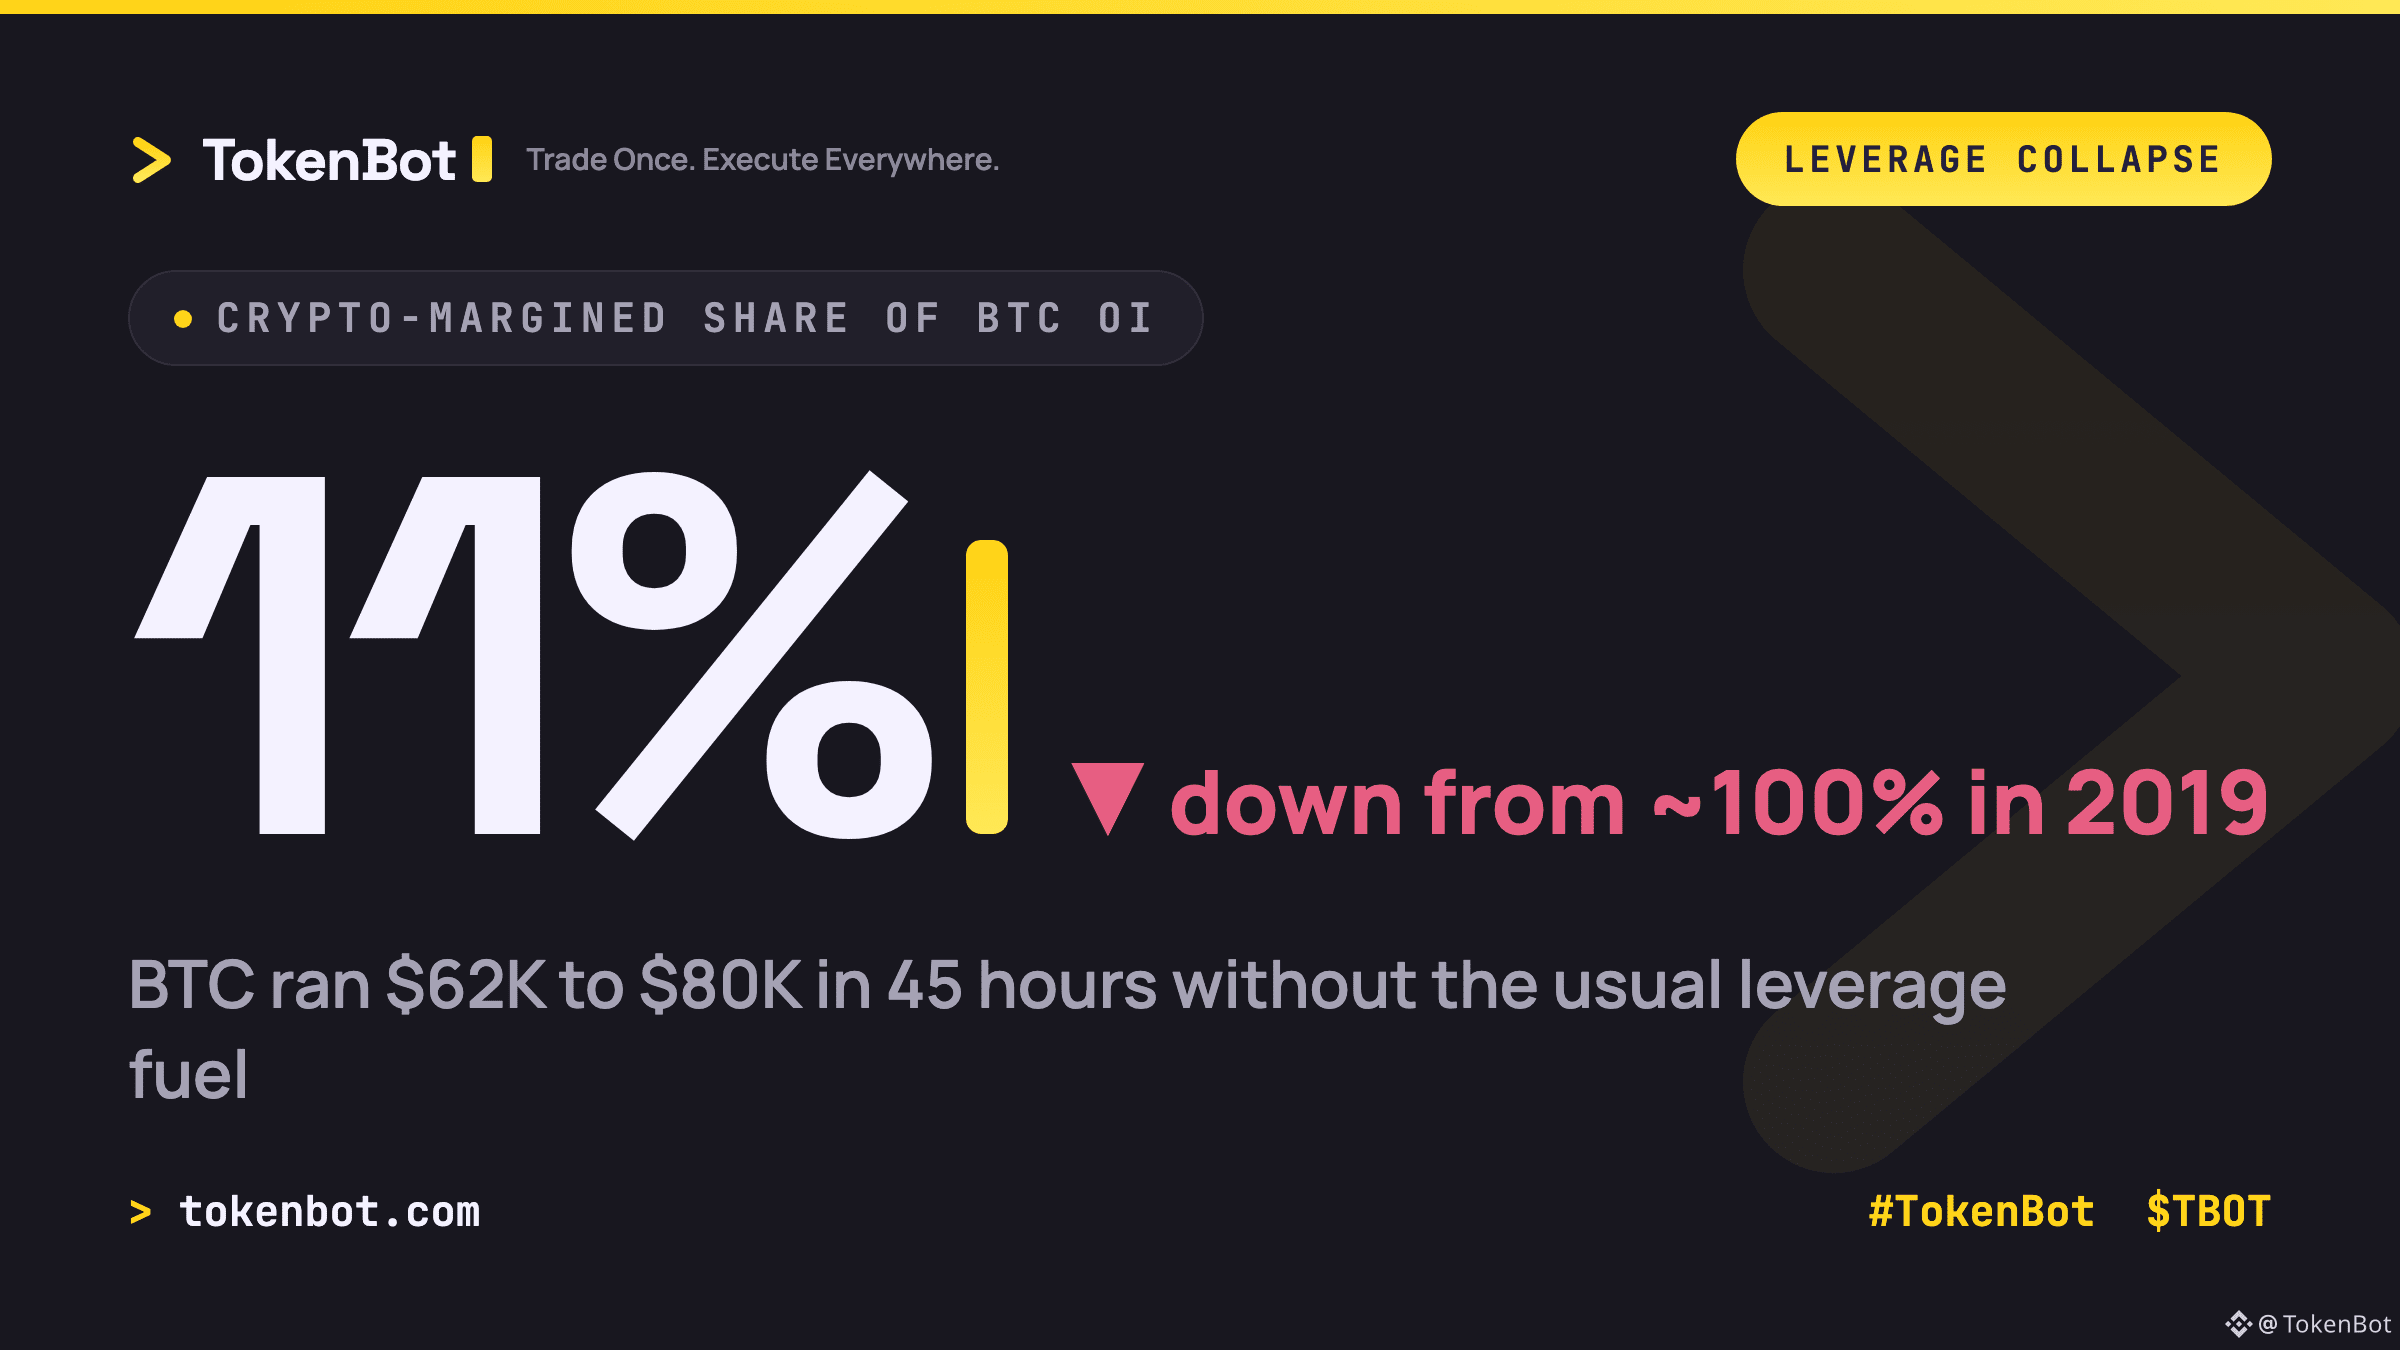
BTC ran from $62K to $79.6K in under 45 hours this week, and the leverage story underneath that move is the real headline: crypto-margined futures open interest just hit an all-time low, sitting near 11% of total open interest. Back in 2019-2020, crypto-margined collateral was basically 100% of the market.
That matters for what happens next. When most open interest sits in crypto-margined contracts, a price move forces self-referential liquidations — falling BTC collateral triggers more selling, which drops BTC further. With crypto margin down to roughly a tenth of the market, that feedback loop is a lot weaker than it used to be. This rally is running mostly on spot and stablecoin-margined demand, not leverage stacked on leverage.
That doesn't mean there's no risk on the table, it just moves the pressure point elsewhere. Where do you think the real stress sits if this move reverses — spot sellers, funding, or somewhere in options gamma?
#Bitcoin #TradingSignals #TokenBot $BTC $TBOT tokenbot.com
That matters for what happens next. When most open interest sits in crypto-margined contracts, a price move forces self-referential liquidations — falling BTC collateral triggers more selling, which drops BTC further. With crypto margin down to roughly a tenth of the market, that feedback loop is a lot weaker than it used to be. This rally is running mostly on spot and stablecoin-margined demand, not leverage stacked on leverage.
That doesn't mean there's no risk on the table, it just moves the pressure point elsewhere. Where do you think the real stress sits if this move reverses — spot sellers, funding, or somewhere in options gamma?
#Bitcoin #TradingSignals #TokenBot $BTC $TBOT tokenbot.com
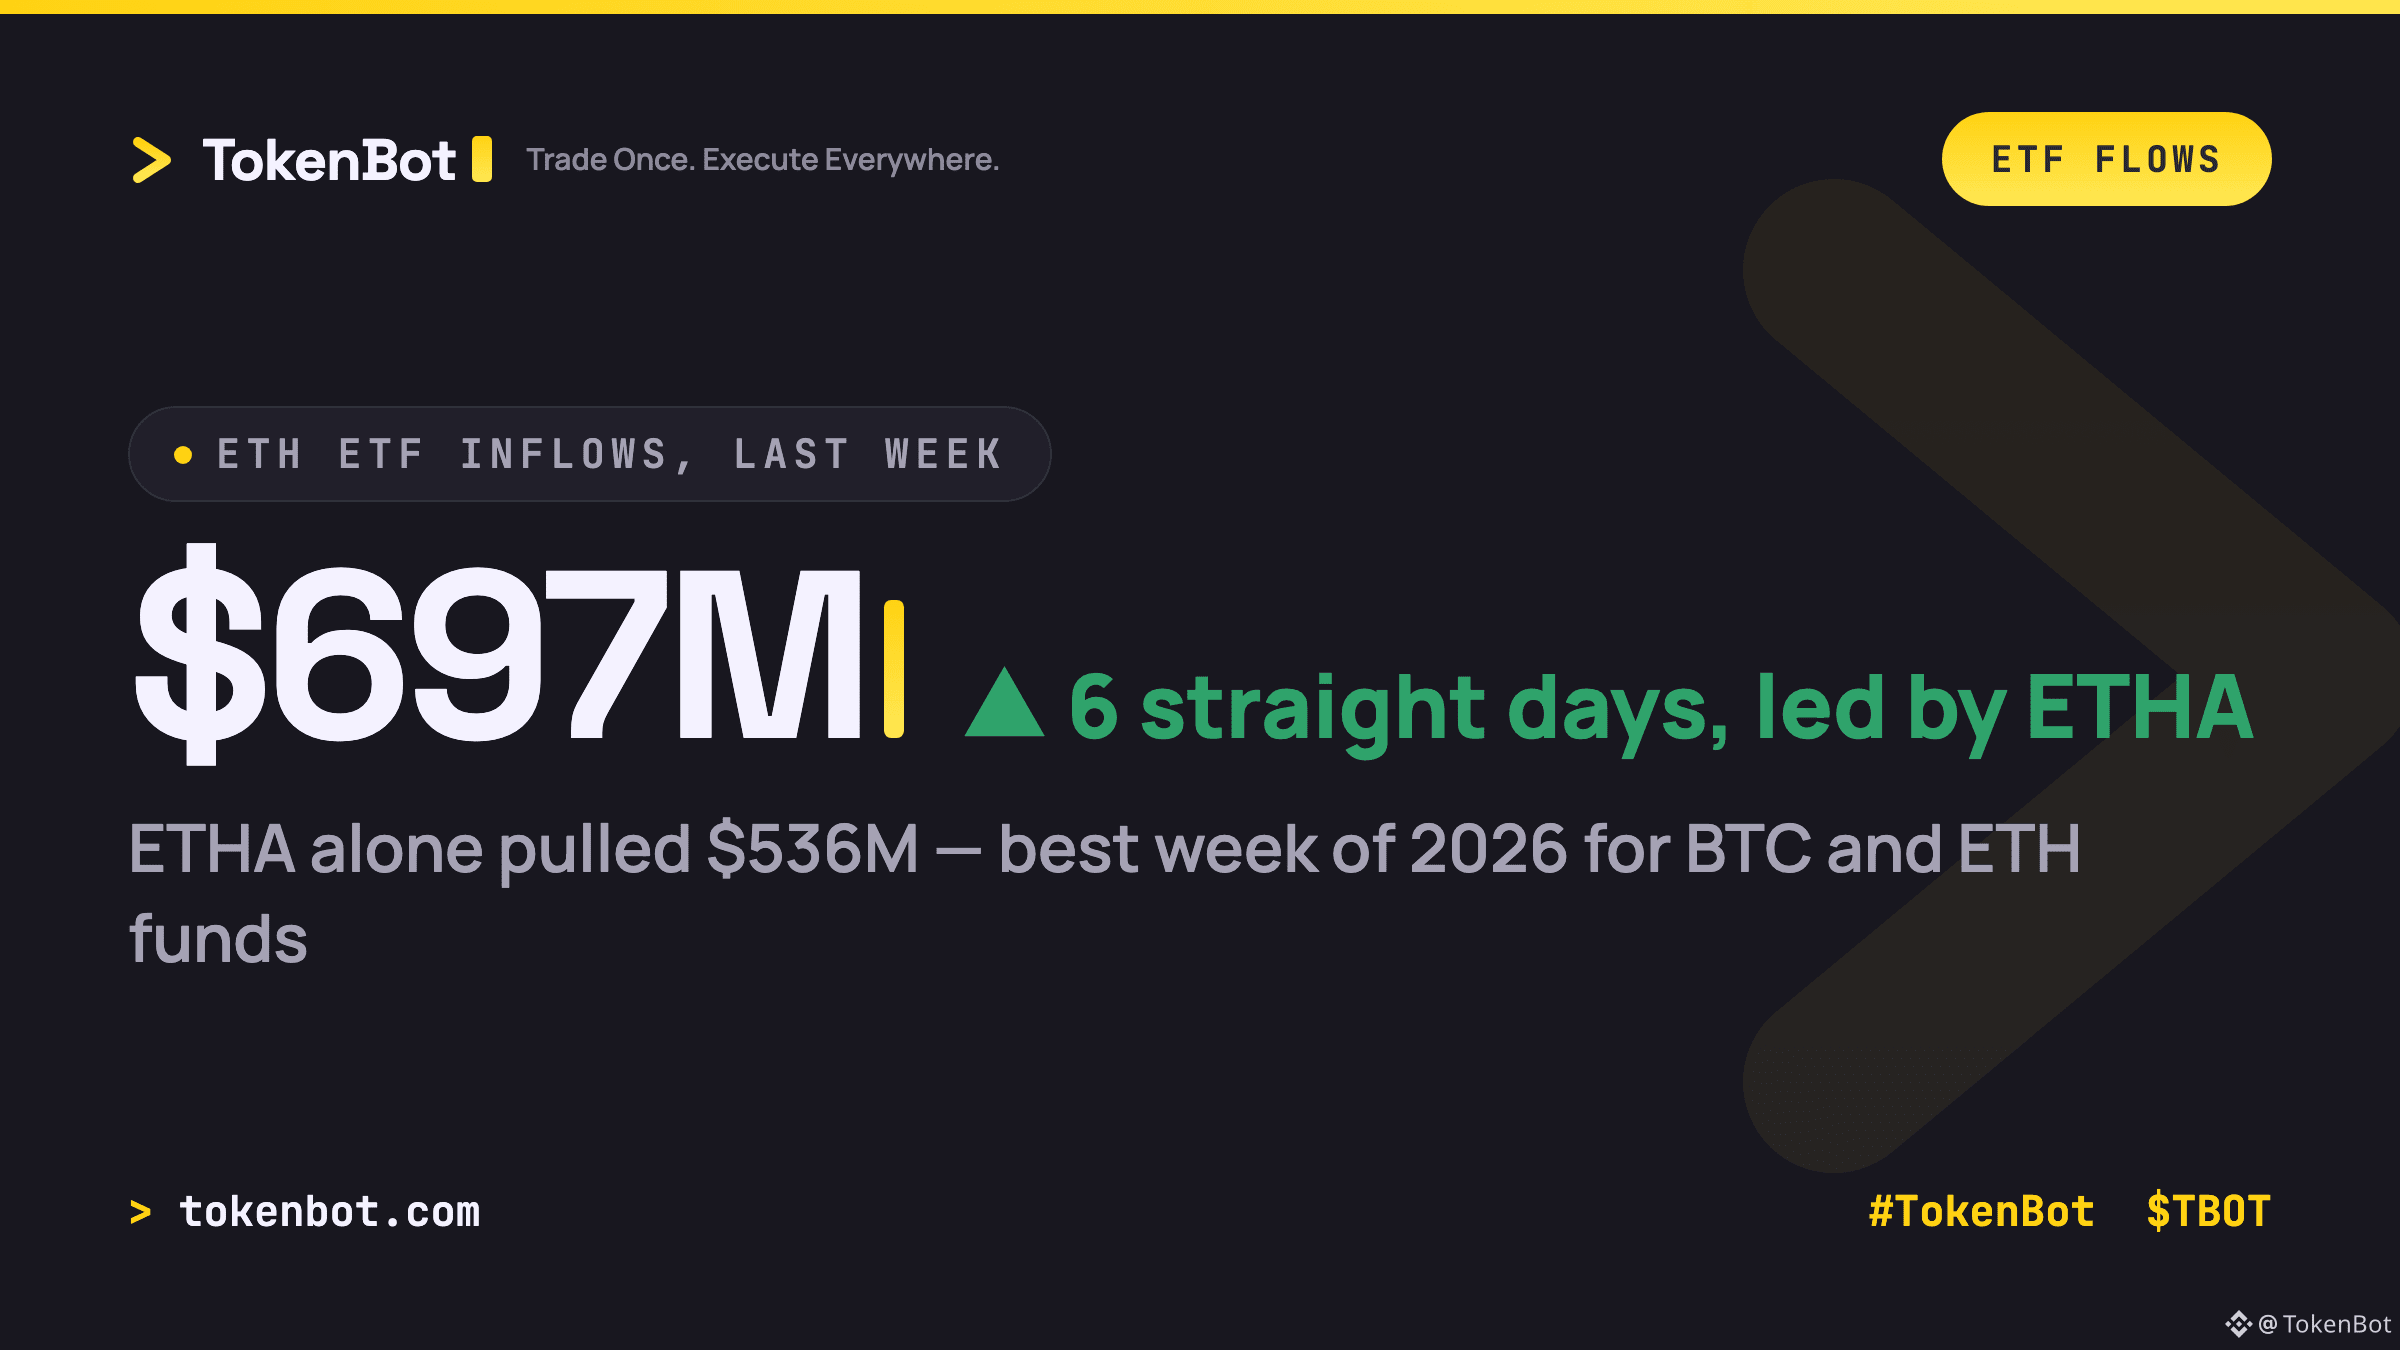
ETH spot ETFs just posted their 6th consecutive day of net inflows. BlackRock's ETHA led the pack, pulling in $536.83M of the $697M that flowed into the category across the five sessions from August 17–21 — daily prints of $30.85M, $71.47M, $189M, $221M and $185M, followed by another $90.92M into ETHA on August 24. It's the best single week of 2026 for both BTC and ETH ETF categories, a sharp reversal from the $2.26M net outflow the week before.
The mechanism matters here: this is spot demand from allocators moving through the ETF wrapper, not leveraged traders re-positioning in perps. Bitcoin's futures open interest just collapsed to a five-month low during the recent short squeeze, so derivatives positioning has gone quiet while ETF flows keep printing green. When those two signals diverge like this, flows are arguably the cleaner read on who's actually accumulating.
Which do you weight more right now for direction — spot ETF flow or perp funding/OI? Curious how algo desks are scoring it.
tokenbot.com
#TokenBot #Ethereum #Bitcoin #TradingSignals $ETH $TBOT
The mechanism matters here: this is spot demand from allocators moving through the ETF wrapper, not leveraged traders re-positioning in perps. Bitcoin's futures open interest just collapsed to a five-month low during the recent short squeeze, so derivatives positioning has gone quiet while ETF flows keep printing green. When those two signals diverge like this, flows are arguably the cleaner read on who's actually accumulating.
Which do you weight more right now for direction — spot ETF flow or perp funding/OI? Curious how algo desks are scoring it.
tokenbot.com
#TokenBot #Ethereum #Bitcoin #TradingSignals $ETH $TBOT
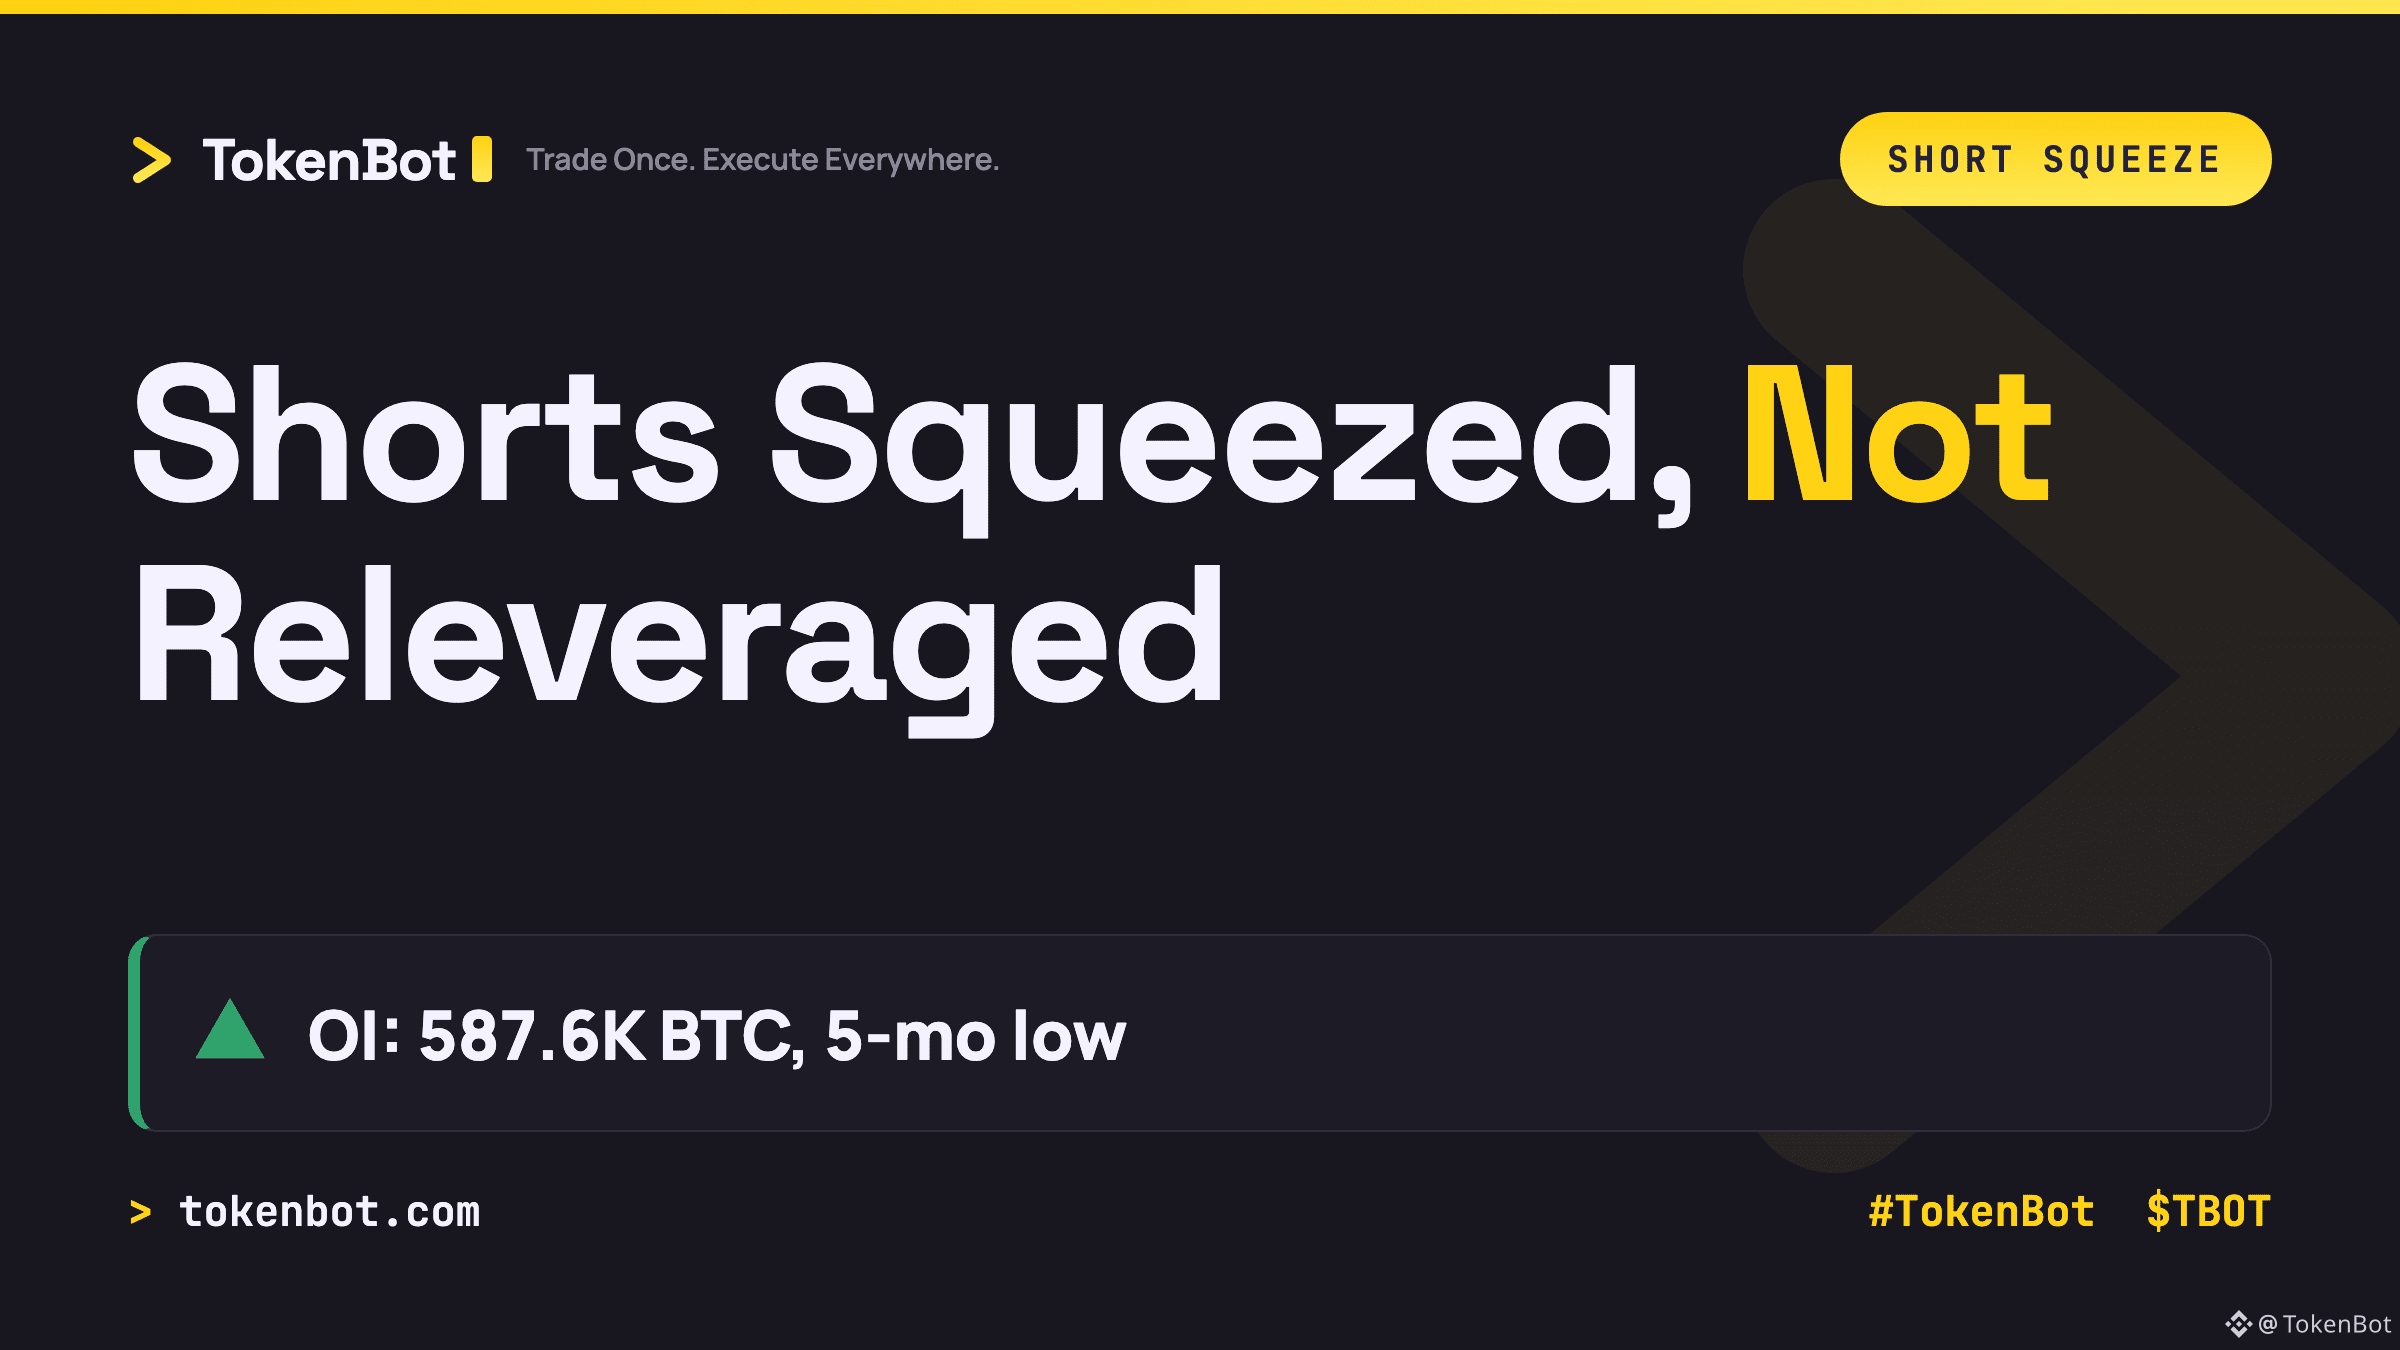
Bitcoin ran from $62,000 to $81,000 in under two weeks, its second-biggest weekly gain in five years, and futures open interest just fell to a 5-month low.
That's the tell: this wasn't fresh leveraged longs piling into the move, it was shorts getting squeezed and closing out. Funding rates barely budged the entire way up, which means the leverage that usually shows up after a rally like this simply isn't there yet.
Mechanically that cuts both ways. A deleveraged rally has less fuel for a violent unwind, but it also means there's no crowd of trapped longs left to keep bidding it higher on momentum alone. The next leg needs real spot demand or fresh positioning, not just short covering.
For anyone running systematic books: are you treating a low-OI breakout like this as confirmation, or waiting for funding to reload before adding risk?
$BTC $TBOT #Bitcoin #TokenBot #TradingSignals
tokenbot.com
That's the tell: this wasn't fresh leveraged longs piling into the move, it was shorts getting squeezed and closing out. Funding rates barely budged the entire way up, which means the leverage that usually shows up after a rally like this simply isn't there yet.
Mechanically that cuts both ways. A deleveraged rally has less fuel for a violent unwind, but it also means there's no crowd of trapped longs left to keep bidding it higher on momentum alone. The next leg needs real spot demand or fresh positioning, not just short covering.
For anyone running systematic books: are you treating a low-OI breakout like this as confirmation, or waiting for funding to reload before adding risk?
$BTC $TBOT #Bitcoin #TokenBot #TradingSignals
tokenbot.com
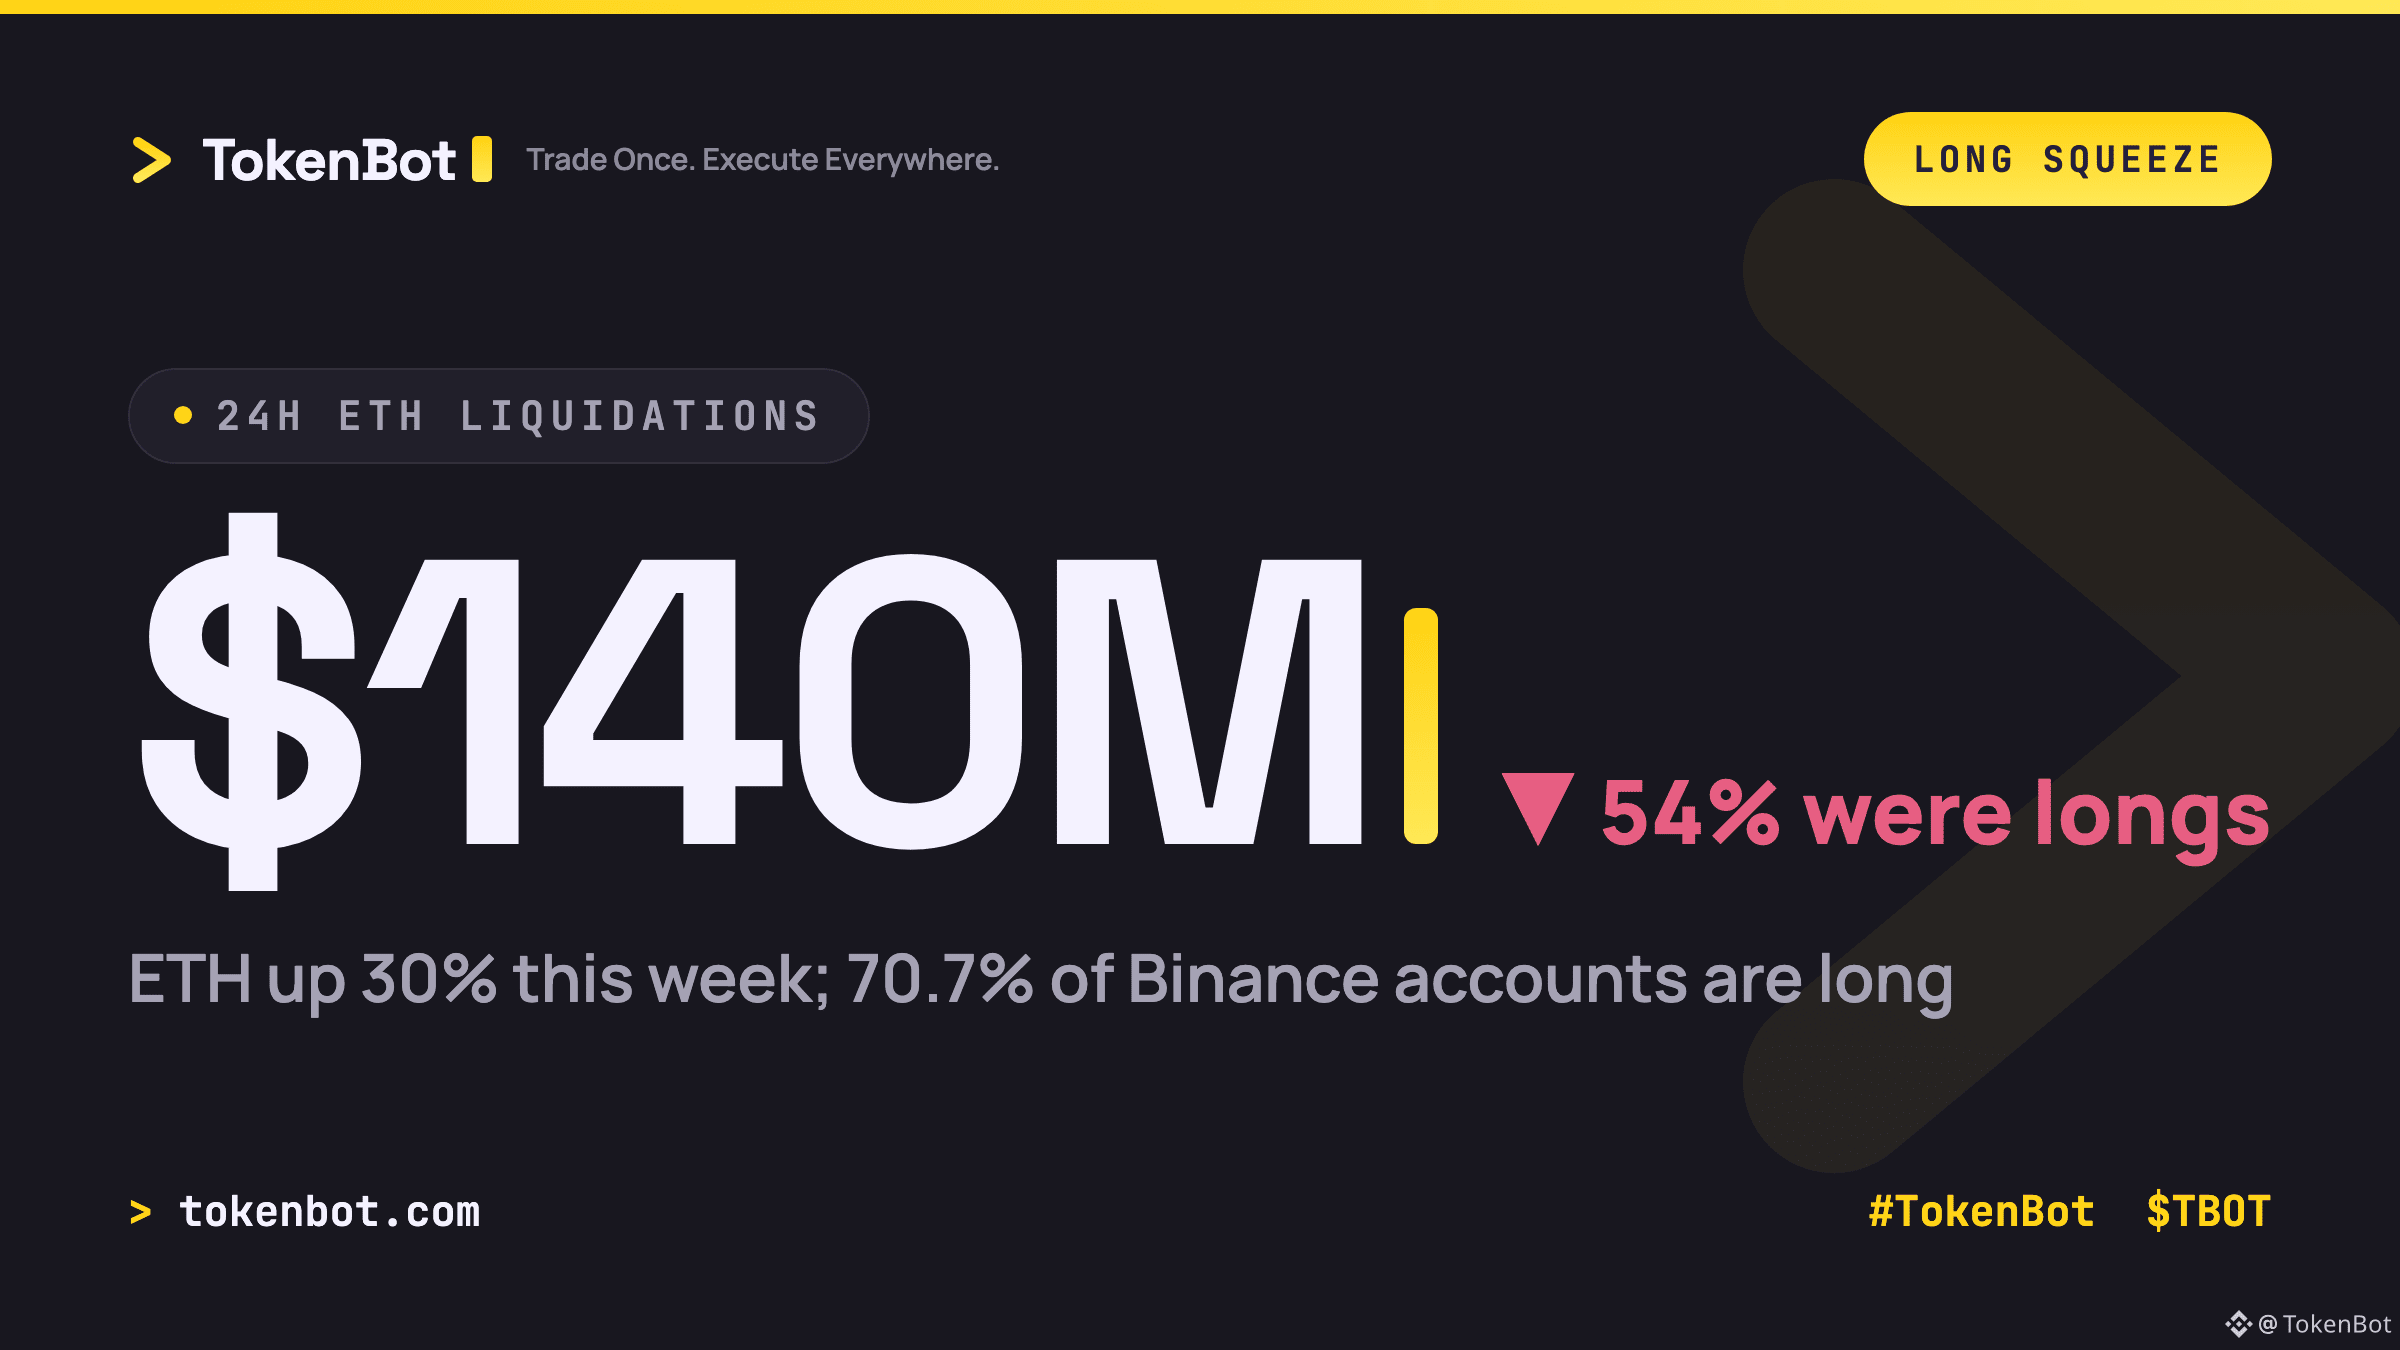
$ETH is up 30% this week to $2,480, and today it paid for it. Crypto futures saw $263M in liquidations over 24 hours, and ETH led every asset with $140M wiped out, 54% of it longs (via @CryptoRank_io).
The setup explains why: open interest on ETH futures is up 20% in the past month, and 70.7% of Binance ETH accounts are now positioned long. That's not just bullish conviction, it's a one-sided book. When positioning gets that lopsided, it doesn't take a real reversal to trigger cascading closures, just a normal pullback finding all the stop-outs stacked on one side.
Funding is still the tell to watch here. If it stays elevated while price chops, more of this rally's fuel is leverage than spot demand, and that's a fragile combination.
Are you sizing down into this move or treating the flush as a healthy reset?
#Ethereum #Crypto #TradingSignals #TokenBot $TBOT
tokenbot.com
The setup explains why: open interest on ETH futures is up 20% in the past month, and 70.7% of Binance ETH accounts are now positioned long. That's not just bullish conviction, it's a one-sided book. When positioning gets that lopsided, it doesn't take a real reversal to trigger cascading closures, just a normal pullback finding all the stop-outs stacked on one side.
Funding is still the tell to watch here. If it stays elevated while price chops, more of this rally's fuel is leverage than spot demand, and that's a fragile combination.
Are you sizing down into this move or treating the flush as a healthy reset?
#Ethereum #Crypto #TradingSignals #TokenBot $TBOT
tokenbot.com
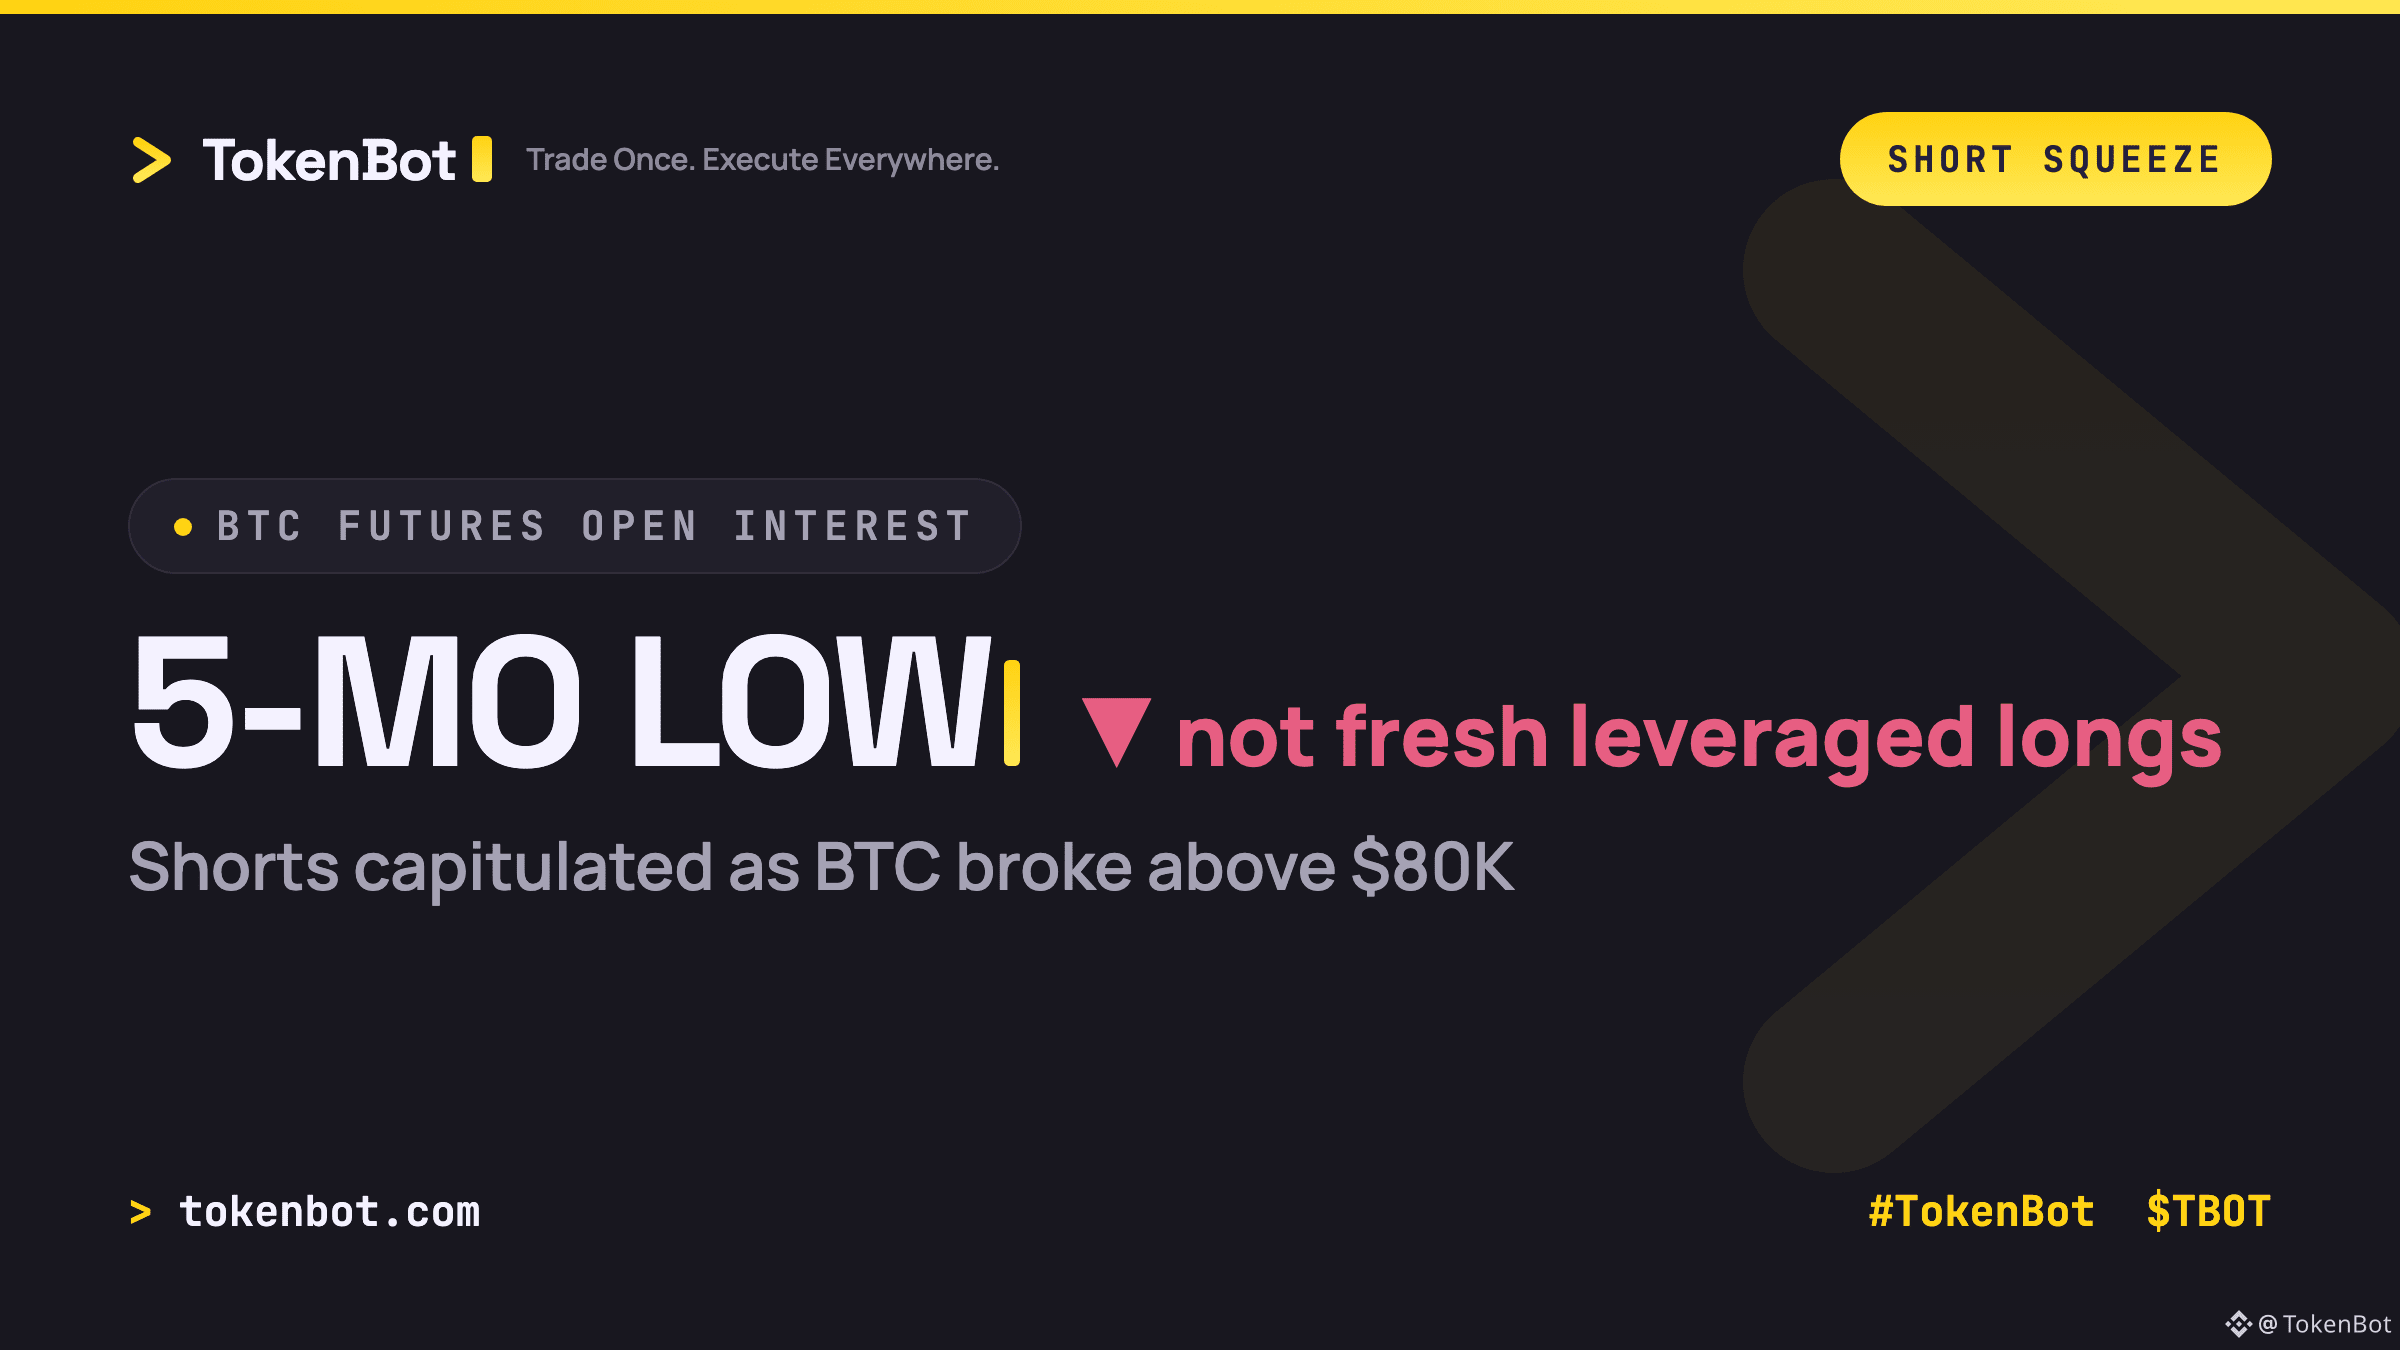
BTC ripped past $80K today, but Bitcoin futures open interest just fell to a five-month low (via CoinGlass), with crypto-margined OI at a record low. That combination — price up, OI down — is the tell: this move is shorts capitulating, not fresh leveraged longs piling in.
Mechanically that matters. When a rally is built on short covering, the buying pressure comes from positions closing, not new conviction opening. Funding is still sitting near baseline and annualized funding stays under 10%, which is not what a leverage-driven melt-up looks like. Once the shorts are cleared out, the question is who shows up to buy next.
This week already saw one of the largest short-liquidation events on record. Squeezes like that tend to be fast and self-limiting — they can run out of fuel just as quickly as they started.
Is anyone actually adding fresh longs at these levels, or is this mostly a cleanout of stale shorts?
#Bitcoin #TradingSignals #Crypto #TokenBot $BTC $TBOT
tokenbot.com
Mechanically that matters. When a rally is built on short covering, the buying pressure comes from positions closing, not new conviction opening. Funding is still sitting near baseline and annualized funding stays under 10%, which is not what a leverage-driven melt-up looks like. Once the shorts are cleared out, the question is who shows up to buy next.
This week already saw one of the largest short-liquidation events on record. Squeezes like that tend to be fast and self-limiting — they can run out of fuel just as quickly as they started.
Is anyone actually adding fresh longs at these levels, or is this mostly a cleanout of stale shorts?
#Bitcoin #TradingSignals #Crypto #TokenBot $BTC $TBOT
tokenbot.com
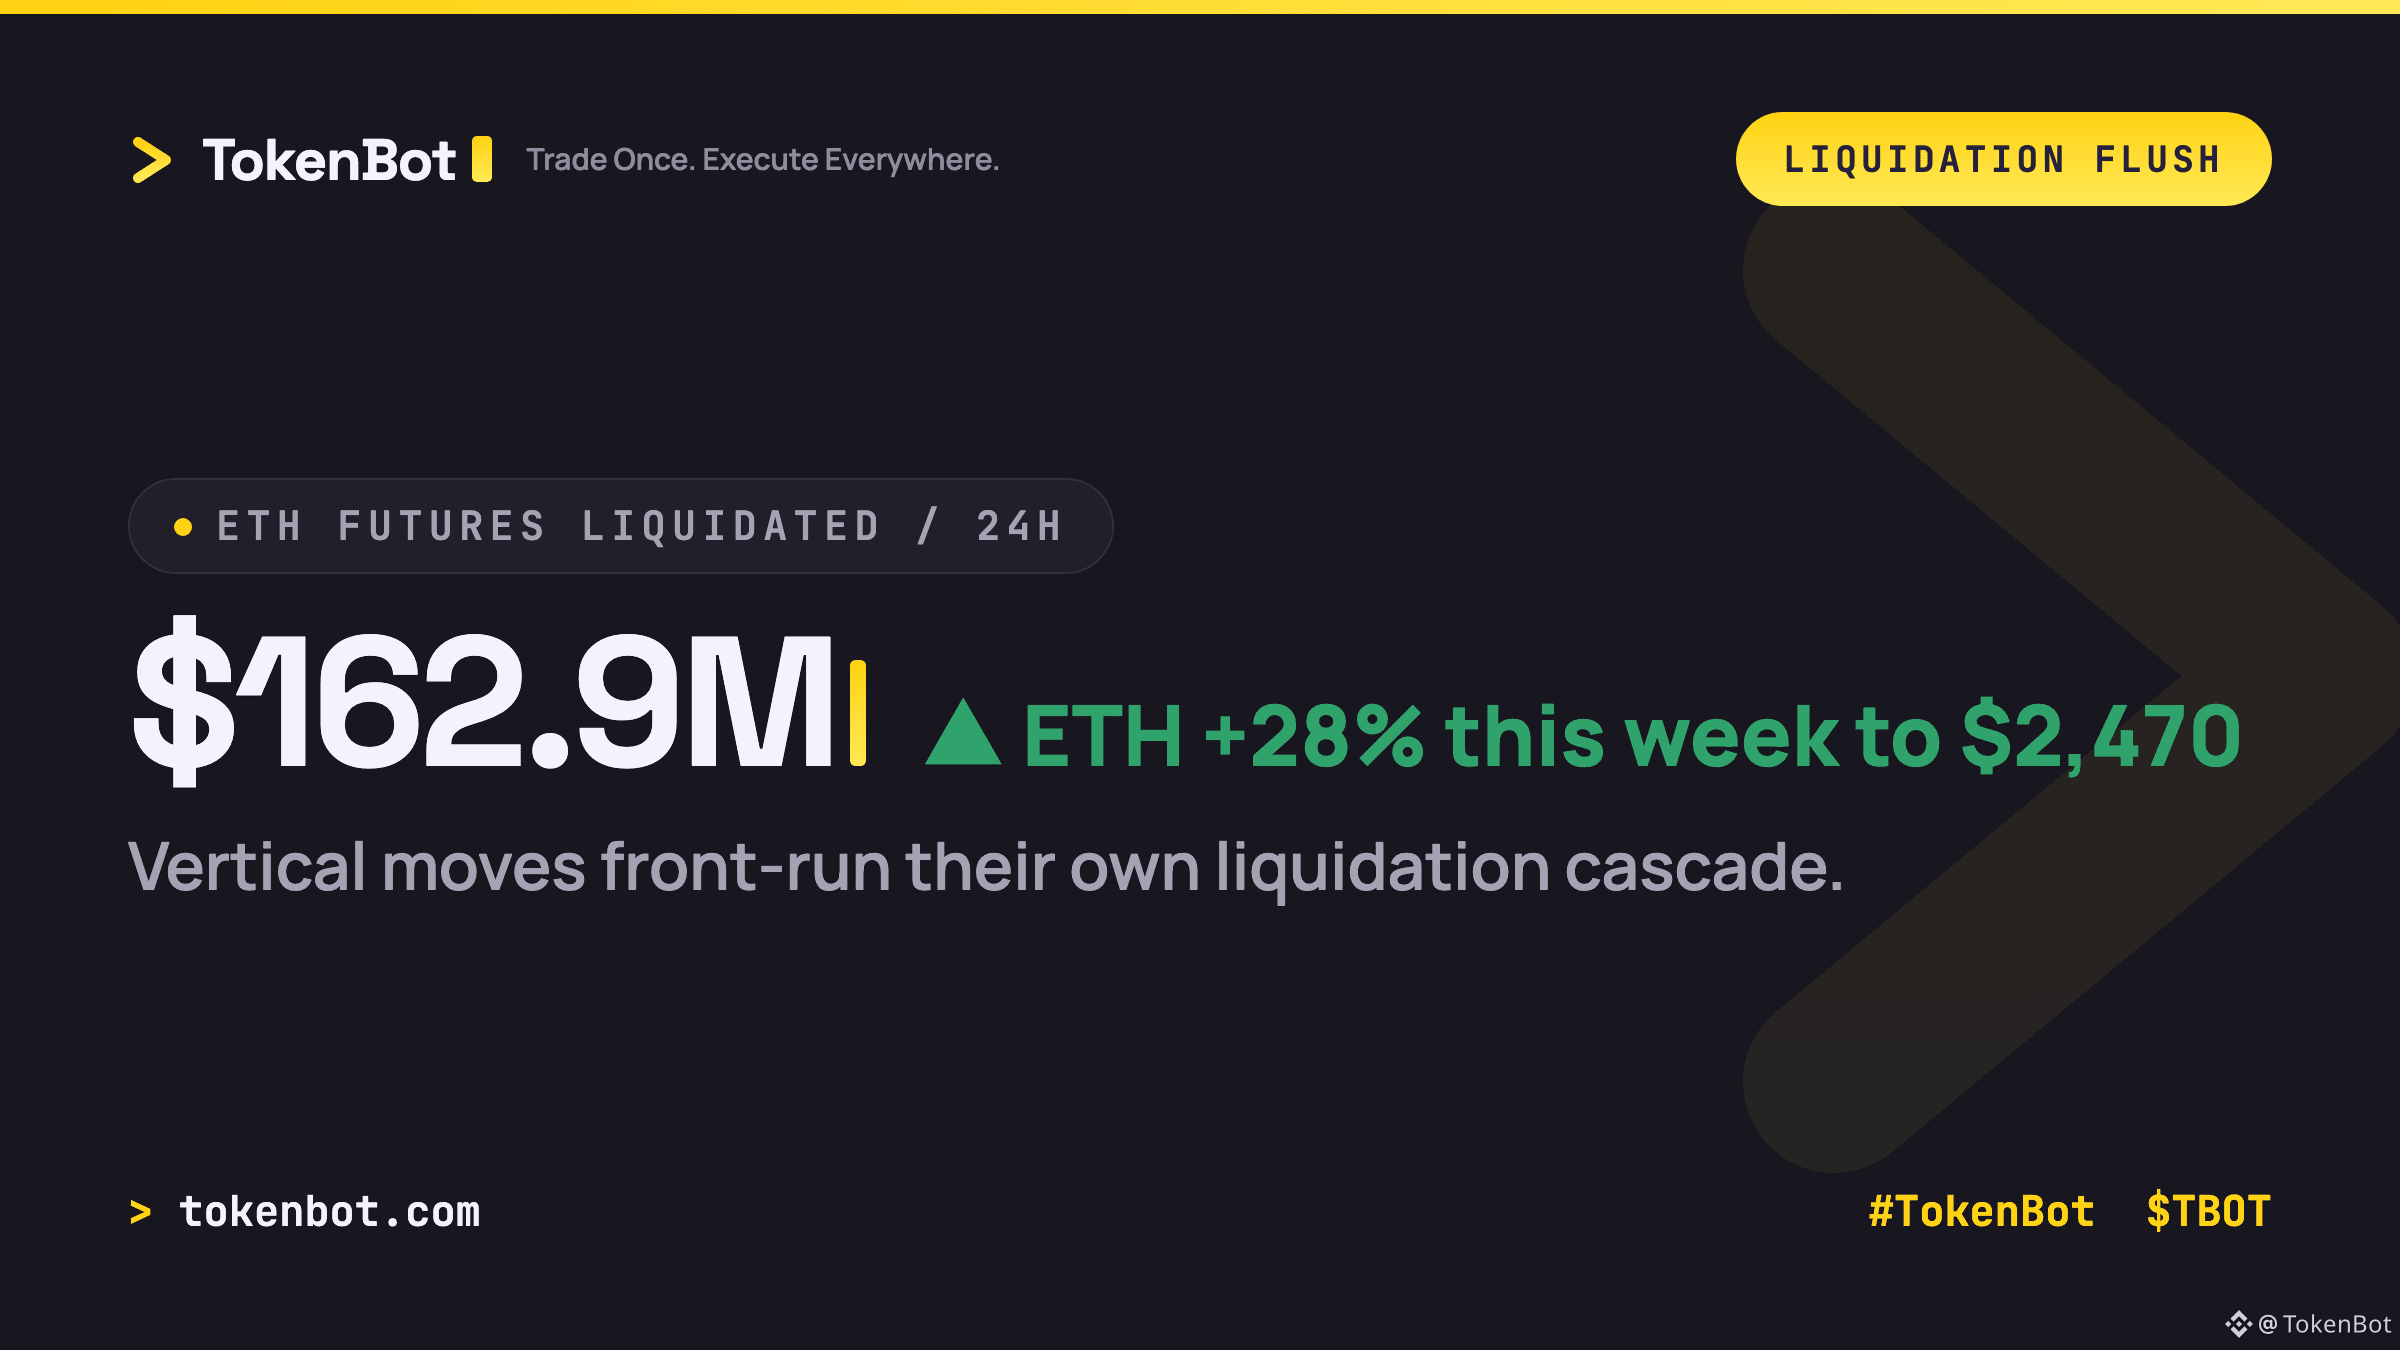
ETH has ripped 28% this week to $2,470, with most of that gain packed into a single session on Aug 19-20 (+18-23% in a day). Even with the rally intact, $162.9M in ETH futures got liquidated in the last 24 hours alone.
That's the mechanism worth watching: a vertical single-session move doesn't just print a green candle, it front-runs its own liquidation cascade. Late shorts get run over on the way up, then late longs get flushed on the first real pullback. The liquidation total staying elevated a full day after the initial surge suggests positioning is still working itself out, not settled.
Are you fading a 20%+ one-day ETH candle here, or treating this move as structurally different from past spikes?
#TokenBot #Ethereum #Crypto #TradingSignals $ETH $TBOT
That's the mechanism worth watching: a vertical single-session move doesn't just print a green candle, it front-runs its own liquidation cascade. Late shorts get run over on the way up, then late longs get flushed on the first real pullback. The liquidation total staying elevated a full day after the initial surge suggests positioning is still working itself out, not settled.
Are you fading a 20%+ one-day ETH candle here, or treating this move as structurally different from past spikes?
#TokenBot #Ethereum #Crypto #TradingSignals $ETH $TBOT
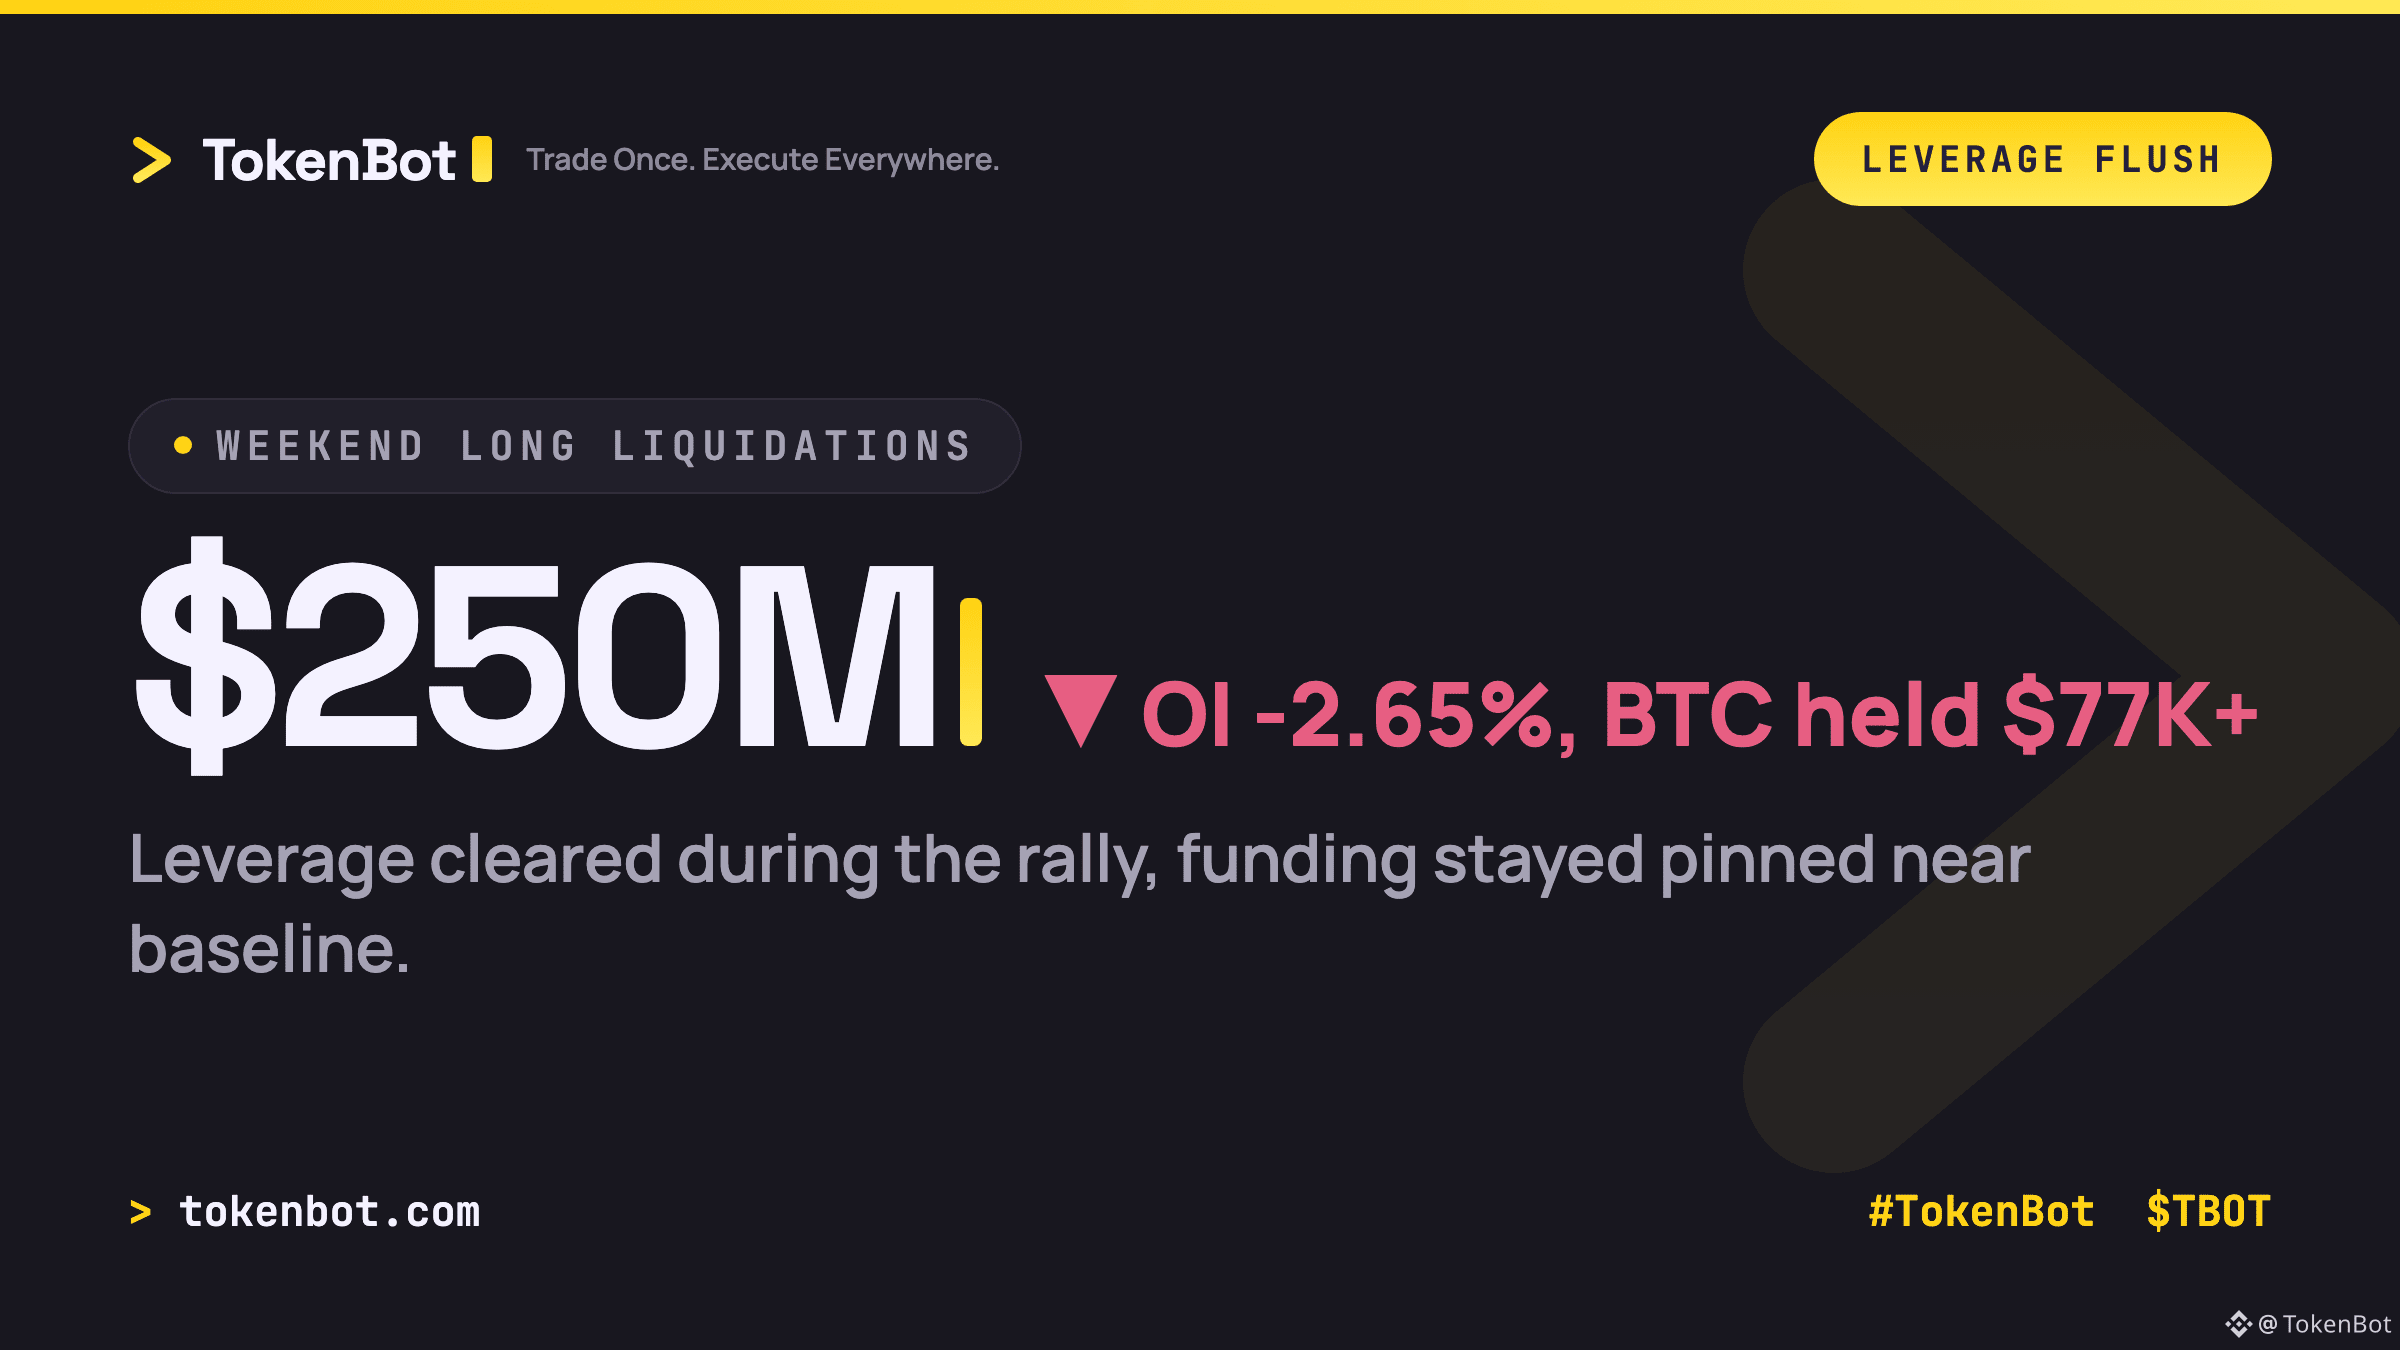
BTC ripped 21% this week, holding above $77K after the strongest weekend rally in months. But under the surface, the leverage picture looks nothing like a typical melt-up.
Over the weekend, $250M in leveraged long positions got liquidated. At the same time, Bitcoin futures open interest fell 2.65% to roughly $54.5B, and funding stayed pinned near the 0.01% baseline the whole way up (via @coinglass_com). That combination — price up, OI down, funding flat — means this move is being driven by spot demand and short covering, not fresh leverage piling onto longs. Rallies that clear leverage on the way up tend to have less unwind risk than ones that stack it, since there's no crowded long base waiting to get flushed on the first red candle.
The next real test is $80K, with Fed Chair Kevin Warsh's Friday Jackson Hole speech as the likely catalyst either way.
Do you trust a spot-led rally more than a leverage-driven one, or does thin OI just mean the move runs out of fuel faster?
#TokenBot #Bitcoin #algotrading $BTC $TBOT
tokenbot.com
Over the weekend, $250M in leveraged long positions got liquidated. At the same time, Bitcoin futures open interest fell 2.65% to roughly $54.5B, and funding stayed pinned near the 0.01% baseline the whole way up (via @coinglass_com). That combination — price up, OI down, funding flat — means this move is being driven by spot demand and short covering, not fresh leverage piling onto longs. Rallies that clear leverage on the way up tend to have less unwind risk than ones that stack it, since there's no crowded long base waiting to get flushed on the first red candle.
The next real test is $80K, with Fed Chair Kevin Warsh's Friday Jackson Hole speech as the likely catalyst either way.
Do you trust a spot-led rally more than a leverage-driven one, or does thin OI just mean the move runs out of fuel faster?
#TokenBot #Bitcoin #algotrading $BTC $TBOT
tokenbot.com
$2.99B in shorts got liquidated last week when ETH ripped 18% in a day, over 90% of that wipeout came from short positions getting run over. That's the kind of move that resets a market's memory fast.
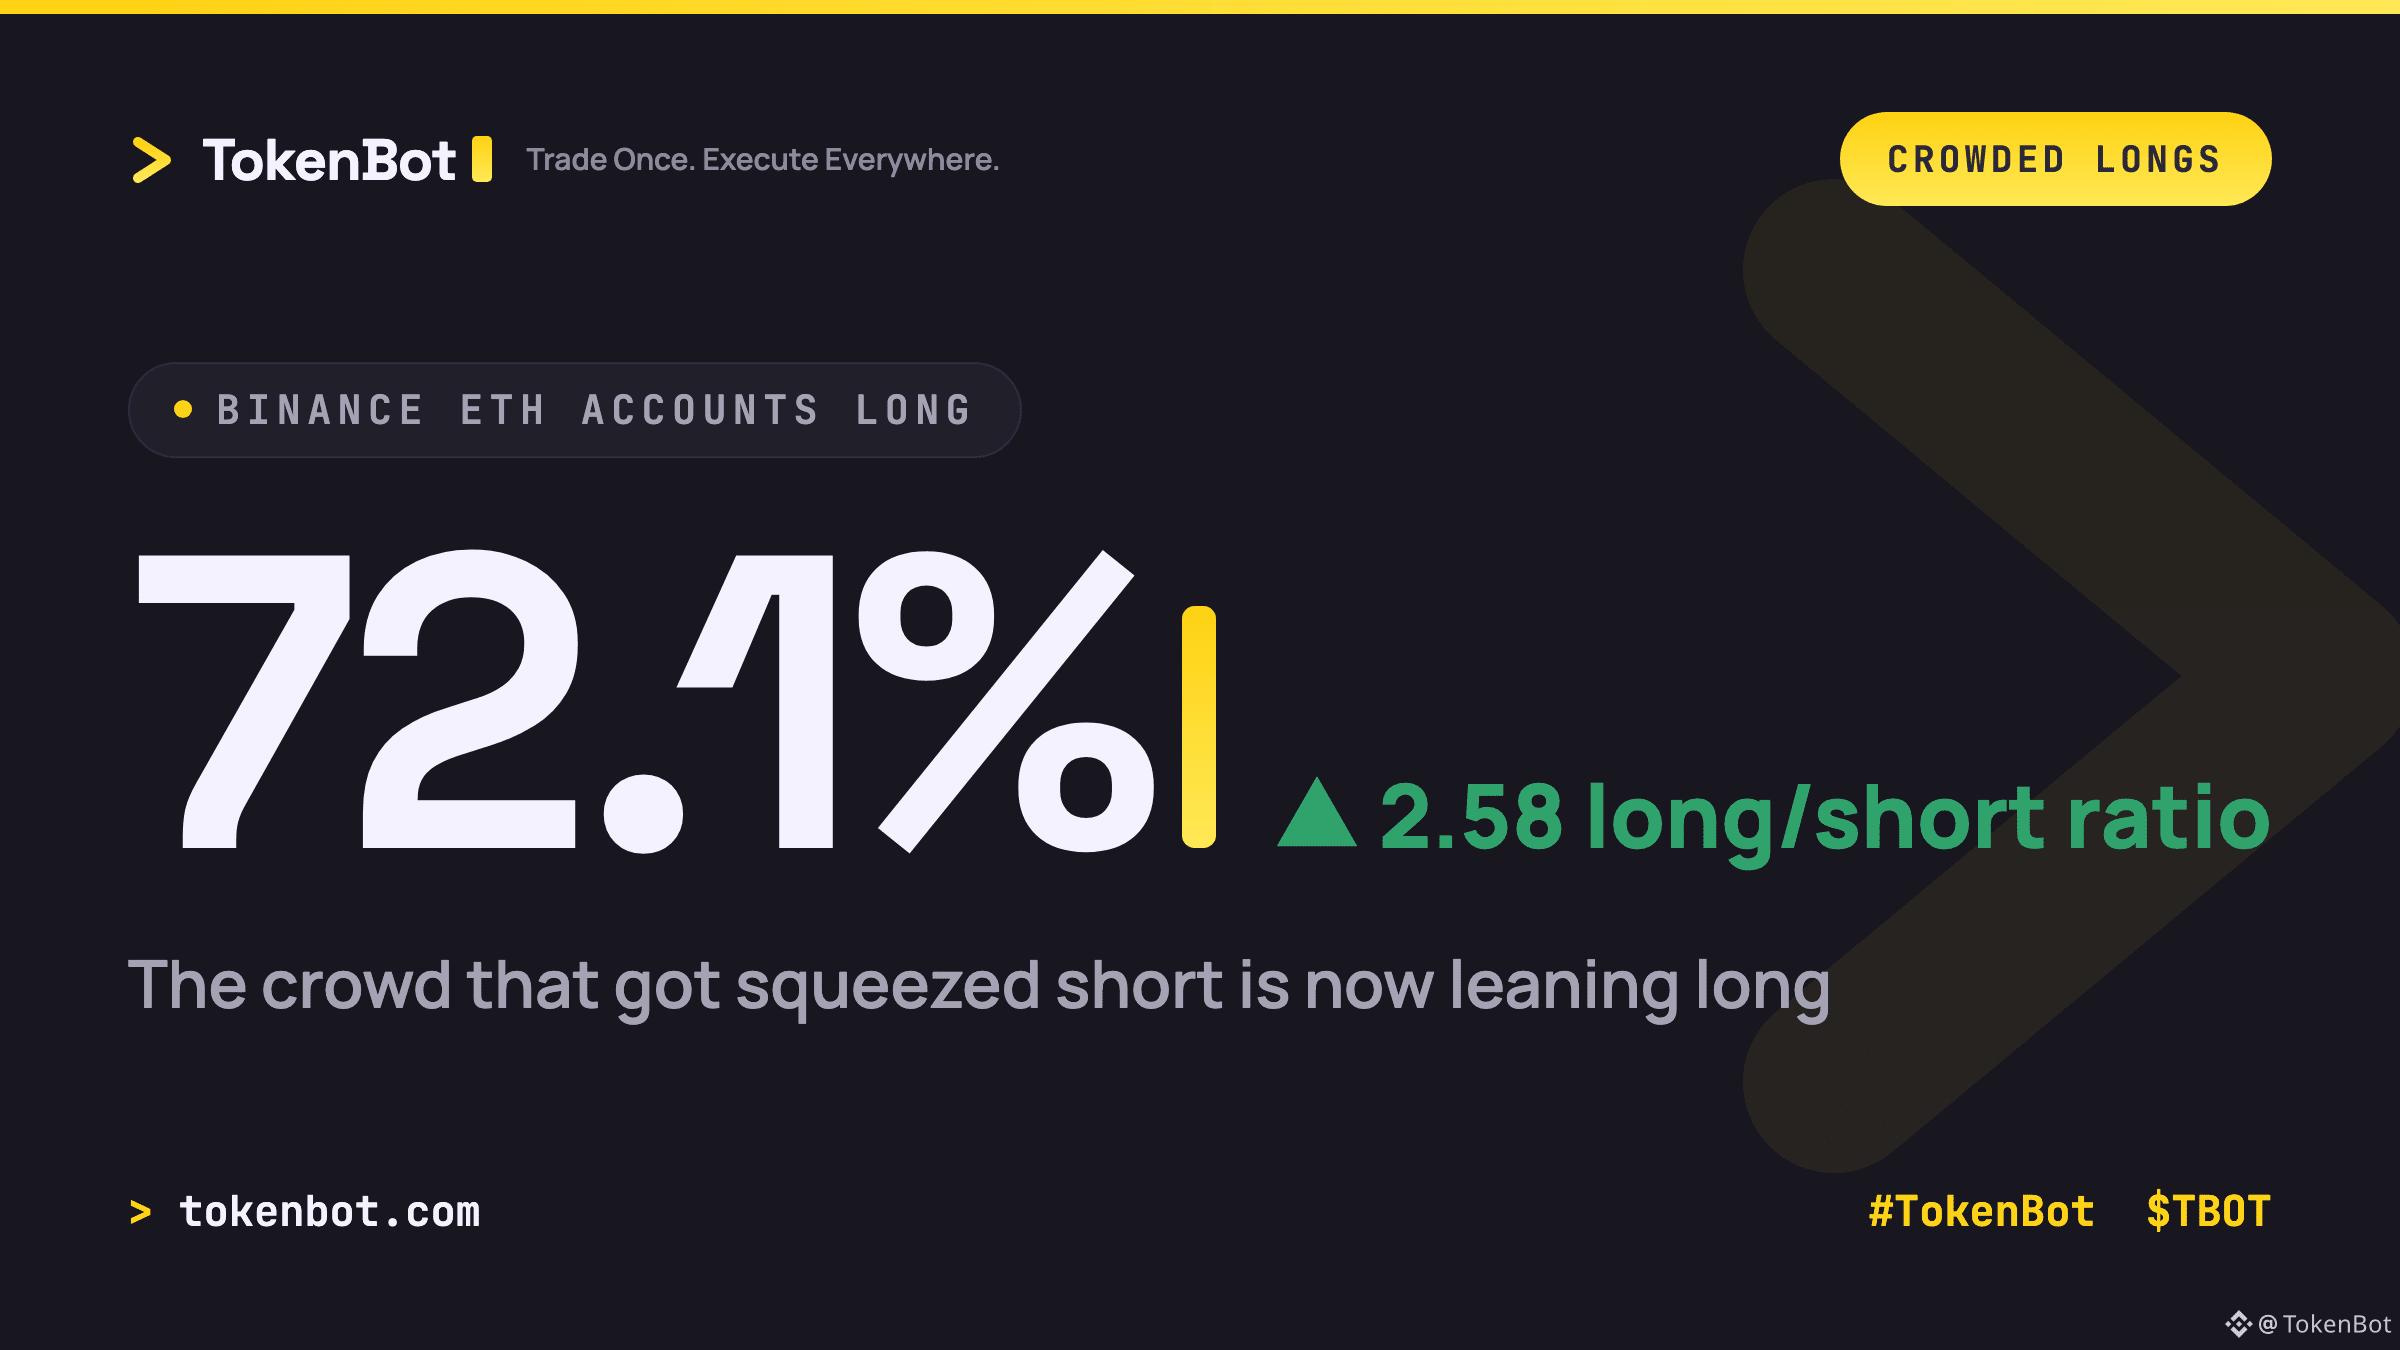
Except it didn't reset it evenly. Three days later, 72.1% of Binance ETH accounts are positioned long, a 2.58 long/short ratio. The same crowd that just got burned on one side has piled onto the other.
That's the setup to watch: if ETH loses $2,400, the unwind mechanics are the same ones that just wrecked shorts, just pointed the other way. Crowded positioning doesn't care which direction it's crowded in.
Anyone else trimming size after watching sentiment flip that hard in 72 hours? #Ethereum #Bitcoin #TradingSignals #TokenBot $ETH $BTC $TBOT
tokenbot.com
Except it didn't reset it evenly. Three days later, 72.1% of Binance ETH accounts are positioned long, a 2.58 long/short ratio. The same crowd that just got burned on one side has piled onto the other.
That's the setup to watch: if ETH loses $2,400, the unwind mechanics are the same ones that just wrecked shorts, just pointed the other way. Crowded positioning doesn't care which direction it's crowded in.
Anyone else trimming size after watching sentiment flip that hard in 72 hours? #Ethereum #Bitcoin #TradingSignals #TokenBot $ETH $BTC $TBOT
tokenbot.com
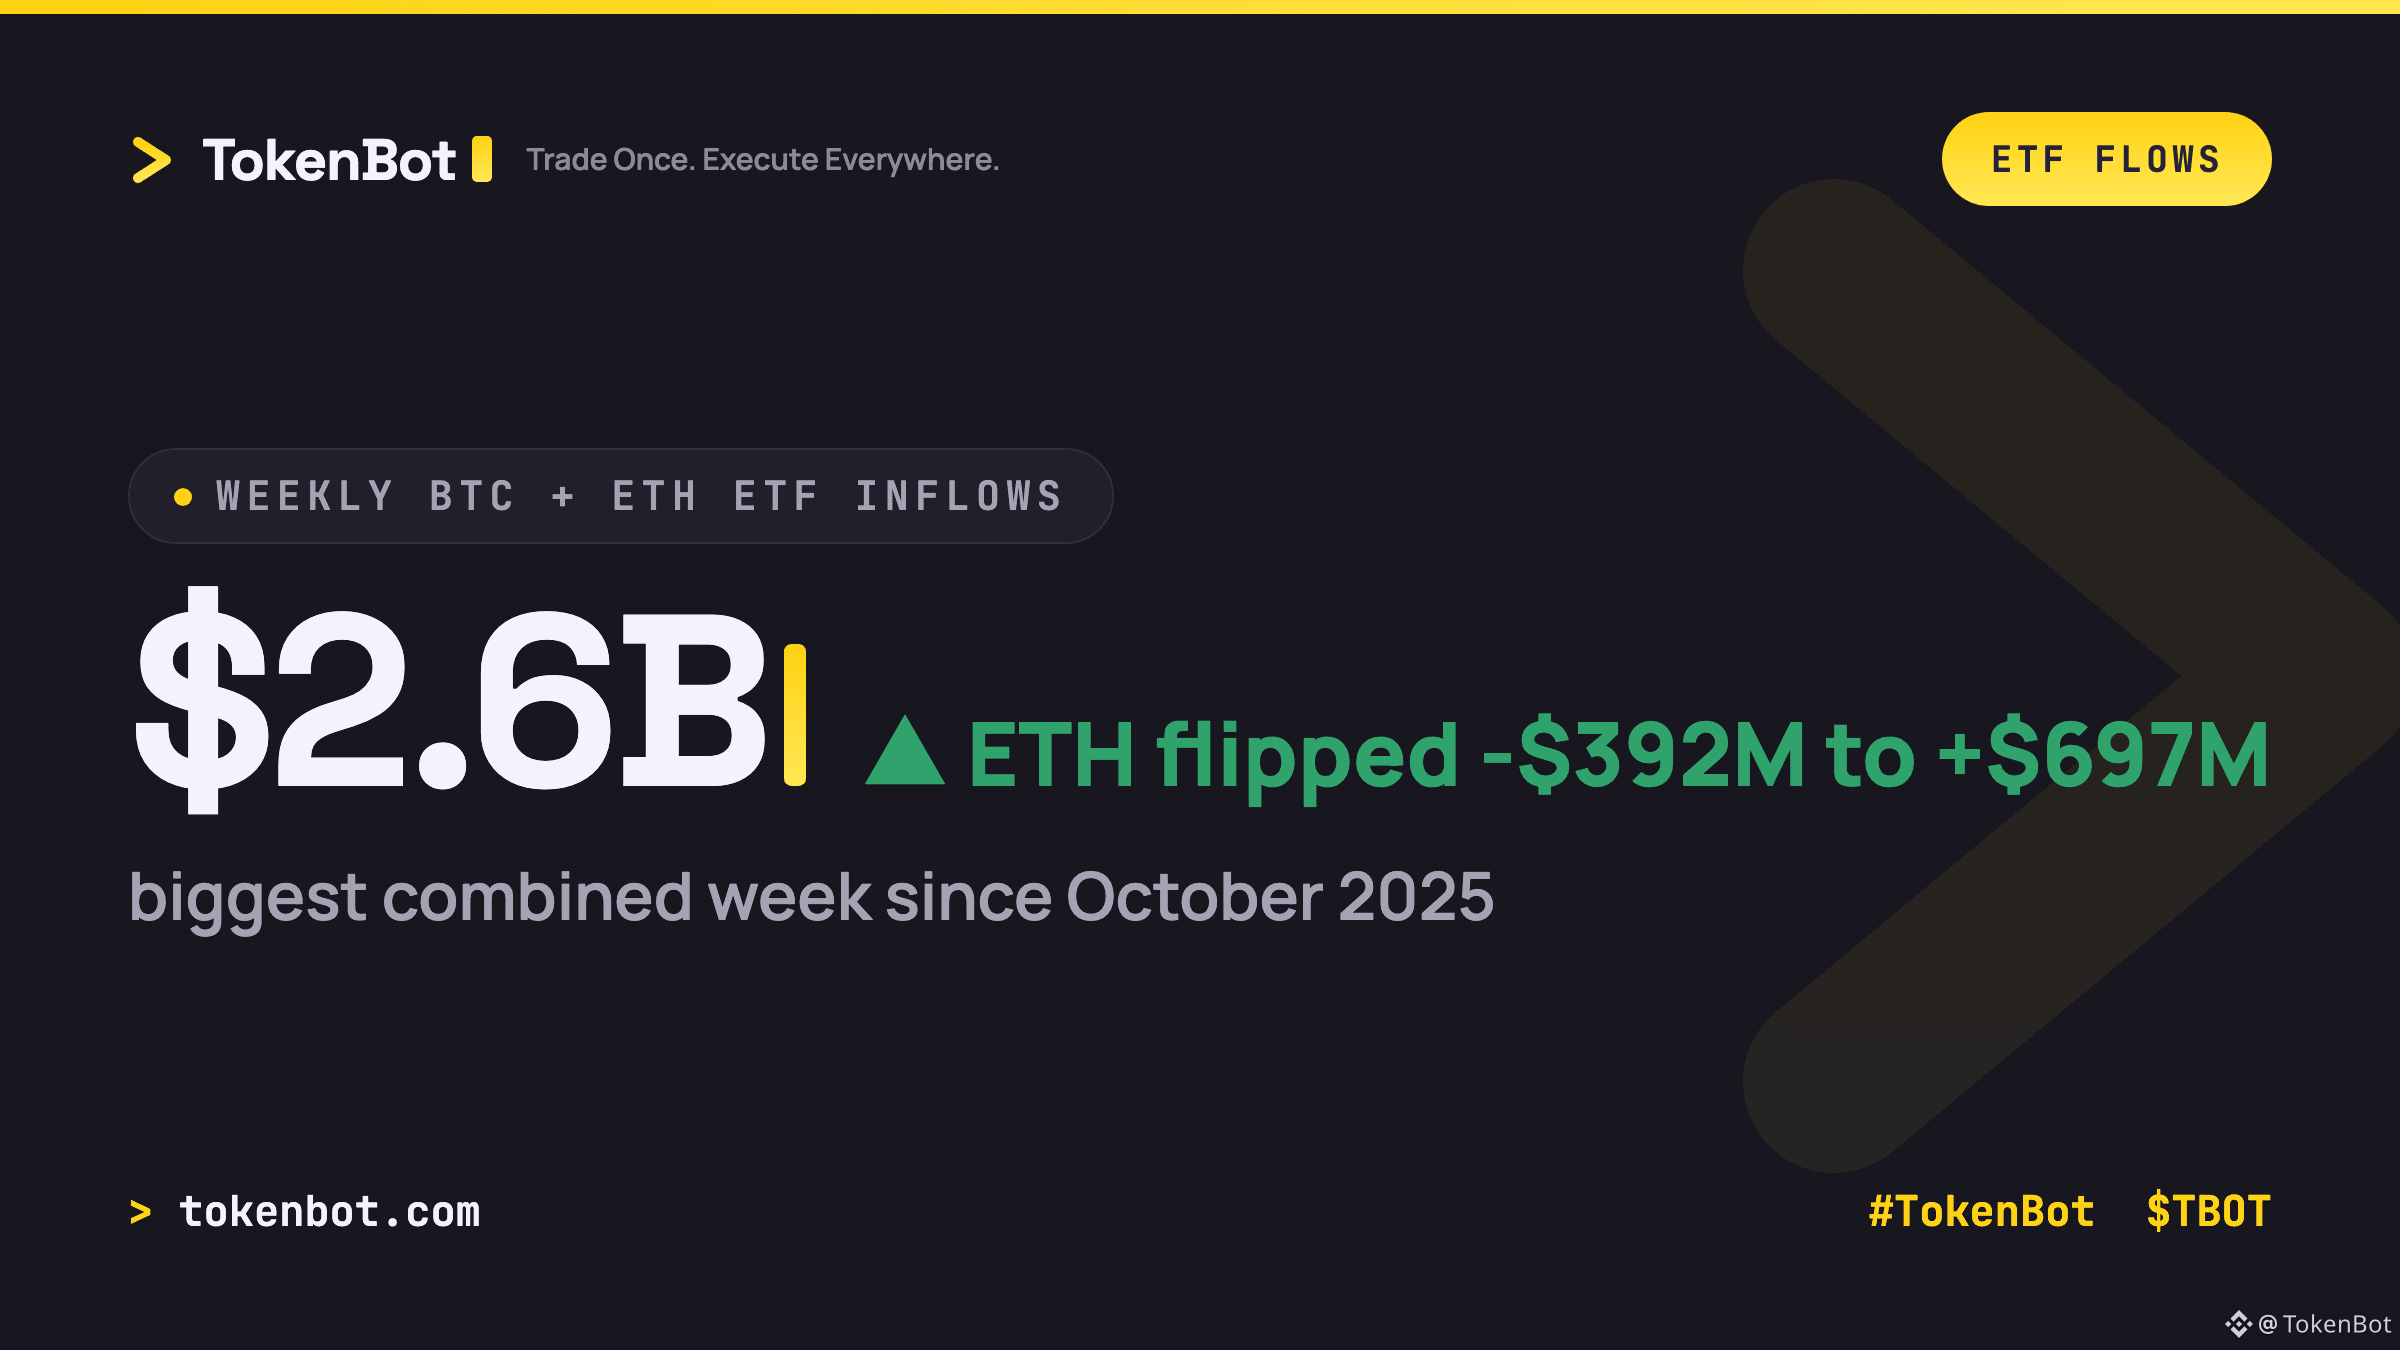
$2.6B poured into US spot BTC and ETH ETFs in the week ended August 21, the biggest combined haul since October 2025. Bitcoin funds took in $1.92B on five straight days of inflows (including a $606M single-day print on August 20), while ETH funds reversed hard, flipping from a $392M outflow the prior week to a $697M inflow — the fastest sentiment swing in the sector this year.
The driver isn't a chart pattern, it's Washington. Trump's push for the Clarity Act at last week's White House crypto meeting is what lit the rally, and the bill now faces a procedural vote in the Senate on September 15. That's the real level to watch: this move is a policy trade with a hard deadline, not a clean technical breakout. If the vote slips or the ethics-provision dispute drags on, the flows that just came in are the flows most likely to reverse first.
Are you treating this as a trend to ride or a binary event to hedge into September 15?
$BTC $ETH $TBOT #TokenBot #Crypto #TradingSignals
tokenbot.com
The driver isn't a chart pattern, it's Washington. Trump's push for the Clarity Act at last week's White House crypto meeting is what lit the rally, and the bill now faces a procedural vote in the Senate on September 15. That's the real level to watch: this move is a policy trade with a hard deadline, not a clean technical breakout. If the vote slips or the ethics-provision dispute drags on, the flows that just came in are the flows most likely to reverse first.
Are you treating this as a trend to ride or a binary event to hedge into September 15?
$BTC $ETH $TBOT #TokenBot #Crypto #TradingSignals
tokenbot.com
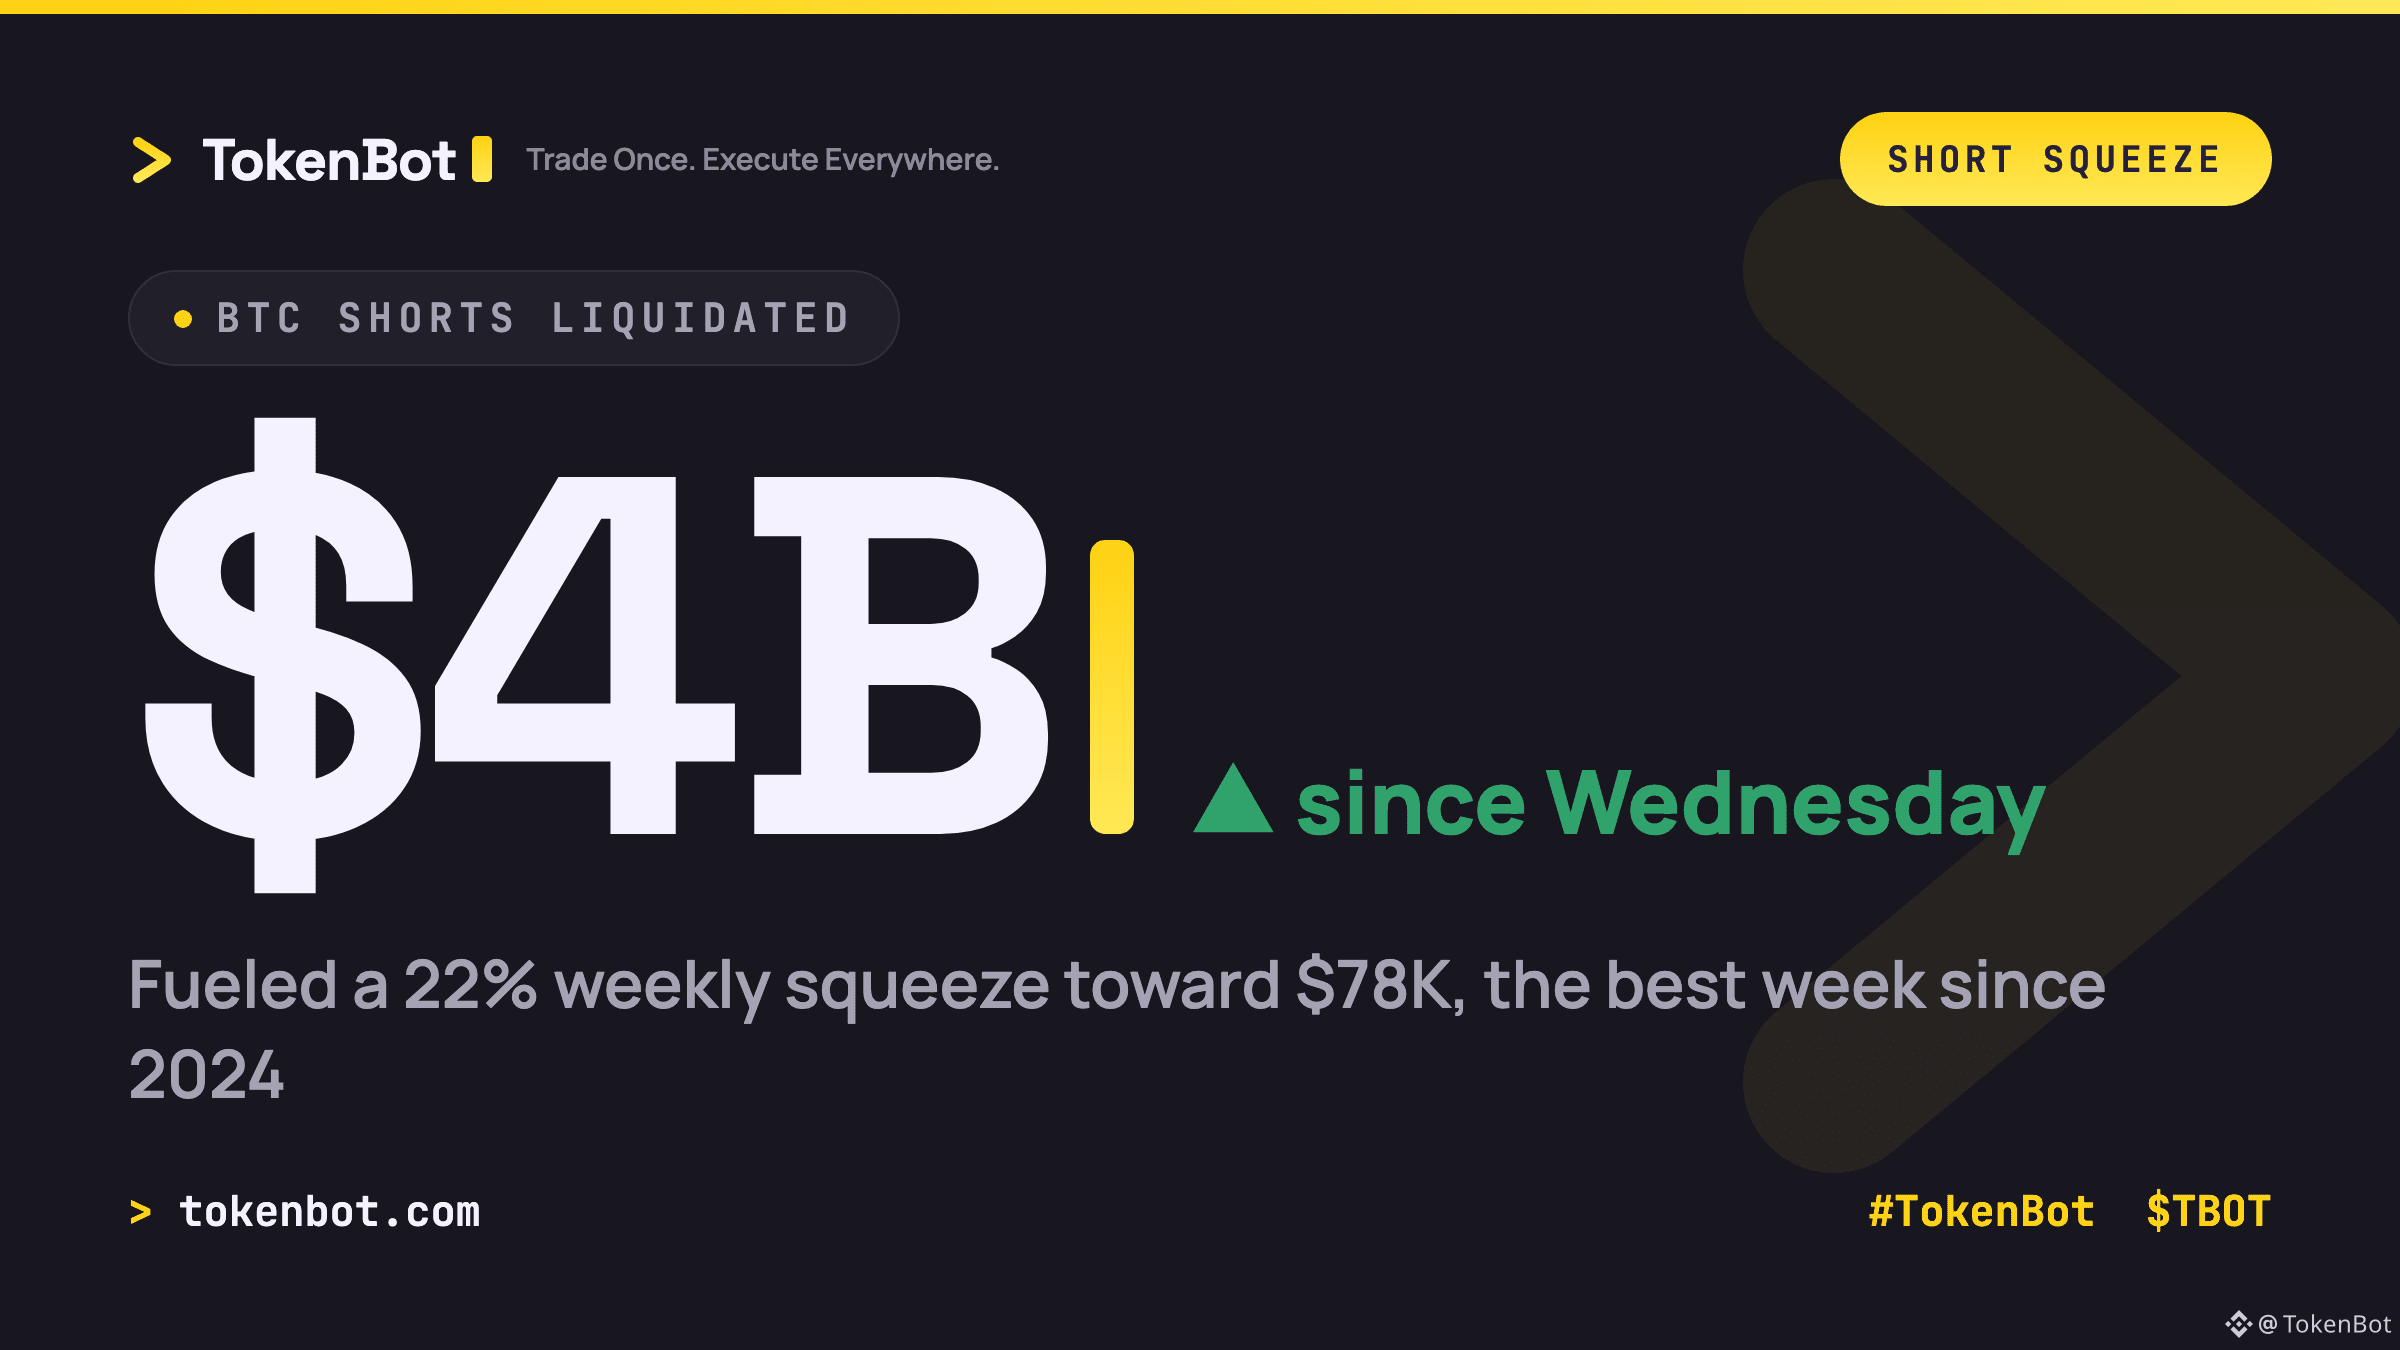
$4B in BTC shorts got liquidated since Wednesday, the fuel behind this week's 22% squeeze toward $78K — the best week for Bitcoin since 2024 (via @coinglass_com).
Here's the mechanism: forced short covering doesn't need new buyers to show up, it just needs shorts to get margin-called, and their buy-to-close orders do the rest. That's exactly what's been driving price since Wednesday's Treasury buyback news and the fresh push on the Clarity Act.
The catch is that fuel source is finite. Funding has flipped solidly positive and longs are now the crowded side of the trade. Once the forced-cover flow dries up, the next leg past $80K has to come from real spot demand, not more liquidations doing the buying for free.
Worth remembering on a tape like this: broadcasting one order across venues instead of chasing the fastest book matters more when volatility spikes this fast.
Still fading this move, or is $80K just a matter of time now? $BTC $TBOT #Bitcoin #TokenBot #TradingSignals
tokenbot.com
Here's the mechanism: forced short covering doesn't need new buyers to show up, it just needs shorts to get margin-called, and their buy-to-close orders do the rest. That's exactly what's been driving price since Wednesday's Treasury buyback news and the fresh push on the Clarity Act.
The catch is that fuel source is finite. Funding has flipped solidly positive and longs are now the crowded side of the trade. Once the forced-cover flow dries up, the next leg past $80K has to come from real spot demand, not more liquidations doing the buying for free.
Worth remembering on a tape like this: broadcasting one order across venues instead of chasing the fastest book matters more when volatility spikes this fast.
Still fading this move, or is $80K just a matter of time now? $BTC $TBOT #Bitcoin #TokenBot #TradingSignals
tokenbot.com
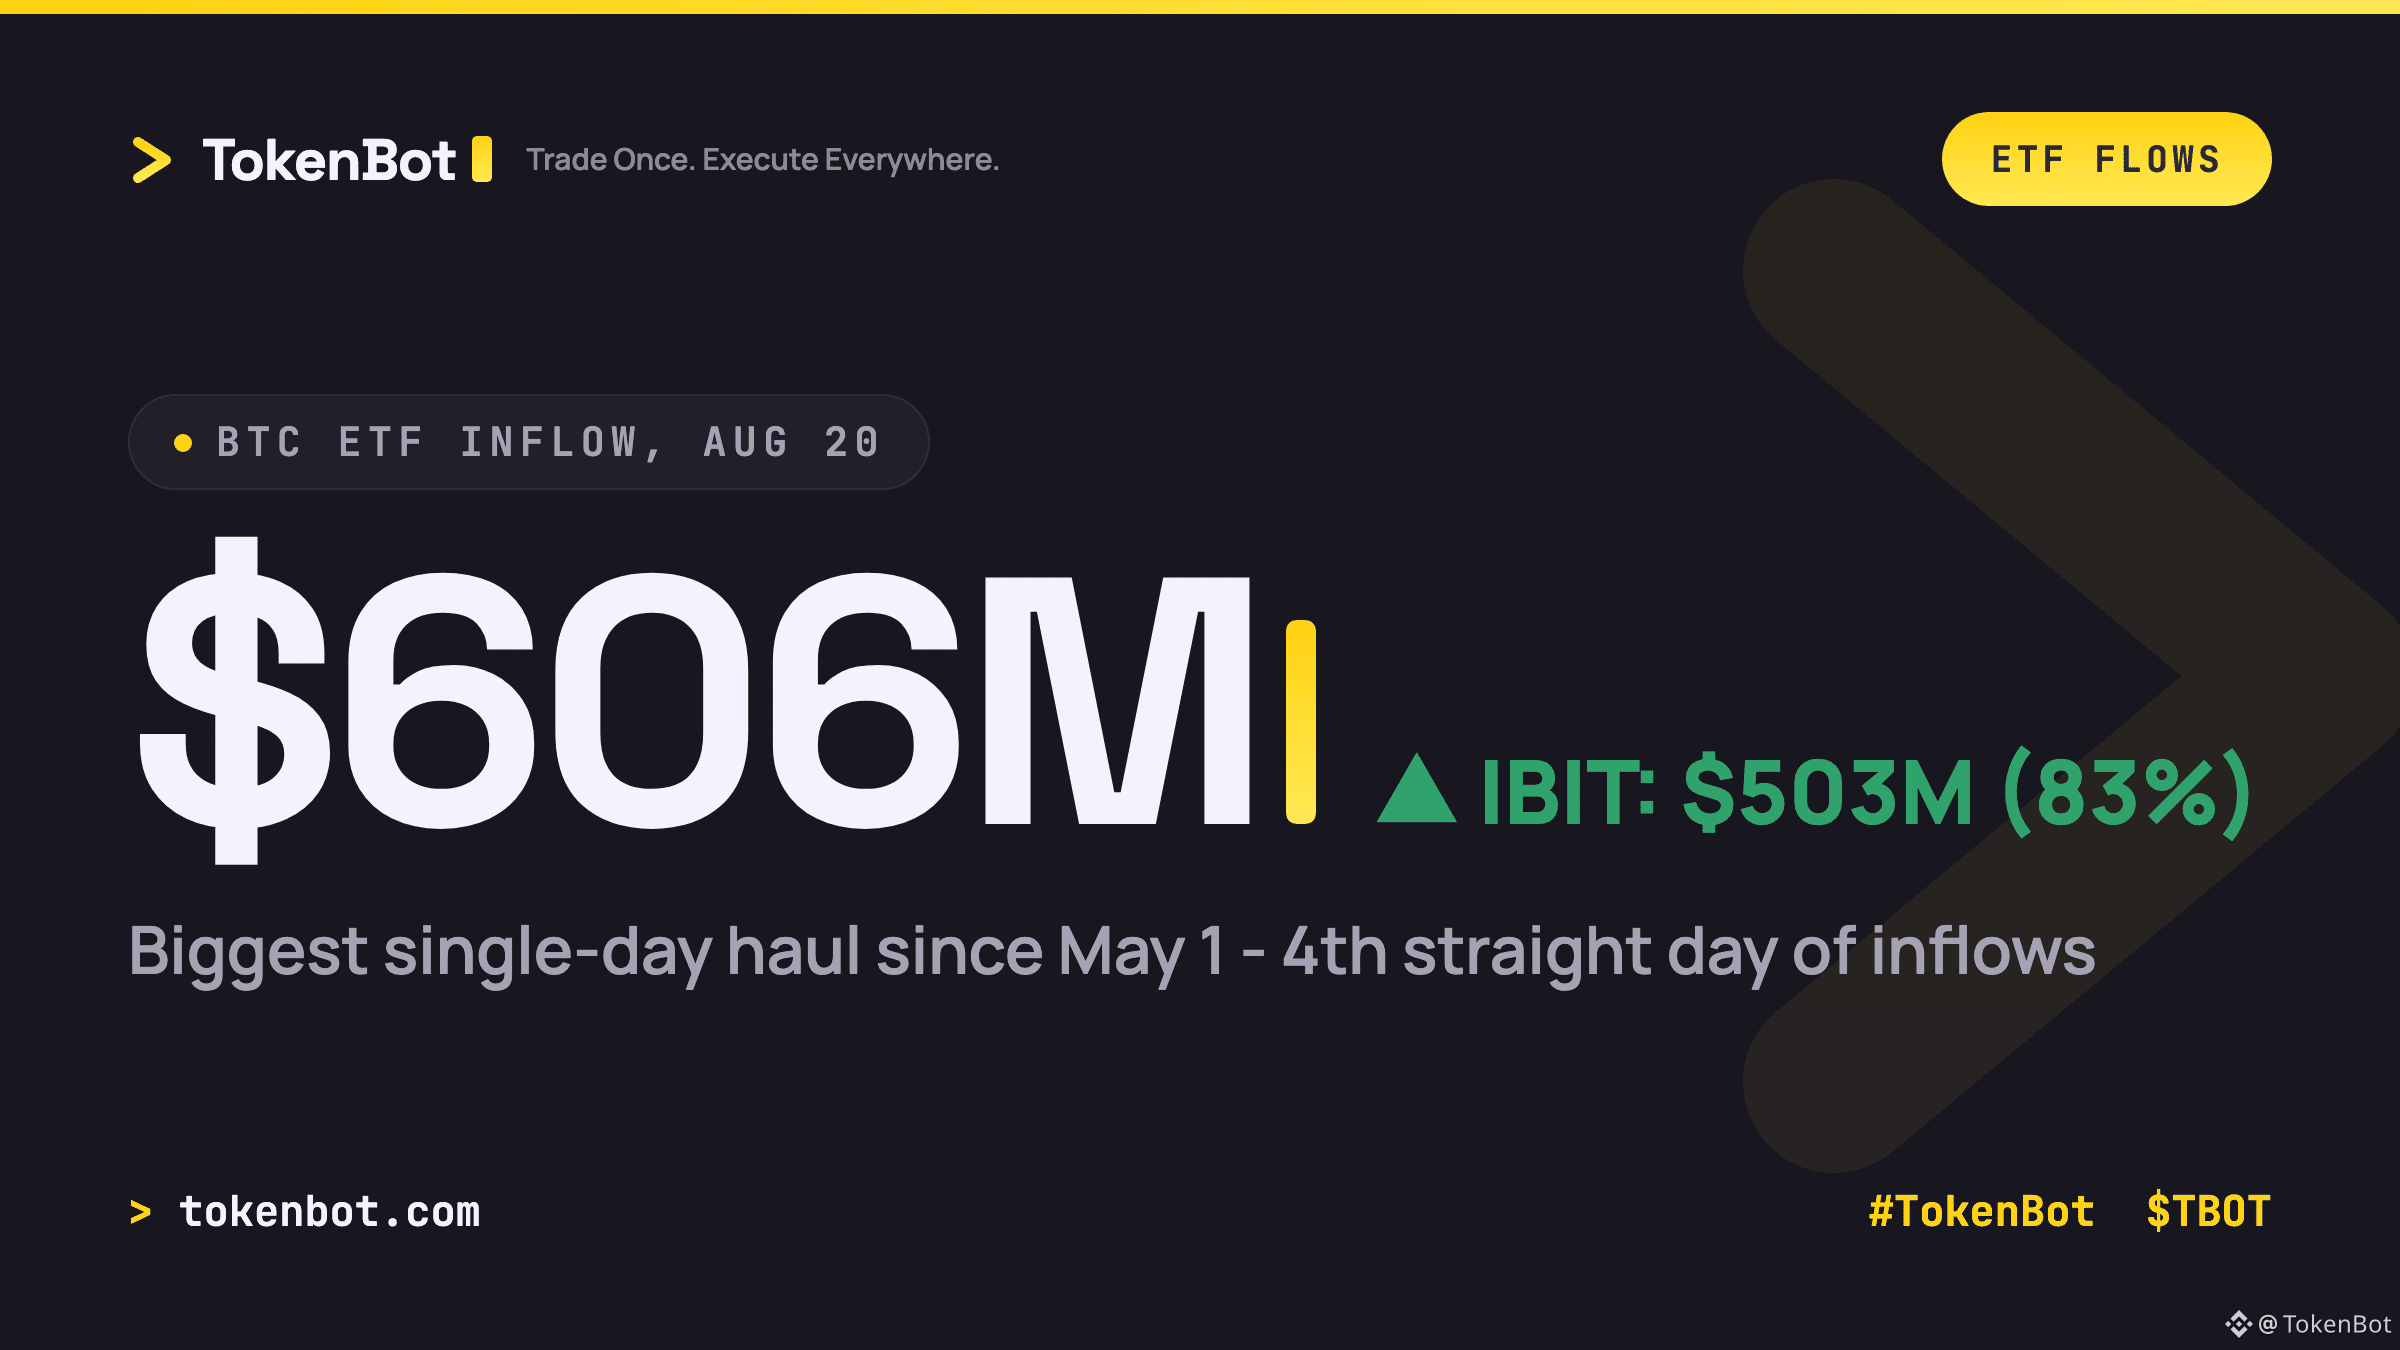
Wednesday's Bitcoin ETF inflow hit $606.29M — the biggest single day since May 1, and BlackRock's IBIT was responsible for $502.99M of it. That's 83% of the entire day's demand sitting inside one fund.
Fidelity's FBTC added another $64.74M, while VanEck's HODL saw a small $3.59M outflow. It's now four straight days of net inflows, pushing the four-day total to roughly $1.61B — one day after crypto absorbed a $2.77B leveraged long liquidation wave.
The read: IBIT isn't just leading the category anymore, it IS the category on days like this. That's a fragile setup if allocation keeps concentrating — one large redemption could move spot markets more than any single derivatives desk.
Worth tracking: how much of BTC's rebound above $77K is organic spot demand versus flow parked in a single wrapper?
Trade the same setups across venues in one broadcast — tokenbot.com
#Bitcoin #Crypto #TradingSignals #TokenBot $BTC $TBOT
Fidelity's FBTC added another $64.74M, while VanEck's HODL saw a small $3.59M outflow. It's now four straight days of net inflows, pushing the four-day total to roughly $1.61B — one day after crypto absorbed a $2.77B leveraged long liquidation wave.
The read: IBIT isn't just leading the category anymore, it IS the category on days like this. That's a fragile setup if allocation keeps concentrating — one large redemption could move spot markets more than any single derivatives desk.
Worth tracking: how much of BTC's rebound above $77K is organic spot demand versus flow parked in a single wrapper?
Trade the same setups across venues in one broadcast — tokenbot.com
#Bitcoin #Crypto #TradingSignals #TokenBot $BTC $TBOT
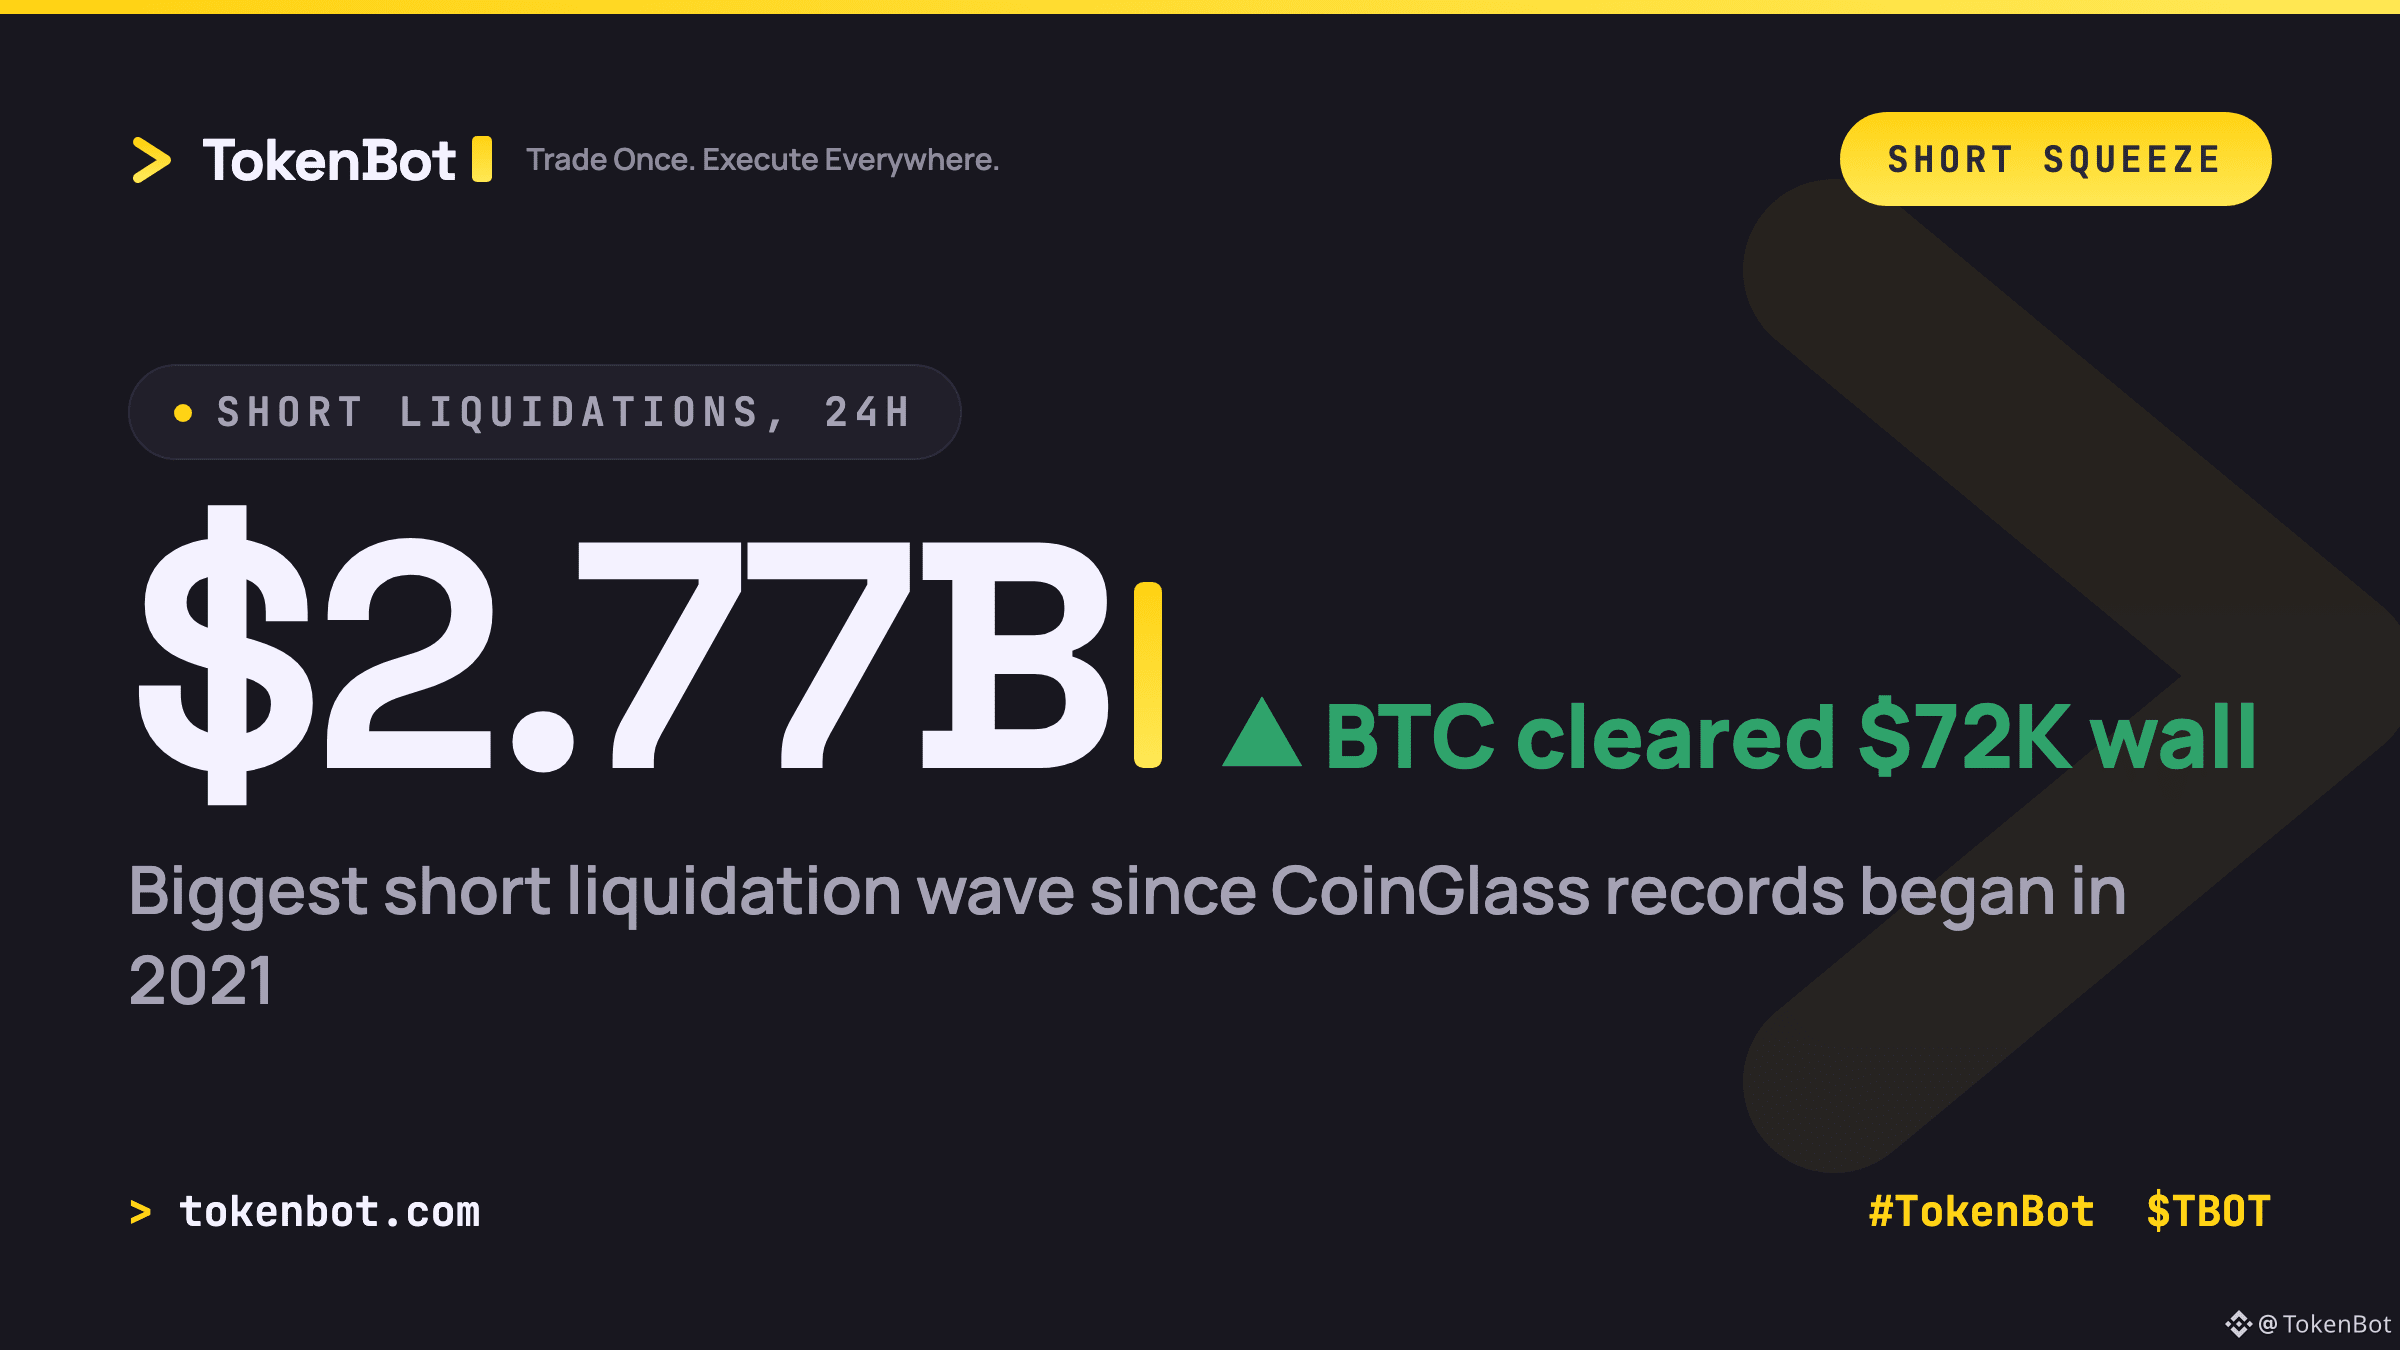
CoinGlass just logged its biggest short liquidation wave since its 2021 records began: $2.77B in shorts wiped out in a single day, via @coinglass_com.
The mechanism is simple. Six weeks of range-bound chop under $72K let short sellers stack stops in a dense band just above resistance. Once $BTC cleared $72K on Wednesday, that wall of stops became the fuel for the next leg — forced buying cascaded, and bitcoin ran straight to $78K. Another $1B in shorts got run over today with BTC still holding near $77K.
This is the same pattern every consolidation-to-breakout move follows: the crowd that's positioned against the range becomes the crowd that pays for the range to break. The traders who survive aren't the ones predicting direction — they're the ones who know exactly where the stop-wall sits before price gets there.
Where do you think the next stop-wall stacks up from here?
Broadcast your next order across every venue at once with TokenBot — tokenbot.com
#TokenBot #Bitcoin #TradingSignals #CryptoDerivatives #BTC $TBOT
The mechanism is simple. Six weeks of range-bound chop under $72K let short sellers stack stops in a dense band just above resistance. Once $BTC cleared $72K on Wednesday, that wall of stops became the fuel for the next leg — forced buying cascaded, and bitcoin ran straight to $78K. Another $1B in shorts got run over today with BTC still holding near $77K.
This is the same pattern every consolidation-to-breakout move follows: the crowd that's positioned against the range becomes the crowd that pays for the range to break. The traders who survive aren't the ones predicting direction — they're the ones who know exactly where the stop-wall sits before price gets there.
Where do you think the next stop-wall stacks up from here?
Broadcast your next order across every venue at once with TokenBot — tokenbot.com
#TokenBot #Bitcoin #TradingSignals #CryptoDerivatives #BTC $TBOT
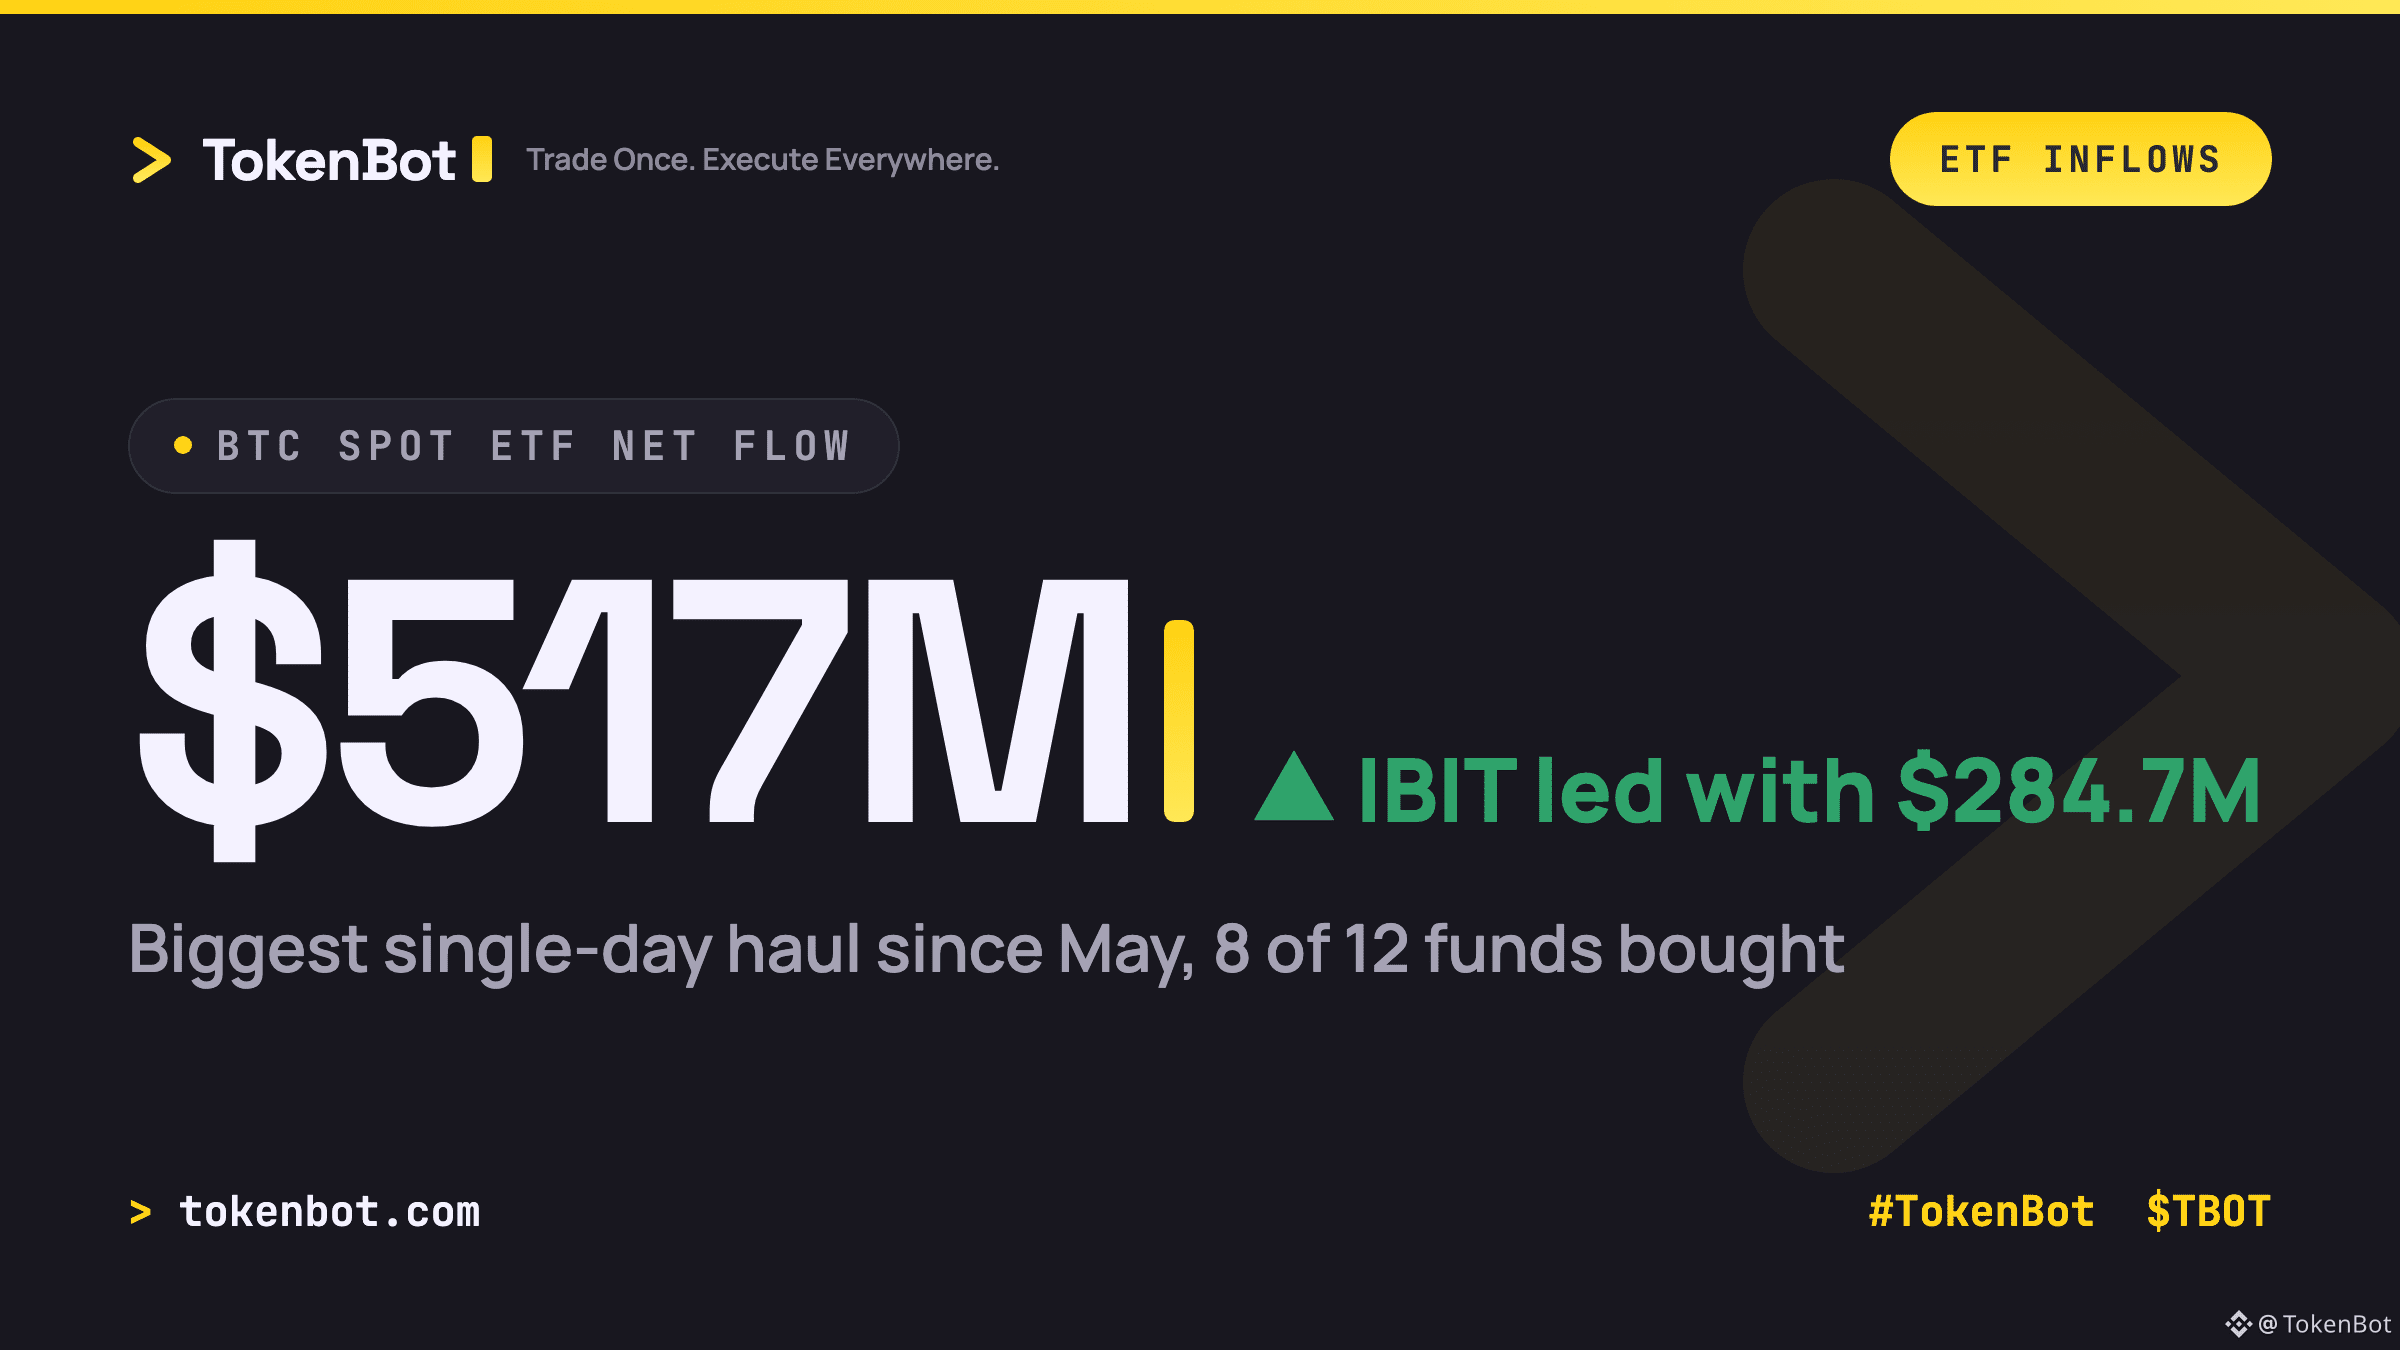
Spot Bitcoin ETFs pulled in $517M on Wednesday, the biggest single-day haul since May, and this wasn't a one-fund story. 8 of 12 US Bitcoin ETFs posted inflows, with BlackRock's IBIT leading at $284.7M, ARKB adding $77.7M and FBTC at $62.4M (via @SoSoValueCrypto). Ether ETFs joined in too, taking in $189M, their largest single-day inflow since October.
The mechanism matters here. Broad participation across 8 separate funds looks a lot more like real allocators putting capital to work than a single desk chasing a headline. That's a different buyer profile than the leveraged shorts getting squeezed out on the derivatives side, and it tends to be stickier.
Worth watching whether this inflow pace holds through the week or fades once the initial move cools off. Do you weight broad ETF breadth as a stronger signal than a single day's flow total, or does the aggregate number matter more to you?
$BTC $ETH $TBOT #Bitcoin #Ethereum #TokenBot #CryptoETF
Trade the move across 25+ exchanges at once: tokenbot.com
The mechanism matters here. Broad participation across 8 separate funds looks a lot more like real allocators putting capital to work than a single desk chasing a headline. That's a different buyer profile than the leveraged shorts getting squeezed out on the derivatives side, and it tends to be stickier.
Worth watching whether this inflow pace holds through the week or fades once the initial move cools off. Do you weight broad ETF breadth as a stronger signal than a single day's flow total, or does the aggregate number matter more to you?
$BTC $ETH $TBOT #Bitcoin #Ethereum #TokenBot #CryptoETF
Trade the move across 25+ exchanges at once: tokenbot.com
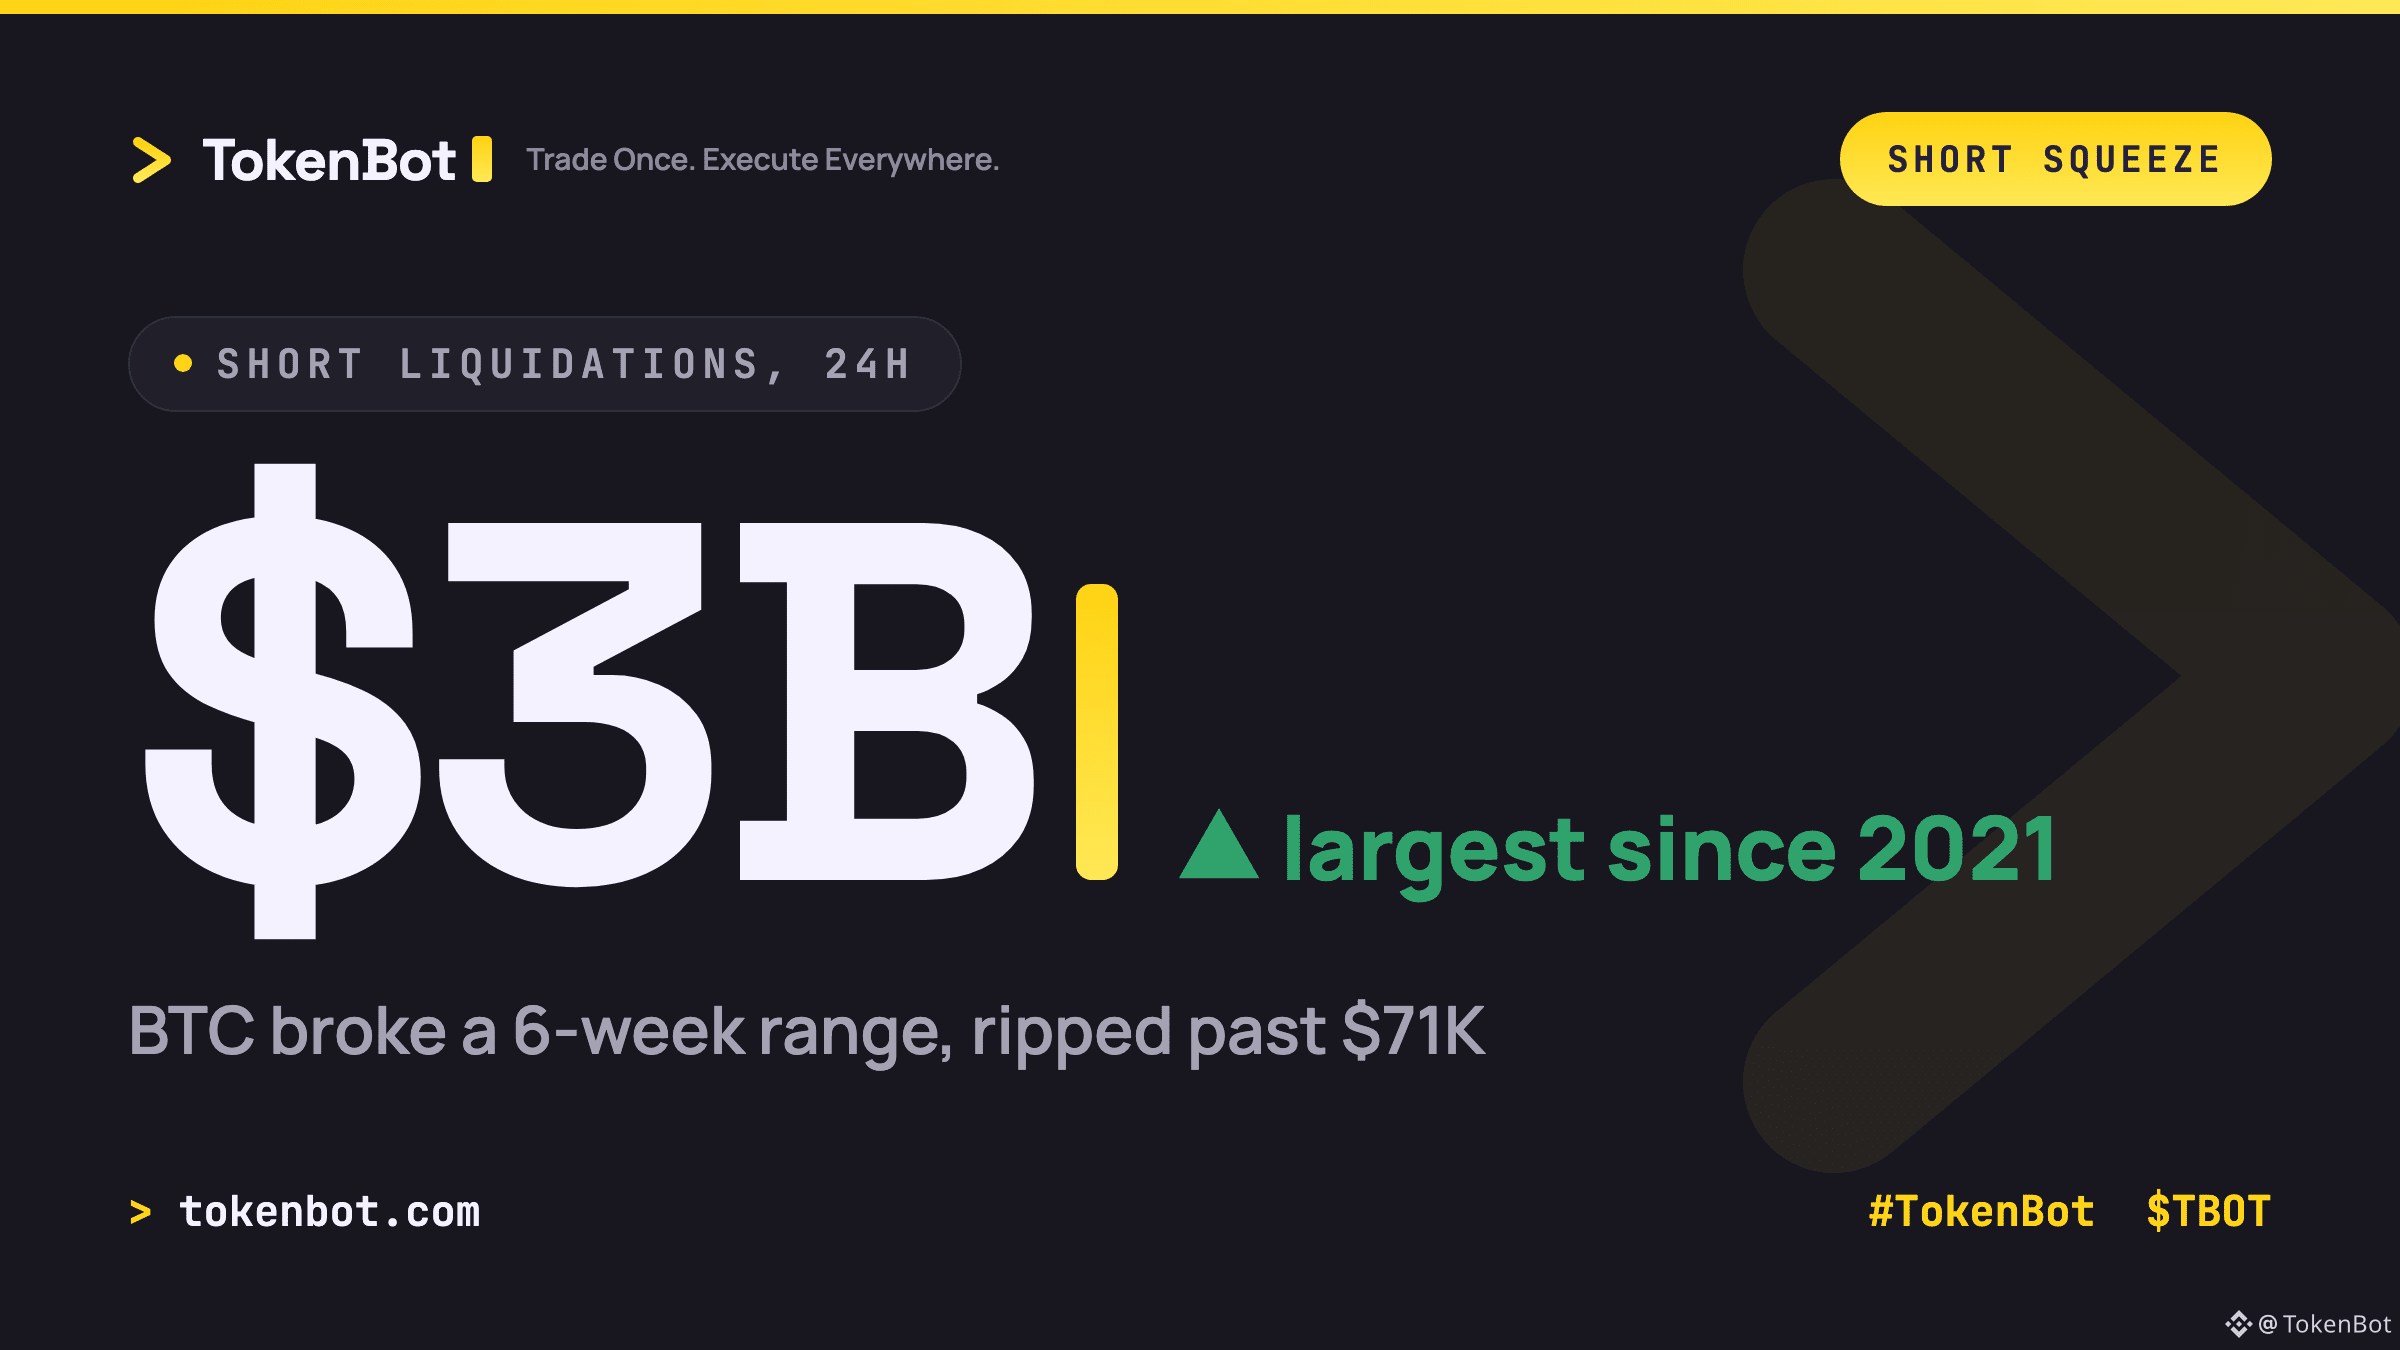
BTC just broke out of the six-week range it had been pinned in ($62K-$67K) and ripped past $71K — and it took $3 billion of leveraged shorts down with it. About 92% of the day's liquidations were short-side, roughly $2.77B, making it the largest short-squeeze wave CoinGlass has recorded since it started tracking in 2021.
The mechanism is the part worth watching: the market was crowded short into a low-volatility range, so once price broke resistance, liquidation engines started force-buying those positions back. Over $1B of BTC shorts closed in a single hour, and each forced buy pushed price higher, triggering the next batch — a self-reinforcing cascade rather than organic spot demand.
Catalyst behind the move was the U.S. Treasury doubling its long-bond buyback size (from $2B to $4B per operation), which pulled the 30-year yield down and got risk assets bid.
When a liquidation cascade does more of the work than real buyers, how much of the move do you expect to hold once the forced-buying runs out?
$BTC $TBOT #Bitcoin #TokenBot #TradingSignals
tokenbot.com
The mechanism is the part worth watching: the market was crowded short into a low-volatility range, so once price broke resistance, liquidation engines started force-buying those positions back. Over $1B of BTC shorts closed in a single hour, and each forced buy pushed price higher, triggering the next batch — a self-reinforcing cascade rather than organic spot demand.
Catalyst behind the move was the U.S. Treasury doubling its long-bond buyback size (from $2B to $4B per operation), which pulled the 30-year yield down and got risk assets bid.
When a liquidation cascade does more of the work than real buyers, how much of the move do you expect to hold once the forced-buying runs out?
$BTC $TBOT #Bitcoin #TokenBot #TradingSignals
tokenbot.com
තවත් අන්තර්ගතයන් ගවේෂණය කිරීමට ඇතුල් වන්න