
TargetCoins
1.2k පෝස්ටු

TargetCoins
වාර්තා කරන්න
පරිශීලක අවහිර කරන්න
Crypto market insights | Price action & structure | Liquidity, trends & risk zones | No hype, just clean analysis 📊 X : Targetcoins
අධි-සංඛ්යාත වෙළෙන්දා
{වේලාව} වසර
61 හඹා යමින්
7.3K+ හඹා යන්නන්
5.8K+ කැමති විය
පෝස්ටු
සියල්ල
උපුටා දැක්වීම්
වීඩියෝ
සජීවි
අමුණා ඇත
·
--
උසබ තත්ත්වය
🚨 New to Crypto? Read This Before You Lose Your First Trade
Most beginners think crypto trading is: 📈 Buy low
📉 Sell high
💰 Get rich fast
That’s the biggest lie in crypto.
Here’s what beginners REALLY need to understand 👇
---
🧠 Lesson #1: Charts Don’t Predict the Future
Technical Analysis doesn’t tell you what will happen.
It only shows probabilities.
That’s why:
Perfect setups fail
Random coins sometimes pump
---
🧠 Lesson #2: Market Is Controlled by Liquidity
Price doesn’t move because of indicators.
Price moves because big money needs liquidity.
Where is liquidity?
Above highs
Below lows
Where retail puts stop losses 👀
---
🧠 Lesson #3: News Can Destroy Any Setup
One headline can erase:
Your trendline
Your support
Your confidence 😅
Always check: 🌍 Global news
🏦 Fed announcements
⚖️ Regulations
🔐 Hacks & exploits
---
🧠 Lesson #4: Overtrading Kills Accounts
More trades ≠ more profit
More trades = more fees + more mistakes
Sometimes the best trade is no trade.
---
🧠 Lesson #5: Risk Management Is Everything
You don’t need: ❌ High leverage
❌ 10 indicators
❌ Perfect entries
You NEED: ✅ Stop loss
✅ Small position size
✅ Capital protection
Survive first. Profit comes later.
---
🎯 Beginner Rule of Thumb
Trade small
Trade slow
Learn every loss
Protect capital like gold
If you survive the market,
the market will eventually pay you.
👉 If you’re a beginner, save this post.
👉 If you’re experienced, you learned this the hard way 😉
#CryptoEducation
$BTC
{future}(BTCUSDT)
$ETH
{future}(ETHUSDT)
$XRP
{future}(XRPUSDT)
🚨 New to Crypto? Read This Before You Lose Your First Trade
Most beginners think crypto trading is: 📈 Buy low
📉 Sell high
💰 Get rich fast
That’s the biggest lie in crypto.
Here’s what beginners REALLY need to understand 👇
---
🧠 Lesson #1: Charts Don’t Predict the Future
Technical Analysis doesn’t tell you what will happen.
It only shows probabilities.
That’s why:
Perfect setups fail
Random coins sometimes pump
---
🧠 Lesson #2: Market Is Controlled by Liquidity
Price doesn’t move because of indicators.
Price moves because big money needs liquidity.
Where is liquidity?
Above highs
Below lows
Where retail puts stop losses 👀
---
🧠 Lesson #3: News Can Destroy Any Setup
One headline can erase:
Your trendline
Your support
Your confidence 😅
Always check: 🌍 Global news
🏦 Fed announcements
⚖️ Regulations
🔐 Hacks & exploits
---
🧠 Lesson #4: Overtrading Kills Accounts
More trades ≠ more profit
More trades = more fees + more mistakes
Sometimes the best trade is no trade.
---
🧠 Lesson #5: Risk Management Is Everything
You don’t need: ❌ High leverage
❌ 10 indicators
❌ Perfect entries
You NEED: ✅ Stop loss
✅ Small position size
✅ Capital protection
Survive first. Profit comes later.
---
🎯 Beginner Rule of Thumb
Trade small
Trade slow
Learn every loss
Protect capital like gold
If you survive the market,
the market will eventually pay you.
👉 If you’re a beginner, save this post.
👉 If you’re experienced, you learned this the hard way 😉
#CryptoEducation
$BTC
$ETH
$XRP
Most beginners think crypto trading is: 📈 Buy low
📉 Sell high
💰 Get rich fast
That’s the biggest lie in crypto.
Here’s what beginners REALLY need to understand 👇
---
🧠 Lesson #1: Charts Don’t Predict the Future
Technical Analysis doesn’t tell you what will happen.
It only shows probabilities.
That’s why:
Perfect setups fail
Random coins sometimes pump
---
🧠 Lesson #2: Market Is Controlled by Liquidity
Price doesn’t move because of indicators.
Price moves because big money needs liquidity.
Where is liquidity?
Above highs
Below lows
Where retail puts stop losses 👀
---
🧠 Lesson #3: News Can Destroy Any Setup
One headline can erase:
Your trendline
Your support
Your confidence 😅
Always check: 🌍 Global news
🏦 Fed announcements
⚖️ Regulations
🔐 Hacks & exploits
---
🧠 Lesson #4: Overtrading Kills Accounts
More trades ≠ more profit
More trades = more fees + more mistakes
Sometimes the best trade is no trade.
---
🧠 Lesson #5: Risk Management Is Everything
You don’t need: ❌ High leverage
❌ 10 indicators
❌ Perfect entries
You NEED: ✅ Stop loss
✅ Small position size
✅ Capital protection
Survive first. Profit comes later.
---
🎯 Beginner Rule of Thumb
Trade small
Trade slow
Learn every loss
Protect capital like gold
If you survive the market,
the market will eventually pay you.
👉 If you’re a beginner, save this post.
👉 If you’re experienced, you learned this the hard way 😉
#CryptoEducation
$BTC
$ETH
$XRP
6
1
39
8.3k
·
--
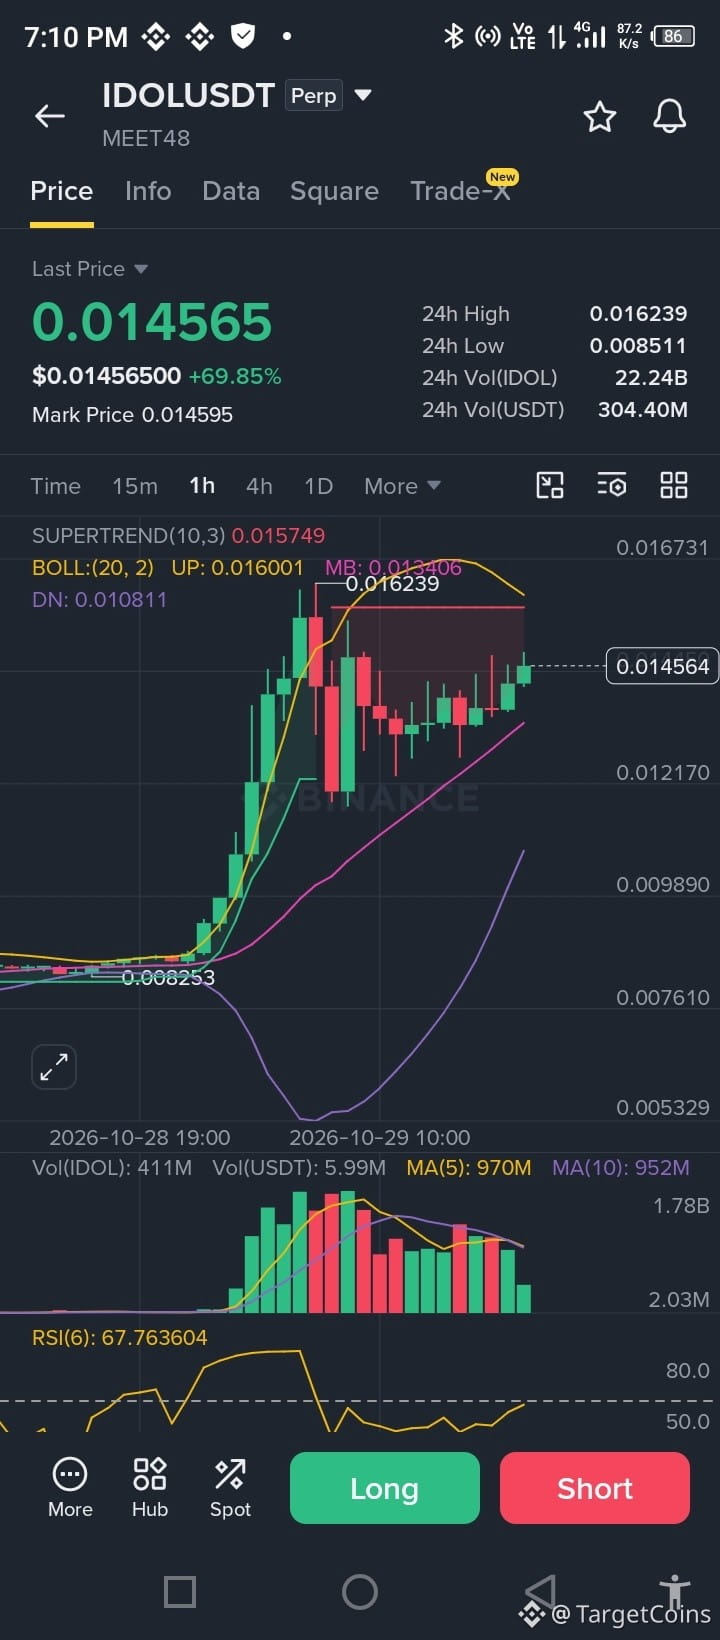
🚨 BINANCE SURVIVED THE HACK. BUT WHAT ABOUT USER TRUST?
The biggest question in crypto right now isn't Bitcoin's next target.
It's whether the world's largest crypto exchange can maintain user confidence after a massive security breach.
Here's what we know:
🔴 $6.3 BILLION — Estimated value of assets stolen in the security incident.
🟢 95% — Binance says it has replenished approximately 95% of affected assets.
🟢 Withdrawals — Phase 1 withdrawal services have resumed.
🟡 $4.7 BILLION — Reported net withdrawals since services reopened, according to Reuters.
But here's where things get interesting.
THE REAL TEST ISN'T REPLENISHING FUNDS. IT'S RESTORING TRUST.
Binance has committed to covering the losses through SAFU and corporate funds. That's a significant response.
However, three questions remain:
1️⃣ Can Binance prove its security infrastructure is now stronger?
2️⃣ Will institutional investors and market makers remain comfortable keeping funds on centralized exchanges?
3️⃣ Could this incident accelerate the shift toward self-custody and decentralized platforms?
📊 MY MARKET TAKE:
I don't see this incident as automatic proof of a systemic crypto collapse.
But it does highlight a risk that traders often ignore: Exchange risk.
Even when your trade is profitable, where you hold your assets matters.
Not your keys, not your coins.
The next few days could be crucial for Binance's reputation and overall market sentiment.
🎯 What's your take?
A) Binance has handled the crisis well.
B) Trust in centralized exchanges has taken a serious hit.
C) This could accelerate the move toward self-custody.
#Binance #CryptoSecurity $IDOL
🚨 BINANCE SURVIVED THE HACK. BUT WHAT ABOUT USER TRUST?
The biggest question in crypto right now isn't Bitcoin's next target.
It's whether the world's largest crypto exchange can maintain user confidence after a massive security breach.
Here's what we know:
🔴 $6.3 BILLION — Estimated value of assets stolen in the security incident.
🟢 95% — Binance says it has replenished approximately 95% of affected assets.
🟢 Withdrawals — Phase 1 withdrawal services have resumed.
🟡 $4.7 BILLION — Reported net withdrawals since services reopened, according to Reuters.
But here's where things get interesting.
THE REAL TEST ISN'T REPLENISHING FUNDS. IT'S RESTORING TRUST.
Binance has committed to covering the losses through SAFU and corporate funds. That's a significant response.
However, three questions remain:
1️⃣ Can Binance prove its security infrastructure is now stronger?
2️⃣ Will institutional investors and market makers remain comfortable keeping funds on centralized exchanges?
3️⃣ Could this incident accelerate the shift toward self-custody and decentralized platforms?
📊 MY MARKET TAKE:
I don't see this incident as automatic proof of a systemic crypto collapse.
But it does highlight a risk that traders often ignore: Exchange risk.
Even when your trade is profitable, where you hold your assets matters.
Not your keys, not your coins.
The next few days could be crucial for Binance's reputation and overall market sentiment.
🎯 What's your take?
A) Binance has handled the crisis well.
B) Trust in centralized exchanges has taken a serious hit.
C) This could accelerate the move toward self-custody.
#Binance #CryptoSecurity $IDOL
The biggest question in crypto right now isn't Bitcoin's next target.
It's whether the world's largest crypto exchange can maintain user confidence after a massive security breach.
Here's what we know:
🔴 $6.3 BILLION — Estimated value of assets stolen in the security incident.
🟢 95% — Binance says it has replenished approximately 95% of affected assets.
🟢 Withdrawals — Phase 1 withdrawal services have resumed.
🟡 $4.7 BILLION — Reported net withdrawals since services reopened, according to Reuters.
But here's where things get interesting.
THE REAL TEST ISN'T REPLENISHING FUNDS. IT'S RESTORING TRUST.
Binance has committed to covering the losses through SAFU and corporate funds. That's a significant response.
However, three questions remain:
1️⃣ Can Binance prove its security infrastructure is now stronger?
2️⃣ Will institutional investors and market makers remain comfortable keeping funds on centralized exchanges?
3️⃣ Could this incident accelerate the shift toward self-custody and decentralized platforms?
📊 MY MARKET TAKE:
I don't see this incident as automatic proof of a systemic crypto collapse.
But it does highlight a risk that traders often ignore: Exchange risk.
Even when your trade is profitable, where you hold your assets matters.
Not your keys, not your coins.
The next few days could be crucial for Binance's reputation and overall market sentiment.
🎯 What's your take?
A) Binance has handled the crisis well.
B) Trust in centralized exchanges has taken a serious hit.
C) This could accelerate the move toward self-custody.
#Binance #CryptoSecurity $IDOL

1
68
·
--
උසබ තත්ත්වය
🎯 BINANCE FUTURES RADAR: 3 Trading Opportunities
Three coins. Three different setups. Let's hunt for opportunities!
🟢 1. IDOLUSDT — LONG SETUP
Price: $0.02505
Strong recovery from $0.02160 support. Buyers are regaining control, and a breakout could trigger another upward move.
Entry: $0.0260–0.0263 (breakout confirmation)
SL: $0.0250
TP1: $0.0275
TP2: $0.0290
🔴 2. ESPORTSUSDT — SHORT SETUP
Price: $0.01597
Despite a massive 24h pump, the 15m chart shows weakening momentum. Looking for a relief bounce before entering short.
Entry: $0.0164–0.0166
SL: $0.0171
TP1: $0.0155
TP2: $0.0151
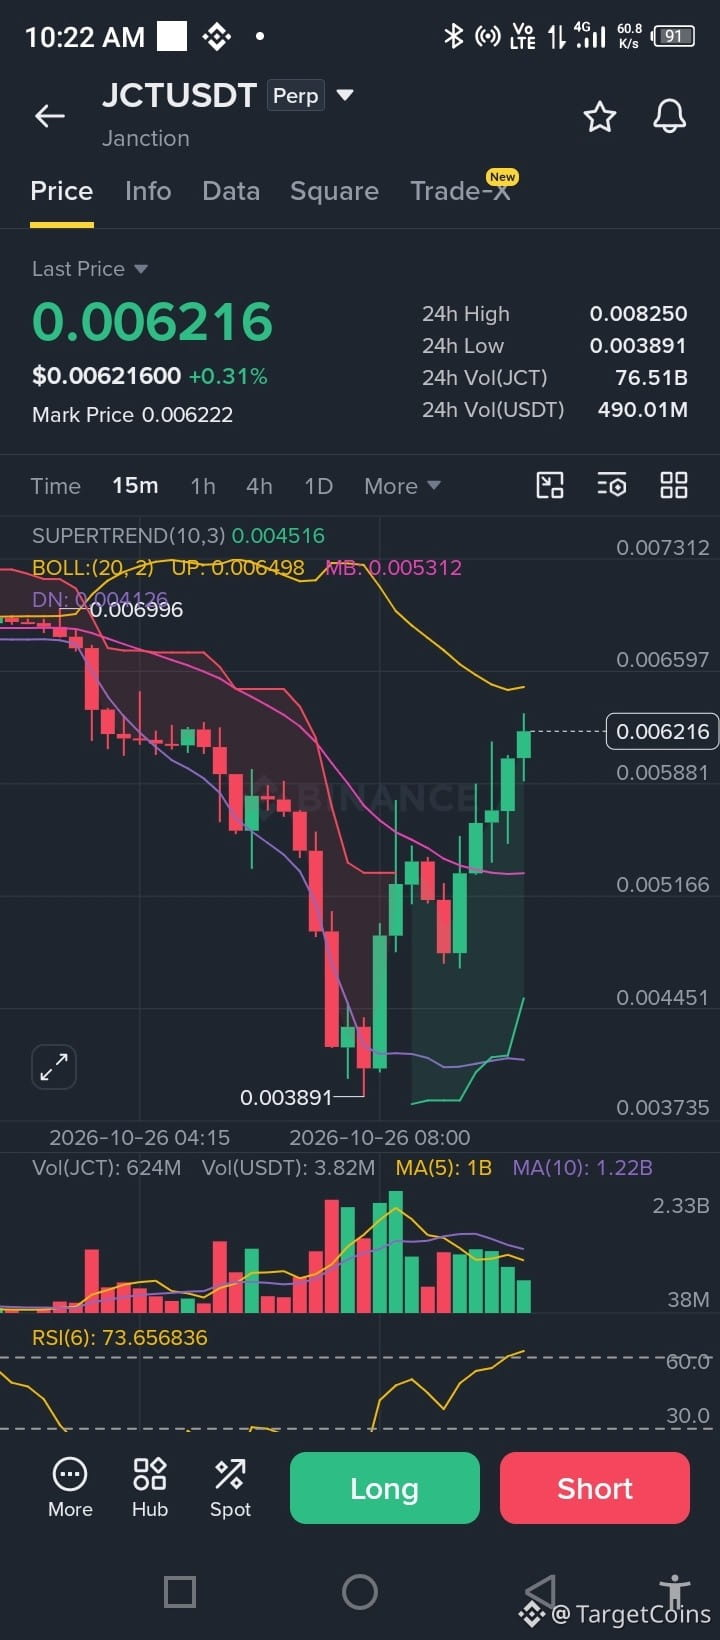
🟢 3. JCTUSDT — BOUNCE SETUP
Price: $0.004182
RSI(6) has dropped to an extreme 7.03. The coin is heavily oversold, making a relief bounce increasingly interesting.
Entry: $0.00425–0.00435 (after reclaim confirmation)
SL: $0.00410
TP1: $0.00446
TP2: $0.00465
🔥 MY TOP PICK: IDOL
IDOL offers the most attractive momentum setup, while ESPORTS presents a potential short opportunity.
JCT is a high-risk oversold bounce play.
Trade the setup, not the excitement. Manage your risk.
#JCT #IDOL #esports
🎯 BINANCE FUTURES RADAR: 3 Trading Opportunities
Three coins. Three different setups. Let's hunt for opportunities!
🟢 1. IDOLUSDT — LONG SETUP
Price: $0.02505
Strong recovery from $0.02160 support. Buyers are regaining control, and a breakout could trigger another upward move.
Entry: $0.0260–0.0263 (breakout confirmation)
SL: $0.0250
TP1: $0.0275
TP2: $0.0290
🔴 2. ESPORTSUSDT — SHORT SETUP
Price: $0.01597
Despite a massive 24h pump, the 15m chart shows weakening momentum. Looking for a relief bounce before entering short.
Entry: $0.0164–0.0166
SL: $0.0171
TP1: $0.0155
TP2: $0.0151
🟢 3. JCTUSDT — BOUNCE SETUP
Price: $0.004182
RSI(6) has dropped to an extreme 7.03. The coin is heavily oversold, making a relief bounce increasingly interesting.
Entry: $0.00425–0.00435 (after reclaim confirmation)
SL: $0.00410
TP1: $0.00446
TP2: $0.00465
🔥 MY TOP PICK: IDOL
IDOL offers the most attractive momentum setup, while ESPORTS presents a potential short opportunity.
JCT is a high-risk oversold bounce play.
Trade the setup, not the excitement. Manage your risk.
#JCT #IDOL #esports
Three coins. Three different setups. Let's hunt for opportunities!
🟢 1. IDOLUSDT — LONG SETUP
Price: $0.02505
Strong recovery from $0.02160 support. Buyers are regaining control, and a breakout could trigger another upward move.
Entry: $0.0260–0.0263 (breakout confirmation)
SL: $0.0250
TP1: $0.0275
TP2: $0.0290
🔴 2. ESPORTSUSDT — SHORT SETUP
Price: $0.01597
Despite a massive 24h pump, the 15m chart shows weakening momentum. Looking for a relief bounce before entering short.
Entry: $0.0164–0.0166
SL: $0.0171
TP1: $0.0155
TP2: $0.0151
🟢 3. JCTUSDT — BOUNCE SETUP
Price: $0.004182
RSI(6) has dropped to an extreme 7.03. The coin is heavily oversold, making a relief bounce increasingly interesting.
Entry: $0.00425–0.00435 (after reclaim confirmation)
SL: $0.00410
TP1: $0.00446
TP2: $0.00465
🔥 MY TOP PICK: IDOL
IDOL offers the most attractive momentum setup, while ESPORTS presents a potential short opportunity.
JCT is a high-risk oversold bounce play.
Trade the setup, not the excitement. Manage your risk.
#JCT #IDOL #esports
1
1.3k
·
--
උසබ තත්ත්වය
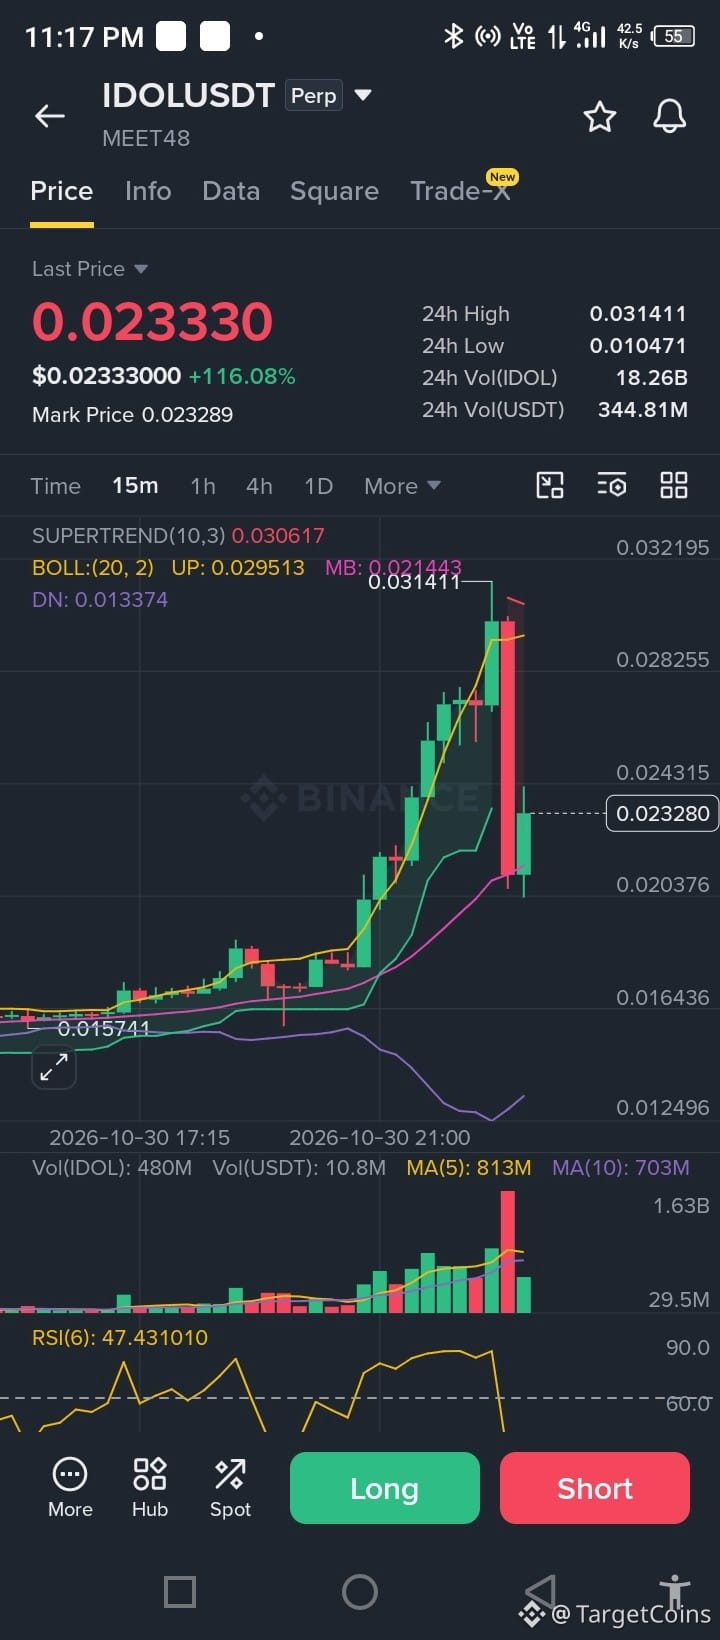
🚨 IDOLUSDT: Potential Bounce Setup After a Massive Dump!
After pumping to 0.03141, IDOL experienced a sharp correction, dropping toward the 0.020 support zone.
But is the selling pressure finally cooling down?
📊 15M Technical Outlook
🟢 RSI (6): 47.43 — back in neutral territory.
🟢 Bollinger Middle Band: 0.02144 — potential support.
🟢 Selling volume: Declining after the massive sell-off.
🔴 Supertrend: Still bearish at 0.03061.
The bigger trend remains bearish, but a relief bounce could be developing.
🎯 Potential LONG Setup
Entry: 0.019
Stop Loss: 0.016
TP1: 0.0215
TP2: 0.0245
TP3: 0.0290–0.0295
📈 Risk/Reward: Approximately 1:2.5 to TP2.
Trade Strategy:
- Wait for confirmation around 0.019.
- Secure partial profits at TP1.
- Move SL to breakeven after TP1.
- Avoid chasing green candles.
⚠️ This is a counter-trend bounce setup, NOT a confirmed trend reversal.
IDOL has already demonstrated extreme volatility. Low leverage and strict risk management are essential.
The question is: Is this the beginning of a recovery, or just another temporary bounce before the next leg down?
What's your take? 👇
#IDOL
$IDOL
{future}(IDOLUSDT)
🚨 IDOLUSDT: Potential Bounce Setup After a Massive Dump!
After pumping to 0.03141, IDOL experienced a sharp correction, dropping toward the 0.020 support zone.
But is the selling pressure finally cooling down?
📊 15M Technical Outlook
🟢 RSI (6): 47.43 — back in neutral territory.
🟢 Bollinger Middle Band: 0.02144 — potential support.
🟢 Selling volume: Declining after the massive sell-off.
🔴 Supertrend: Still bearish at 0.03061.
The bigger trend remains bearish, but a relief bounce could be developing.
🎯 Potential LONG Setup
Entry: 0.019
Stop Loss: 0.016
TP1: 0.0215
TP2: 0.0245
TP3: 0.0290–0.0295
📈 Risk/Reward: Approximately 1:2.5 to TP2.
Trade Strategy:
- Wait for confirmation around 0.019.
- Secure partial profits at TP1.
- Move SL to breakeven after TP1.
- Avoid chasing green candles.
⚠️ This is a counter-trend bounce setup, NOT a confirmed trend reversal.
IDOL has already demonstrated extreme volatility. Low leverage and strict risk management are essential.
The question is: Is this the beginning of a recovery, or just another temporary bounce before the next leg down?
What's your take? 👇
#IDOL
$IDOL
After pumping to 0.03141, IDOL experienced a sharp correction, dropping toward the 0.020 support zone.
But is the selling pressure finally cooling down?
📊 15M Technical Outlook
🟢 RSI (6): 47.43 — back in neutral territory.
🟢 Bollinger Middle Band: 0.02144 — potential support.
🟢 Selling volume: Declining after the massive sell-off.
🔴 Supertrend: Still bearish at 0.03061.
The bigger trend remains bearish, but a relief bounce could be developing.
🎯 Potential LONG Setup
Entry: 0.019
Stop Loss: 0.016
TP1: 0.0215
TP2: 0.0245
TP3: 0.0290–0.0295
📈 Risk/Reward: Approximately 1:2.5 to TP2.
Trade Strategy:
- Wait for confirmation around 0.019.
- Secure partial profits at TP1.
- Move SL to breakeven after TP1.
- Avoid chasing green candles.
⚠️ This is a counter-trend bounce setup, NOT a confirmed trend reversal.
IDOL has already demonstrated extreme volatility. Low leverage and strict risk management are essential.
The question is: Is this the beginning of a recovery, or just another temporary bounce before the next leg down?
What's your take? 👇
#IDOL
$IDOL
1
753
·
--
උසබ තත්ත්වය
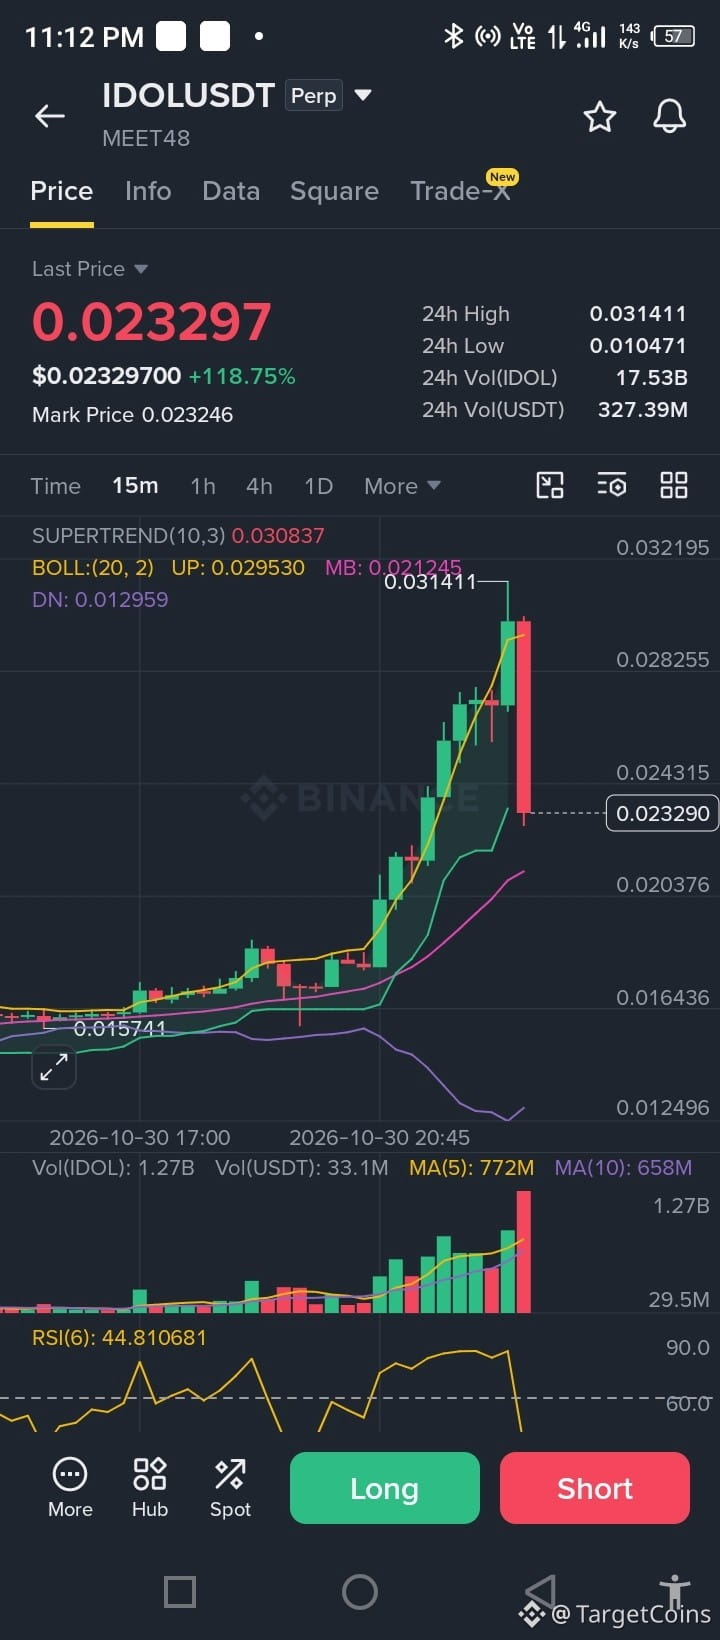
Dangerous Big red candle
But don't Short immediately
1 small pump still intact
$IDOL
Dangerous Big red candle
But don't Short immediately
1 small pump still intact
$IDOL
But don't Short immediately
1 small pump still intact
$IDOL
1
787
·
--
උසබ තත්ත්වය
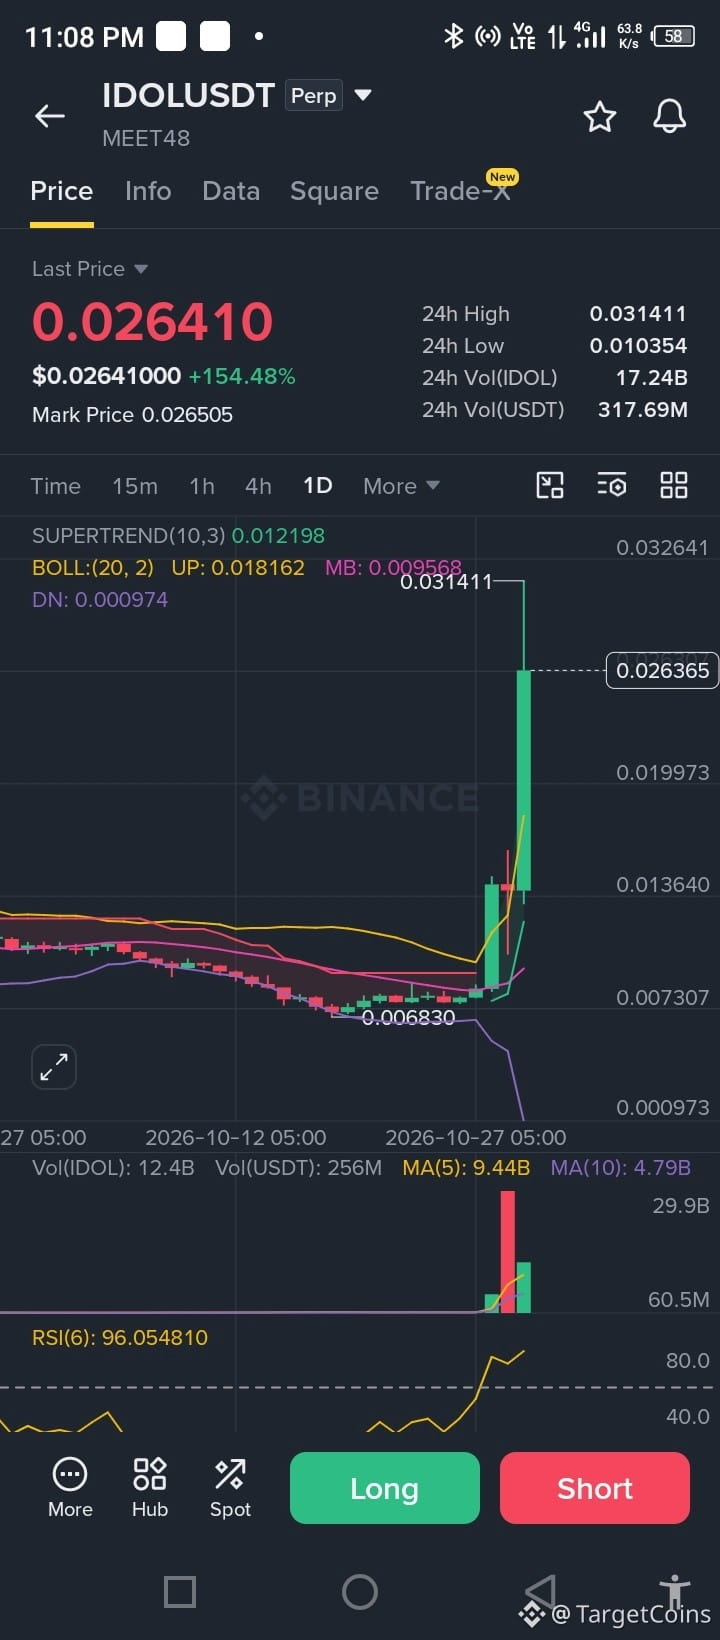
Why you didn't believe me ?
$IDOL
{future}(IDOLUSDT)
Why you didn't believe me ?
$IDOL
$IDOL
TargetCoins
·
--
උසබ තත්ත්වය150% tonight
$IDOL
$IDOL
1
672
·
--
බෙයාරිෂ්
🚨 $6.3 BILLION SECURITY INCIDENT: BINANCE FACES A MAJOR CONFIDENCE TEST
The crypto market just experienced a brutal selloff, and now we have an important piece of information.
Binance has officially addressed the reported security incident.
Here are the key details:
🔴 $6.3 BILLION — Estimated value of affected assets.
🟢 $3 BILLION — Assets reportedly frozen on-chain.
🛡️ SAFU FUND — Binance says it will cover losses through its protection fund and company resources.
🔐 PRIVATE KEYS — Binance reported no evidence of private-key leakage.
💻 Initial Investigation — A compromised DevOps engineer's laptop was identified, with additional entry points subsequently uncovered.
📉 Why Did the Entire Market React?
Crypto markets don't just price in financial losses. They price in uncertainty.
When confidence in a major exchange is shaken:
- Traders reduce leverage.
- Panic selling accelerates.
- Liquidation cascades hit leveraged longs.
- Altcoins become particularly vulnerable.
🎯 WHAT HAPPENS NEXT?
I see three things worth watching:
1️⃣ Binance's operational and security updates.
2️⃣ Whether BTC can reclaim important support levels.
3️⃣ Whether open interest and funding rates normalize after the liquidation event.
My Take
This incident is a serious test of centralized exchange security and market confidence.
However, Binance's commitment to covering losses and the absence of reported private-key leakage are important distinctions.
I'm not calling this the end of the bull market, nor am I rushing to buy the dip.
First, let the dust settle. Then follow the money.
💬 One question for the community:
Will this incident create a temporary buying opportunity, or has it exposed a much bigger risk for the entire crypto industry?
#Binance #bitcoin #CryptoSecurity
🚨 $6.3 BILLION SECURITY INCIDENT: BINANCE FACES A MAJOR CONFIDENCE TEST
The crypto market just experienced a brutal selloff, and now we have an important piece of information.
Binance has officially addressed the reported security incident.
Here are the key details:
🔴 $6.3 BILLION — Estimated value of affected assets.
🟢 $3 BILLION — Assets reportedly frozen on-chain.
🛡️ SAFU FUND — Binance says it will cover losses through its protection fund and company resources.
🔐 PRIVATE KEYS — Binance reported no evidence of private-key leakage.
💻 Initial Investigation — A compromised DevOps engineer's laptop was identified, with additional entry points subsequently uncovered.
📉 Why Did the Entire Market React?
Crypto markets don't just price in financial losses. They price in uncertainty.
When confidence in a major exchange is shaken:
- Traders reduce leverage.
- Panic selling accelerates.
- Liquidation cascades hit leveraged longs.
- Altcoins become particularly vulnerable.
🎯 WHAT HAPPENS NEXT?
I see three things worth watching:
1️⃣ Binance's operational and security updates.
2️⃣ Whether BTC can reclaim important support levels.
3️⃣ Whether open interest and funding rates normalize after the liquidation event.
My Take
This incident is a serious test of centralized exchange security and market confidence.
However, Binance's commitment to covering losses and the absence of reported private-key leakage are important distinctions.
I'm not calling this the end of the bull market, nor am I rushing to buy the dip.
First, let the dust settle. Then follow the money.
💬 One question for the community:
Will this incident create a temporary buying opportunity, or has it exposed a much bigger risk for the entire crypto industry?
#Binance #bitcoin #CryptoSecurity
The crypto market just experienced a brutal selloff, and now we have an important piece of information.
Binance has officially addressed the reported security incident.
Here are the key details:
🔴 $6.3 BILLION — Estimated value of affected assets.
🟢 $3 BILLION — Assets reportedly frozen on-chain.
🛡️ SAFU FUND — Binance says it will cover losses through its protection fund and company resources.
🔐 PRIVATE KEYS — Binance reported no evidence of private-key leakage.
💻 Initial Investigation — A compromised DevOps engineer's laptop was identified, with additional entry points subsequently uncovered.
📉 Why Did the Entire Market React?
Crypto markets don't just price in financial losses. They price in uncertainty.
When confidence in a major exchange is shaken:
- Traders reduce leverage.
- Panic selling accelerates.
- Liquidation cascades hit leveraged longs.
- Altcoins become particularly vulnerable.
🎯 WHAT HAPPENS NEXT?
I see three things worth watching:
1️⃣ Binance's operational and security updates.
2️⃣ Whether BTC can reclaim important support levels.
3️⃣ Whether open interest and funding rates normalize after the liquidation event.
My Take
This incident is a serious test of centralized exchange security and market confidence.
However, Binance's commitment to covering losses and the absence of reported private-key leakage are important distinctions.
I'm not calling this the end of the bull market, nor am I rushing to buy the dip.
First, let the dust settle. Then follow the money.
💬 One question for the community:
Will this incident create a temporary buying opportunity, or has it exposed a much bigger risk for the entire crypto industry?
#Binance #bitcoin #CryptoSecurity
TargetCoins
·
--
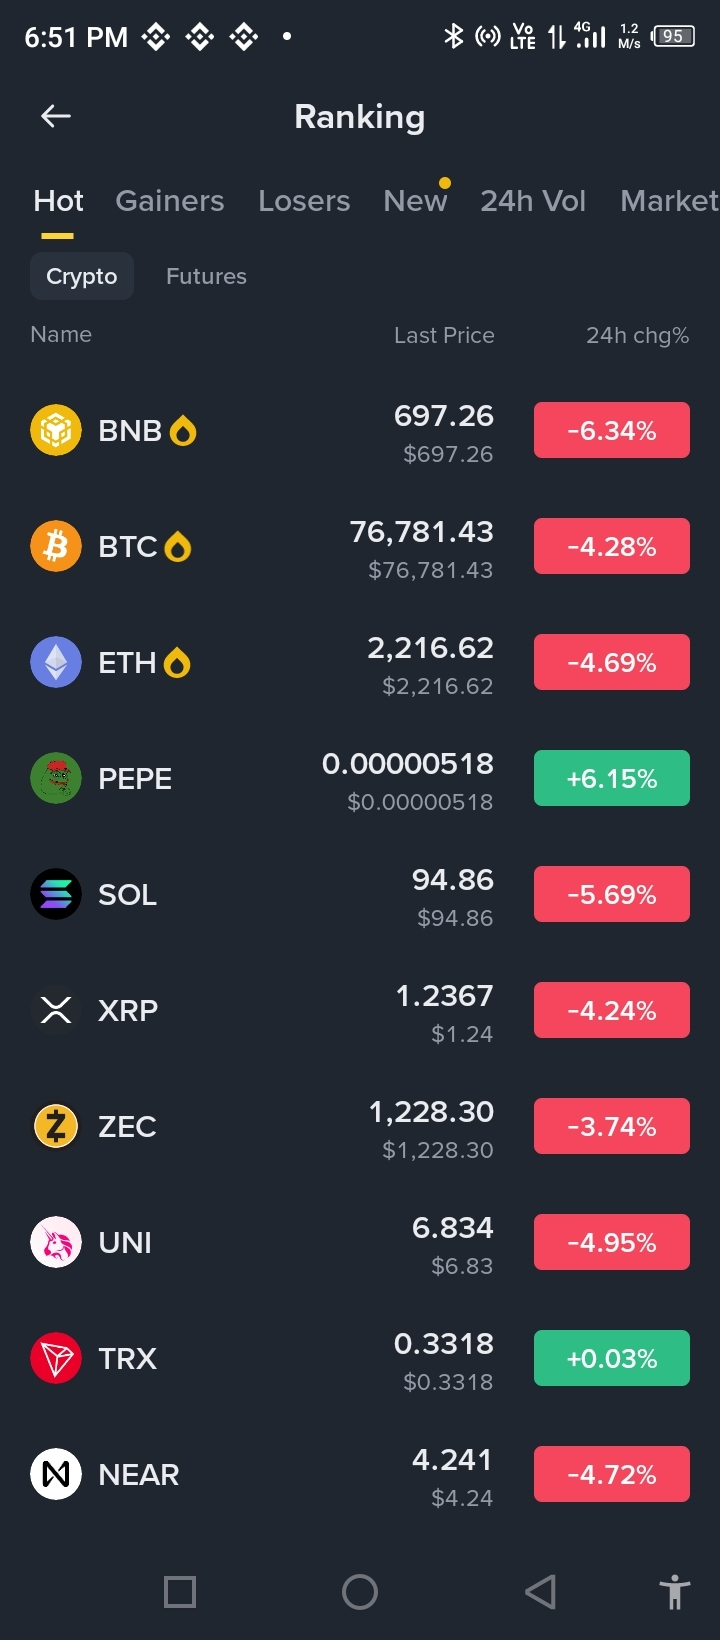
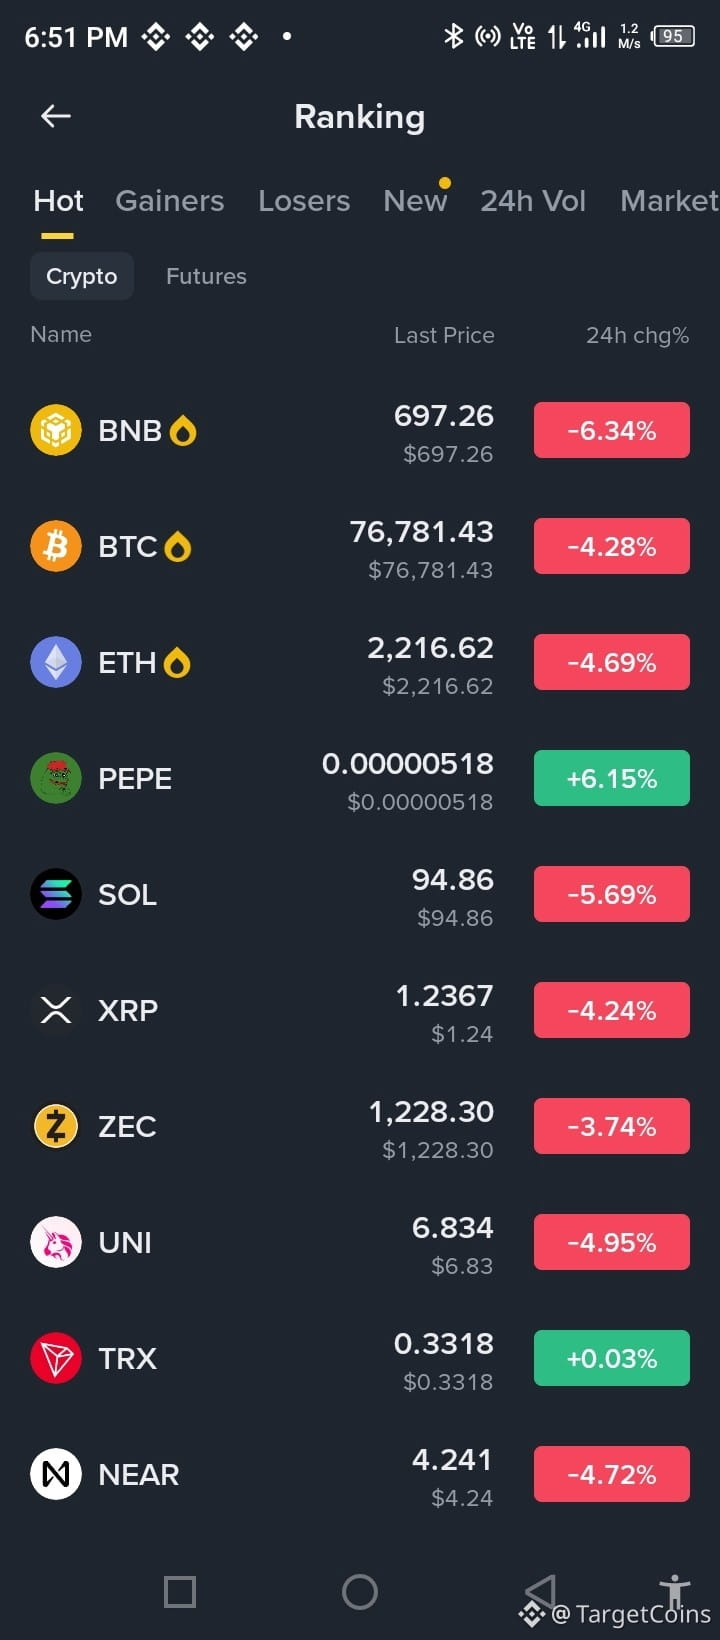
බෙයාරිෂ්🚨 CRYPTO MARKET BLOODBATH: WHAT JUST HAPPENED?
The crypto market is bleeding, and this isn't just another ordinary correction.
Several factors have collided, creating a massive wave of panic selling.
🔴 What's Behind the Dump?
1️⃣ Binance Security Concerns: Reports of a major security breach have shaken market confidence.
2️⃣ $1.53 BILLION Liquidations: Around $1.29B came from long positions. That's a brutal liquidation cascade.
3️⃣ Macroeconomic Pressure: Weakness in traditional markets is pushing investors away from risky assets.
4️⃣ Panic Selling: As BTC dropped, leveraged positions were liquidated, accelerating the downward move.
📉 What Happens Next?
I see three possibilities:
🟢 A relief rally if market confidence returns.
🔴 Another leg down if selling pressure continues.
🟡 Sideways consolidation while traders wait for clarity.
🎯 My Trading Strategy:
I'm not rushing to buy the dip, and I'm certainly not chasing shorts after a massive liquidation event.
Watch BTC price action, funding rates, open interest and fresh market liquidity.
Remember: The biggest opportunities often appear when panic is at its peak, but so do the biggest traps.
Are we witnessing a temporary shakeout or the beginning of a deeper correction?
#BTC #CryptoMarket #Binance
The crypto market is bleeding, and this isn't just another ordinary correction.
Several factors have collided, creating a massive wave of panic selling.
🔴 What's Behind the Dump?
1️⃣ Binance Security Concerns: Reports of a major security breach have shaken market confidence.
2️⃣ $1.53 BILLION Liquidations: Around $1.29B came from long positions. That's a brutal liquidation cascade.
3️⃣ Macroeconomic Pressure: Weakness in traditional markets is pushing investors away from risky assets.
4️⃣ Panic Selling: As BTC dropped, leveraged positions were liquidated, accelerating the downward move.
📉 What Happens Next?
I see three possibilities:
🟢 A relief rally if market confidence returns.
🔴 Another leg down if selling pressure continues.
🟡 Sideways consolidation while traders wait for clarity.
🎯 My Trading Strategy:
I'm not rushing to buy the dip, and I'm certainly not chasing shorts after a massive liquidation event.
Watch BTC price action, funding rates, open interest and fresh market liquidity.
Remember: The biggest opportunities often appear when panic is at its peak, but so do the biggest traps.
Are we witnessing a temporary shakeout or the beginning of a deeper correction?
#BTC #CryptoMarket #Binance
1
113
·
--
බෙයාරිෂ්
🚨 CRYPTO MARKET BLOODBATH: WHAT JUST HAPPENED?
The crypto market is bleeding, and this isn't just another ordinary correction.
Several factors have collided, creating a massive wave of panic selling.
🔴 What's Behind the Dump?
1️⃣ Binance Security Concerns: Reports of a major security breach have shaken market confidence.
2️⃣ $1.53 BILLION Liquidations: Around $1.29B came from long positions. That's a brutal liquidation cascade.
3️⃣ Macroeconomic Pressure: Weakness in traditional markets is pushing investors away from risky assets.
4️⃣ Panic Selling: As BTC dropped, leveraged positions were liquidated, accelerating the downward move.
📉 What Happens Next?
I see three possibilities:
🟢 A relief rally if market confidence returns.
🔴 Another leg down if selling pressure continues.
🟡 Sideways consolidation while traders wait for clarity.
🎯 My Trading Strategy:
I'm not rushing to buy the dip, and I'm certainly not chasing shorts after a massive liquidation event.
Watch BTC price action, funding rates, open interest and fresh market liquidity.
Remember: The biggest opportunities often appear when panic is at its peak, but so do the biggest traps.
Are we witnessing a temporary shakeout or the beginning of a deeper correction?
#BTC #CryptoMarket #Binance
🚨 CRYPTO MARKET BLOODBATH: WHAT JUST HAPPENED?
The crypto market is bleeding, and this isn't just another ordinary correction.
Several factors have collided, creating a massive wave of panic selling.
🔴 What's Behind the Dump?
1️⃣ Binance Security Concerns: Reports of a major security breach have shaken market confidence.
2️⃣ $1.53 BILLION Liquidations: Around $1.29B came from long positions. That's a brutal liquidation cascade.
3️⃣ Macroeconomic Pressure: Weakness in traditional markets is pushing investors away from risky assets.
4️⃣ Panic Selling: As BTC dropped, leveraged positions were liquidated, accelerating the downward move.
📉 What Happens Next?
I see three possibilities:
🟢 A relief rally if market confidence returns.
🔴 Another leg down if selling pressure continues.
🟡 Sideways consolidation while traders wait for clarity.
🎯 My Trading Strategy:
I'm not rushing to buy the dip, and I'm certainly not chasing shorts after a massive liquidation event.
Watch BTC price action, funding rates, open interest and fresh market liquidity.
Remember: The biggest opportunities often appear when panic is at its peak, but so do the biggest traps.
Are we witnessing a temporary shakeout or the beginning of a deeper correction?
#BTC #CryptoMarket #Binance
The crypto market is bleeding, and this isn't just another ordinary correction.
Several factors have collided, creating a massive wave of panic selling.
🔴 What's Behind the Dump?
1️⃣ Binance Security Concerns: Reports of a major security breach have shaken market confidence.
2️⃣ $1.53 BILLION Liquidations: Around $1.29B came from long positions. That's a brutal liquidation cascade.
3️⃣ Macroeconomic Pressure: Weakness in traditional markets is pushing investors away from risky assets.
4️⃣ Panic Selling: As BTC dropped, leveraged positions were liquidated, accelerating the downward move.
📉 What Happens Next?
I see three possibilities:
🟢 A relief rally if market confidence returns.
🔴 Another leg down if selling pressure continues.
🟡 Sideways consolidation while traders wait for clarity.
🎯 My Trading Strategy:
I'm not rushing to buy the dip, and I'm certainly not chasing shorts after a massive liquidation event.
Watch BTC price action, funding rates, open interest and fresh market liquidity.
Remember: The biggest opportunities often appear when panic is at its peak, but so do the biggest traps.
Are we witnessing a temporary shakeout or the beginning of a deeper correction?
#BTC #CryptoMarket #Binance
1
2
247
·
--
උසබ තත්ත්වය
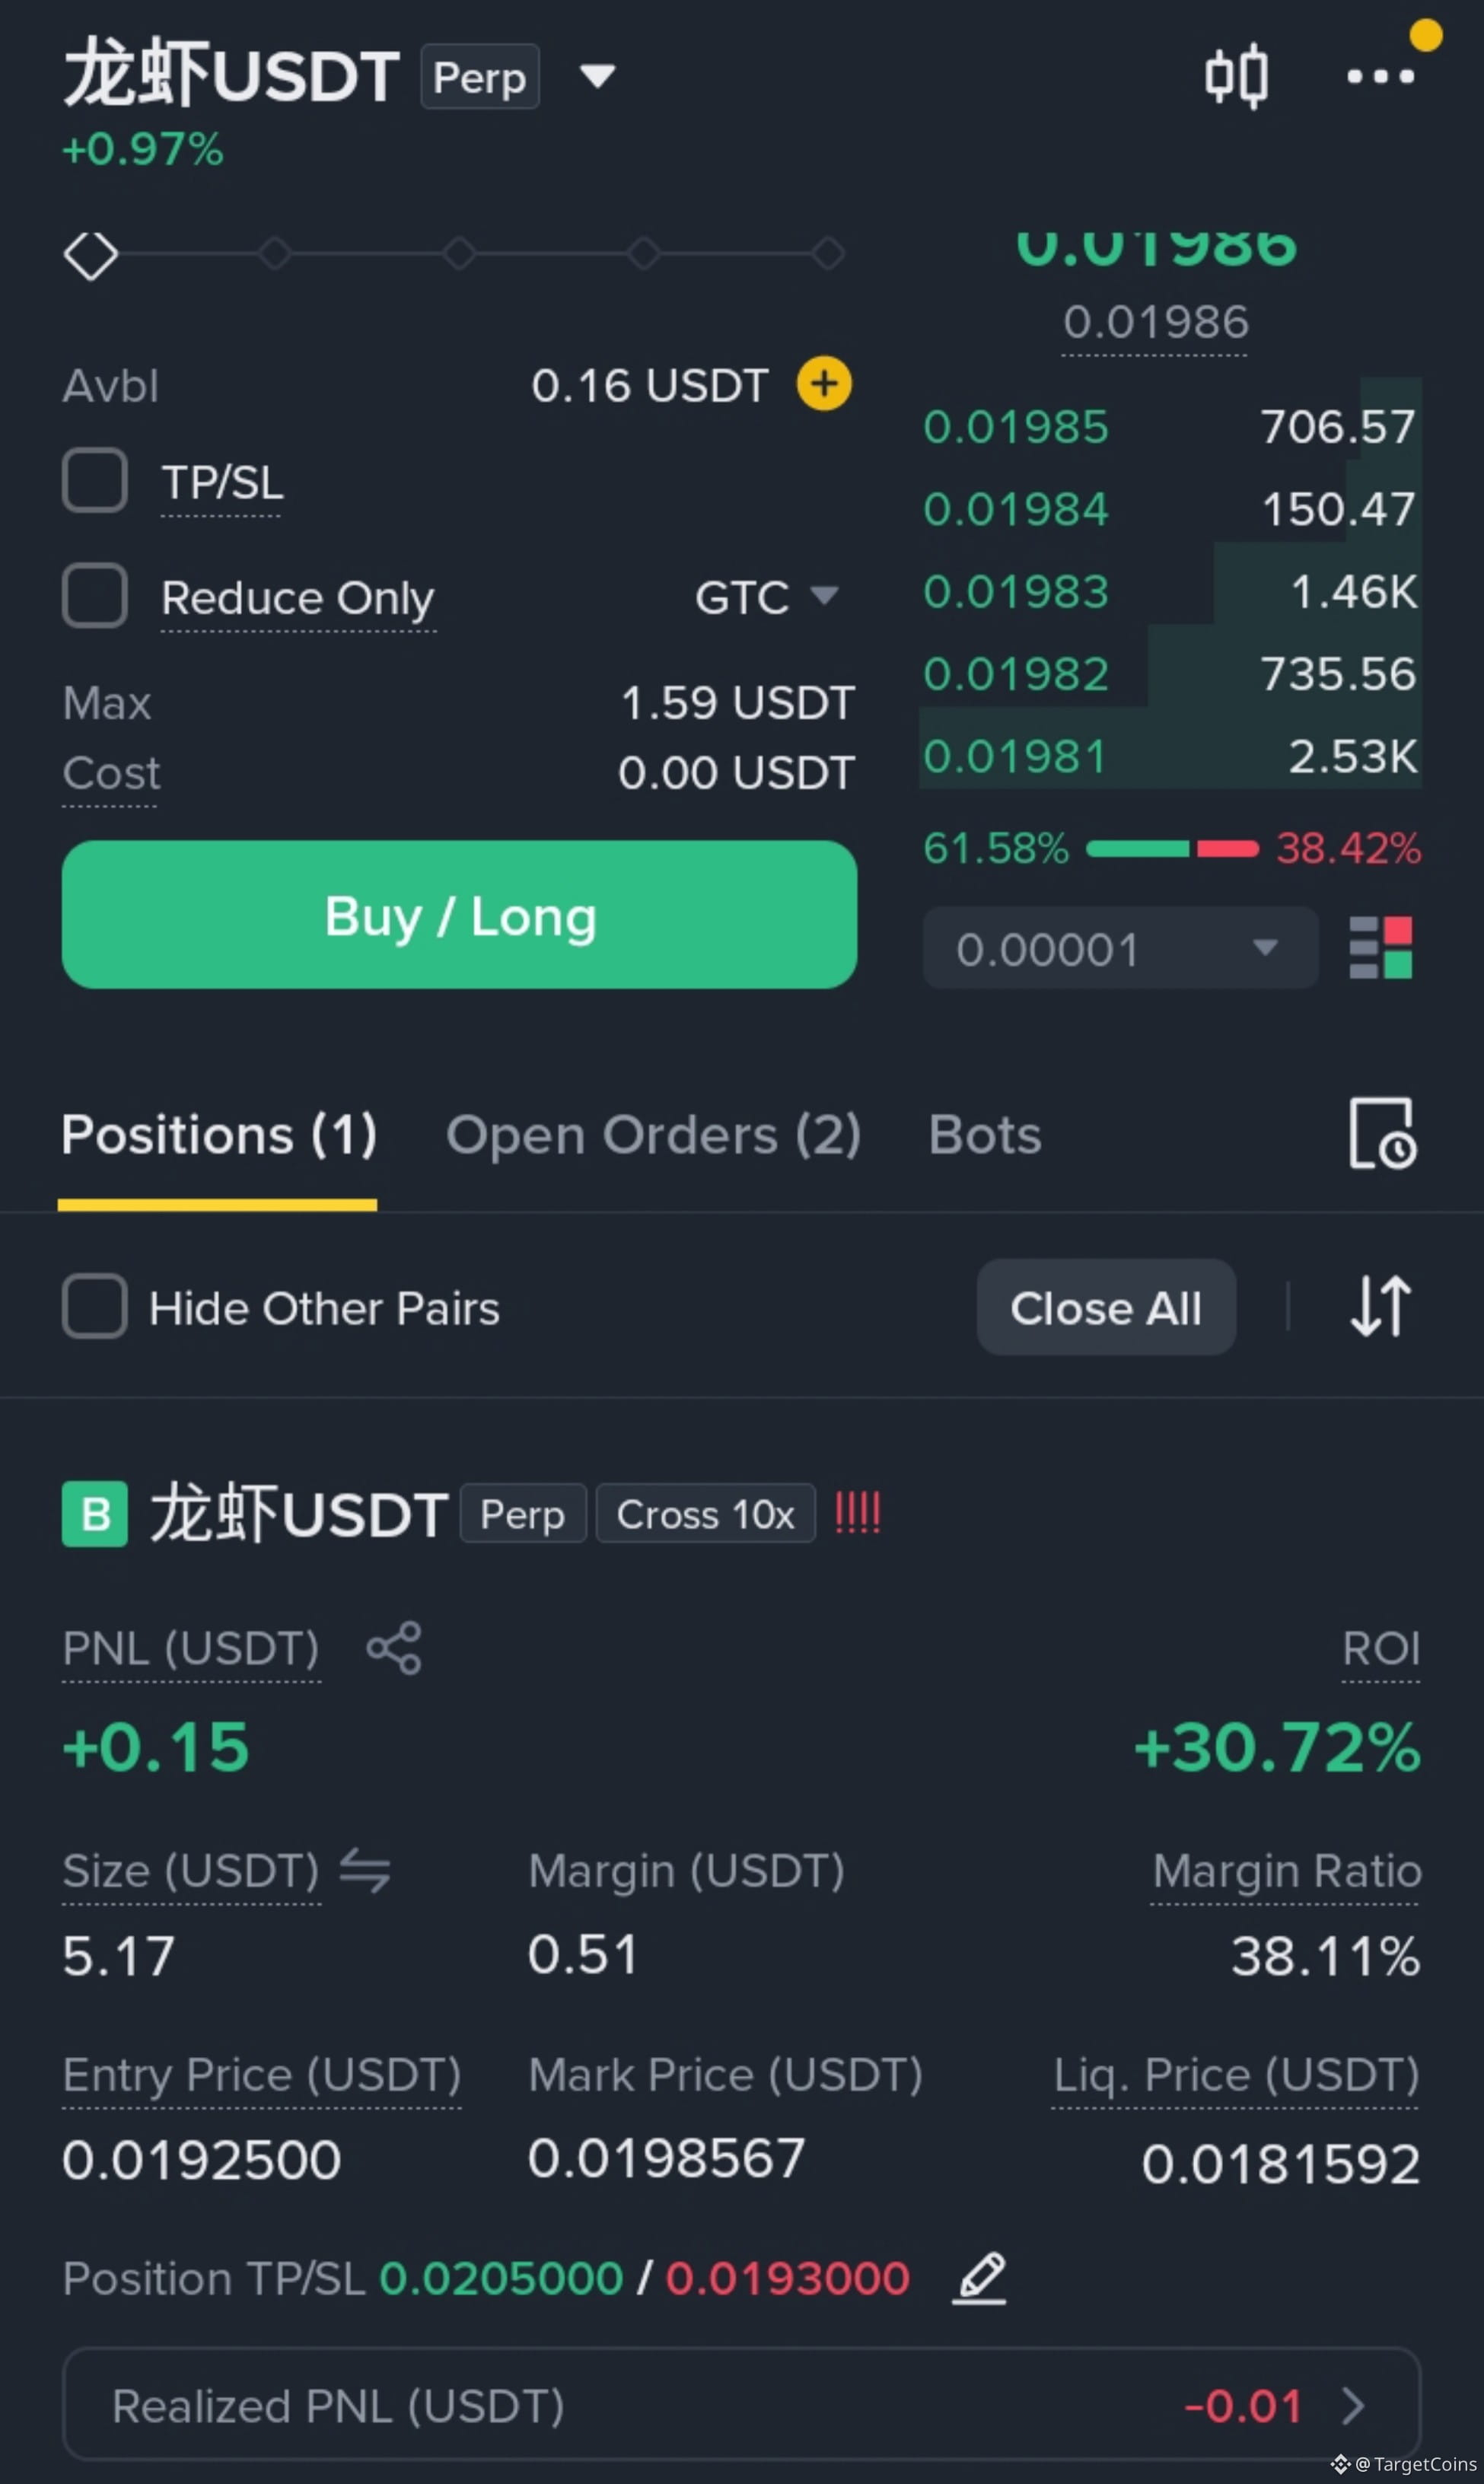
After liquidation $IRYS Long
These are my total assets in binance 😄
After liquidation $IRYS Long
These are my total assets in binance 😄
These are my total assets in binance 😄
1
1
1.6k
·
--
උසබ තත්ත්වය
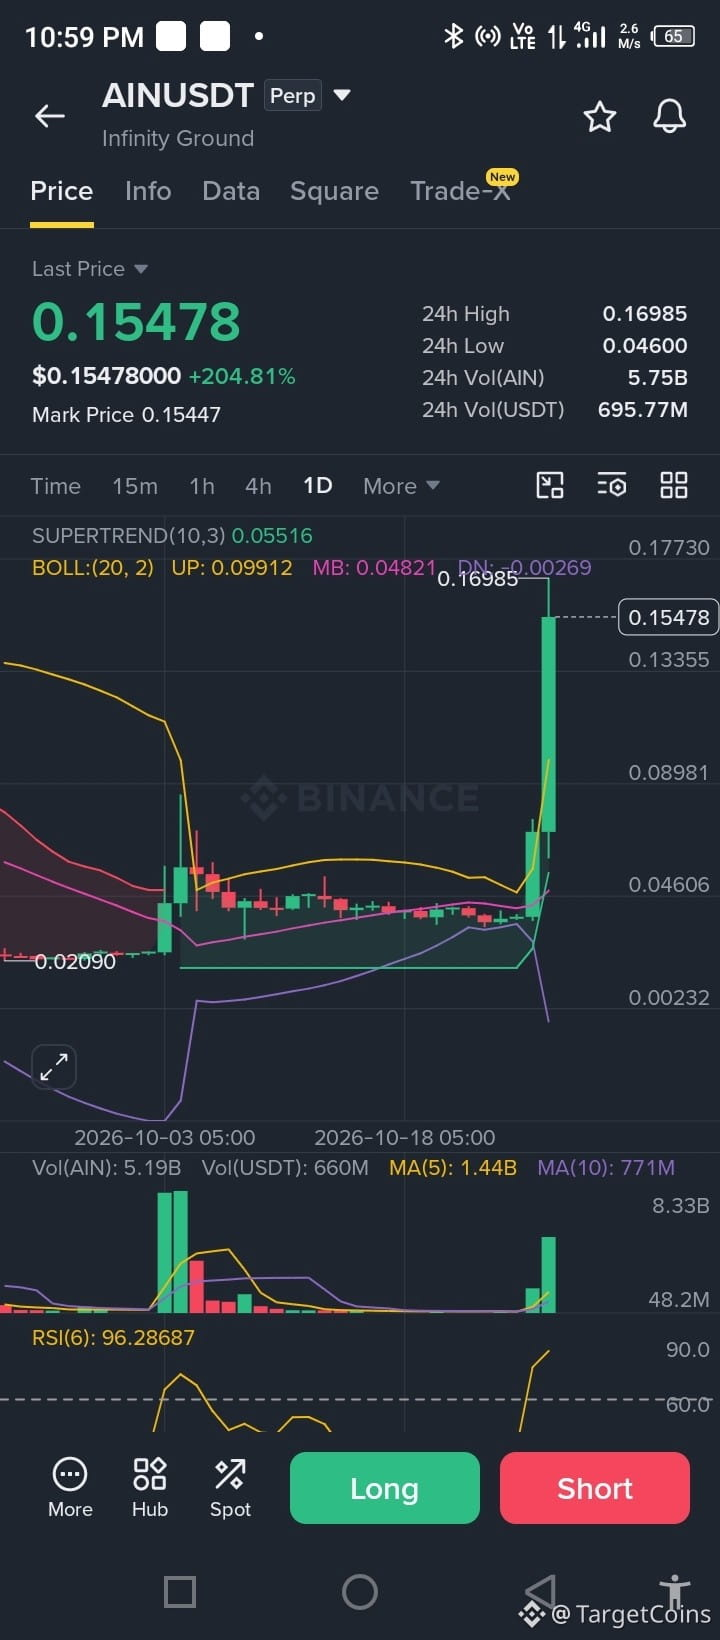
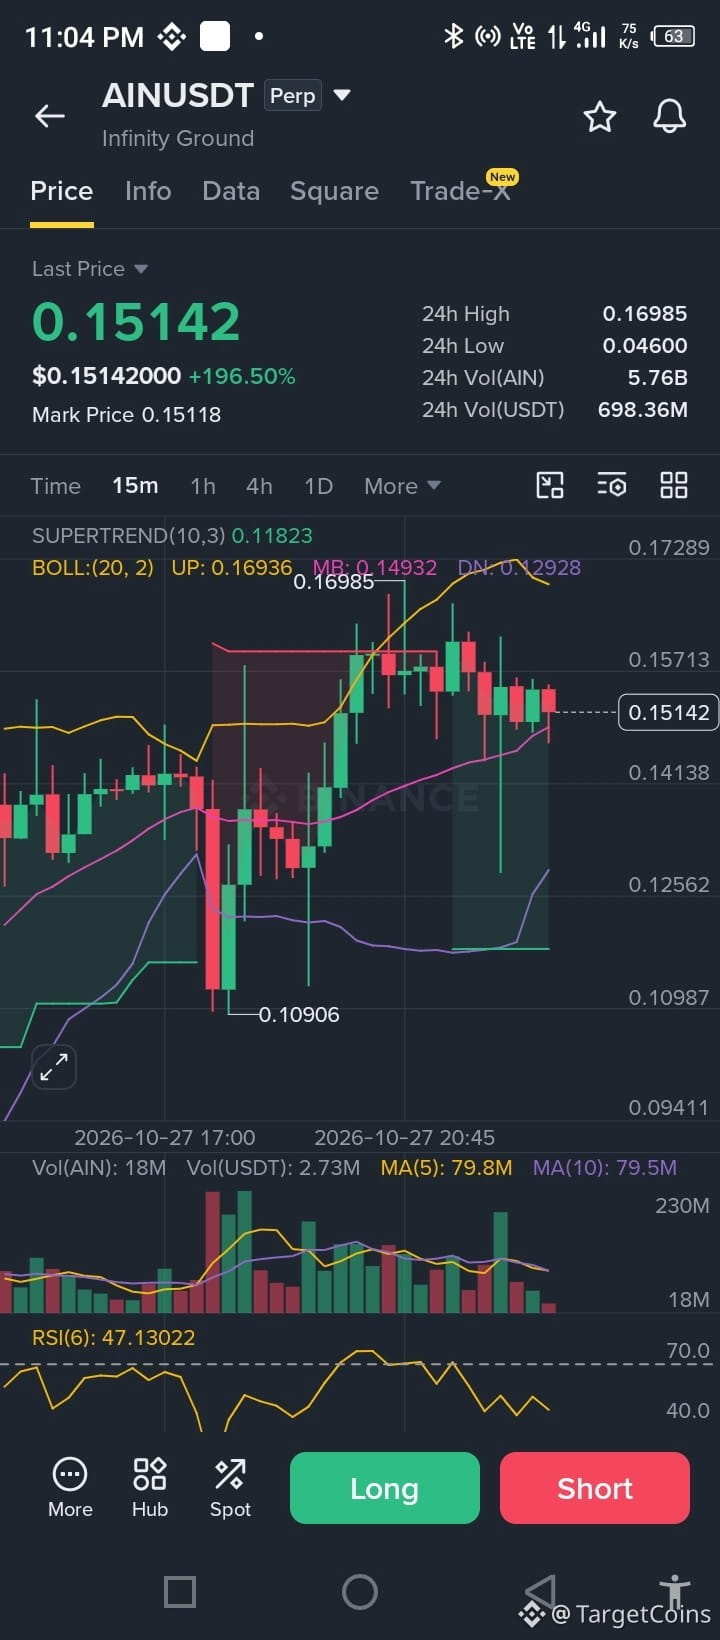
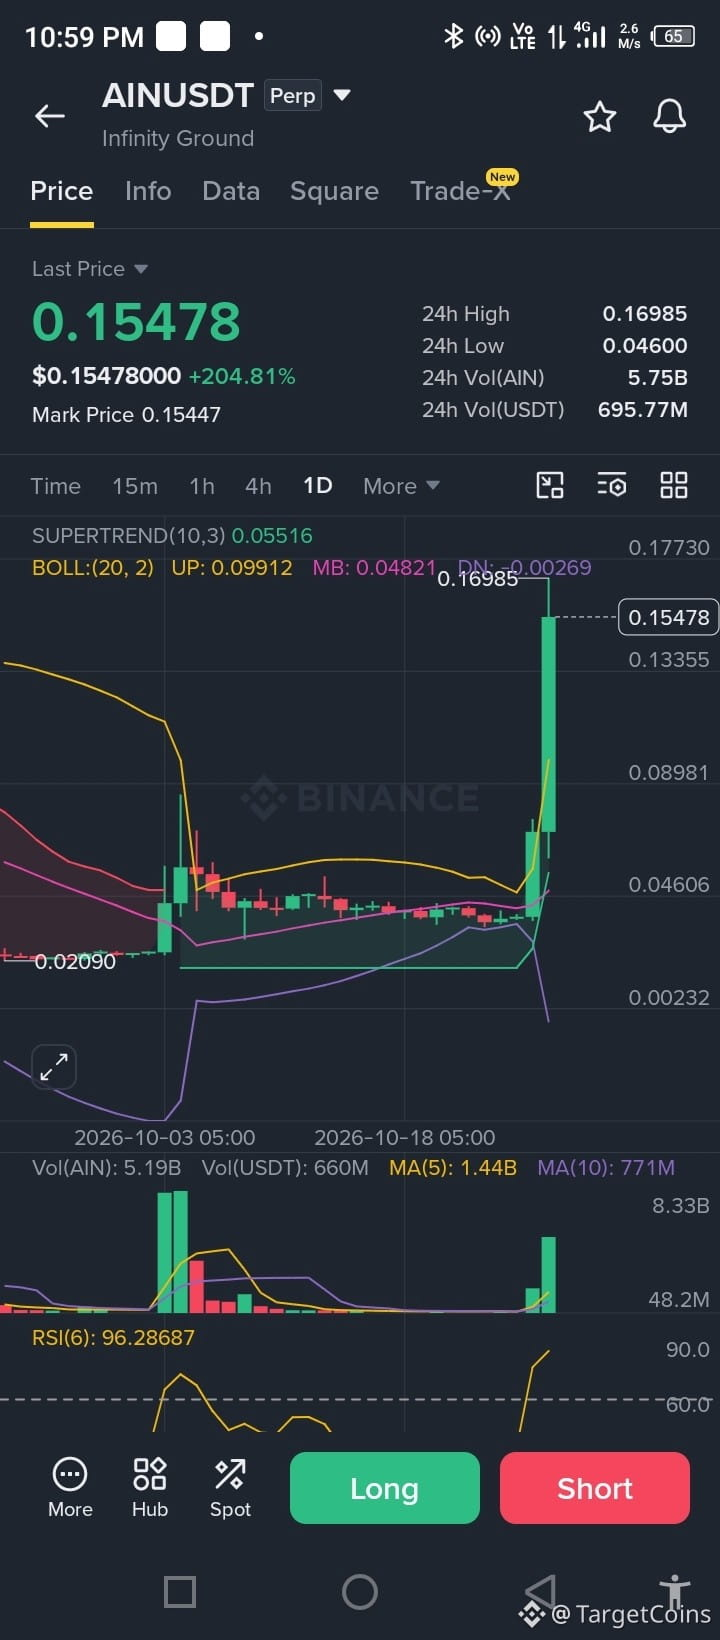
🚀 AINUSDT: Too Early to Short?
After a massive 200%+ pump, shorting might look tempting—but chasing the top is a dangerous game.
📊 Price: $0.15142
🔹 Resistance: $0.16985
🔹 Key support: $0.14932
🔹 RSI(6): 47.13
🟢 Bullish scenario: A high-volume breakout above $0.16985 could trigger another squeeze.
🔴 Bearish scenario: Losing $0.14932 and failing to reclaim it could open the door to a deeper correction.
🎯 My take: No blind shorts. Let price confirm the direction first. The next move could punish both impatient bulls and early bears.
Would you risk shorting here, or wait for confirmation?
$AIN
{future}(AINUSDT)
#AINUSDT $
🚀 AINUSDT: Too Early to Short?
After a massive 200%+ pump, shorting might look tempting—but chasing the top is a dangerous game.
📊 Price: $0.15142
🔹 Resistance: $0.16985
🔹 Key support: $0.14932
🔹 RSI(6): 47.13
🟢 Bullish scenario: A high-volume breakout above $0.16985 could trigger another squeeze.
🔴 Bearish scenario: Losing $0.14932 and failing to reclaim it could open the door to a deeper correction.
🎯 My take: No blind shorts. Let price confirm the direction first. The next move could punish both impatient bulls and early bears.
Would you risk shorting here, or wait for confirmation?
$AIN
#AINUSDT $
After a massive 200%+ pump, shorting might look tempting—but chasing the top is a dangerous game.
📊 Price: $0.15142
🔹 Resistance: $0.16985
🔹 Key support: $0.14932
🔹 RSI(6): 47.13
🟢 Bullish scenario: A high-volume breakout above $0.16985 could trigger another squeeze.
🔴 Bearish scenario: Losing $0.14932 and failing to reclaim it could open the door to a deeper correction.
🎯 My take: No blind shorts. Let price confirm the direction first. The next move could punish both impatient bulls and early bears.
Would you risk shorting here, or wait for confirmation?
$AIN
#AINUSDT $
1
708
·
--
උසබ තත්ත්වය
1
1
757
·
--
උසබ තත්ත්වය
1
474
·
--
ලිපිය
🚨 3 Binance Futures Gainers: Which Coin Has the Best Setup?🚨 3 Binance Futures Gainers: Which Coin Has the Best Setup?
TAUSDT vs. SKYAIUSDT vs. APRUSDT | 15-Minute Technical Analysis
A coin being up 20%, 40%, or 60% doesn't automatically make it a good trade.
The better opportunity often comes after the first move, when price consolidates and shows whether buyers are still in control. If the rally is already exhausted, late entries can quickly become exit liquidity.
Here are the three Binance Futures gainers on my radar:
🟢 TAUSDT: Strong trend, testing resistance
🟡 SKYAIUSDT: Recovering after a sharp sell-off
🔴 APRUSDT: High volatility with no clear direction
The levels below are based on 15-minute screenshots captured on October 25, 2026. These are conditional setups, not live signals.
---
🥇 1. TAUSDT — The Cleanest Structure
Price: $0.05821
24H Change: +14.38%
24H High: $0.05839
RSI(6): 62.88
TA has the strongest structure of the three. Price pushed from roughly $0.05300 to $0.05821 and is now consolidating near the highs instead of giving back the entire move.
That is generally what you want to see in a healthy momentum setup.
Key levels
- Bollinger Upper Band: $0.05853
- Bollinger Middle Band: $0.05774
- Bollinger Lower Band: $0.05694
- Supertrend: $0.05584
Price is holding above the middle band, and RSI is strong without being excessively stretched.
The main issue is resistance around $0.05839–$0.05853. A wick above that zone is not enough; I want to see a clean 15-minute close and a retest that holds.
Bullish setup
🟢 Entry: $0.05840–$0.05860 after a confirmed breakout and retest
🎯 TP1: $0.05920
🎯 TP2: $0.06000
🎯 TP3: $0.06100
🛑 Invalidation: Failed breakout with sustained weakness below $0.05760
A pullback into $0.05760–$0.05775 could also be interesting if buyers defend the area.
Verdict: TA is the first chart I would watch, but I would not chase it into resistance.
---
🥈 2. SKYAIUSDT — Recovery, but Resistance Is Close
Price: $0.03761
24H Change: +20.89%
24H High: $0.03985
RSI(6): 70.14
SKYAI rallied toward $0.03985 before dropping sharply to around $0.03341. Buyers have since recovered part of that decline, but the key question is whether this is the start of another leg higher or just a relief bounce.
Key levels
- Bollinger Upper Band: $0.03776
- Bollinger Middle Band: $0.03646
- Bollinger Lower Band: $0.03516
- Supertrend: $0.03911
Price has reclaimed the middle band and is testing the upper band. That is constructive, but RSI near 70 means momentum is already stretched in the short term.
The Supertrend at $0.03911 and the previous high near $0.03985 are the main resistance levels.
Bullish setup
🟢 Entry: $0.03780–$0.03800 after a confirmed breakout and retest
🎯 TP1: $0.03820
🎯 TP2: $0.03880
🎯 TP3: $0.03980
🛑 Invalidation: Failed breakout followed by a move below $0.03640
If price rejects the $0.03776–$0.03911 area and then loses $0.03646 on rising volume, the recovery is likely weakening.
That said, RSI above 70 is not an automatic short signal. Strong momentum can stay overbought longer than expected.
Verdict: SKYAI has momentum, but it still needs to clear a crowded resistance zone.
---
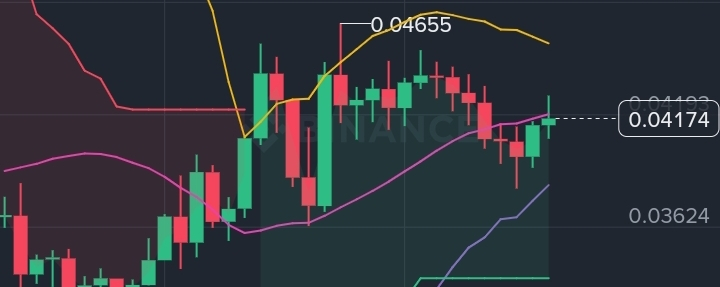
🥉 3. APRUSDT — Big Move, Unclear Follow-Through
Price: $0.04175
24H Change: +62.51%
24H High: $0.05490
24H Low: $0.02509
RSI(6): 52.06
APR is the most volatile chart here. After a huge rally, price pulled back sharply and moved into consolidation.
It is trading slightly below the Bollinger middle band, while RSI is close to neutral. That tells me the initial momentum has cooled and the chart needs more confirmation.
Key levels
- Bollinger Upper Band: $0.04555
- Bollinger Middle Band: $0.04196
- Bollinger Lower Band: $0.03837
- Supertrend: $0.03366
Being below the middle band does not automatically make APR bearish, but buyers need to reclaim that area to regain control.
Bullish setup
🟢 Entry: $0.04220–$0.04250 after confirmation
🎯 TP1: $0.04300
🎯 TP2: $0.04400
🎯 TP3: $0.04550
🛑 Invalidation: Sustained weakness below $0.04100
If APR fails to reclaim $0.04200–$0.04220 and loses $0.04100, the next levels to watch are:
🎯 Downside level 1: $0.04000
🎯 Downside level 2: $0.03840
APR can move quickly in either direction, so position size matters more than usual.
Verdict: APR has the most volatility, but not the clearest risk-reward. I would wait for a cleaner break before trading it.
---
📊 The Final Comparison
TAUSDT
Price structure: Strong uptrend
RSI(6): 62.88
Position vs. middle band: Above
Main resistance: $0.05839–$0.05853
Main concern: Failed breakout
My priority: 🥇 First
SKYAIUSDT
Price structure: Recovery
RSI(6): 70.14
Position vs. middle band: Above
Main resistance: $0.03776–$0.03911
Main concern: Rejection at resistance
My priority: 🥈 Second
APRUSDT
Price structure: Consolidation
RSI(6): 52.06
Position vs. middle band: Slightly below
Main resistance: $0.04200–$0.04555
Main concern: Extreme volatility
My priority: 🥉 Third
🧠 My Trading Plan
TAUSDT is the one I would monitor first.
The trend is still strong, price is consolidating near the highs, and the breakout level is easy to define. SKYAI is worth watching too, but it has more resistance overhead. APR ranks third because the post-pump structure is still unclear.
The plan is straightforward:
✅ Wait for confirmation instead of chasing a green candle.
✅ Look for volume to expand on the breakout.
✅ Prefer a successful retest over a blind entry.
✅ Set invalidation before entering.
✅ Cut position size when volatility picks up.
The goal is not to predict every candle. It is to find a setup where the potential upside justifies the risk.
Which one would you watch?
🟢 TAUSDT — Breakout potential
🟡 SKYAIUSDT — Recovery play
🔴 APRUSDT — High-volatility opportunity
Disclaimer: This post is for educational purposes only and is not financial advice. Cryptocurrency futures involve substantial risk, including liquidation. The levels shown are based on historical screenshots and may no longer be valid. Always verify current prices, use appropriate risk management, and never risk money you cannot afford to lose.
$SKYAI
{future}(SKYAIUSDT)
$TA
{future}(TAUSDT)
$APR
{future}(APRUSDT)
#CryptoTradingInsights #GAINERS
🚨 3 Binance Futures Gainers: Which Coin Has the Best Setup?
🚨 3 Binance Futures Gainers: Which Coin Has the Best Setup?
TAUSDT vs. SKYAIUSDT vs. APRUSDT | 15-Minute Technical Analysis
A coin being up 20%, 40%, or 60% doesn't automatically make it a good trade.
The better opportunity often comes after the first move, when price consolidates and shows whether buyers are still in control. If the rally is already exhausted, late entries can quickly become exit liquidity.
Here are the three Binance Futures gainers on my radar:
🟢 TAUSDT: Strong trend, testing resistance
🟡 SKYAIUSDT: Recovering after a sharp sell-off
🔴 APRUSDT: High volatility with no clear direction
The levels below are based on 15-minute screenshots captured on October 25, 2026. These are conditional setups, not live signals.
---
🥇 1. TAUSDT — The Cleanest Structure
Price: $0.05821
24H Change: +14.38%
24H High: $0.05839
RSI(6): 62.88
TA has the strongest structure of the three. Price pushed from roughly $0.05300 to $0.05821 and is now consolidating near the highs instead of giving back the entire move.
That is generally what you want to see in a healthy momentum setup.
Key levels
- Bollinger Upper Band: $0.05853
- Bollinger Middle Band: $0.05774
- Bollinger Lower Band: $0.05694
- Supertrend: $0.05584
Price is holding above the middle band, and RSI is strong without being excessively stretched.
The main issue is resistance around $0.05839–$0.05853. A wick above that zone is not enough; I want to see a clean 15-minute close and a retest that holds.
Bullish setup
🟢 Entry: $0.05840–$0.05860 after a confirmed breakout and retest
🎯 TP1: $0.05920
🎯 TP2: $0.06000
🎯 TP3: $0.06100
🛑 Invalidation: Failed breakout with sustained weakness below $0.05760
A pullback into $0.05760–$0.05775 could also be interesting if buyers defend the area.
Verdict: TA is the first chart I would watch, but I would not chase it into resistance.
---
🥈 2. SKYAIUSDT — Recovery, but Resistance Is Close
Price: $0.03761
24H Change: +20.89%
24H High: $0.03985
RSI(6): 70.14
SKYAI rallied toward $0.03985 before dropping sharply to around $0.03341. Buyers have since recovered part of that decline, but the key question is whether this is the start of another leg higher or just a relief bounce.
Key levels
- Bollinger Upper Band: $0.03776
- Bollinger Middle Band: $0.03646
- Bollinger Lower Band: $0.03516
- Supertrend: $0.03911
Price has reclaimed the middle band and is testing the upper band. That is constructive, but RSI near 70 means momentum is already stretched in the short term.
The Supertrend at $0.03911 and the previous high near $0.03985 are the main resistance levels.
Bullish setup
🟢 Entry: $0.03780–$0.03800 after a confirmed breakout and retest
🎯 TP1: $0.03820
🎯 TP2: $0.03880
🎯 TP3: $0.03980
🛑 Invalidation: Failed breakout followed by a move below $0.03640
If price rejects the $0.03776–$0.03911 area and then loses $0.03646 on rising volume, the recovery is likely weakening.
That said, RSI above 70 is not an automatic short signal. Strong momentum can stay overbought longer than expected.
Verdict: SKYAI has momentum, but it still needs to clear a crowded resistance zone.
---
🥉 3. APRUSDT — Big Move, Unclear Follow-Through
Price: $0.04175
24H Change: +62.51%
24H High: $0.05490
24H Low: $0.02509
RSI(6): 52.06
APR is the most volatile chart here. After a huge rally, price pulled back sharply and moved into consolidation.
It is trading slightly below the Bollinger middle band, while RSI is close to neutral. That tells me the initial momentum has cooled and the chart needs more confirmation.
Key levels
- Bollinger Upper Band: $0.04555
- Bollinger Middle Band: $0.04196
- Bollinger Lower Band: $0.03837
- Supertrend: $0.03366
Being below the middle band does not automatically make APR bearish, but buyers need to reclaim that area to regain control.
Bullish setup
🟢 Entry: $0.04220–$0.04250 after confirmation
🎯 TP1: $0.04300
🎯 TP2: $0.04400
🎯 TP3: $0.04550
🛑 Invalidation: Sustained weakness below $0.04100
If APR fails to reclaim $0.04200–$0.04220 and loses $0.04100, the next levels to watch are:
🎯 Downside level 1: $0.04000
🎯 Downside level 2: $0.03840
APR can move quickly in either direction, so position size matters more than usual.
Verdict: APR has the most volatility, but not the clearest risk-reward. I would wait for a cleaner break before trading it.
---
📊 The Final Comparison
TAUSDT
Price structure: Strong uptrend
RSI(6): 62.88
Position vs. middle band: Above
Main resistance: $0.05839–$0.05853
Main concern: Failed breakout
My priority: 🥇 First
SKYAIUSDT
Price structure: Recovery
RSI(6): 70.14
Position vs. middle band: Above
Main resistance: $0.03776–$0.03911
Main concern: Rejection at resistance
My priority: 🥈 Second
APRUSDT
Price structure: Consolidation
RSI(6): 52.06
Position vs. middle band: Slightly below
Main resistance: $0.04200–$0.04555
Main concern: Extreme volatility
My priority: 🥉 Third
🧠 My Trading Plan
TAUSDT is the one I would monitor first.
The trend is still strong, price is consolidating near the highs, and the breakout level is easy to define. SKYAI is worth watching too, but it has more resistance overhead. APR ranks third because the post-pump structure is still unclear.
The plan is straightforward:
✅ Wait for confirmation instead of chasing a green candle.
✅ Look for volume to expand on the breakout.
✅ Prefer a successful retest over a blind entry.
✅ Set invalidation before entering.
✅ Cut position size when volatility picks up.
The goal is not to predict every candle. It is to find a setup where the potential upside justifies the risk.
Which one would you watch?
🟢 TAUSDT — Breakout potential
🟡 SKYAIUSDT — Recovery play
🔴 APRUSDT — High-volatility opportunity
Disclaimer: This post is for educational purposes only and is not financial advice. Cryptocurrency futures involve substantial risk, including liquidation. The levels shown are based on historical screenshots and may no longer be valid. Always verify current prices, use appropriate risk management, and never risk money you cannot afford to lose.
$SKYAI
$TA
$APR
#CryptoTradingInsights #GAINERS
TAUSDT vs. SKYAIUSDT vs. APRUSDT | 15-Minute Technical Analysis
A coin being up 20%, 40%, or 60% doesn't automatically make it a good trade.
The better opportunity often comes after the first move, when price consolidates and shows whether buyers are still in control. If the rally is already exhausted, late entries can quickly become exit liquidity.
Here are the three Binance Futures gainers on my radar:
🟢 TAUSDT: Strong trend, testing resistance
🟡 SKYAIUSDT: Recovering after a sharp sell-off
🔴 APRUSDT: High volatility with no clear direction
The levels below are based on 15-minute screenshots captured on October 25, 2026. These are conditional setups, not live signals.
---
🥇 1. TAUSDT — The Cleanest Structure
Price: $0.05821
24H Change: +14.38%
24H High: $0.05839
RSI(6): 62.88
TA has the strongest structure of the three. Price pushed from roughly $0.05300 to $0.05821 and is now consolidating near the highs instead of giving back the entire move.
That is generally what you want to see in a healthy momentum setup.
Key levels
- Bollinger Upper Band: $0.05853
- Bollinger Middle Band: $0.05774
- Bollinger Lower Band: $0.05694
- Supertrend: $0.05584
Price is holding above the middle band, and RSI is strong without being excessively stretched.
The main issue is resistance around $0.05839–$0.05853. A wick above that zone is not enough; I want to see a clean 15-minute close and a retest that holds.
Bullish setup
🟢 Entry: $0.05840–$0.05860 after a confirmed breakout and retest
🎯 TP1: $0.05920
🎯 TP2: $0.06000
🎯 TP3: $0.06100
🛑 Invalidation: Failed breakout with sustained weakness below $0.05760
A pullback into $0.05760–$0.05775 could also be interesting if buyers defend the area.
Verdict: TA is the first chart I would watch, but I would not chase it into resistance.
---
🥈 2. SKYAIUSDT — Recovery, but Resistance Is Close
Price: $0.03761
24H Change: +20.89%
24H High: $0.03985
RSI(6): 70.14
SKYAI rallied toward $0.03985 before dropping sharply to around $0.03341. Buyers have since recovered part of that decline, but the key question is whether this is the start of another leg higher or just a relief bounce.
Key levels
- Bollinger Upper Band: $0.03776
- Bollinger Middle Band: $0.03646
- Bollinger Lower Band: $0.03516
- Supertrend: $0.03911
Price has reclaimed the middle band and is testing the upper band. That is constructive, but RSI near 70 means momentum is already stretched in the short term.
The Supertrend at $0.03911 and the previous high near $0.03985 are the main resistance levels.
Bullish setup
🟢 Entry: $0.03780–$0.03800 after a confirmed breakout and retest
🎯 TP1: $0.03820
🎯 TP2: $0.03880
🎯 TP3: $0.03980
🛑 Invalidation: Failed breakout followed by a move below $0.03640
If price rejects the $0.03776–$0.03911 area and then loses $0.03646 on rising volume, the recovery is likely weakening.
That said, RSI above 70 is not an automatic short signal. Strong momentum can stay overbought longer than expected.
Verdict: SKYAI has momentum, but it still needs to clear a crowded resistance zone.
---
🥉 3. APRUSDT — Big Move, Unclear Follow-Through
Price: $0.04175
24H Change: +62.51%
24H High: $0.05490
24H Low: $0.02509
RSI(6): 52.06
APR is the most volatile chart here. After a huge rally, price pulled back sharply and moved into consolidation.
It is trading slightly below the Bollinger middle band, while RSI is close to neutral. That tells me the initial momentum has cooled and the chart needs more confirmation.
Key levels
- Bollinger Upper Band: $0.04555
- Bollinger Middle Band: $0.04196
- Bollinger Lower Band: $0.03837
- Supertrend: $0.03366
Being below the middle band does not automatically make APR bearish, but buyers need to reclaim that area to regain control.
Bullish setup
🟢 Entry: $0.04220–$0.04250 after confirmation
🎯 TP1: $0.04300
🎯 TP2: $0.04400
🎯 TP3: $0.04550
🛑 Invalidation: Sustained weakness below $0.04100
If APR fails to reclaim $0.04200–$0.04220 and loses $0.04100, the next levels to watch are:
🎯 Downside level 1: $0.04000
🎯 Downside level 2: $0.03840
APR can move quickly in either direction, so position size matters more than usual.
Verdict: APR has the most volatility, but not the clearest risk-reward. I would wait for a cleaner break before trading it.
---
📊 The Final Comparison
TAUSDT
Price structure: Strong uptrend
RSI(6): 62.88
Position vs. middle band: Above
Main resistance: $0.05839–$0.05853
Main concern: Failed breakout
My priority: 🥇 First
SKYAIUSDT
Price structure: Recovery
RSI(6): 70.14
Position vs. middle band: Above
Main resistance: $0.03776–$0.03911
Main concern: Rejection at resistance
My priority: 🥈 Second
APRUSDT
Price structure: Consolidation
RSI(6): 52.06
Position vs. middle band: Slightly below
Main resistance: $0.04200–$0.04555
Main concern: Extreme volatility
My priority: 🥉 Third
🧠 My Trading Plan
TAUSDT is the one I would monitor first.
The trend is still strong, price is consolidating near the highs, and the breakout level is easy to define. SKYAI is worth watching too, but it has more resistance overhead. APR ranks third because the post-pump structure is still unclear.
The plan is straightforward:
✅ Wait for confirmation instead of chasing a green candle.
✅ Look for volume to expand on the breakout.
✅ Prefer a successful retest over a blind entry.
✅ Set invalidation before entering.
✅ Cut position size when volatility picks up.
The goal is not to predict every candle. It is to find a setup where the potential upside justifies the risk.
Which one would you watch?
🟢 TAUSDT — Breakout potential
🟡 SKYAIUSDT — Recovery play
🔴 APRUSDT — High-volatility opportunity
Disclaimer: This post is for educational purposes only and is not financial advice. Cryptocurrency futures involve substantial risk, including liquidation. The levels shown are based on historical screenshots and may no longer be valid. Always verify current prices, use appropriate risk management, and never risk money you cannot afford to lose.
$SKYAI
$TA
$APR
#CryptoTradingInsights #GAINERS
1
750
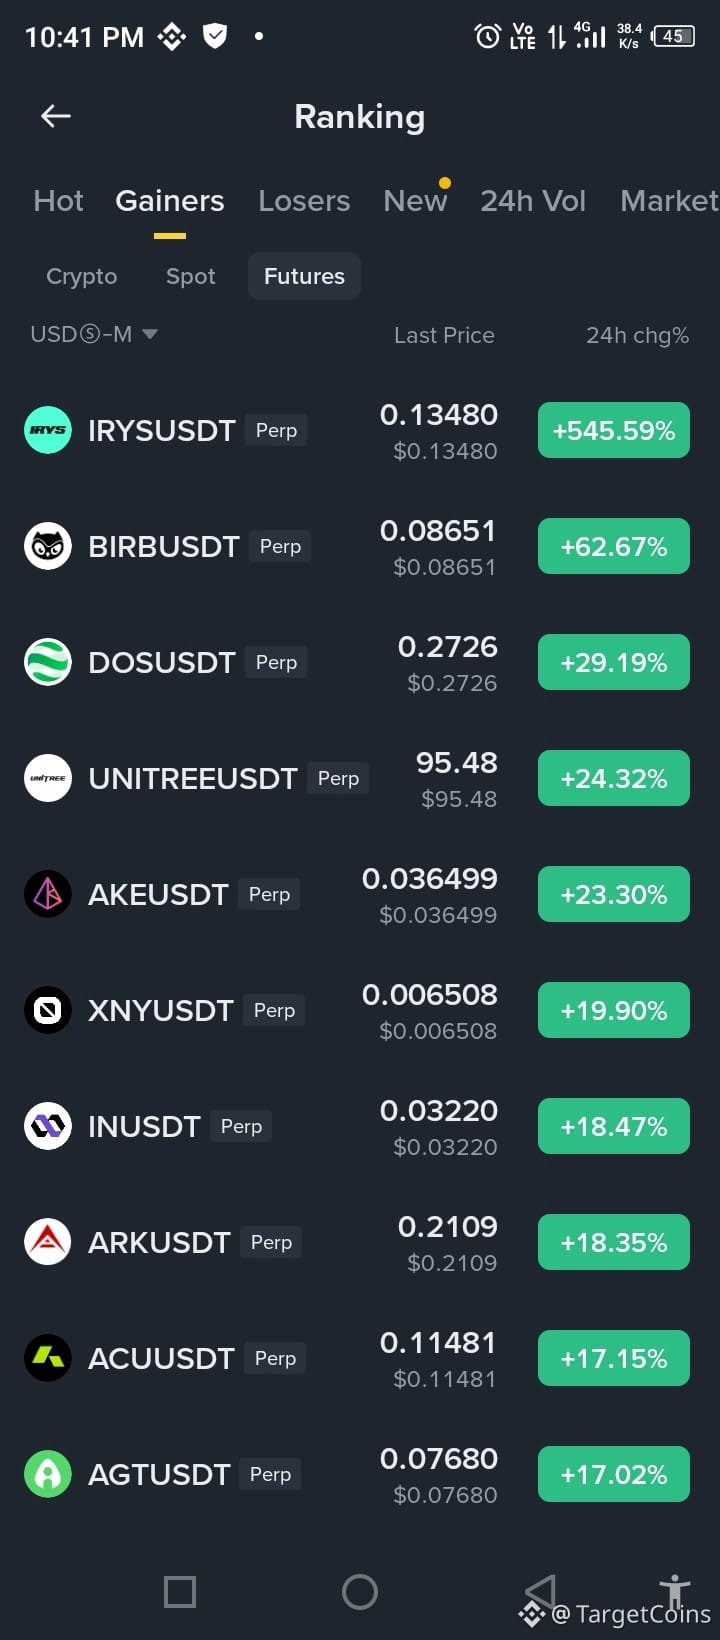
·
--
බෙයාරිෂ්
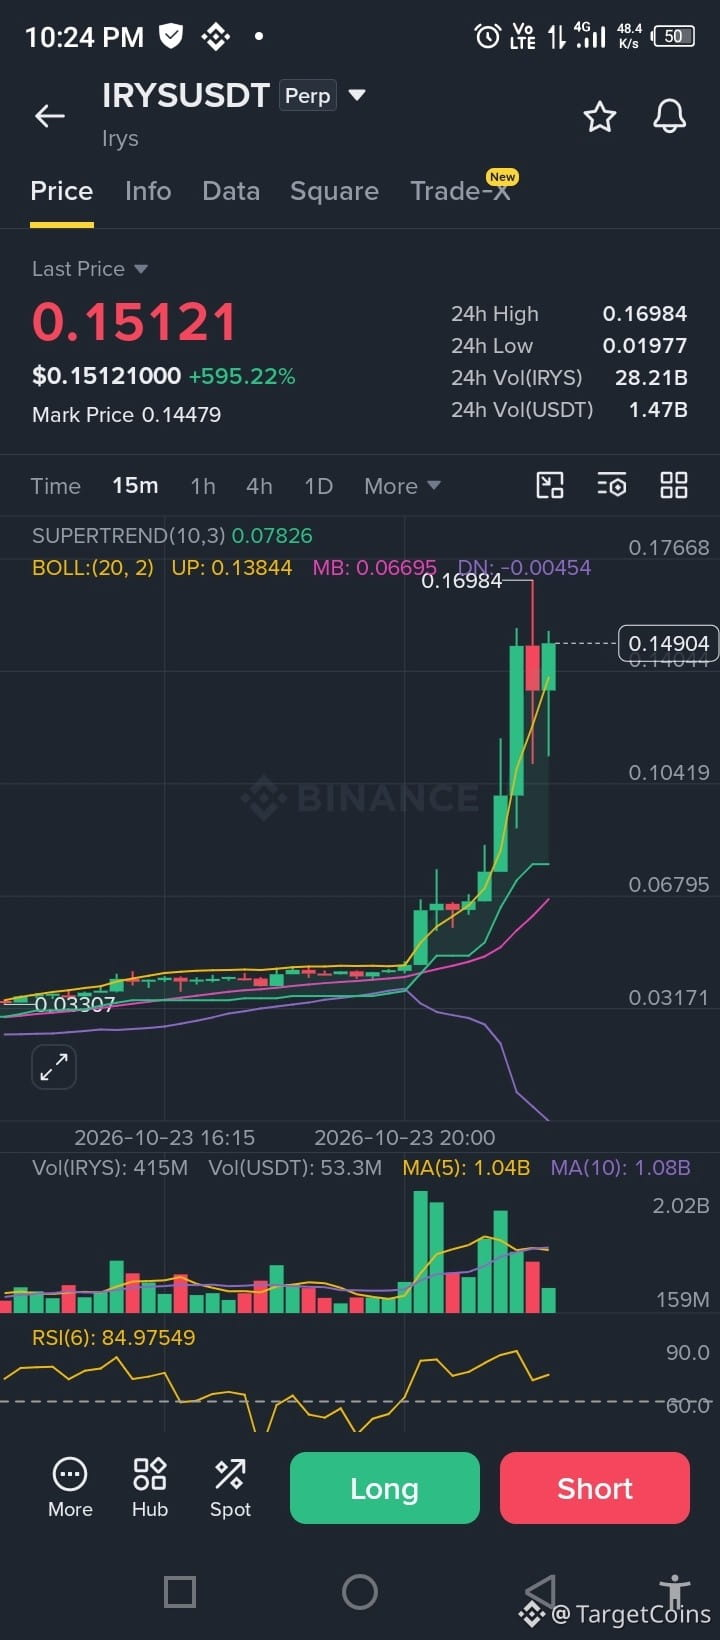
Short Confirmation Call 🤙
Short Entry from 0.20
Then long red candles ⛷️
$IRYS
{future}(IRYSUSDT)
Short Confirmation Call 🤙
Short Entry from 0.20
Then long red candles ⛷️
$IRYS
Short Entry from 0.20
Then long red candles ⛷️
$IRYS
1
728
·
--
🚨 THE DEFEAT OF TECHNICAL ANALYSIS? $IRYS JUST SHOCKED THE MARKET! 🚀
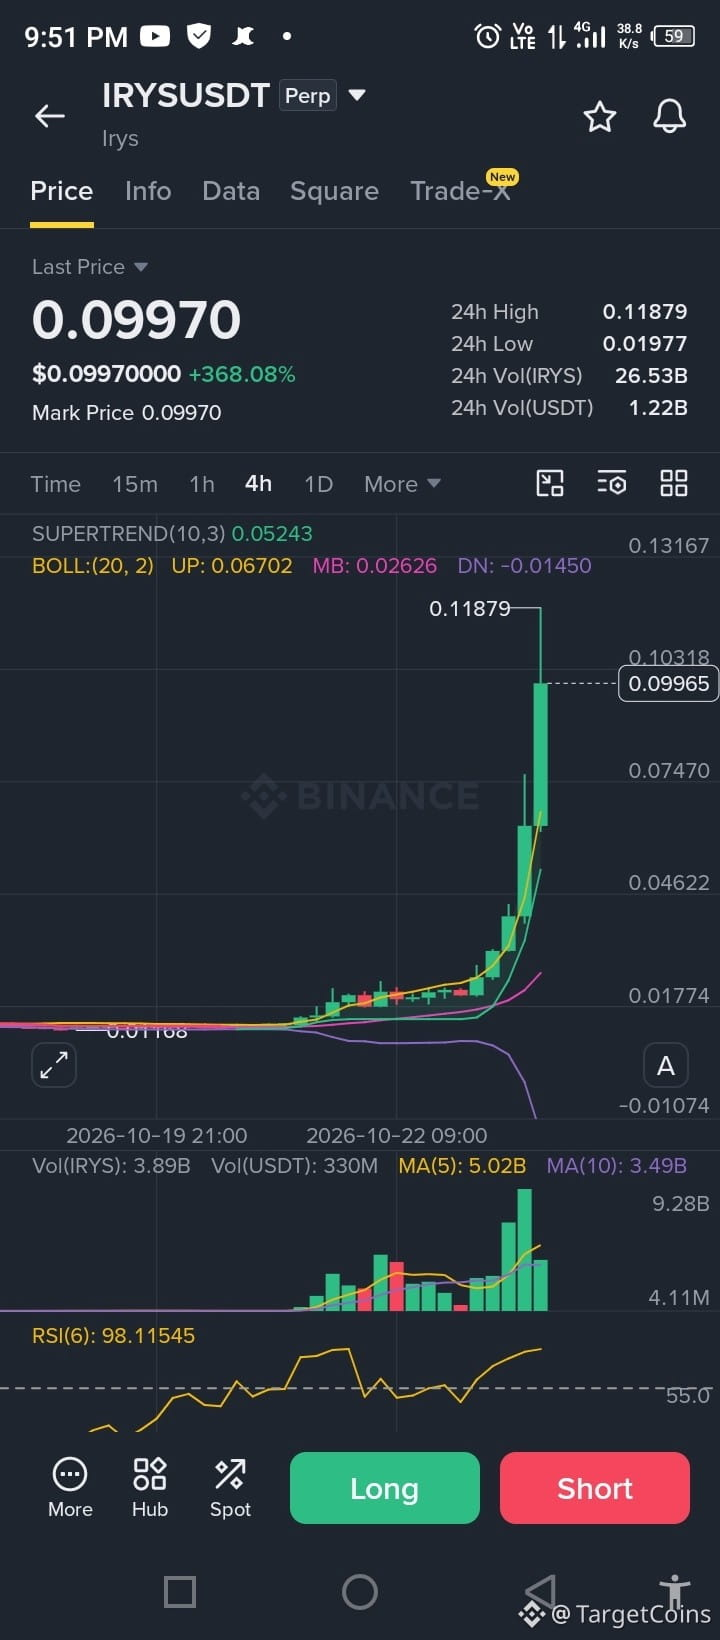
+368% in 24 hours. RSI at 98. And the rally still isn't behaving the way many traders expected.
Look at this chart. 👀
📈 Price: $0.09970
🔥 24H High: $0.11879
🚀 24H Gain: +368%
⚠️ 4H RSI(6): 98.11
📊 Upper Bollinger Band: $0.06702
According to conventional technical analysis, IRYS looks extremely overextended.
RSI near 98? Danger zone.
Price far above the upper Bollinger Band? Extreme extension.
A near-vertical rally? Many traders expect a sharp correction.
But what if you shorted simply because the indicators looked overbought? 😳
You might have learned an expensive lesson.
🔥 THE REAL LESSON
Technical indicators aren't crystal balls. They describe market conditions; they don't guarantee the next move.
During explosive momentum, a coin can remain overbought far longer than short sellers can stay solvent.
⚠️ WHAT HAPPENS NEXT?
After a move this extreme, a violent correction is possible. But another explosive spike cannot be ruled out.
Chasing the rally is dangerous. Shorting blindly is dangerous, too.
The smart move? Respect the momentum, manage your risk, and wait for confirmation.
Did IRYS defeat technical analysis—or expose the danger of using indicators without understanding market momentum?
👇 What's your take?
#IRYS #CryptoTrading $IRYS
{future}(IRYSUSDT)
🚨 THE DEFEAT OF TECHNICAL ANALYSIS? $IRYS JUST SHOCKED THE MARKET! 🚀
+368% in 24 hours. RSI at 98. And the rally still isn't behaving the way many traders expected.
Look at this chart. 👀
📈 Price: $0.09970
🔥 24H High: $0.11879
🚀 24H Gain: +368%
⚠️ 4H RSI(6): 98.11
📊 Upper Bollinger Band: $0.06702
According to conventional technical analysis, IRYS looks extremely overextended.
RSI near 98? Danger zone.
Price far above the upper Bollinger Band? Extreme extension.
A near-vertical rally? Many traders expect a sharp correction.
But what if you shorted simply because the indicators looked overbought? 😳
You might have learned an expensive lesson.
🔥 THE REAL LESSON
Technical indicators aren't crystal balls. They describe market conditions; they don't guarantee the next move.
During explosive momentum, a coin can remain overbought far longer than short sellers can stay solvent.
⚠️ WHAT HAPPENS NEXT?
After a move this extreme, a violent correction is possible. But another explosive spike cannot be ruled out.
Chasing the rally is dangerous. Shorting blindly is dangerous, too.
The smart move? Respect the momentum, manage your risk, and wait for confirmation.
Did IRYS defeat technical analysis—or expose the danger of using indicators without understanding market momentum?
👇 What's your take?
#IRYS #CryptoTrading $IRYS
+368% in 24 hours. RSI at 98. And the rally still isn't behaving the way many traders expected.
Look at this chart. 👀
📈 Price: $0.09970
🔥 24H High: $0.11879
🚀 24H Gain: +368%
⚠️ 4H RSI(6): 98.11
📊 Upper Bollinger Band: $0.06702
According to conventional technical analysis, IRYS looks extremely overextended.
RSI near 98? Danger zone.
Price far above the upper Bollinger Band? Extreme extension.
A near-vertical rally? Many traders expect a sharp correction.
But what if you shorted simply because the indicators looked overbought? 😳
You might have learned an expensive lesson.
🔥 THE REAL LESSON
Technical indicators aren't crystal balls. They describe market conditions; they don't guarantee the next move.
During explosive momentum, a coin can remain overbought far longer than short sellers can stay solvent.
⚠️ WHAT HAPPENS NEXT?
After a move this extreme, a violent correction is possible. But another explosive spike cannot be ruled out.
Chasing the rally is dangerous. Shorting blindly is dangerous, too.
The smart move? Respect the momentum, manage your risk, and wait for confirmation.
Did IRYS defeat technical analysis—or expose the danger of using indicators without understanding market momentum?
👇 What's your take?
#IRYS #CryptoTrading $IRYS
1
384
·
--
බෙයාරිෂ්
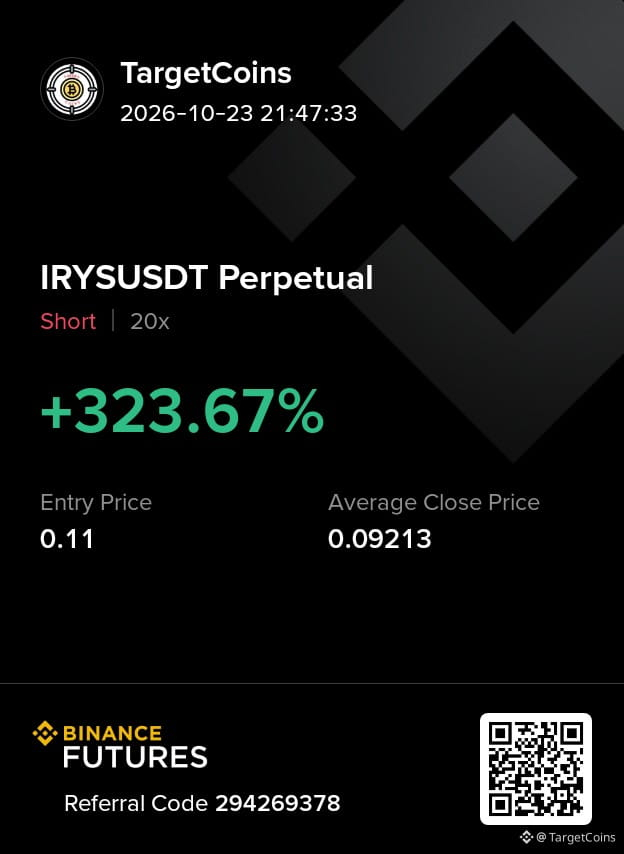
I am out for a while .
waiting for new confirmation
$IRYS
{future}(IRYSUSDT)
I am out for a while .
waiting for new confirmation
$IRYS
waiting for new confirmation
$IRYS
1
594
·
--
බෙයාරිෂ්
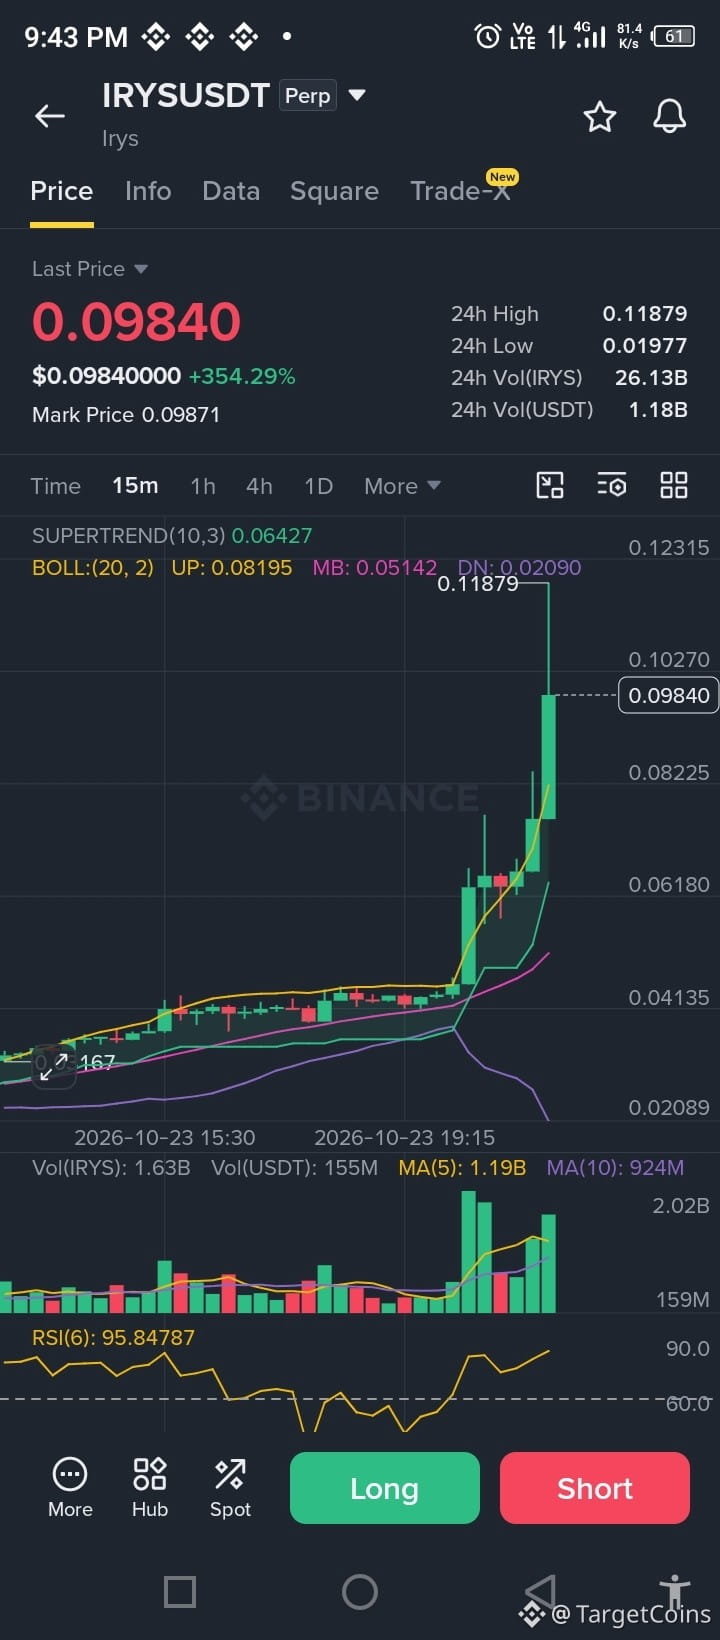
🚨 $IRYS JUST EXPLODED +354%… AND THE CHART LOOKS INSANE! 🔥
From $0.01977 to a high of $0.11879.
Now trading around $0.09840.
$1.18 BILLION in 24H USDT VOLUME. 🤯
This is no ordinary move. The market is watching.
But here's where things get dangerous 👇
📈 THE BULLISH CASE
🟢 Momentum is still powerful.
🟢 A clean breakout above $0.11879 could open the door to another leg up.
🟢 Volume shows intense market participation.
⚠️ THE DANGER
🔴 15m RSI is near 96.
🔴 Price is trading far above the upper Bollinger Band.
🔴 One sharp reversal could trap late buyers.
🎯 KEY LEVELS TO WATCH
Resistance: $0.11879
Potential pullback zone: $0.082
Major indicator reference: $0.064–$0.065
My take? I wouldn't chase this candle, and I wouldn't blindly short it either.
The next move could be explosive in either direction. Let price confirm.
Be honest: Is $IRYS going to $0.15, or is a brutal correction coming first? 👀
#IRYS $IRYS
{future}(IRYSUSDT)
🚨 $IRYS JUST EXPLODED +354%… AND THE CHART LOOKS INSANE! 🔥
From $0.01977 to a high of $0.11879.
Now trading around $0.09840.
$1.18 BILLION in 24H USDT VOLUME. 🤯
This is no ordinary move. The market is watching.
But here's where things get dangerous 👇
📈 THE BULLISH CASE
🟢 Momentum is still powerful.
🟢 A clean breakout above $0.11879 could open the door to another leg up.
🟢 Volume shows intense market participation.
⚠️ THE DANGER
🔴 15m RSI is near 96.
🔴 Price is trading far above the upper Bollinger Band.
🔴 One sharp reversal could trap late buyers.
🎯 KEY LEVELS TO WATCH
Resistance: $0.11879
Potential pullback zone: $0.082
Major indicator reference: $0.064–$0.065
My take? I wouldn't chase this candle, and I wouldn't blindly short it either.
The next move could be explosive in either direction. Let price confirm.
Be honest: Is $IRYS going to $0.15, or is a brutal correction coming first? 👀
#IRYS $IRYS
From $0.01977 to a high of $0.11879.
Now trading around $0.09840.
$1.18 BILLION in 24H USDT VOLUME. 🤯
This is no ordinary move. The market is watching.
But here's where things get dangerous 👇
📈 THE BULLISH CASE
🟢 Momentum is still powerful.
🟢 A clean breakout above $0.11879 could open the door to another leg up.
🟢 Volume shows intense market participation.
⚠️ THE DANGER
🔴 15m RSI is near 96.
🔴 Price is trading far above the upper Bollinger Band.
🔴 One sharp reversal could trap late buyers.
🎯 KEY LEVELS TO WATCH
Resistance: $0.11879
Potential pullback zone: $0.082
Major indicator reference: $0.064–$0.065
My take? I wouldn't chase this candle, and I wouldn't blindly short it either.
The next move could be explosive in either direction. Let price confirm.
Be honest: Is $IRYS going to $0.15, or is a brutal correction coming first? 👀
#IRYS $IRYS
1
463
තවත් අන්තර්ගතයන් ගවේෂණය කිරීමට ඇතුල් වන්න
Binance චතුරශ්රය හි ගෝලීය ක්රිප්ටෝ පරිශීලකයින් හා එක්වන්න
⚡️ ක්රිප්ටෝ පිළිබඳ නවතම සහ ප්රයෝජනවත් තොරතුරු ලබා ගන්න.
💬 ලොව විශාලතම ක්රිප්ටෝ හුවමාරුව මගින් විශ්වාස කෙරේ.
👍 සත්යායනය කරන ලද නිර්මාණකරුවන්ගෙන් සැබෑ විදසුන් සොයා ගන්න.
විද්යුත් තැපෑල / දුරකථන අංකය
නැගී එන මාතෘකා
BinanceIncidentReport
52,667 නැරඹීම්
660 සාකච්ඡා කරමින්
29 October 2026 Binance Security Incident: Initial Findings and Response Update
Binance Blog
·333 කැමත්ත දැක්වීම්
·976.8k නැරඹීම්
BinanceReopensWithdrawalsForMoreAssets
170,471 නැරඹීම්
1,823 සාකච්ඡා කරමින්
BinanceHourlyDepositsExceedWithdrawals
80,968 නැරඹීම්
847 සාකච්ඡා කරමින්