
MS_Shoaib
9 පෝස්ටු

MS_Shoaib
වාර්තා කරන්න
පරිශීලක අවහිර කරන්න
විවෘත වෙළෙඳාම
{වේලාව} දින
22 හඹා යමින්
6 හඹා යන්නන්
0 කැමති විය
පෝස්ටු
ආයෝජන කළඹ
·
--
උසබ තත්ත්වය
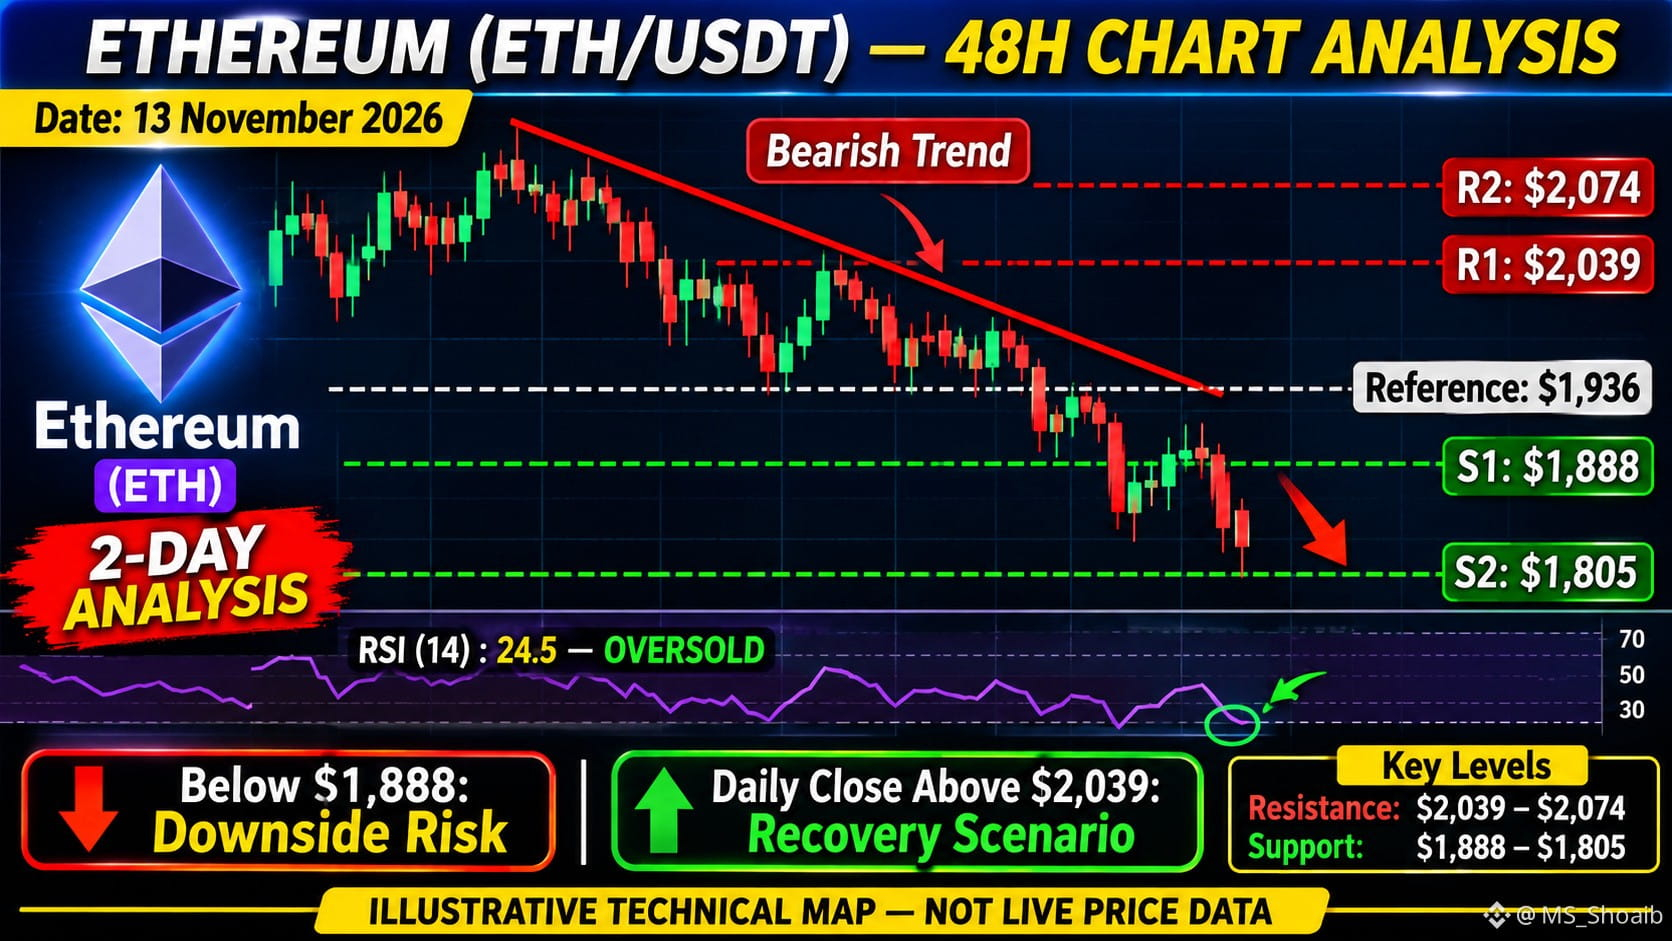
ETHEREUM (ETH) – 2-DAY MARKET ANALYSIS
Date: November 13, 2026
Hello everyone!
Today, we are going to analyze Ethereum (ETH) and discuss its possible market direction over the next 48 hours.
Current Market Overview
Ethereum is currently showing bearish pressure. Selling activity is visible in the market, and the price is approaching an important support zone.
Key Support Levels
- First Support: $1,888
- Second Support: $1,805
Key Resistance Levels
- First Resistance: $2,039
- Second Resistance: $2,074
Next 24 Hours
If Ethereum holds above the $1,888 support level, we could see a short-term recovery.
However, if the price closes below this level on the daily chart, further downside pressure may develop.
Next 48 Hours
If Ethereum reclaims the $2,039 resistance level, the short-term market outlook could improve.
On the other hand, if the support level breaks, the price could face additional downward pressure.
Final Analysis
Currently, Ethereum's short-term trend appears bearish.
Traders should closely monitor the important support and resistance levels before making any trading decisions.
Risk Disclaimer: This analysis is for educational purposes only. It is not financial advice.
Don't forget to Like, Share, and Follow for more professional crypto market analysis.
Thank you!
$ETH
{future}(ETHUSDT)
#ETHETFS #BTC #Binance
ETHEREUM (ETH) – 2-DAY MARKET ANALYSIS
Date: November 13, 2026
Hello everyone!
Today, we are going to analyze Ethereum (ETH) and discuss its possible market direction over the next 48 hours.
Current Market Overview
Ethereum is currently showing bearish pressure. Selling activity is visible in the market, and the price is approaching an important support zone.
Key Support Levels
- First Support: $1,888
- Second Support: $1,805
Key Resistance Levels
- First Resistance: $2,039
- Second Resistance: $2,074
Next 24 Hours
If Ethereum holds above the $1,888 support level, we could see a short-term recovery.
However, if the price closes below this level on the daily chart, further downside pressure may develop.
Next 48 Hours
If Ethereum reclaims the $2,039 resistance level, the short-term market outlook could improve.
On the other hand, if the support level breaks, the price could face additional downward pressure.
Final Analysis
Currently, Ethereum's short-term trend appears bearish.
Traders should closely monitor the important support and resistance levels before making any trading decisions.
Risk Disclaimer: This analysis is for educational purposes only. It is not financial advice.
Don't forget to Like, Share, and Follow for more professional crypto market analysis.
Thank you!
$ETH
#ETHETFS #BTC #Binance
Date: November 13, 2026
Hello everyone!
Today, we are going to analyze Ethereum (ETH) and discuss its possible market direction over the next 48 hours.
Current Market Overview
Ethereum is currently showing bearish pressure. Selling activity is visible in the market, and the price is approaching an important support zone.
Key Support Levels
- First Support: $1,888
- Second Support: $1,805
Key Resistance Levels
- First Resistance: $2,039
- Second Resistance: $2,074
Next 24 Hours
If Ethereum holds above the $1,888 support level, we could see a short-term recovery.
However, if the price closes below this level on the daily chart, further downside pressure may develop.
Next 48 Hours
If Ethereum reclaims the $2,039 resistance level, the short-term market outlook could improve.
On the other hand, if the support level breaks, the price could face additional downward pressure.
Final Analysis
Currently, Ethereum's short-term trend appears bearish.
Traders should closely monitor the important support and resistance levels before making any trading decisions.
Risk Disclaimer: This analysis is for educational purposes only. It is not financial advice.
Don't forget to Like, Share, and Follow for more professional crypto market analysis.
Thank you!
$ETH
#ETHETFS #BTC #Binance
42
·
--
බෙයාරිෂ්
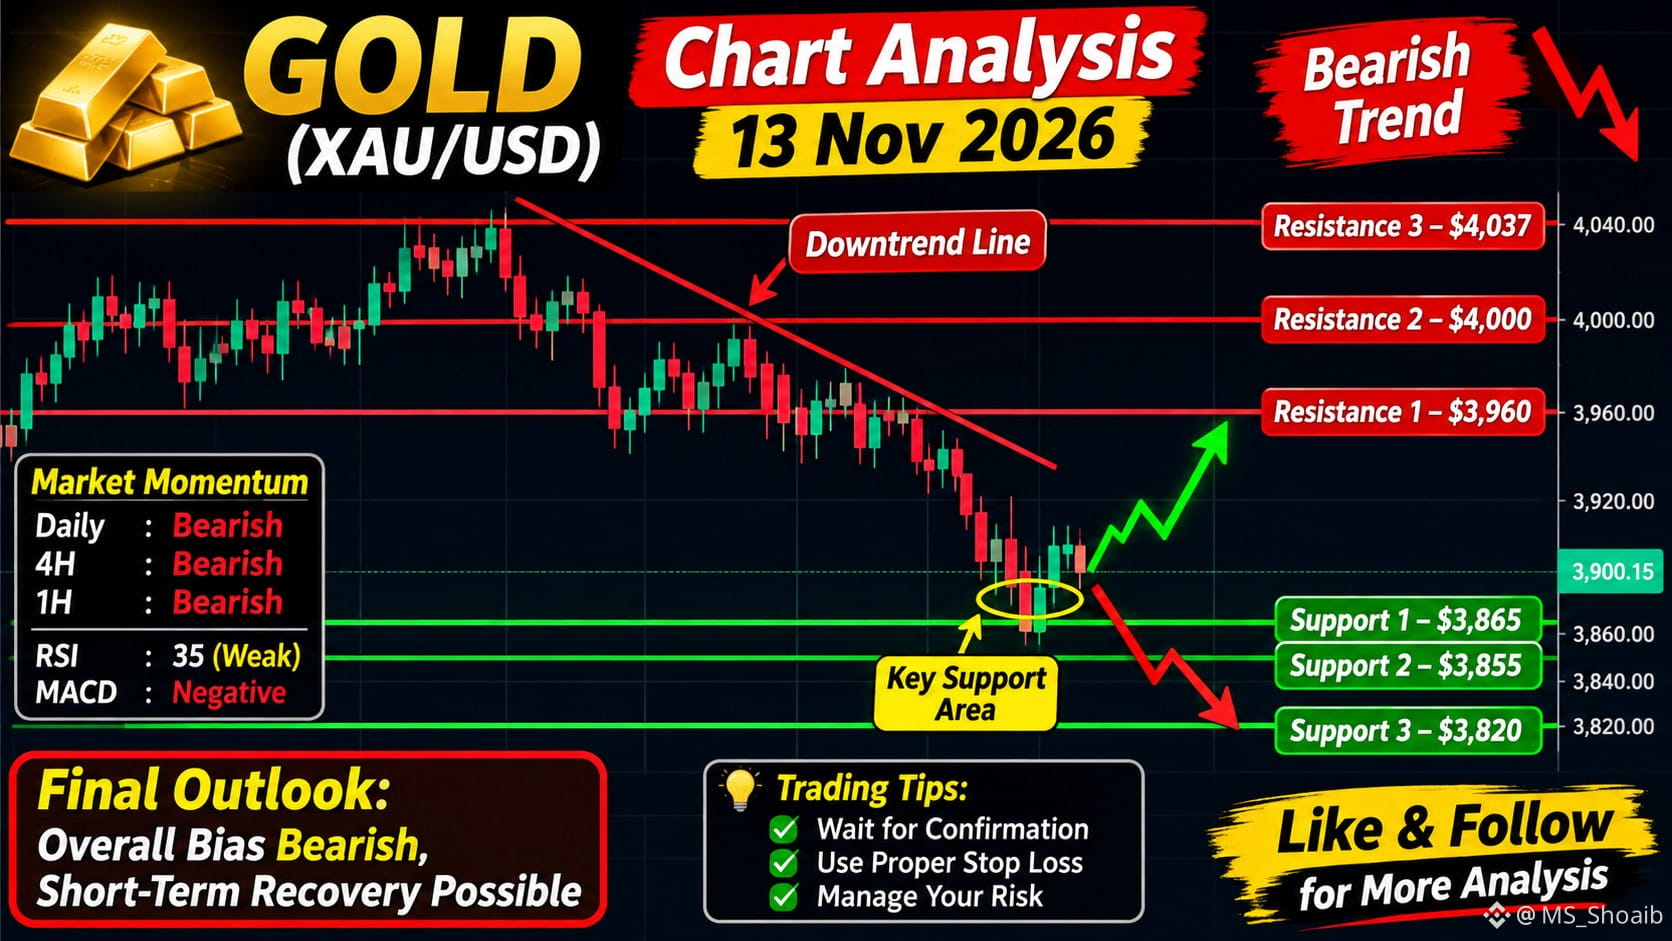
GOLD (XAU/USD) – TODAY'S MARKET ANALYSIS
Date: November 13, 2026
Hello traders! Welcome to today's Gold market analysis.
Today, we are analyzing XAU/USD, focusing on market structure, price momentum, key support and resistance levels, and possible market scenarios.
1. Market Overview
Gold is showing a bearish overall trend, although a short-term recovery is visible. Buyers are attempting to regain control, but the market has not yet confirmed a strong bullish reversal.
2. Key Resistance Levels
- Resistance 1: $3,960
- Resistance 2: $4,000
- Resistance 3: $4,037
If buyers successfully break above resistance with strong confirmation, bullish momentum could increase.
3. Key Support Levels
- Support 1: $3,865
- Support 2: $3,855
- Support 3: $3,820
If sellers regain control and price breaks below support, further downside movement could become possible.
4. Market Momentum
The overall momentum remains bearish. Traders should watch RSI, MACD, and price action for confirmation before identifying a potential trend reversal.
5. Final Market Outlook
The overall bias remains bearish, while a short-term recovery is possible. A confirmed breakout or breakdown will help determine the next direction.
Remember: Always manage your risk, avoid emotional trading, and never enter a trade without confirmation.
Thank you for watching. Follow for more professional Gold and cryptocurrency market analysis! $XAU
{future}(XAUUSDT)
#GOLD_UPDATE #GoldenOpportunity #Binance
GOLD (XAU/USD) – TODAY'S MARKET ANALYSIS
Date: November 13, 2026
Hello traders! Welcome to today's Gold market analysis.
Today, we are analyzing XAU/USD, focusing on market structure, price momentum, key support and resistance levels, and possible market scenarios.
1. Market Overview
Gold is showing a bearish overall trend, although a short-term recovery is visible. Buyers are attempting to regain control, but the market has not yet confirmed a strong bullish reversal.
2. Key Resistance Levels
- Resistance 1: $3,960
- Resistance 2: $4,000
- Resistance 3: $4,037
If buyers successfully break above resistance with strong confirmation, bullish momentum could increase.
3. Key Support Levels
- Support 1: $3,865
- Support 2: $3,855
- Support 3: $3,820
If sellers regain control and price breaks below support, further downside movement could become possible.
4. Market Momentum
The overall momentum remains bearish. Traders should watch RSI, MACD, and price action for confirmation before identifying a potential trend reversal.
5. Final Market Outlook
The overall bias remains bearish, while a short-term recovery is possible. A confirmed breakout or breakdown will help determine the next direction.
Remember: Always manage your risk, avoid emotional trading, and never enter a trade without confirmation.
Thank you for watching. Follow for more professional Gold and cryptocurrency market analysis! $XAU
#GOLD_UPDATE #GoldenOpportunity #Binance
Date: November 13, 2026
Hello traders! Welcome to today's Gold market analysis.
Today, we are analyzing XAU/USD, focusing on market structure, price momentum, key support and resistance levels, and possible market scenarios.
1. Market Overview
Gold is showing a bearish overall trend, although a short-term recovery is visible. Buyers are attempting to regain control, but the market has not yet confirmed a strong bullish reversal.
2. Key Resistance Levels
- Resistance 1: $3,960
- Resistance 2: $4,000
- Resistance 3: $4,037
If buyers successfully break above resistance with strong confirmation, bullish momentum could increase.
3. Key Support Levels
- Support 1: $3,865
- Support 2: $3,855
- Support 3: $3,820
If sellers regain control and price breaks below support, further downside movement could become possible.
4. Market Momentum
The overall momentum remains bearish. Traders should watch RSI, MACD, and price action for confirmation before identifying a potential trend reversal.
5. Final Market Outlook
The overall bias remains bearish, while a short-term recovery is possible. A confirmed breakout or breakdown will help determine the next direction.
Remember: Always manage your risk, avoid emotional trading, and never enter a trade without confirmation.
Thank you for watching. Follow for more professional Gold and cryptocurrency market analysis! $XAU
#GOLD_UPDATE #GoldenOpportunity #Binance
129
·
--
බෙයාරිෂ්
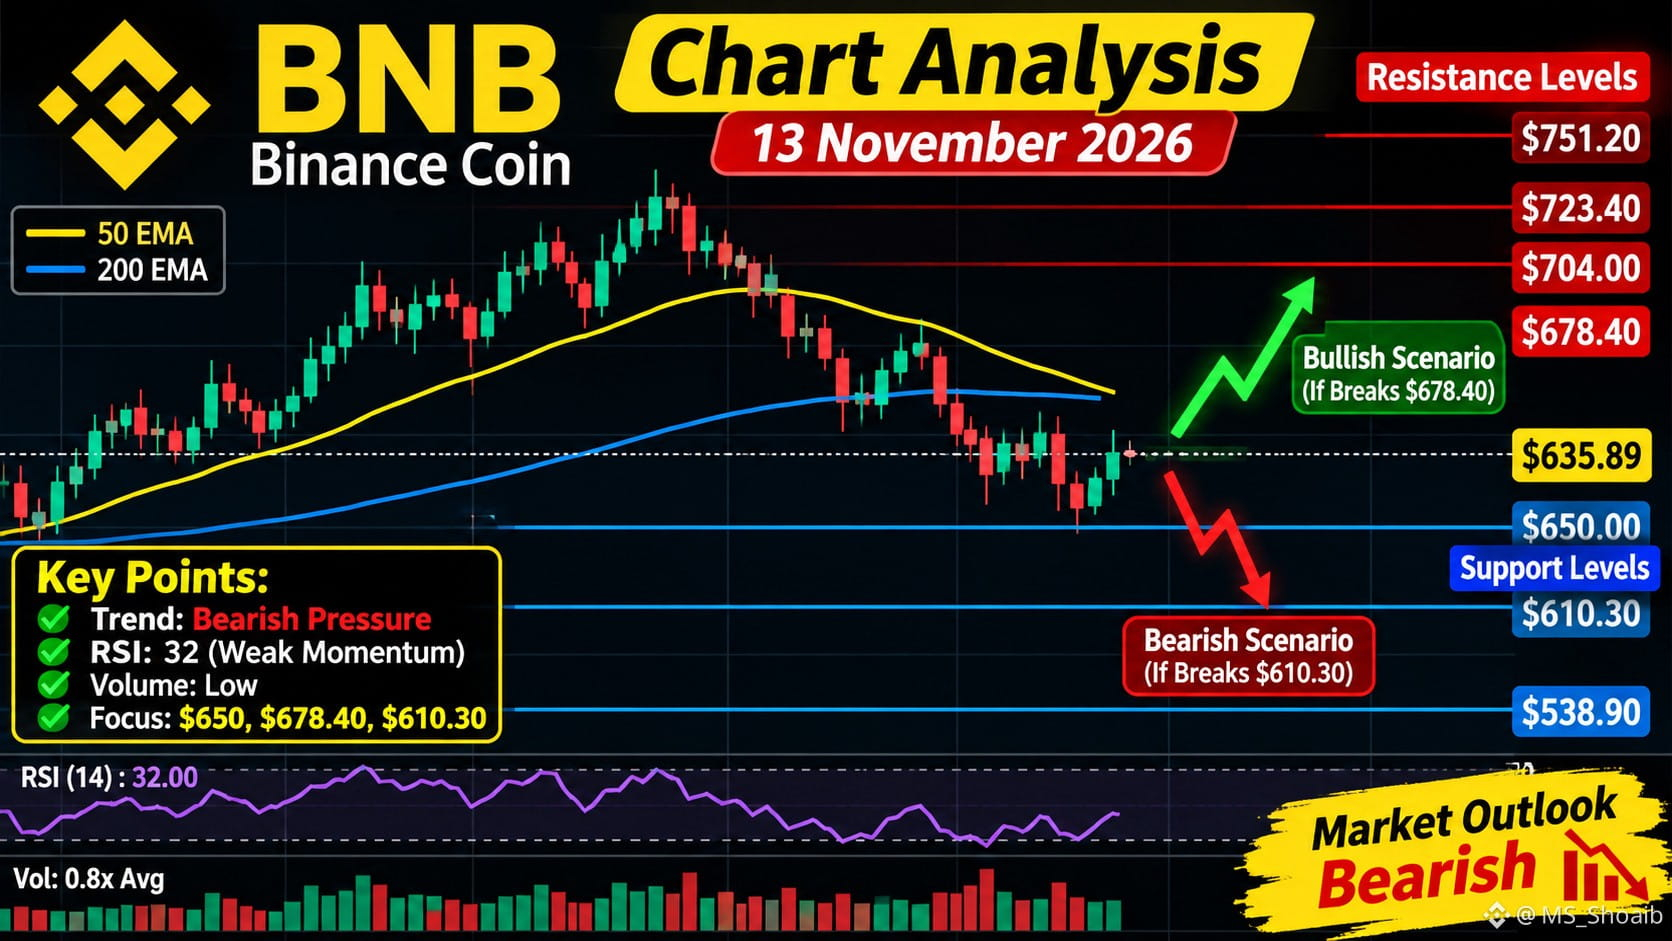
BNB COIN – PROFESSIONAL MARKET ANALYSIS
Date: 13 November 2026
Hello everyone, welcome back to our professional crypto market analysis.
Today, we are analyzing Binance Coin, also known as BNB.
Let's start with the current market situation.
BNB is currently trading around $635.89, showing approximately a 5.70% decline over the last 24 hours.
The market is experiencing selling pressure, and traders are watching important support and resistance levels.
1. Market Structure
Looking at the overall market structure, BNB is showing short-term bearish pressure.
The price is trading below its 50 EMA, which is currently around $716.
The RSI indicator is near 32, showing relatively weak market momentum.
This means buyers have not yet demonstrated a strong recovery.
2. Support Levels
Now let's discuss the important support zones.
The first important level is $650.
The next support level is around $610.30.
If selling pressure continues, another major historical support zone is near $538.90.
These levels are important for understanding possible market reactions.
3. Resistance Levels
On the upside, the first resistance is around $678.40.
The second resistance is $704.
The next important resistance is $723.40.
A stronger recovery would require buyers to regain control and maintain price strength above these areas.
4. Bullish Scenario
Let's discuss the bullish scenario.
If BNB recovers above $650 and establishes strength above $678.40, market sentiment could improve.
The next resistance areas to watch would be $704 and $723.40.
However, confirmation is important. A temporary price increase does not automatically mean a bullish trend reversal.
5. Bearish Scenario
Now let's discuss the bearish scenario.
If selling pressure increases and BNB loses its current intraday support around $622, the next important area to monitor is $610.30.
If that level also fails to hold, the market could experience further weakness.
6. Risk Management
#BNB金鏟子
#BTC☀ $BNB
{future}(BNBUSDT)
BNB COIN – PROFESSIONAL MARKET ANALYSIS
Date: 13 November 2026
Hello everyone, welcome back to our professional crypto market analysis.
Today, we are analyzing Binance Coin, also known as BNB.
Let's start with the current market situation.
BNB is currently trading around $635.89, showing approximately a 5.70% decline over the last 24 hours.
The market is experiencing selling pressure, and traders are watching important support and resistance levels.
1. Market Structure
Looking at the overall market structure, BNB is showing short-term bearish pressure.
The price is trading below its 50 EMA, which is currently around $716.
The RSI indicator is near 32, showing relatively weak market momentum.
This means buyers have not yet demonstrated a strong recovery.
2. Support Levels
Now let's discuss the important support zones.
The first important level is $650.
The next support level is around $610.30.
If selling pressure continues, another major historical support zone is near $538.90.
These levels are important for understanding possible market reactions.
3. Resistance Levels
On the upside, the first resistance is around $678.40.
The second resistance is $704.
The next important resistance is $723.40.
A stronger recovery would require buyers to regain control and maintain price strength above these areas.
4. Bullish Scenario
Let's discuss the bullish scenario.
If BNB recovers above $650 and establishes strength above $678.40, market sentiment could improve.
The next resistance areas to watch would be $704 and $723.40.
However, confirmation is important. A temporary price increase does not automatically mean a bullish trend reversal.
5. Bearish Scenario
Now let's discuss the bearish scenario.
If selling pressure increases and BNB loses its current intraday support around $622, the next important area to monitor is $610.30.
If that level also fails to hold, the market could experience further weakness.
6. Risk Management
#BNB金鏟子
#BTC☀ $BNB
Date: 13 November 2026
Hello everyone, welcome back to our professional crypto market analysis.
Today, we are analyzing Binance Coin, also known as BNB.
Let's start with the current market situation.
BNB is currently trading around $635.89, showing approximately a 5.70% decline over the last 24 hours.
The market is experiencing selling pressure, and traders are watching important support and resistance levels.
1. Market Structure
Looking at the overall market structure, BNB is showing short-term bearish pressure.
The price is trading below its 50 EMA, which is currently around $716.
The RSI indicator is near 32, showing relatively weak market momentum.
This means buyers have not yet demonstrated a strong recovery.
2. Support Levels
Now let's discuss the important support zones.
The first important level is $650.
The next support level is around $610.30.
If selling pressure continues, another major historical support zone is near $538.90.
These levels are important for understanding possible market reactions.
3. Resistance Levels
On the upside, the first resistance is around $678.40.
The second resistance is $704.
The next important resistance is $723.40.
A stronger recovery would require buyers to regain control and maintain price strength above these areas.
4. Bullish Scenario
Let's discuss the bullish scenario.
If BNB recovers above $650 and establishes strength above $678.40, market sentiment could improve.
The next resistance areas to watch would be $704 and $723.40.
However, confirmation is important. A temporary price increase does not automatically mean a bullish trend reversal.
5. Bearish Scenario
Now let's discuss the bearish scenario.
If selling pressure increases and BNB loses its current intraday support around $622, the next important area to monitor is $610.30.
If that level also fails to hold, the market could experience further weakness.
6. Risk Management
#BNB金鏟子
#BTC☀ $BNB
105
·
--
උසබ තත්ත්වය
Hello everyone, welcome back to my channel.
Today we are going to talk about Microsoft stock, MSFT.
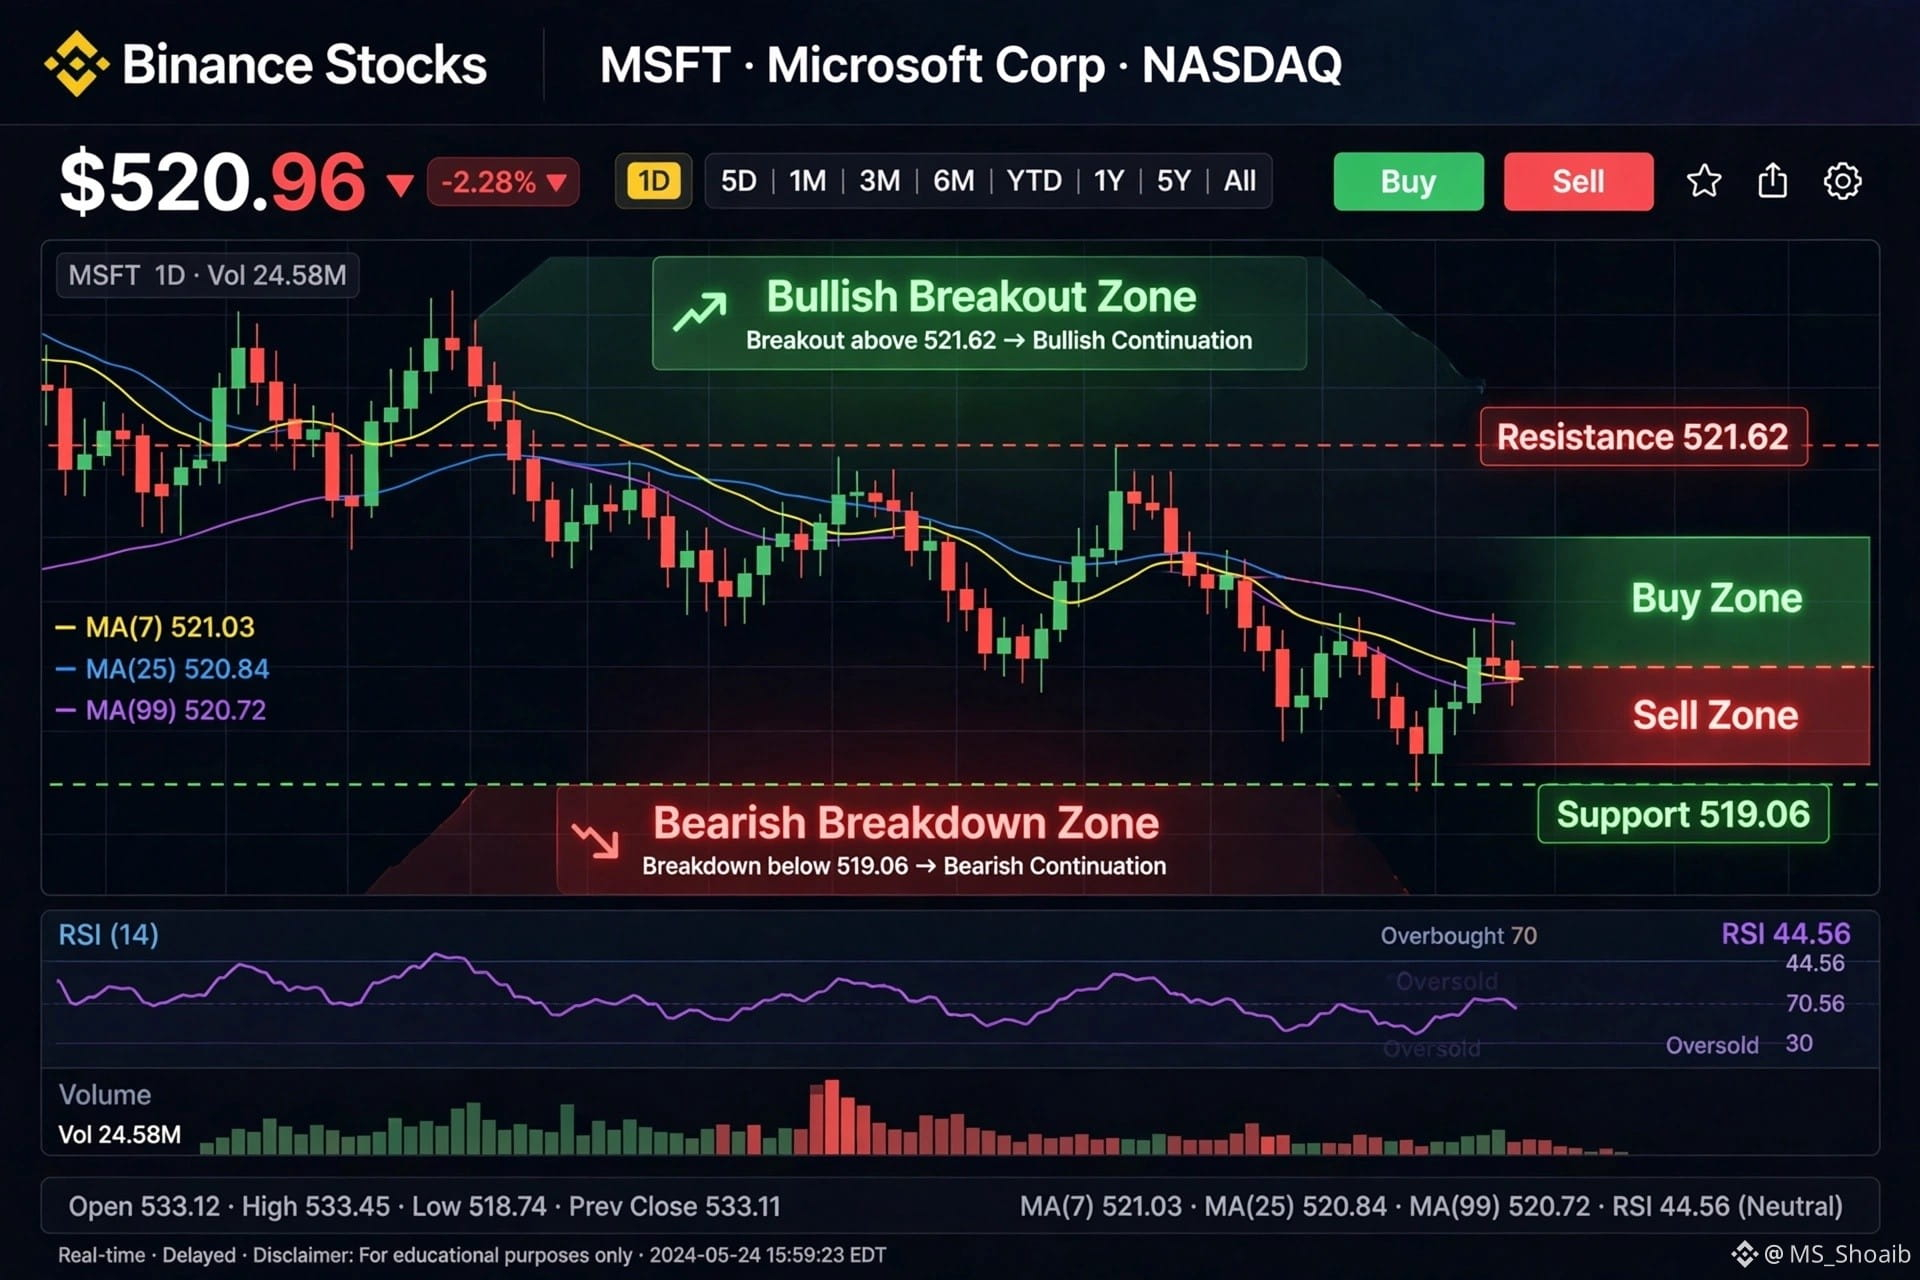
Right now, MSFT is trading around 520.96 dollars, and it is down by 2.28 percent today.
If we look at the chart, the price is trading below all three moving averages. MA 7 is at 521.03, MA 25 is at 520.84, and MA 99 is at 520.72. This shows that sellers are a little bit strong right now.
On the upside, the main resistance is 521.62 dollars. The price went there and got rejected. Until the price closes above 521.62 dollars, we cannot say buyers are back.
On the downside, the main support is 519.06 dollars. This is today's low. If the price breaks below 519.06 dollars, then we can see more downside.
So my plan is very simple. I will not buy in a hurry. I will wait. If the price goes above 521.62 dollars and stays there, then I will look for a buy. And if the price breaks 519.06 dollars, then I will wait for a lower level.
Remember, always manage your risk and never trade with money you cannot afford to lose.$MSFTB
{spot}(MSFTBUSDT)
#MSFTUSDT #Binance #cryptouniverseofficial
Hello everyone, welcome back to my channel.
Today we are going to talk about Microsoft stock, MSFT.
Right now, MSFT is trading around 520.96 dollars, and it is down by 2.28 percent today.
If we look at the chart, the price is trading below all three moving averages. MA 7 is at 521.03, MA 25 is at 520.84, and MA 99 is at 520.72. This shows that sellers are a little bit strong right now.
On the upside, the main resistance is 521.62 dollars. The price went there and got rejected. Until the price closes above 521.62 dollars, we cannot say buyers are back.
On the downside, the main support is 519.06 dollars. This is today's low. If the price breaks below 519.06 dollars, then we can see more downside.
So my plan is very simple. I will not buy in a hurry. I will wait. If the price goes above 521.62 dollars and stays there, then I will look for a buy. And if the price breaks 519.06 dollars, then I will wait for a lower level.
Remember, always manage your risk and never trade with money you cannot afford to lose.$MSFTB
#MSFTUSDT #Binance #cryptouniverseofficial
Today we are going to talk about Microsoft stock, MSFT.
Right now, MSFT is trading around 520.96 dollars, and it is down by 2.28 percent today.
If we look at the chart, the price is trading below all three moving averages. MA 7 is at 521.03, MA 25 is at 520.84, and MA 99 is at 520.72. This shows that sellers are a little bit strong right now.
On the upside, the main resistance is 521.62 dollars. The price went there and got rejected. Until the price closes above 521.62 dollars, we cannot say buyers are back.
On the downside, the main support is 519.06 dollars. This is today's low. If the price breaks below 519.06 dollars, then we can see more downside.
So my plan is very simple. I will not buy in a hurry. I will wait. If the price goes above 521.62 dollars and stays there, then I will look for a buy. And if the price breaks 519.06 dollars, then I will wait for a lower level.
Remember, always manage your risk and never trade with money you cannot afford to lose.$MSFTB
#MSFTUSDT #Binance #cryptouniverseofficial
46
·
--
උසබ තත්ත්වය
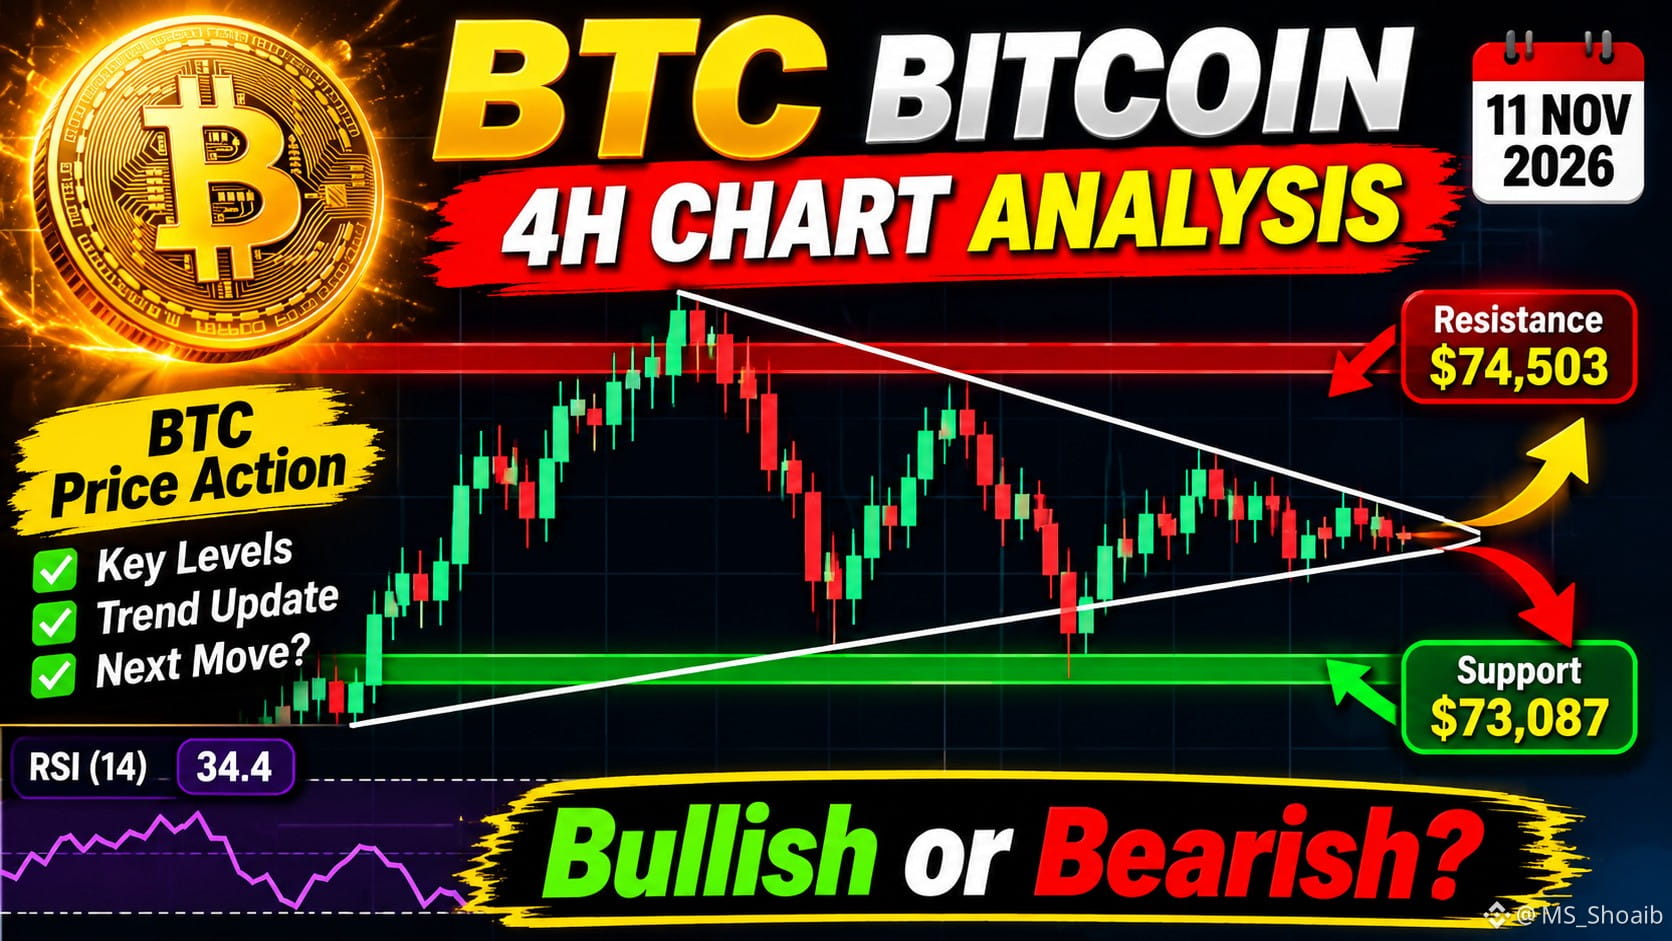
BITCOIN (BTC) — MARKET ANALYSIS
📅 11 NOVEMBER 2026
1. MARKET OVERVIEW
Bitcoin remains the leading cryptocurrency by market capitalization. Current market conditions show volatility and changing investor sentiment.
2. BULLISH OUTLOOK
A sustained upward move with strong market participation may indicate improving bullish momentum.
3. BEARISH OUTLOOK
Continued selling pressure and a breakdown in market structure may indicate further weakness.
4. TECHNICAL ANALYSIS
- Price Action
- Market Structure
- Trading Volume
- RSI & Momentum
- Support & Resistance
5. MARKET SENTIMENT
Investors are monitoring market volatility, institutional activity and broader economic conditions.
6. FINAL OUTLOOK
Bitcoin's next market direction remains uncertain. Confirmation from price action and market data is important when evaluating its overall performance.
RESEARCH THE MARKET. UNDERSTAND THE RISKS. STAY INFORMED.
#Bitcoin #BTC #BitcoinAnalysis #CryptoMarket
$BTC
{future}(BTCUSDT)
BITCOIN (BTC) — MARKET ANALYSIS
📅 11 NOVEMBER 2026
1. MARKET OVERVIEW
Bitcoin remains the leading cryptocurrency by market capitalization. Current market conditions show volatility and changing investor sentiment.
2. BULLISH OUTLOOK
A sustained upward move with strong market participation may indicate improving bullish momentum.
3. BEARISH OUTLOOK
Continued selling pressure and a breakdown in market structure may indicate further weakness.
4. TECHNICAL ANALYSIS
- Price Action
- Market Structure
- Trading Volume
- RSI & Momentum
- Support & Resistance
5. MARKET SENTIMENT
Investors are monitoring market volatility, institutional activity and broader economic conditions.
6. FINAL OUTLOOK
Bitcoin's next market direction remains uncertain. Confirmation from price action and market data is important when evaluating its overall performance.
RESEARCH THE MARKET. UNDERSTAND THE RISKS. STAY INFORMED.
#Bitcoin #BTC #BitcoinAnalysis #CryptoMarket
$BTC
📅 11 NOVEMBER 2026
1. MARKET OVERVIEW
Bitcoin remains the leading cryptocurrency by market capitalization. Current market conditions show volatility and changing investor sentiment.
2. BULLISH OUTLOOK
A sustained upward move with strong market participation may indicate improving bullish momentum.
3. BEARISH OUTLOOK
Continued selling pressure and a breakdown in market structure may indicate further weakness.
4. TECHNICAL ANALYSIS
- Price Action
- Market Structure
- Trading Volume
- RSI & Momentum
- Support & Resistance
5. MARKET SENTIMENT
Investors are monitoring market volatility, institutional activity and broader economic conditions.
6. FINAL OUTLOOK
Bitcoin's next market direction remains uncertain. Confirmation from price action and market data is important when evaluating its overall performance.
RESEARCH THE MARKET. UNDERSTAND THE RISKS. STAY INFORMED.
#Bitcoin #BTC #BitcoinAnalysis #CryptoMarket
$BTC
75
·
--
උසබ තත්ත්වය
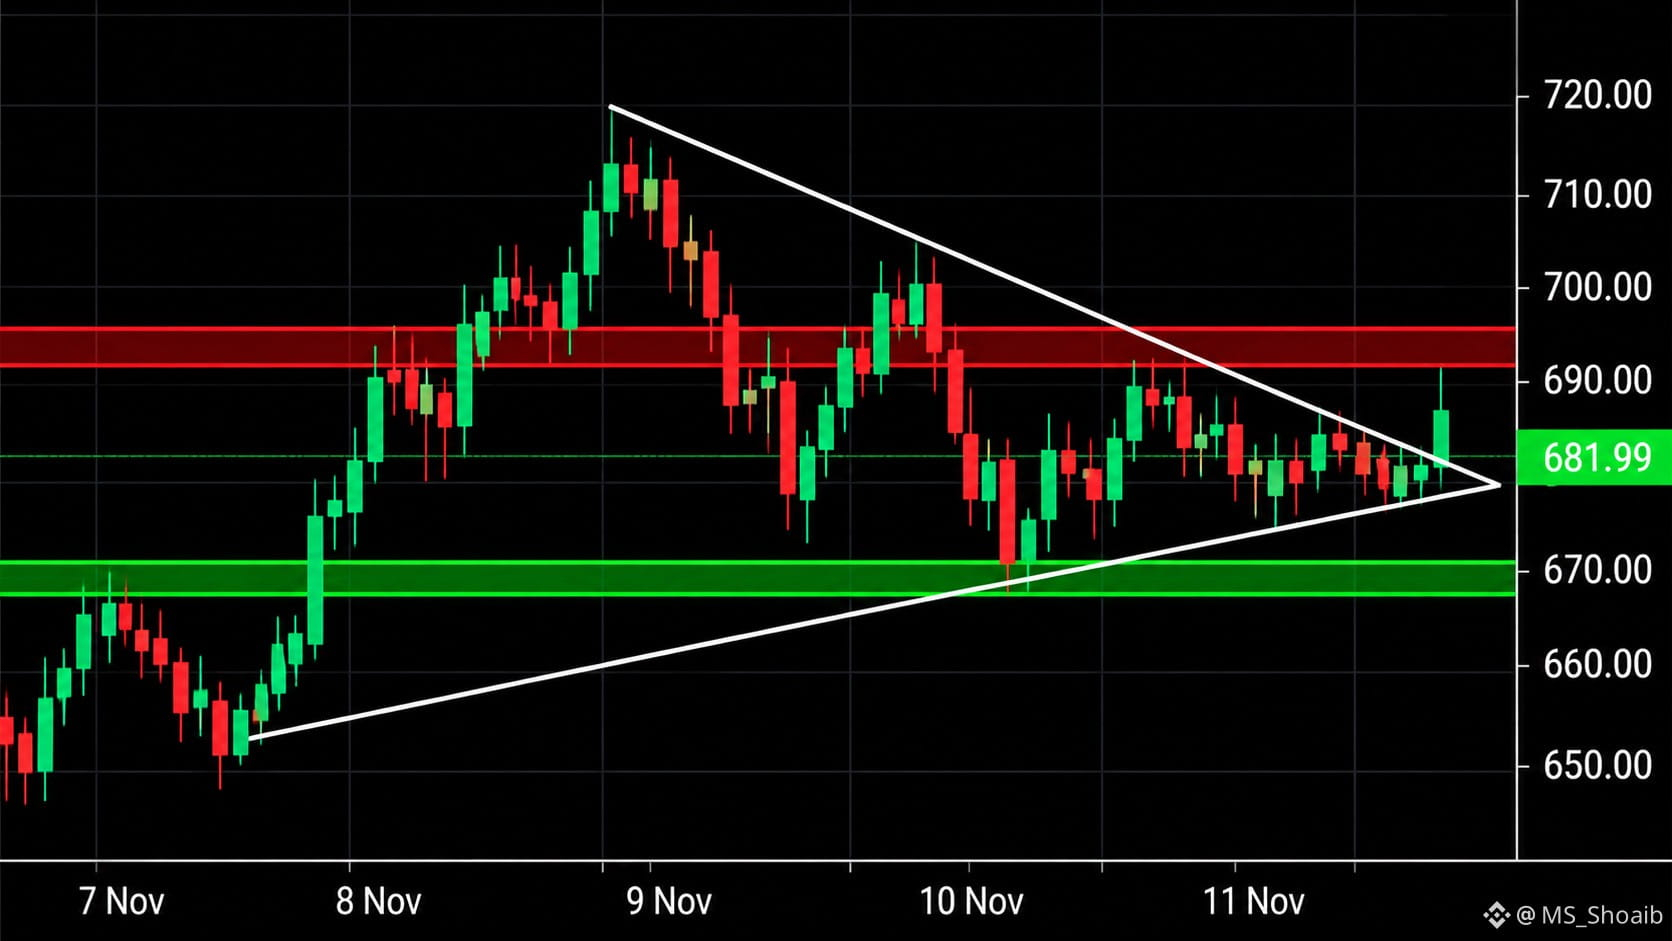
📊 BNB COIN — TODAY'S TECHNICAL ANALYSIS
📅 Date: 11 November 2026
🟡 1. MARKET OVERVIEW
BNB is currently trading around $681.77. The market is showing short-term bearish pressure, while overall momentum remains mixed.
📈 2. BULLISH SIGNALS
- A breakout above $686.47 could indicate bullish momentum.
- Strong buying volume may support an upward move.
- A sustained move above resistance could improve market sentiment.
📉 3. BEARISH SIGNALS
- Selling pressure remains visible.
- RSI is around 37.8, showing weak momentum.
- A breakdown below $675.05 could increase downside pressure.
🎯 4. SUPPORT & RESISTANCE
- Support 1: $675.05
- Support 2: $664.90
- Resistance 1: $686.47
- Resistance 2: $695.19
⚠️ 5. RISK MANAGEMENT
- Monitor market volatility.
- Avoid decisions based on emotions.
- Always understand the risks before trading.
🔍 6. FINAL MARKET OUTLOOK
BNB is currently showing a bearish short-term bias. A confirmed breakout above $686.47 may strengthen the bullish scenario, while a breakdown below $675.05 may increase bearish pressure.
Stay Focused. Analyze Smart. Manage Risk.
#BNB #BNBAnalysis #CryptoAnalysisUpdate #technicalanalyst #CryptoMarket
$BNB
{future}(BNBUSDT)
📊 BNB COIN — TODAY'S TECHNICAL ANALYSIS
📅 Date: 11 November 2026
🟡 1. MARKET OVERVIEW
BNB is currently trading around $681.77. The market is showing short-term bearish pressure, while overall momentum remains mixed.
📈 2. BULLISH SIGNALS
- A breakout above $686.47 could indicate bullish momentum.
- Strong buying volume may support an upward move.
- A sustained move above resistance could improve market sentiment.
📉 3. BEARISH SIGNALS
- Selling pressure remains visible.
- RSI is around 37.8, showing weak momentum.
- A breakdown below $675.05 could increase downside pressure.
🎯 4. SUPPORT & RESISTANCE
- Support 1: $675.05
- Support 2: $664.90
- Resistance 1: $686.47
- Resistance 2: $695.19
⚠️ 5. RISK MANAGEMENT
- Monitor market volatility.
- Avoid decisions based on emotions.
- Always understand the risks before trading.
🔍 6. FINAL MARKET OUTLOOK
BNB is currently showing a bearish short-term bias. A confirmed breakout above $686.47 may strengthen the bullish scenario, while a breakdown below $675.05 may increase bearish pressure.
Stay Focused. Analyze Smart. Manage Risk.
#BNB #BNBAnalysis #CryptoAnalysisUpdate #technicalanalyst #CryptoMarket
$BNB
📅 Date: 11 November 2026
🟡 1. MARKET OVERVIEW
BNB is currently trading around $681.77. The market is showing short-term bearish pressure, while overall momentum remains mixed.
📈 2. BULLISH SIGNALS
- A breakout above $686.47 could indicate bullish momentum.
- Strong buying volume may support an upward move.
- A sustained move above resistance could improve market sentiment.
📉 3. BEARISH SIGNALS
- Selling pressure remains visible.
- RSI is around 37.8, showing weak momentum.
- A breakdown below $675.05 could increase downside pressure.
🎯 4. SUPPORT & RESISTANCE
- Support 1: $675.05
- Support 2: $664.90
- Resistance 1: $686.47
- Resistance 2: $695.19
⚠️ 5. RISK MANAGEMENT
- Monitor market volatility.
- Avoid decisions based on emotions.
- Always understand the risks before trading.
🔍 6. FINAL MARKET OUTLOOK
BNB is currently showing a bearish short-term bias. A confirmed breakout above $686.47 may strengthen the bullish scenario, while a breakdown below $675.05 may increase bearish pressure.
Stay Focused. Analyze Smart. Manage Risk.
#BNB #BNBAnalysis #CryptoAnalysisUpdate #technicalanalyst #CryptoMarket
$BNB
113
·
--
බෙයාරිෂ්
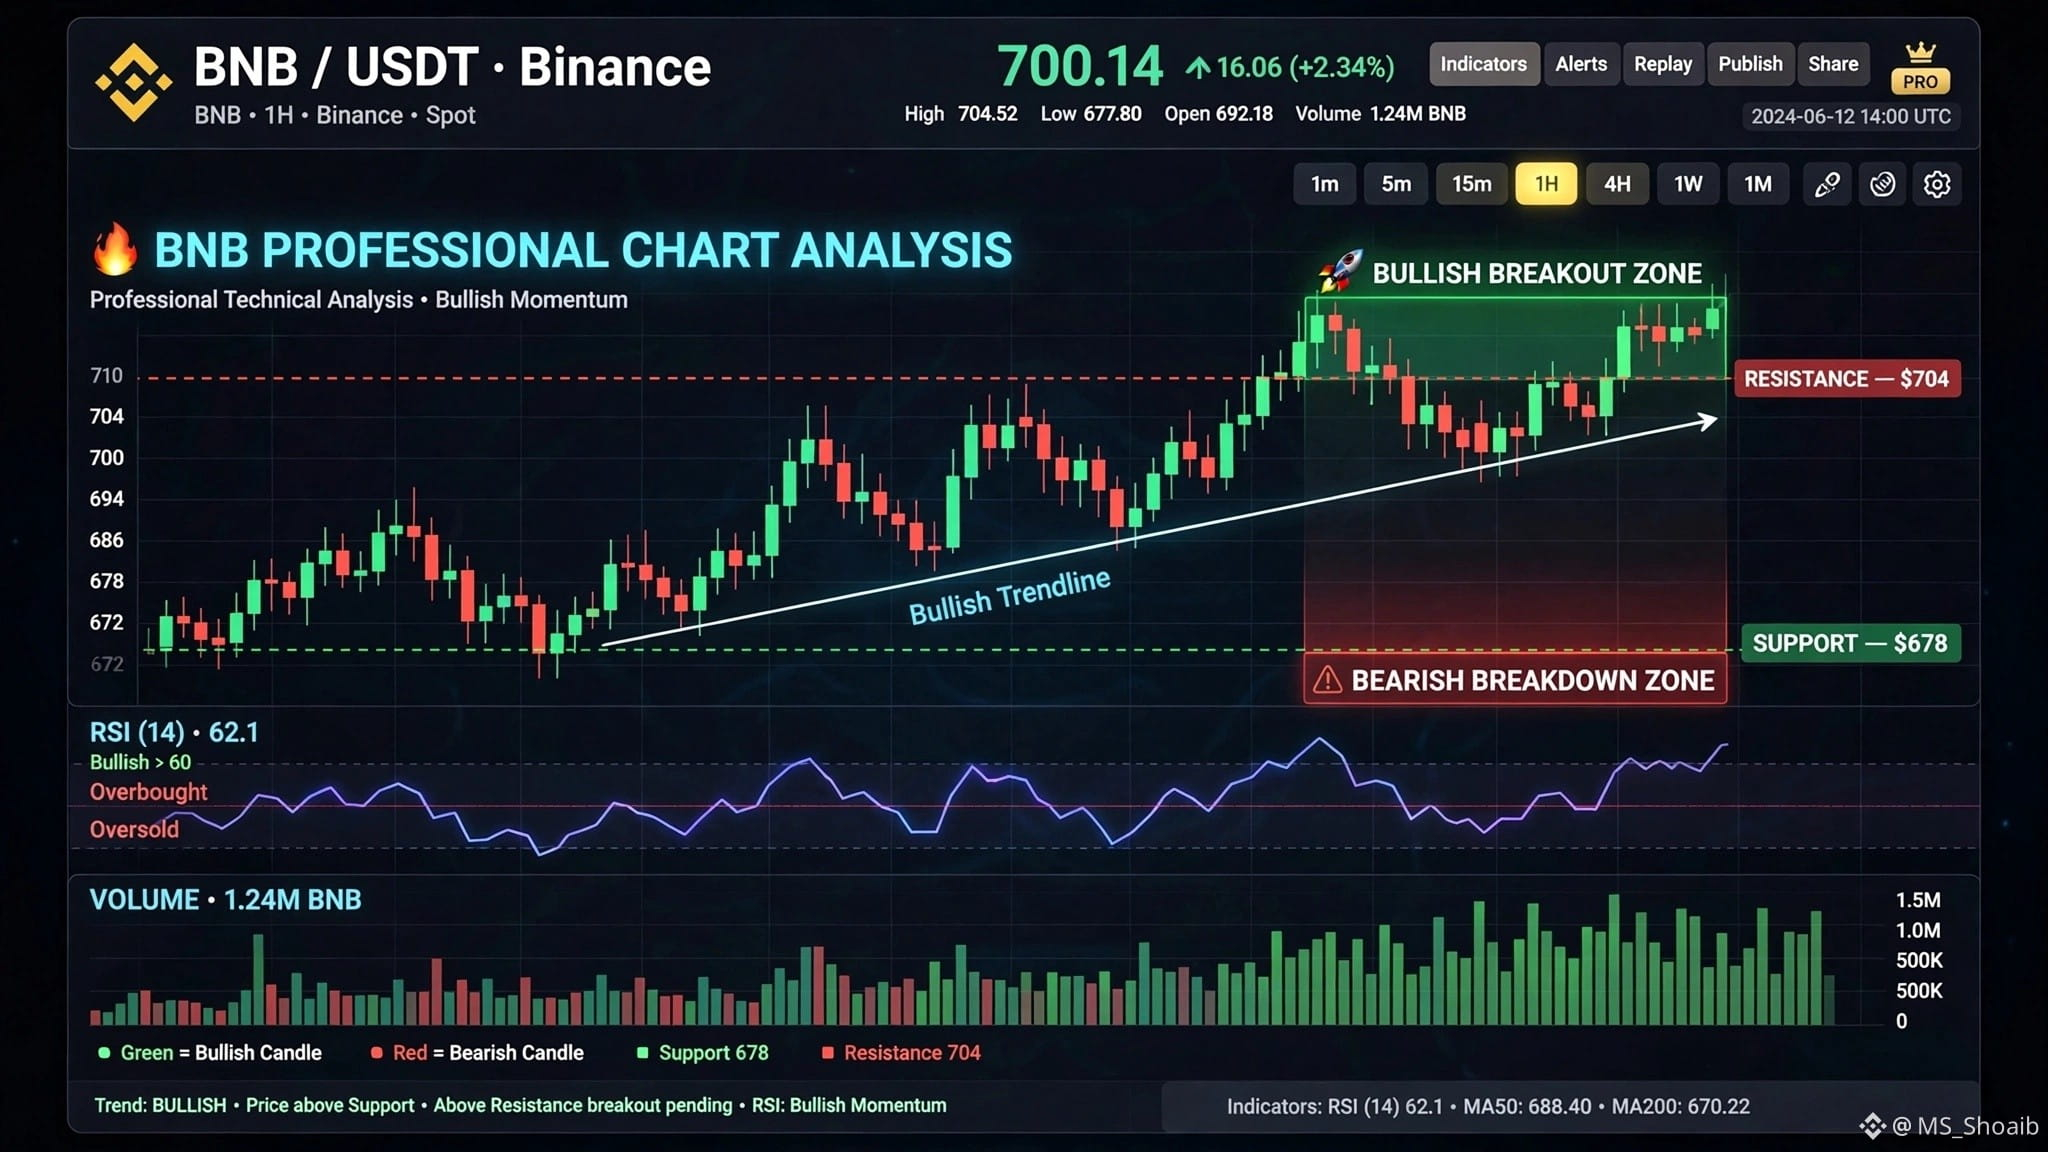
📊 BNB COIN MARKET ANALYSIS 📊
📅 November 10, 2026
📈 Market Trend: Neutral to Slightly Bearish
🔴 Resistance: $704
🟢 Support: $678
🚀 Bullish Scenario: A breakout above $704 could indicate upward momentum.
📉 Bearish Scenario: A breakdown below $678 could increase selling pressure.
🛡️ Risk Management: Protect your capital and manage risk carefully.
🎯 Trading Discipline: Stay patient, control emotions, and avoid impulsive decisions.
⚠️ Remember: Analyze smartly, manage risk, and trade responsibly.$BNB
{future}(BNBUSDT)
#BNB_Market_Update #HotCPIDecemberHikePriced #Binance
📊 BNB COIN MARKET ANALYSIS 📊
📅 November 10, 2026
📈 Market Trend: Neutral to Slightly Bearish
🔴 Resistance: $704
🟢 Support: $678
🚀 Bullish Scenario: A breakout above $704 could indicate upward momentum.
📉 Bearish Scenario: A breakdown below $678 could increase selling pressure.
🛡️ Risk Management: Protect your capital and manage risk carefully.
🎯 Trading Discipline: Stay patient, control emotions, and avoid impulsive decisions.
⚠️ Remember: Analyze smartly, manage risk, and trade responsibly.$BNB
#BNB_Market_Update #HotCPIDecemberHikePriced #Binance
📅 November 10, 2026
📈 Market Trend: Neutral to Slightly Bearish
🔴 Resistance: $704
🟢 Support: $678
🚀 Bullish Scenario: A breakout above $704 could indicate upward momentum.
📉 Bearish Scenario: A breakdown below $678 could increase selling pressure.
🛡️ Risk Management: Protect your capital and manage risk carefully.
🎯 Trading Discipline: Stay patient, control emotions, and avoid impulsive decisions.
⚠️ Remember: Analyze smartly, manage risk, and trade responsibly.$BNB
#BNB_Market_Update #HotCPIDecemberHikePriced #Binance
84
·
--
උසබ තත්ත්වය
📊 Crypto Market Analysis – November 10, 2026
1. Market Overview
The cryptocurrency market is currently showing mixed signals. Traders should carefully monitor market momentum, trading volume, and overall market sentiment before making any trading decisions. A strong confirmation is important before entering any position.
2. Bullish & Bearish Scenarios
🟢 Bullish Scenario:
If the market maintains strong buying pressure and breaks above key resistance levels with good volume, we may see further upward momentum. Traders should wait for confirmation before considering bullish opportunities.
🔴 Bearish Scenario:
If the market loses important support levels and selling pressure increases, a further downside movement may occur. Traders should remain cautious and avoid emotional decisions.
3. Risk Management
Risk management is one of the most important parts of successful trading.
• Always use a proper stop-loss.
• Never risk more than you can afford to lose.
• Avoid excessive leverage.
• Maintain a balanced risk-to-reward ratio.
• Never enter a trade based on emotions or FOMO.
Final Thoughts:
The market offers opportunities in both directions. Patience, discipline, and proper risk management are essential for long-term trading success.
⚠️ Disclaimer: This post is for educational purposes only and does not constitute financial advice. Always do your own research bef making trading decisions
#Binance #CryptoAnalysis
#MarketOverview
$BTC
{future}(BTCUSDT)
📊 Crypto Market Analysis – November 10, 2026
1. Market Overview
The cryptocurrency market is currently showing mixed signals. Traders should carefully monitor market momentum, trading volume, and overall market sentiment before making any trading decisions. A strong confirmation is important before entering any position.
2. Bullish & Bearish Scenarios
🟢 Bullish Scenario:
If the market maintains strong buying pressure and breaks above key resistance levels with good volume, we may see further upward momentum. Traders should wait for confirmation before considering bullish opportunities.
🔴 Bearish Scenario:
If the market loses important support levels and selling pressure increases, a further downside movement may occur. Traders should remain cautious and avoid emotional decisions.
3. Risk Management
Risk management is one of the most important parts of successful trading.
• Always use a proper stop-loss.
• Never risk more than you can afford to lose.
• Avoid excessive leverage.
• Maintain a balanced risk-to-reward ratio.
• Never enter a trade based on emotions or FOMO.
Final Thoughts:
The market offers opportunities in both directions. Patience, discipline, and proper risk management are essential for long-term trading success.
⚠️ Disclaimer: This post is for educational purposes only and does not constitute financial advice. Always do your own research bef making trading decisions
#Binance #CryptoAnalysis
#MarketOverview
$BTC
1. Market Overview
The cryptocurrency market is currently showing mixed signals. Traders should carefully monitor market momentum, trading volume, and overall market sentiment before making any trading decisions. A strong confirmation is important before entering any position.
2. Bullish & Bearish Scenarios
🟢 Bullish Scenario:
If the market maintains strong buying pressure and breaks above key resistance levels with good volume, we may see further upward momentum. Traders should wait for confirmation before considering bullish opportunities.
🔴 Bearish Scenario:
If the market loses important support levels and selling pressure increases, a further downside movement may occur. Traders should remain cautious and avoid emotional decisions.
3. Risk Management
Risk management is one of the most important parts of successful trading.
• Always use a proper stop-loss.
• Never risk more than you can afford to lose.
• Avoid excessive leverage.
• Maintain a balanced risk-to-reward ratio.
• Never enter a trade based on emotions or FOMO.
Final Thoughts:
The market offers opportunities in both directions. Patience, discipline, and proper risk management are essential for long-term trading success.
⚠️ Disclaimer: This post is for educational purposes only and does not constitute financial advice. Always do your own research bef making trading decisions
#Binance #CryptoAnalysis
#MarketOverview
$BTC

98
තවත් අන්තර්ගතයන් ගවේෂණය කිරීමට ඇතුල් වන්න
Binance චතුරශ්රය හි ගෝලීය ක්රිප්ටෝ පරිශීලකයින් හා එක්වන්න
⚡️ ක්රිප්ටෝ පිළිබඳ නවතම සහ ප්රයෝජනවත් තොරතුරු ලබා ගන්න.
💬 ලොව විශාලතම ක්රිප්ටෝ හුවමාරුව මගින් විශ්වාස කෙරේ.
👍 සත්යායනය කරන ලද නිර්මාණකරුවන්ගෙන් සැබෑ විදසුන් සොයා ගන්න.
විද්යුත් තැපෑල / දුරකථන අංකය
නැගී එන මාතෘකා
WhatWillDriveCryptoandStocks’NextRebound?
42,180 නැරඹීම්
615 සාකච්ඡා කරමින්
Bitcoin Slips Below $70,000 as Dollar Index Hits 19-Month High
Binance News
·15 කැමත්ත දැක්වීම්
·33.4k නැරඹීම්
Anthropic’s6xIPODemandSignalsPotentialRecordRaise
12,881 නැරඹීම්
293 සාකච්ඡා කරමින්
JaneStreetNearlyOctuplesFidelityBitcoinETFHoldings
636 නැරඹීම්
32 සාකච්ඡා කරමින්