
MOBIN CRYPTOX
926 පෝස්ටු

MOBIN CRYPTOX
වාර්තා කරන්න
පරිශීලක අවහිර කරන්න
Crypto and Gold Market Analysis Bitcoin ETH XAUUSD Technical Analysis Market Research
විවෘත වෙළෙඳාම
නිතර වෙළෙන්දා
{වේලාව} වසර
30 හඹා යමින්
777 හඹා යන්නන්
337 කැමති විය
පෝස්ටු
ආයෝජන කළඹ
සියල්ල
උපුටා දැක්වීම්
·
--
බෙයාරිෂ්
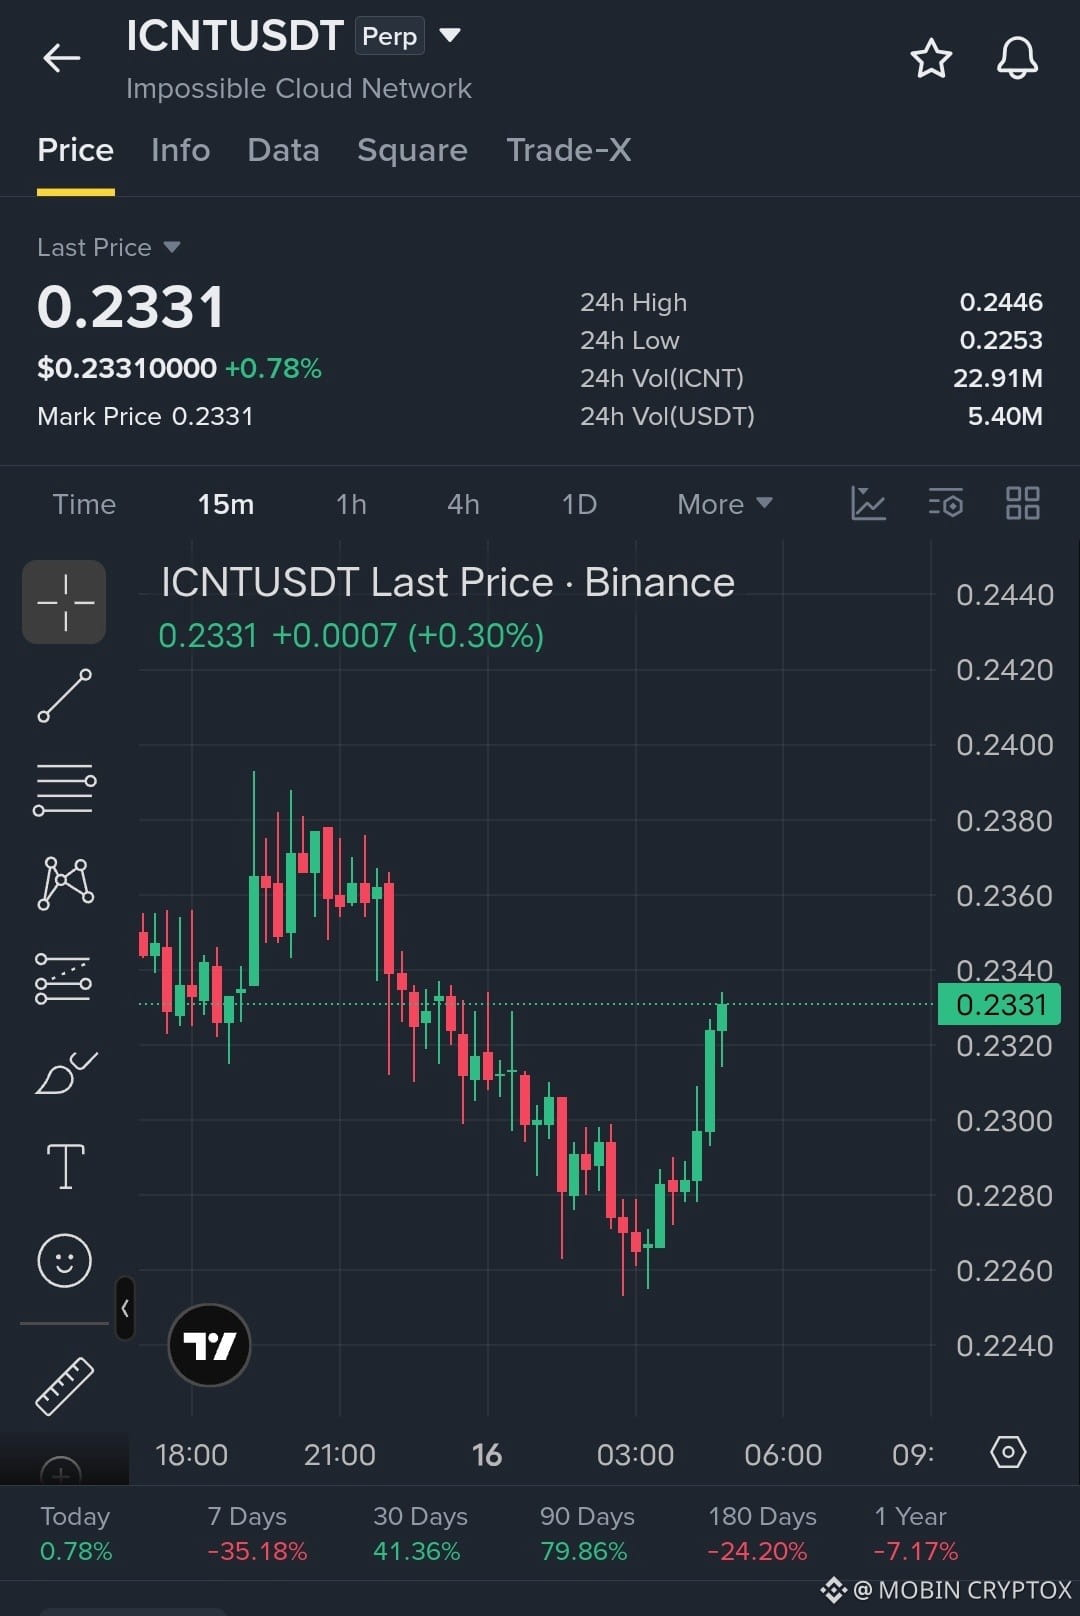
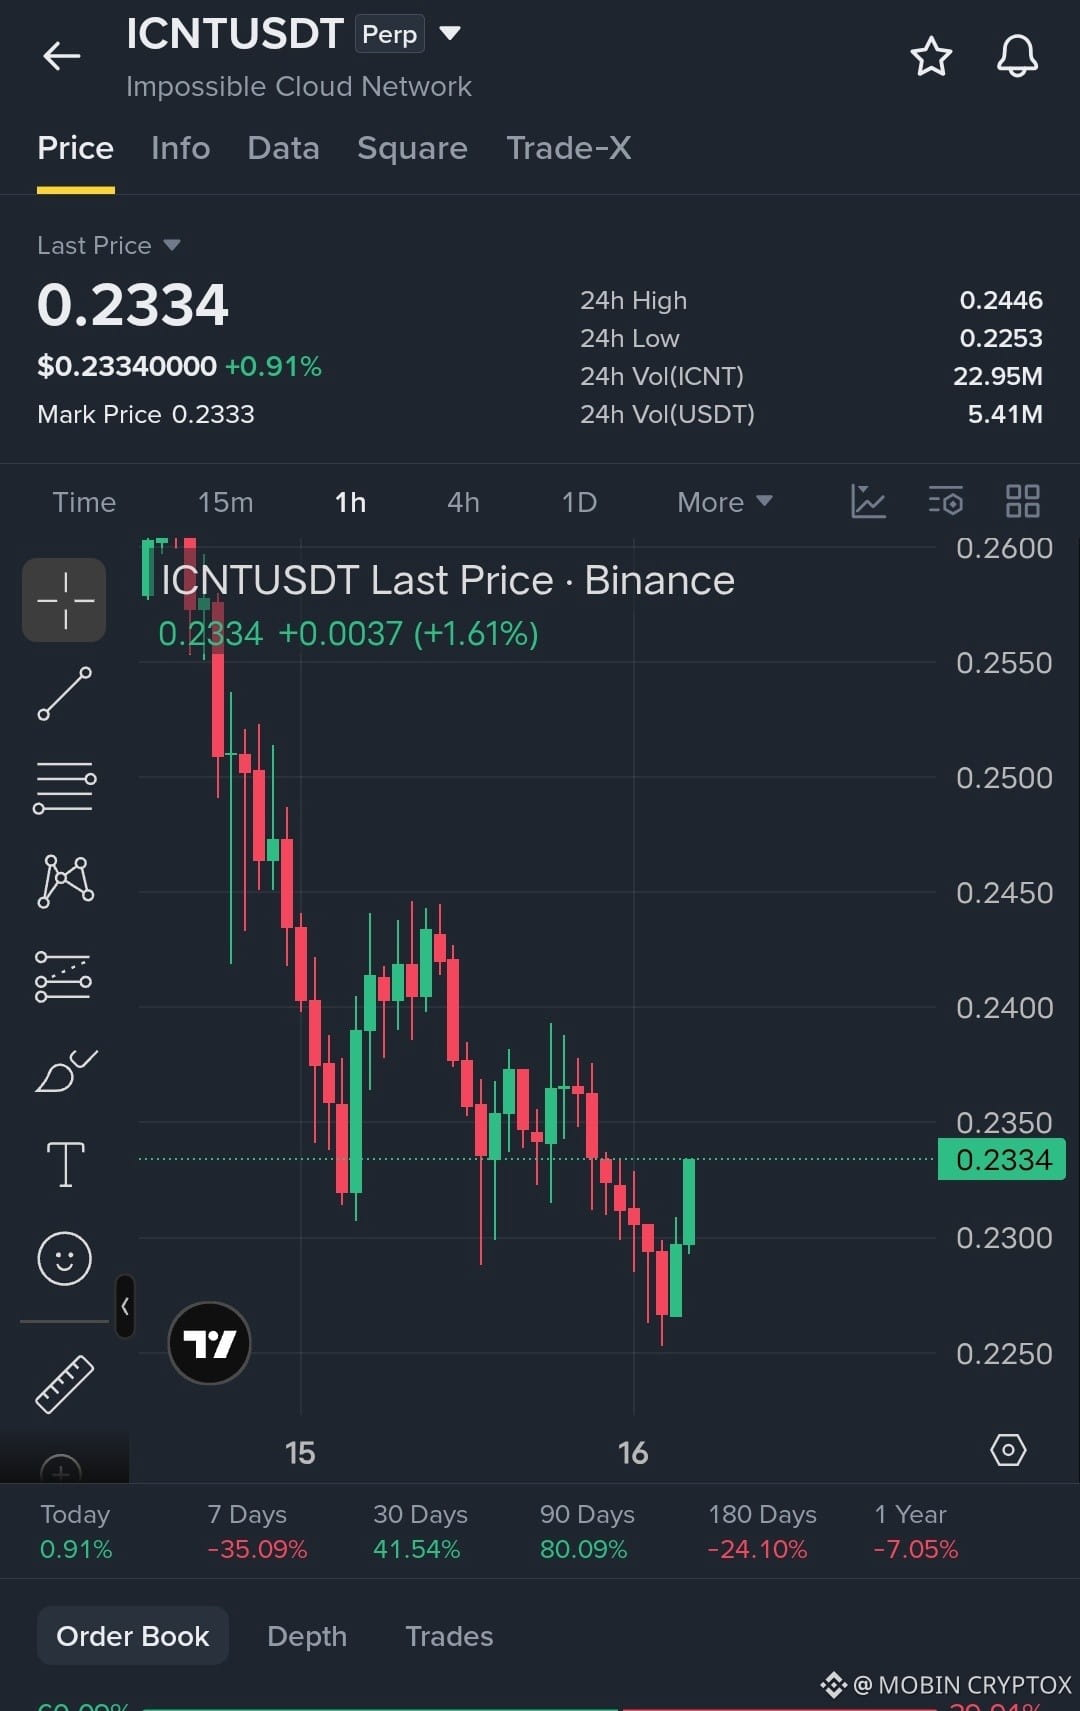
$ICNT ICNTUSDT: Recovery Begins or Just a Temporary Bounce?
ICNT is showing a short-term rebound after a strong decline. Buyers are pushing price toward $0.2334, but the 1H trend remains bearish.$ICNT
📊 Key Levels 🟢 Support: $0.2300 – $0.2260 🔴 Resistance: $0.2360 – $0.2400
📈 Bullish Targets: $0.2380 → $0.2440
📉 Bearish Targets: $0.2280 → $0.2250
Trading Setup (Conditional)
Long entry: Above $0.2360 after confirmation
Long stop-loss: $0.2300
Short entry: Below $0.2280 after confirmation
Short stop-loss: $0.2340
💡 My View: A recovery is developing on the 15-minute chart, but buyers must break resistance to confirm stronger momentum.
🔥 Will ICNT reach $0.2440 or fall below $0.2280?
#ICNT #CryptoAnalysis #Altcoins #BinanceSquare
Educational analysis only. Not financial advice. DYOR #BinanceSquareFamily $ICNT
{future}(ICNTUSDT)
$ICNT ICNTUSDT: Recovery Begins or Just a Temporary Bounce?
ICNT is showing a short-term rebound after a strong decline. Buyers are pushing price toward $0.2334, but the 1H trend remains bearish.$ICNT
📊 Key Levels 🟢 Support: $0.2300 – $0.2260 🔴 Resistance: $0.2360 – $0.2400
📈 Bullish Targets: $0.2380 → $0.2440
📉 Bearish Targets: $0.2280 → $0.2250
Trading Setup (Conditional)
Long entry: Above $0.2360 after confirmation
Long stop-loss: $0.2300
Short entry: Below $0.2280 after confirmation
Short stop-loss: $0.2340
💡 My View: A recovery is developing on the 15-minute chart, but buyers must break resistance to confirm stronger momentum.
🔥 Will ICNT reach $0.2440 or fall below $0.2280?
#ICNT #CryptoAnalysis #Altcoins #BinanceSquare
Educational analysis only. Not financial advice. DYOR #BinanceSquareFamily $ICNT
ICNT is showing a short-term rebound after a strong decline. Buyers are pushing price toward $0.2334, but the 1H trend remains bearish.$ICNT
📊 Key Levels 🟢 Support: $0.2300 – $0.2260 🔴 Resistance: $0.2360 – $0.2400
📈 Bullish Targets: $0.2380 → $0.2440
📉 Bearish Targets: $0.2280 → $0.2250
Trading Setup (Conditional)
Long entry: Above $0.2360 after confirmation
Long stop-loss: $0.2300
Short entry: Below $0.2280 after confirmation
Short stop-loss: $0.2340
💡 My View: A recovery is developing on the 15-minute chart, but buyers must break resistance to confirm stronger momentum.
🔥 Will ICNT reach $0.2440 or fall below $0.2280?
#ICNT #CryptoAnalysis #Altcoins #BinanceSquare
Educational analysis only. Not financial advice. DYOR #BinanceSquareFamily $ICNT
32
·
--
බෙයාරිෂ්
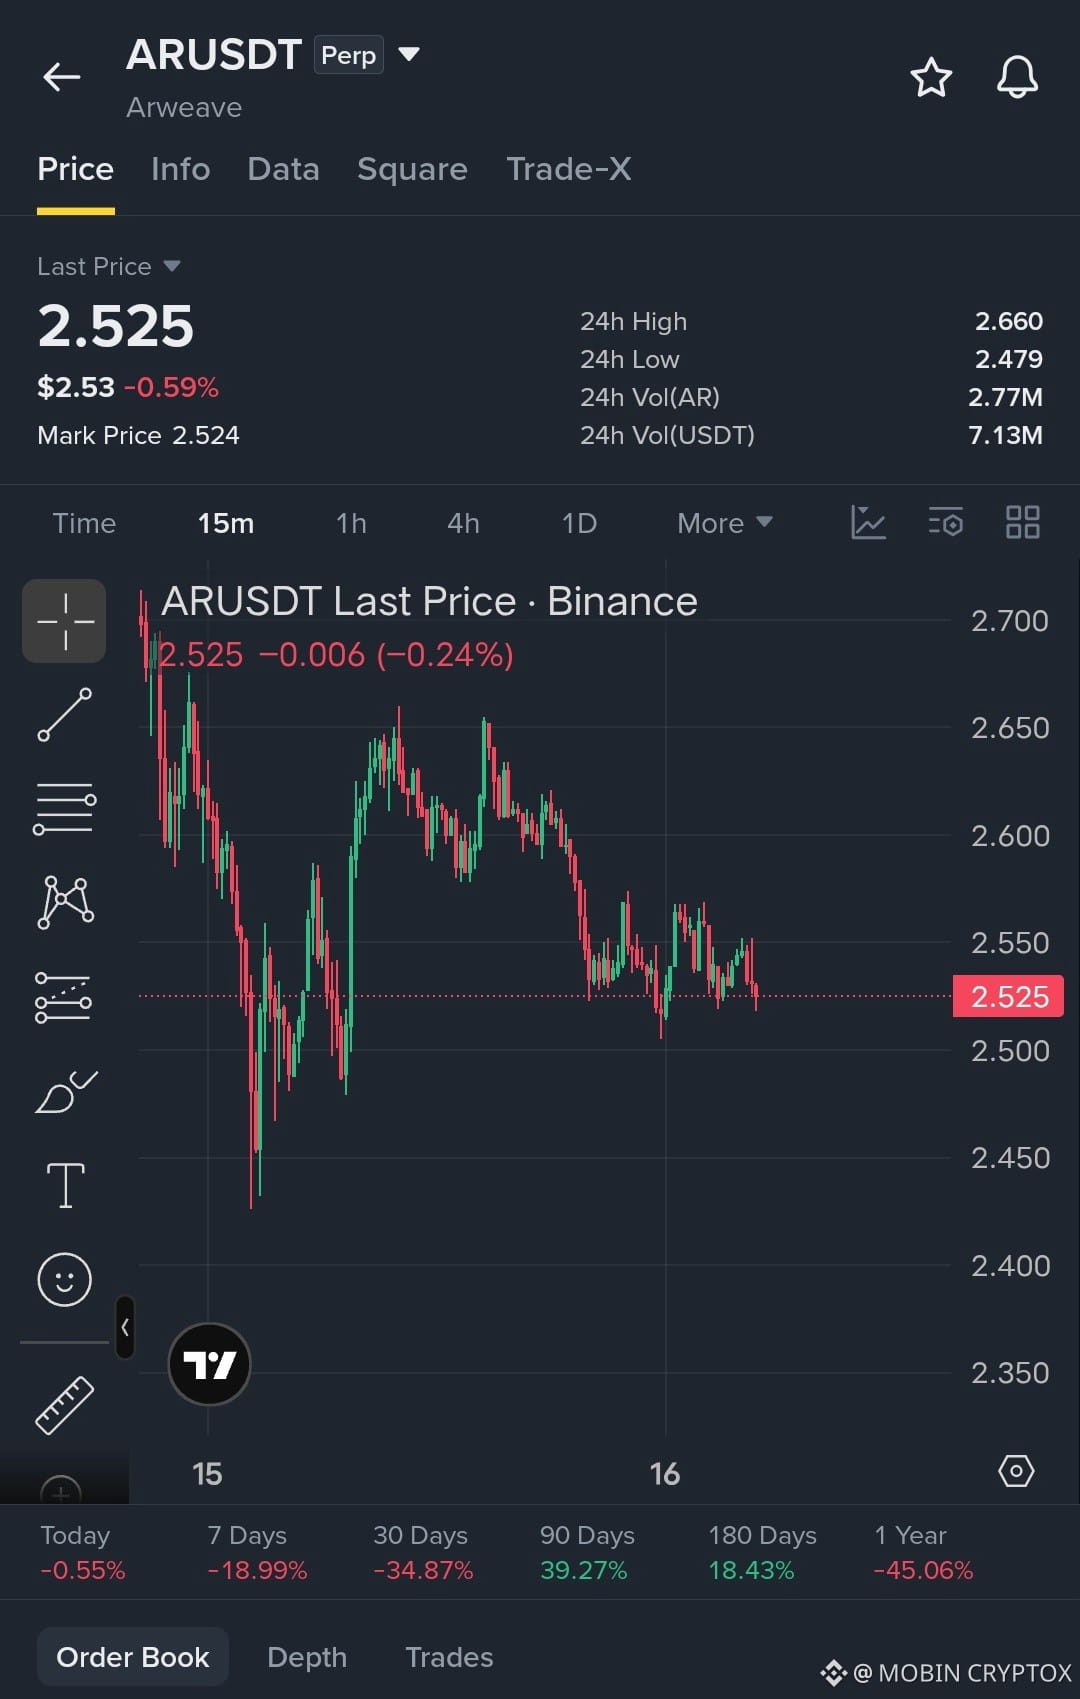
$AR ARWEAVE (AR) AT $2.52 — BREAKDOWN OR RECOVERY AHEAD
{future}(ARUSDT)
Arweave is showing short-term weakness after a prolonged decline. Buyers are attempting to stabilize the price around $2.52, but selling pressure remains visible.
📊 Key Levels 🟢 Support: $2.50 – $2.48 🔴 Resistance: $2.55 – $2.60
📈 Bullish Scenario: A confirmed breakout above $2.55 could open the way toward $2.60.
📉 Bearish Scenario: A breakdown below $2.48 could increase downside pressure.
🔍 What's Next? The market needs stronger buying volume before a recovery can be trusted. No confirmed reversal yet.
💬 Your Opinion: Will AR recover above $2.60, or will sellers push it lower?
#AR #Arweave #CryptoAnalysis #Altcoins #BinanceSquare
Educational market analysis, not financial advice. DYOR.
$AR
$AR ARWEAVE (AR) AT $2.52 — BREAKDOWN OR RECOVERY AHEAD
Arweave is showing short-term weakness after a prolonged decline. Buyers are attempting to stabilize the price around $2.52, but selling pressure remains visible.
📊 Key Levels 🟢 Support: $2.50 – $2.48 🔴 Resistance: $2.55 – $2.60
📈 Bullish Scenario: A confirmed breakout above $2.55 could open the way toward $2.60.
📉 Bearish Scenario: A breakdown below $2.48 could increase downside pressure.
🔍 What's Next? The market needs stronger buying volume before a recovery can be trusted. No confirmed reversal yet.
💬 Your Opinion: Will AR recover above $2.60, or will sellers push it lower?
#AR #Arweave #CryptoAnalysis #Altcoins #BinanceSquare
Educational market analysis, not financial advice. DYOR.
$AR
Arweave is showing short-term weakness after a prolonged decline. Buyers are attempting to stabilize the price around $2.52, but selling pressure remains visible.
📊 Key Levels 🟢 Support: $2.50 – $2.48 🔴 Resistance: $2.55 – $2.60
📈 Bullish Scenario: A confirmed breakout above $2.55 could open the way toward $2.60.
📉 Bearish Scenario: A breakdown below $2.48 could increase downside pressure.
🔍 What's Next? The market needs stronger buying volume before a recovery can be trusted. No confirmed reversal yet.
💬 Your Opinion: Will AR recover above $2.60, or will sellers push it lower?
#AR #Arweave #CryptoAnalysis #Altcoins #BinanceSquare
Educational market analysis, not financial advice. DYOR.
$AR
113

ලිපිය
GOLD UNDER PRESSURE! Is This a Buying Opportunity or the Start of a Deeper Correction$XAU Gold has always been considered a safe-haven asset. But even gold isn't immune to powerful market forces.
The precious metal has recently experienced a sharp sell-off, raising an important question: Are investors losing confidence in gold, or is the market simply adjusting to a new economic reality?
$XAU 📊 WHAT IS HAPPENING IN THE GOLD MARKET?
According to Reuters, spot gold traded around $3,879.71 per ounce on November 13, 2026, after falling approximately 4.5% during the week.
Gold also touched a level near $3,852 during Thursday's sell-off.
Three major factors are putting pressure on gold:
1️⃣ Federal Reserve Interest Rates
Expectations of higher US interest rates are reducing gold's attractiveness because gold does not generate interest income.
2️⃣ Stronger US Dollar
A stronger dollar makes gold more expensive for international buyers and can create additional selling pressure.
3️⃣ Rising Treasury Yields
Higher bond yields increase the opportunity cost of holding gold, encouraging some investors to move toward interest-bearing assets.
📉 WHAT SHOULD GOLD TRADERS WATCH?
The recent decline suggests sellers remain in control of the short-term market structure.
Important areas to monitor:
$3,850: Recent downside reference.$3,900: Initial recovery area.$4,000: Important psychological price level.
These are observation levels, not guaranteed support or resistance
🟢 BULLISH SCENARIO
If gold regains $3,900 and buying momentum improves, a recovery toward $4,000 could become possible.
🔴 BEARISH SCENARIO
If selling pressure continues and gold breaks below the recent $3,850 low, further downside risk could increase.
💡 MY MARKET VIEW#XAUUSD
I believe traders should avoid making emotional decisions during periods of extreme volatility.
A strong recovery needs confirmation. A falling market does not automatically mean a buying opportunity.
Watch the US dollar, Treasury yields, inflation data and Federal Reserve expectations before forming a directional opinion.
🔥 THE BIG QUESTION:
Is gold preparing for another recovery, or could we see prices fall further before buyers return?
Share your analysis below!
Follow MOBIN CRYPTOX for more gold, forex and cryptocurrency market research.
#Gold #MarketAnalysis #BinanceSquare #XAU
GOLD UNDER PRESSURE! Is This a Buying Opportunity or the Start of a Deeper Correction
$XAU Gold has always been considered a safe-haven asset. But even gold isn't immune to powerful market forces.
The precious metal has recently experienced a sharp sell-off, raising an important question: Are investors losing confidence in gold, or is the market simply adjusting to a new economic reality?
$XAU 📊 WHAT IS HAPPENING IN THE GOLD MARKET?
According to Reuters, spot gold traded around $3,879.71 per ounce on November 13, 2026, after falling approximately 4.5% during the week.
Gold also touched a level near $3,852 during Thursday's sell-off.
Three major factors are putting pressure on gold:
1️⃣ Federal Reserve Interest Rates
Expectations of higher US interest rates are reducing gold's attractiveness because gold does not generate interest income.
2️⃣ Stronger US Dollar
A stronger dollar makes gold more expensive for international buyers and can create additional selling pressure.
3️⃣ Rising Treasury Yields
Higher bond yields increase the opportunity cost of holding gold, encouraging some investors to move toward interest-bearing assets.
📉 WHAT SHOULD GOLD TRADERS WATCH?
The recent decline suggests sellers remain in control of the short-term market structure.
Important areas to monitor:
$3,850: Recent downside reference.$3,900: Initial recovery area.$4,000: Important psychological price level.
These are observation levels, not guaranteed support or resistance
🟢 BULLISH SCENARIO
If gold regains $3,900 and buying momentum improves, a recovery toward $4,000 could become possible.
🔴 BEARISH SCENARIO
If selling pressure continues and gold breaks below the recent $3,850 low, further downside risk could increase.
💡 MY MARKET VIEW#XAUUSD
I believe traders should avoid making emotional decisions during periods of extreme volatility.
A strong recovery needs confirmation. A falling market does not automatically mean a buying opportunity.
Watch the US dollar, Treasury yields, inflation data and Federal Reserve expectations before forming a directional opinion.
🔥 THE BIG QUESTION:
Is gold preparing for another recovery, or could we see prices fall further before buyers return?
Share your analysis below!
Follow MOBIN CRYPTOX for more gold, forex and cryptocurrency market research.
#Gold #MarketAnalysis #BinanceSquare #XAU
The precious metal has recently experienced a sharp sell-off, raising an important question: Are investors losing confidence in gold, or is the market simply adjusting to a new economic reality?
$XAU 📊 WHAT IS HAPPENING IN THE GOLD MARKET?
According to Reuters, spot gold traded around $3,879.71 per ounce on November 13, 2026, after falling approximately 4.5% during the week.
Gold also touched a level near $3,852 during Thursday's sell-off.
Three major factors are putting pressure on gold:
1️⃣ Federal Reserve Interest Rates
Expectations of higher US interest rates are reducing gold's attractiveness because gold does not generate interest income.
2️⃣ Stronger US Dollar
A stronger dollar makes gold more expensive for international buyers and can create additional selling pressure.
3️⃣ Rising Treasury Yields
Higher bond yields increase the opportunity cost of holding gold, encouraging some investors to move toward interest-bearing assets.
📉 WHAT SHOULD GOLD TRADERS WATCH?
The recent decline suggests sellers remain in control of the short-term market structure.
Important areas to monitor:
$3,850: Recent downside reference.$3,900: Initial recovery area.$4,000: Important psychological price level.
These are observation levels, not guaranteed support or resistance
🟢 BULLISH SCENARIO
If gold regains $3,900 and buying momentum improves, a recovery toward $4,000 could become possible.
🔴 BEARISH SCENARIO
If selling pressure continues and gold breaks below the recent $3,850 low, further downside risk could increase.
💡 MY MARKET VIEW#XAUUSD
I believe traders should avoid making emotional decisions during periods of extreme volatility.
A strong recovery needs confirmation. A falling market does not automatically mean a buying opportunity.
Watch the US dollar, Treasury yields, inflation data and Federal Reserve expectations before forming a directional opinion.
🔥 THE BIG QUESTION:
Is gold preparing for another recovery, or could we see prices fall further before buyers return?
Share your analysis below!
Follow MOBIN CRYPTOX for more gold, forex and cryptocurrency market research.
#Gold #MarketAnalysis #BinanceSquare #XAU
414
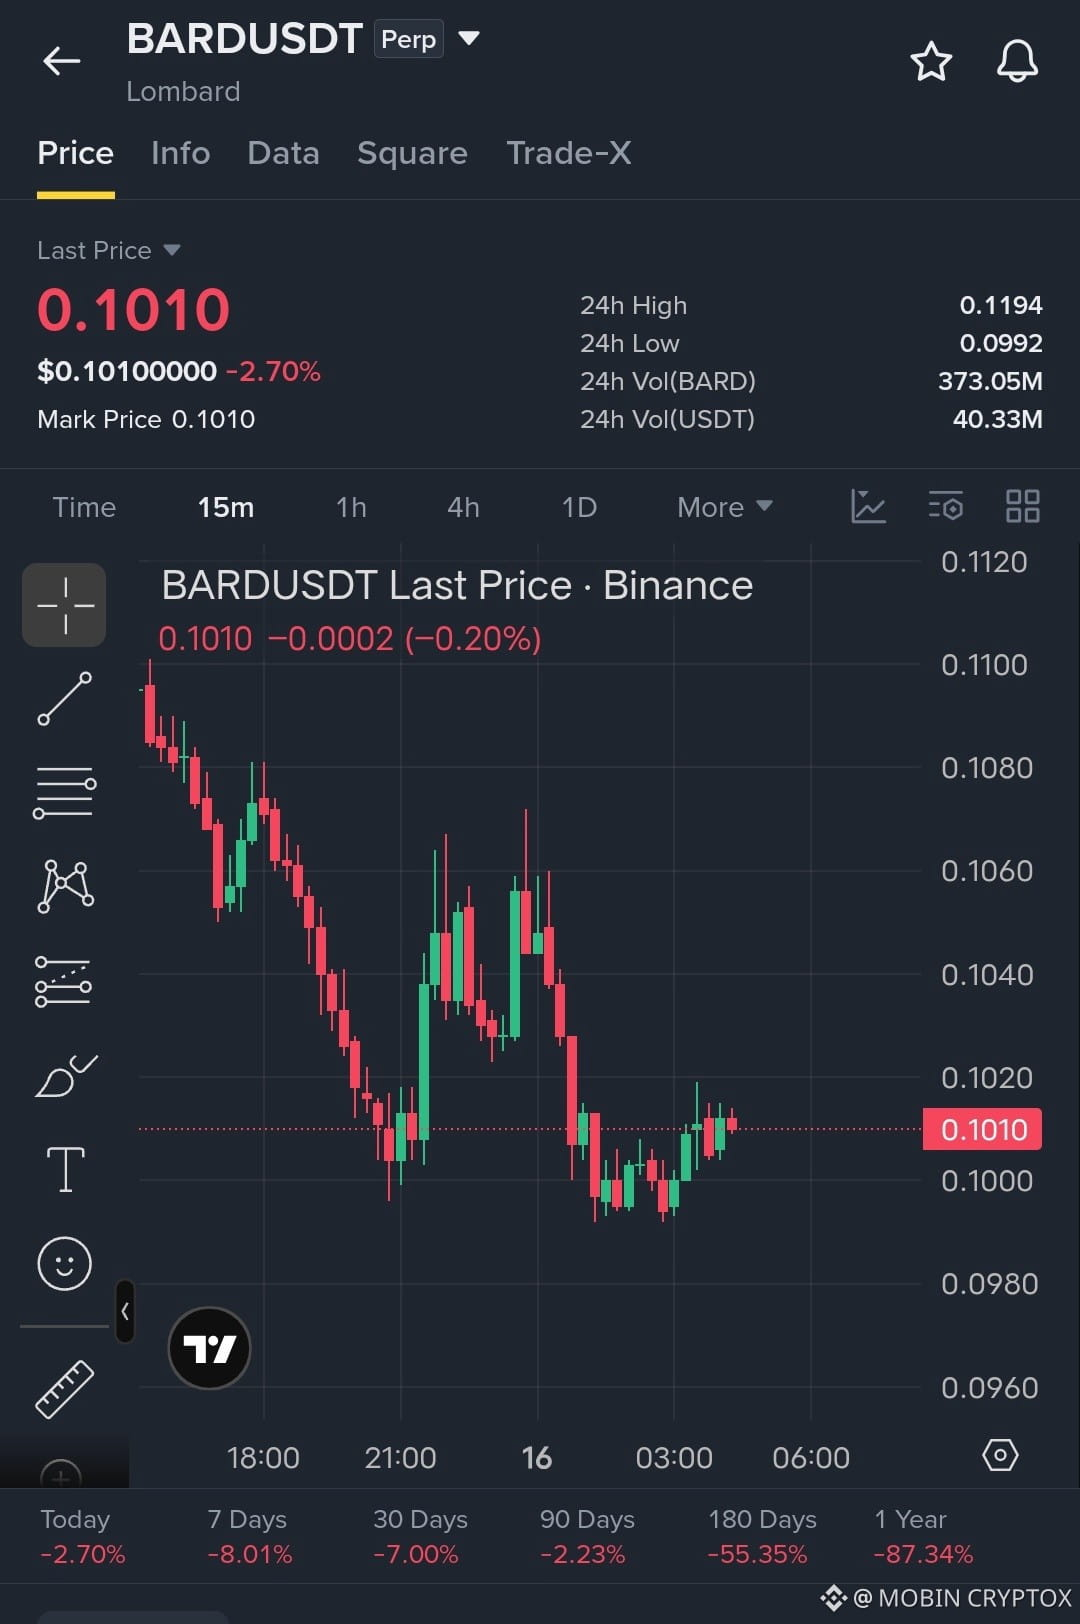
$BARD BARDUSDT: Is a Recovery Coming or More Downside Ahead?
{future}(BARDUSDT)
BARD is showing weakness after a prolonged decline. The latest candles indicate a small recovery, but buyers have not confirmed a trend reversal.
📊 Market Overview
Price: $0.1010
24H Change: -2.70%
24H High: $0.1194
24H Low: $0.0992
🔍 Key Technical Levels 🟢 Support: $0.1000–$0.0990 🔴 Resistance: $0.1020–$0.1040
📈 My Analysis: BARD is attempting to stabilize near $0.1010. A breakout above $0.1040 could improve short-term momentum.
However, a breakdown below $0.0990 could bring further selling pressure.
What do you think? Can BARD recover, or will sellers take control again?
#BARD #BARDUSDT #CryptoAnalysis #Altcoins #BinanceSquare
Educational analysis based on the supplied 15-minute chart. Not financial advice.
$BARD
$BARD BARDUSDT: Is a Recovery Coming or More Downside Ahead?
BARD is showing weakness after a prolonged decline. The latest candles indicate a small recovery, but buyers have not confirmed a trend reversal.
📊 Market Overview
Price: $0.1010
24H Change: -2.70%
24H High: $0.1194
24H Low: $0.0992
🔍 Key Technical Levels 🟢 Support: $0.1000–$0.0990 🔴 Resistance: $0.1020–$0.1040
📈 My Analysis: BARD is attempting to stabilize near $0.1010. A breakout above $0.1040 could improve short-term momentum.
However, a breakdown below $0.0990 could bring further selling pressure.
What do you think? Can BARD recover, or will sellers take control again?
#BARD #BARDUSDT #CryptoAnalysis #Altcoins #BinanceSquare
Educational analysis based on the supplied 15-minute chart. Not financial advice.
$BARD
BARD is showing weakness after a prolonged decline. The latest candles indicate a small recovery, but buyers have not confirmed a trend reversal.
📊 Market Overview
Price: $0.1010
24H Change: -2.70%
24H High: $0.1194
24H Low: $0.0992
🔍 Key Technical Levels 🟢 Support: $0.1000–$0.0990 🔴 Resistance: $0.1020–$0.1040
📈 My Analysis: BARD is attempting to stabilize near $0.1010. A breakout above $0.1040 could improve short-term momentum.
However, a breakdown below $0.0990 could bring further selling pressure.
What do you think? Can BARD recover, or will sellers take control again?
#BARD #BARDUSDT #CryptoAnalysis #Altcoins #BinanceSquare
Educational analysis based on the supplied 15-minute chart. Not financial advice.
$BARD
145
ලිපිය
BITCOIN: The Calm Before the Next Big Move? What Are Smart Investors Watching?Bitcoin is more than just a cryptocurrency. It is a market driven by psychology, liquidity, institutional money and investor confidence.
But here's an important question:
When Bitcoin suddenly drops, is it the end of the rally—or an opportunity for a new beginning?
Let's explore 5 things every Bitcoin investor should understand.
📊 1. The Battle Between Buyers and Sellers
Every Bitcoin price movement tells a story.
When buyers become stronger, prices can move higher. When sellers dominate, downward pressure increases.
The important thing isn't simply watching green and red candles. It's understanding WHY the price is moving.
🐋 2. What Are Bitcoin Whales Doing?
Large Bitcoin holders can influence market liquidity and sentiment.
Investors often monitor:$BTC
Large wallet transactions.Exchange inflows and outflows.Institutional Bitcoin purchases.Changes in long-term holder behaviour.
However, a large transaction doesn't automatically mean buying or selling pressure.
📉 3. Why Market Corrections Matter
Many investors become emotional when Bitcoin falls.
But corrections are part of volatile financial markets.
Instead of immediately assuming a recovery, examine:
Important support levels.Resistance zones.Trading volume.Market momentum
A recovery needs confirmation, not just hope.
🏦 4. Institutional Money Changes the Conversation
Bitcoin ETFs and institutional participation have created additional ways for traditional investors to gain exposure to Bitcoin.
But institutional interest doesn't guarantee higher prices.
Liquidity, economic conditions and investor sentiment still matter.
🔥 5. The Most Important Thing: Risk Management
You don't need to predict every Bitcoin movement to become a better investor.
Understand your risk.
Avoid emotional decisions.
Be careful with leverage.
Never invest money you cannot afford to lose.
💭 My Final Thought
Bitcoin's next major move will create opportunities and risks.
The real question isn't whether Bitcoin will go up or down tomorrow.
The real question is: Are you prepared for both possibilities?
👇 Let's discuss!
What do you think will drive Bitcoin's next major move?
1️⃣ Institutional investment
2️⃣ Bitcoin supply and demand
3️⃣ Global economic conditions
4️⃣ Market psychology
Share your opinion in the comments!
#bitcoin #BTC走势分析 #CryptoMarket #BitcoinAnalysis #Binance $BTC $BTC
BITCOIN: The Calm Before the Next Big Move? What Are Smart Investors Watching?
Bitcoin is more than just a cryptocurrency. It is a market driven by psychology, liquidity, institutional money and investor confidence.
But here's an important question:
When Bitcoin suddenly drops, is it the end of the rally—or an opportunity for a new beginning?
Let's explore 5 things every Bitcoin investor should understand.
📊 1. The Battle Between Buyers and Sellers
Every Bitcoin price movement tells a story.
When buyers become stronger, prices can move higher. When sellers dominate, downward pressure increases.
The important thing isn't simply watching green and red candles. It's understanding WHY the price is moving.
🐋 2. What Are Bitcoin Whales Doing?
Large Bitcoin holders can influence market liquidity and sentiment.
Investors often monitor:$BTC
Large wallet transactions.Exchange inflows and outflows.Institutional Bitcoin purchases.Changes in long-term holder behaviour.
However, a large transaction doesn't automatically mean buying or selling pressure.
📉 3. Why Market Corrections Matter
Many investors become emotional when Bitcoin falls.
But corrections are part of volatile financial markets.
Instead of immediately assuming a recovery, examine:
Important support levels.Resistance zones.Trading volume.Market momentum
A recovery needs confirmation, not just hope.
🏦 4. Institutional Money Changes the Conversation
Bitcoin ETFs and institutional participation have created additional ways for traditional investors to gain exposure to Bitcoin.
But institutional interest doesn't guarantee higher prices.
Liquidity, economic conditions and investor sentiment still matter.
🔥 5. The Most Important Thing: Risk Management
You don't need to predict every Bitcoin movement to become a better investor.
Understand your risk.
Avoid emotional decisions.
Be careful with leverage.
Never invest money you cannot afford to lose.
💭 My Final Thought
Bitcoin's next major move will create opportunities and risks.
The real question isn't whether Bitcoin will go up or down tomorrow.
The real question is: Are you prepared for both possibilities?
👇 Let's discuss!
What do you think will drive Bitcoin's next major move?
1️⃣ Institutional investment
2️⃣ Bitcoin supply and demand
3️⃣ Global economic conditions
4️⃣ Market psychology
Share your opinion in the comments!
#bitcoin #BTC走势分析 #CryptoMarket #BitcoinAnalysis #Binance $BTC $BTC
But here's an important question:
When Bitcoin suddenly drops, is it the end of the rally—or an opportunity for a new beginning?
Let's explore 5 things every Bitcoin investor should understand.
📊 1. The Battle Between Buyers and Sellers
Every Bitcoin price movement tells a story.
When buyers become stronger, prices can move higher. When sellers dominate, downward pressure increases.
The important thing isn't simply watching green and red candles. It's understanding WHY the price is moving.
🐋 2. What Are Bitcoin Whales Doing?
Large Bitcoin holders can influence market liquidity and sentiment.
Investors often monitor:$BTC
Large wallet transactions.Exchange inflows and outflows.Institutional Bitcoin purchases.Changes in long-term holder behaviour.
However, a large transaction doesn't automatically mean buying or selling pressure.
📉 3. Why Market Corrections Matter
Many investors become emotional when Bitcoin falls.
But corrections are part of volatile financial markets.
Instead of immediately assuming a recovery, examine:
Important support levels.Resistance zones.Trading volume.Market momentum
A recovery needs confirmation, not just hope.
🏦 4. Institutional Money Changes the Conversation
Bitcoin ETFs and institutional participation have created additional ways for traditional investors to gain exposure to Bitcoin.
But institutional interest doesn't guarantee higher prices.
Liquidity, economic conditions and investor sentiment still matter.
🔥 5. The Most Important Thing: Risk Management
You don't need to predict every Bitcoin movement to become a better investor.
Understand your risk.
Avoid emotional decisions.
Be careful with leverage.
Never invest money you cannot afford to lose.
💭 My Final Thought
Bitcoin's next major move will create opportunities and risks.
The real question isn't whether Bitcoin will go up or down tomorrow.
The real question is: Are you prepared for both possibilities?
👇 Let's discuss!
What do you think will drive Bitcoin's next major move?
1️⃣ Institutional investment
2️⃣ Bitcoin supply and demand
3️⃣ Global economic conditions
4️⃣ Market psychology
Share your opinion in the comments!
#bitcoin #BTC走势分析 #CryptoMarket #BitcoinAnalysis #Binance $BTC $BTC
90
·
--
බෙයාරිෂ්
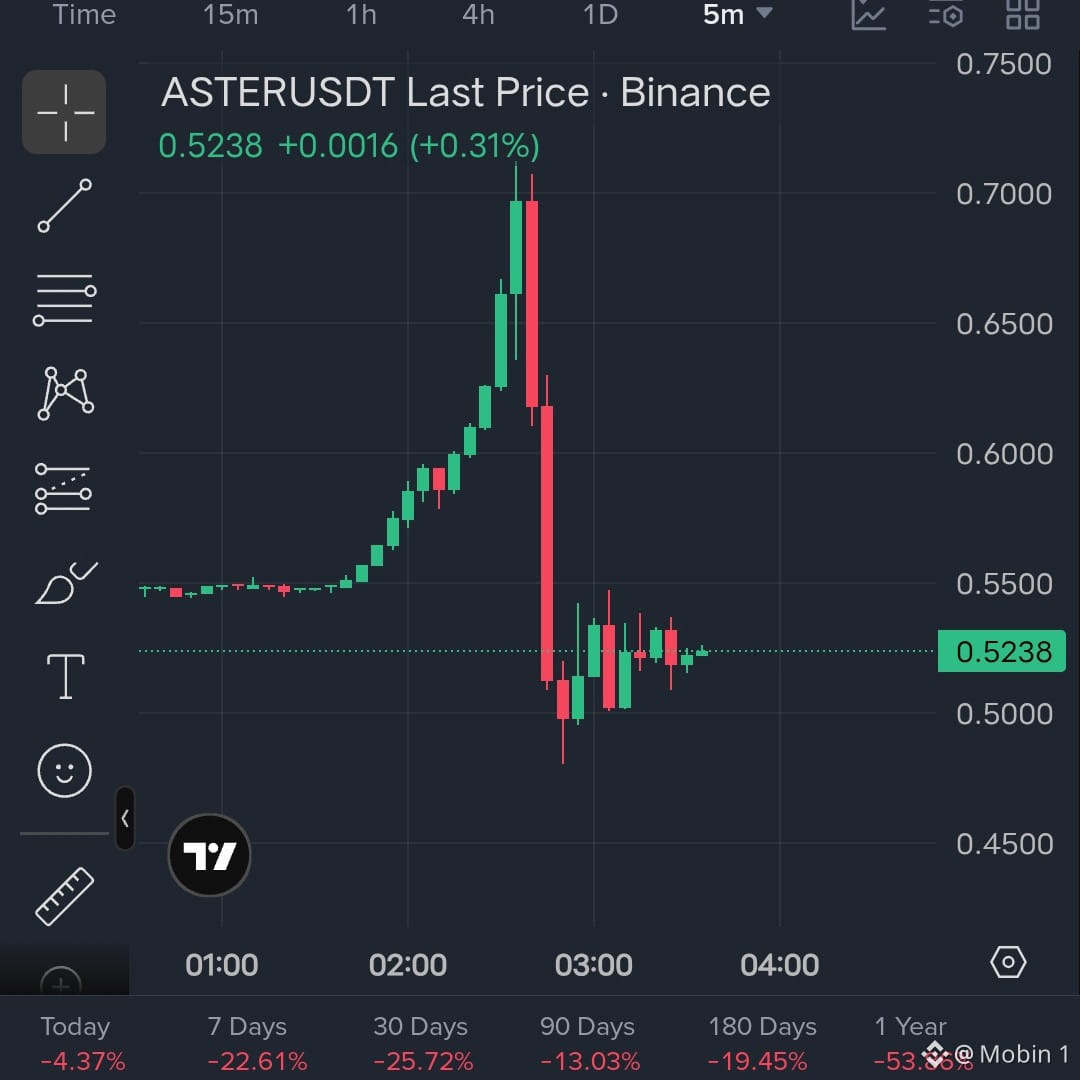
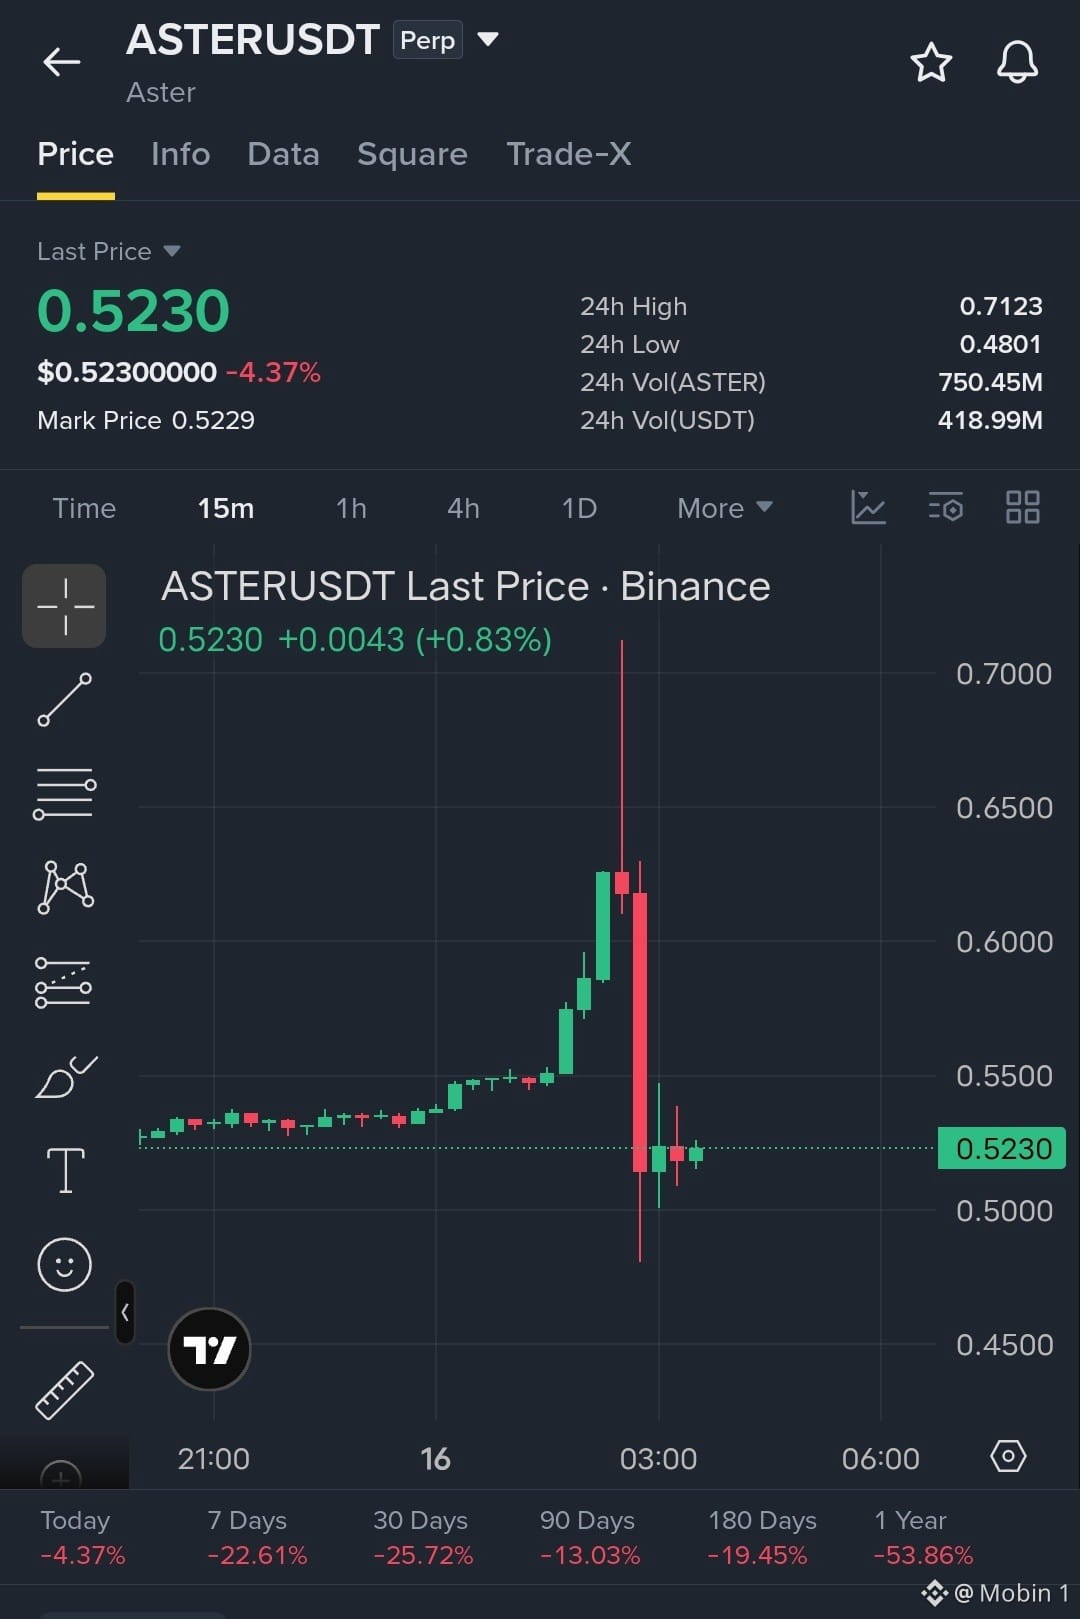
$ASTER 📉 ASTER/USDT: Sharp Rejection After Massive Rally!
ASTER surged to $0.7123 before experiencing a sharp sell-off to $0.4801.
Market Overview
Current price: $0.5230
24h change: -4.37%
24h high: $0.7123
24h low: $0.4801
Technical Analysis 🔴 Resistance: $0.5500–$0.6000
🟢 Support: $0.5000 and $0.4800
My View: ASTER is consolidating around $0.52 after a strong correction. Buyers need to regain momentum to challenge resistance.
A break below $0.50 could increase downside pressure.
What do you think? Will ASTER recover or drop further?
#ASTER #ASTERUSDT #CryptoAnalysis #BinanceSquare
Educational analysis based on the supplied chart. Not financial advice.
$ASTER $BTC
{future}(ASTERUSDT)
$ASTER 📉 ASTER/USDT: Sharp Rejection After Massive Rally!
ASTER surged to $0.7123 before experiencing a sharp sell-off to $0.4801.
Market Overview
Current price: $0.5230
24h change: -4.37%
24h high: $0.7123
24h low: $0.4801
Technical Analysis 🔴 Resistance: $0.5500–$0.6000
🟢 Support: $0.5000 and $0.4800
My View: ASTER is consolidating around $0.52 after a strong correction. Buyers need to regain momentum to challenge resistance.
A break below $0.50 could increase downside pressure.
What do you think? Will ASTER recover or drop further?
#ASTER #ASTERUSDT #CryptoAnalysis #BinanceSquare
Educational analysis based on the supplied chart. Not financial advice.
$ASTER $BTC
ASTER surged to $0.7123 before experiencing a sharp sell-off to $0.4801.
Market Overview
Current price: $0.5230
24h change: -4.37%
24h high: $0.7123
24h low: $0.4801
Technical Analysis 🔴 Resistance: $0.5500–$0.6000
🟢 Support: $0.5000 and $0.4800
My View: ASTER is consolidating around $0.52 after a strong correction. Buyers need to regain momentum to challenge resistance.
A break below $0.50 could increase downside pressure.
What do you think? Will ASTER recover or drop further?
#ASTER #ASTERUSDT #CryptoAnalysis #BinanceSquare
Educational analysis based on the supplied chart. Not financial advice.
$ASTER $BTC
531
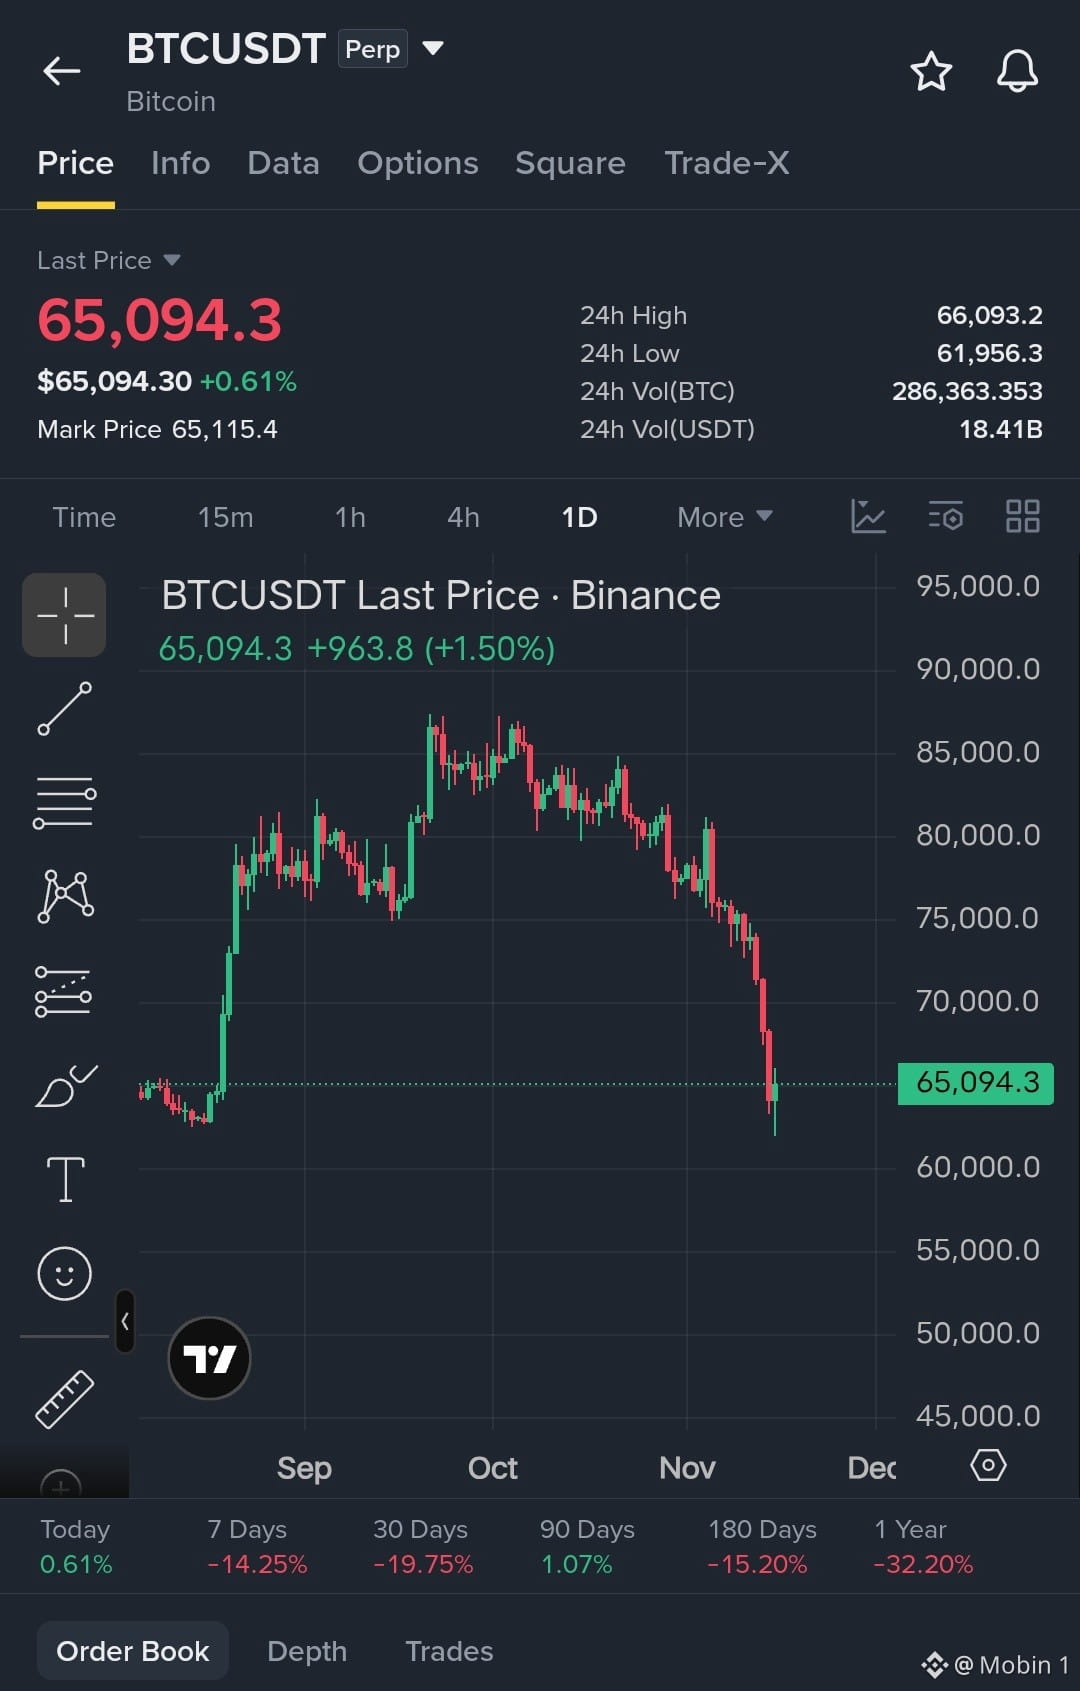
$BTC 📉 BITCOIN MARKET ANALYSIS: Is This a Real Recovery or Just a Temporary Bounce?
Bitcoin is showing a small recovery after a sharp decline. However, the bigger picture still deserves attention.
1 Overall Trend
Bitcoin has formed lower highs and lower lows on the visible daily chart. This suggests that sellers have maintained control over the broader trend.
2. Important Support
The $61,950–$62,000 area is an important level to monitor because the recent decline reached this region before bouncing.
If price breaks below this area and fails to recover, further downside pressure could develop.
3. Important Resistance
The $66,000–$66,100 region is the first level I would watch.
A daily close above this area, followed by a successful retest, could indicate improving buying strength.
📈 Two Possible Scenarios
🟢 Bullish Scenario: Bitcoin reclaims $66,100 and starts forming higher highs. This could create an opportunity for a stronger recovery.
🔴 Bearish Scenario: Bitcoin gets rejected near resistance and loses the $61,950 support area. This could indicate that sellers remain in control.
💭 My Personal View
I would avoid calling this a confirmed trend reversal based on one rebound.
I want to see stronger buying participation, a confirmed daily breakout and a successful retest before becoming more confident about a recovery.
Risk management matters more than predicting the exact bottom.
❓ What Do You Think?
Is Bitcoin preparing for a recovery, or could another correction be coming?
Share your analysis in the comments.
Follow me for more educational BTC market analysis.
#Bitcoin #BTC #BTCUSDT #CryptoAnalysis #TechnicalAnalysis #BinanceSquare
Disclaimer: Educational analysis based on the supplied chart. Not financial advice. Prices and market conditions may change.
{future}(BTCUSDT)
$BTC 📉 BITCOIN MARKET ANALYSIS: Is This a Real Recovery or Just a Temporary Bounce?
Bitcoin is showing a small recovery after a sharp decline. However, the bigger picture still deserves attention.
1 Overall Trend
Bitcoin has formed lower highs and lower lows on the visible daily chart. This suggests that sellers have maintained control over the broader trend.
2. Important Support
The $61,950–$62,000 area is an important level to monitor because the recent decline reached this region before bouncing.
If price breaks below this area and fails to recover, further downside pressure could develop.
3. Important Resistance
The $66,000–$66,100 region is the first level I would watch.
A daily close above this area, followed by a successful retest, could indicate improving buying strength.
📈 Two Possible Scenarios
🟢 Bullish Scenario: Bitcoin reclaims $66,100 and starts forming higher highs. This could create an opportunity for a stronger recovery.
🔴 Bearish Scenario: Bitcoin gets rejected near resistance and loses the $61,950 support area. This could indicate that sellers remain in control.
💭 My Personal View
I would avoid calling this a confirmed trend reversal based on one rebound.
I want to see stronger buying participation, a confirmed daily breakout and a successful retest before becoming more confident about a recovery.
Risk management matters more than predicting the exact bottom.
❓ What Do You Think?
Is Bitcoin preparing for a recovery, or could another correction be coming?
Share your analysis in the comments.
Follow me for more educational BTC market analysis.
#Bitcoin #BTC #BTCUSDT #CryptoAnalysis #TechnicalAnalysis #BinanceSquare
Disclaimer: Educational analysis based on the supplied chart. Not financial advice. Prices and market conditions may change.
Bitcoin is showing a small recovery after a sharp decline. However, the bigger picture still deserves attention.
1 Overall Trend
Bitcoin has formed lower highs and lower lows on the visible daily chart. This suggests that sellers have maintained control over the broader trend.
2. Important Support
The $61,950–$62,000 area is an important level to monitor because the recent decline reached this region before bouncing.
If price breaks below this area and fails to recover, further downside pressure could develop.
3. Important Resistance
The $66,000–$66,100 region is the first level I would watch.
A daily close above this area, followed by a successful retest, could indicate improving buying strength.
📈 Two Possible Scenarios
🟢 Bullish Scenario: Bitcoin reclaims $66,100 and starts forming higher highs. This could create an opportunity for a stronger recovery.
🔴 Bearish Scenario: Bitcoin gets rejected near resistance and loses the $61,950 support area. This could indicate that sellers remain in control.
💭 My Personal View
I would avoid calling this a confirmed trend reversal based on one rebound.
I want to see stronger buying participation, a confirmed daily breakout and a successful retest before becoming more confident about a recovery.
Risk management matters more than predicting the exact bottom.
❓ What Do You Think?
Is Bitcoin preparing for a recovery, or could another correction be coming?
Share your analysis in the comments.
Follow me for more educational BTC market analysis.
#Bitcoin #BTC #BTCUSDT #CryptoAnalysis #TechnicalAnalysis #BinanceSquare
Disclaimer: Educational analysis based on the supplied chart. Not financial advice. Prices and market conditions may change.
70
·
--
උසබ තත්ත්වය
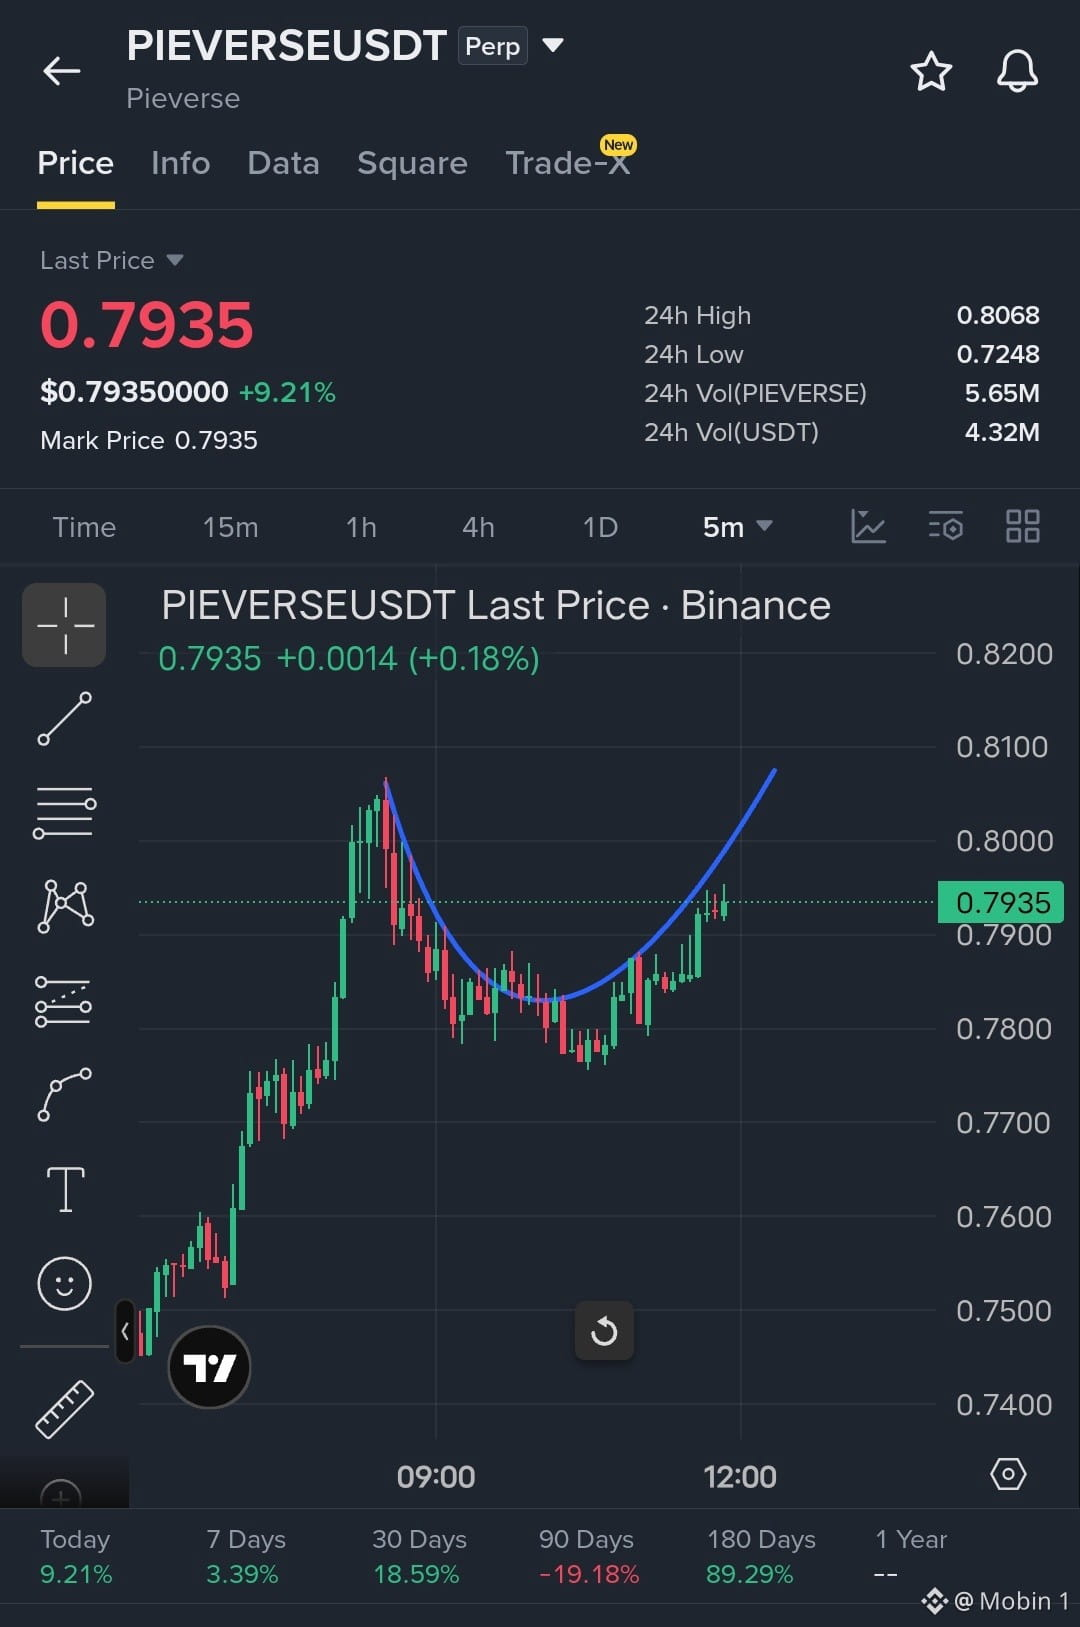
$PIEVERSE Bullish Trade But risky
Entry Safe :
Target 🎯: $0.8100
Stoploss : 0.7840
{future}(PIEVERSEUSDT)
$PIEVERSE Bullish Trade But risky
Entry Safe :
Target 🎯: $0.8100
Stoploss : 0.7840
Entry Safe :
Target 🎯: $0.8100
Stoploss : 0.7840
86
·
--
උසබ තත්ත්වය
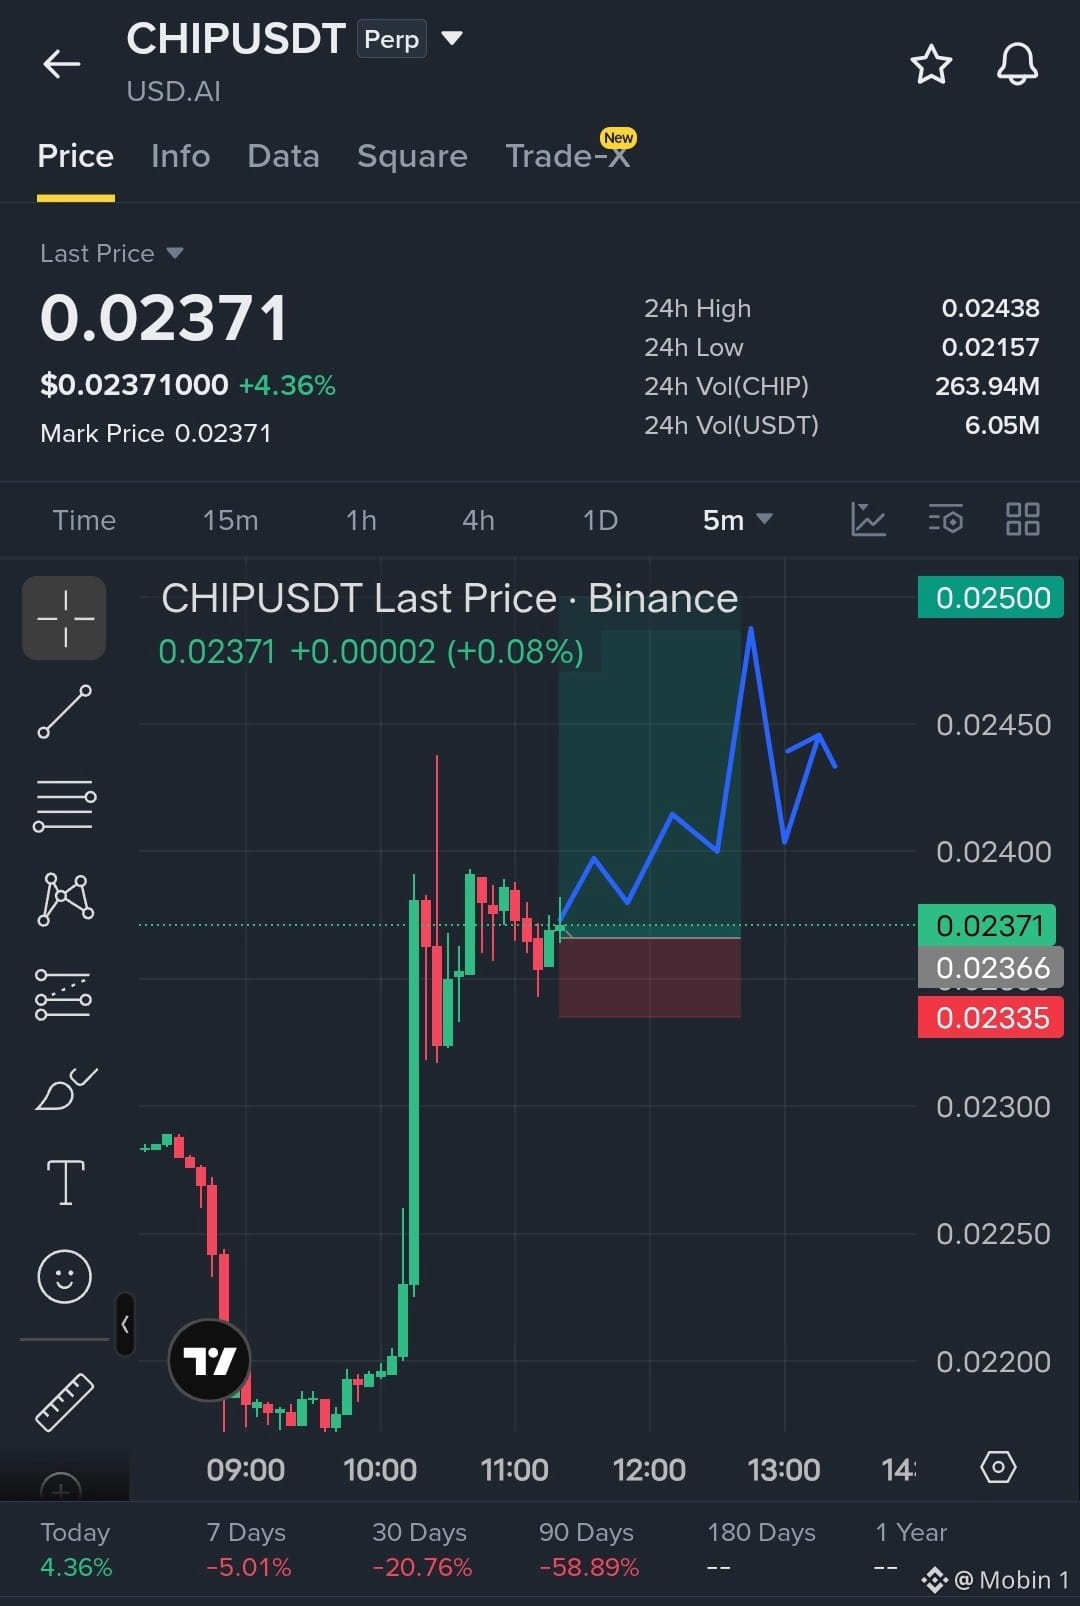
$CHIP Bullish Trade
Buy Entry : $0.02366 -- $0.02371
Target 🎯: $0.02450
Target 🎯: $0.02500
Stoploss : $0.02335
{future}(CHIPUSDT)
$CHIP Bullish Trade
Buy Entry : $0.02366 -- $0.02371
Target 🎯: $0.02450
Target 🎯: $0.02500
Stoploss : $0.02335
Buy Entry : $0.02366 -- $0.02371
Target 🎯: $0.02450
Target 🎯: $0.02500
Stoploss : $0.02335
1
319
·
--
බෙයාරිෂ්
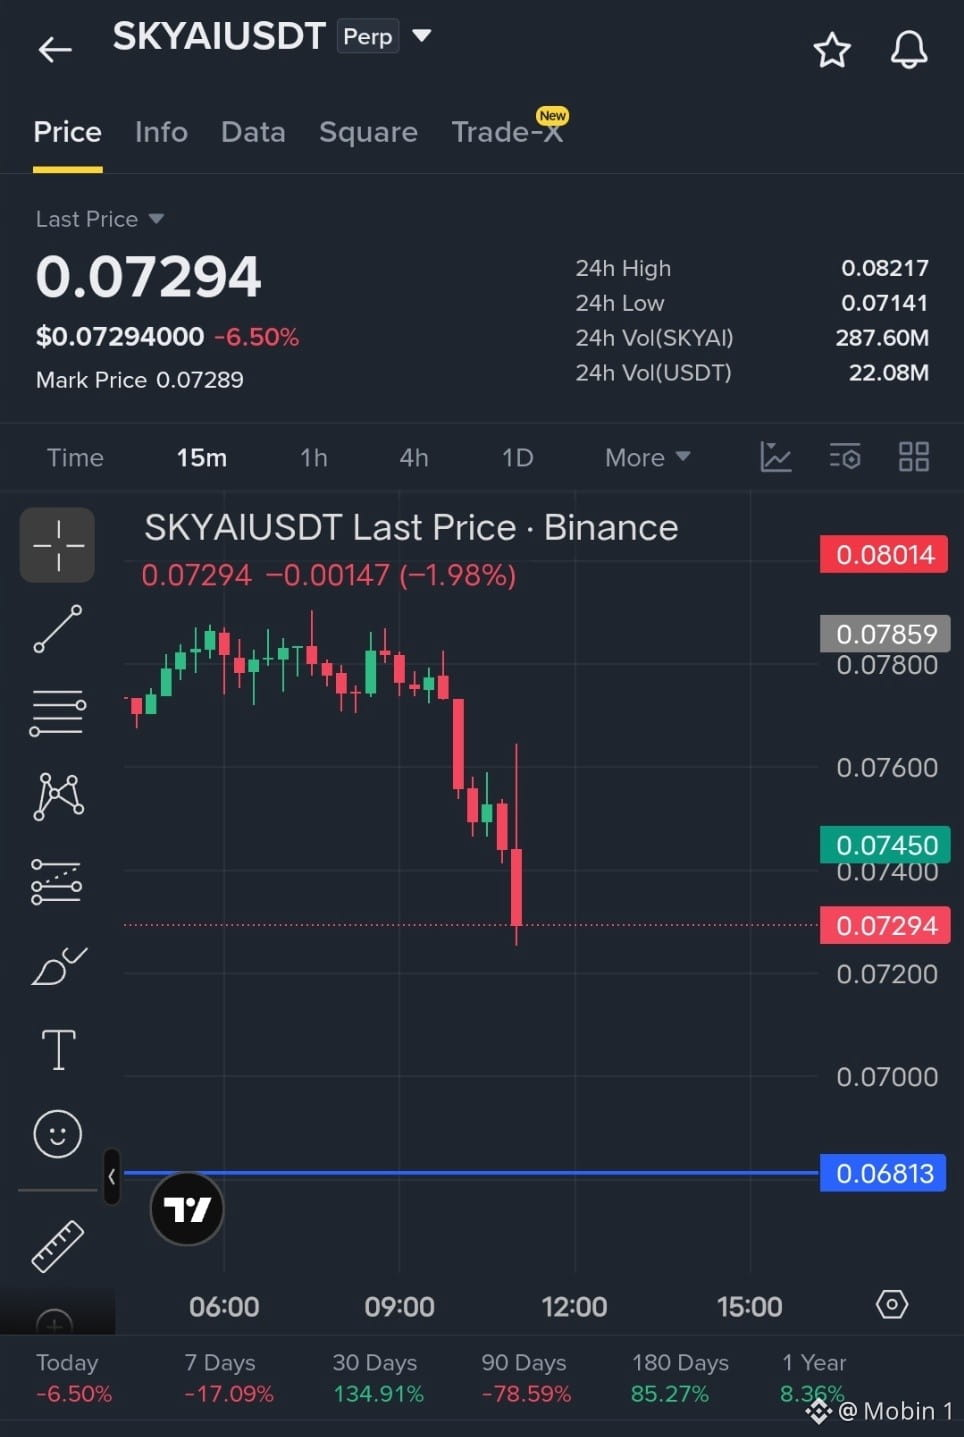
$SKYAI 🐻 Short Sell Trade
Entry : Safe 0.07300
Stoploss :
Target 🎯 0.07000
Target 🎯 : 0.06813
{future}(SKYAIUSDT)
$SKYAI 🐻 Short Sell Trade
Entry : Safe 0.07300
Stoploss :
Target 🎯 0.07000
Target 🎯 : 0.06813
Entry : Safe 0.07300
Stoploss :
Target 🎯 0.07000
Target 🎯 : 0.06813
292
·
--
බෙයාරිෂ්
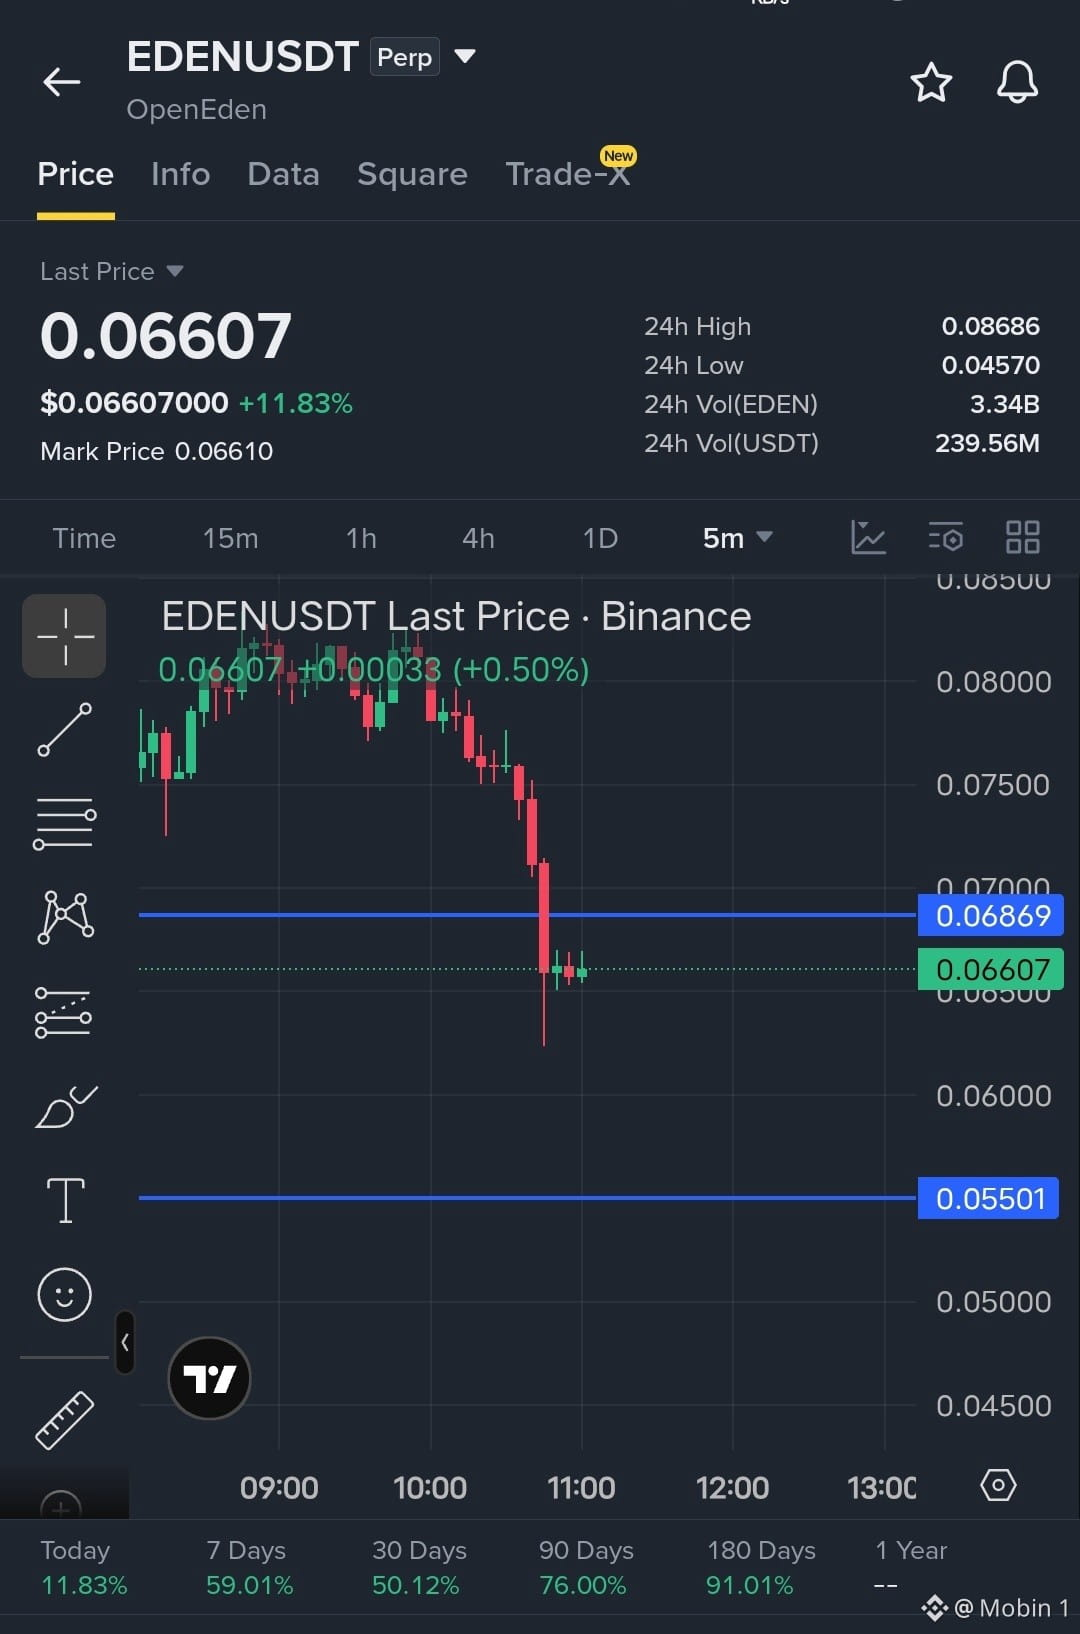
$EDEN Strong 🐻 Short Sell Trade
Entry Safe zone 0.06607
Stoploss : 0.06865
Target : 🎯 0.5500
{future}(EDENUSDT)
$EDEN Strong 🐻 Short Sell Trade
Entry Safe zone 0.06607
Stoploss : 0.06865
Target : 🎯 0.5500
Entry Safe zone 0.06607
Stoploss : 0.06865
Target : 🎯 0.5500
56
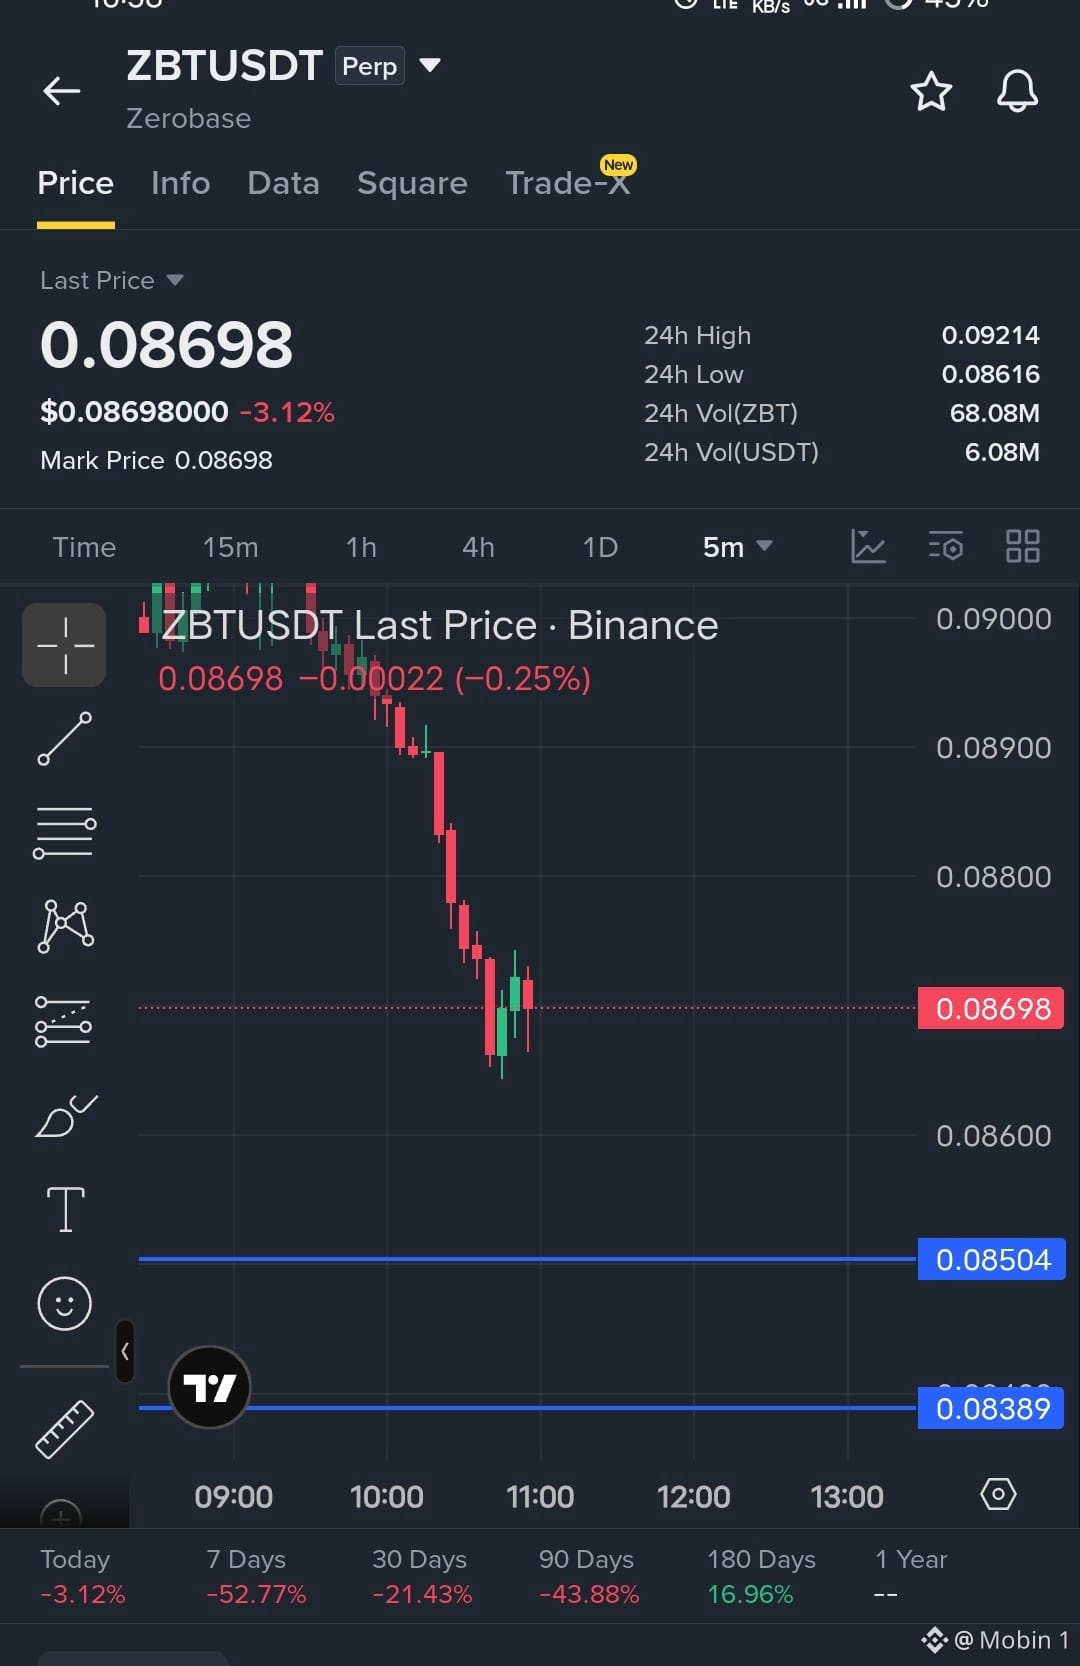
$ZBT Strot Sell
Entry : 0.08698
Target : 🎯 0.08504 -- 🎯0.08390
Stoploss : 0.08740
{future}(ZBTUSDT)
$ZBT Strot Sell
Entry : 0.08698
Target : 🎯 0.08504 -- 🎯0.08390
Stoploss : 0.08740
Entry : 0.08698
Target : 🎯 0.08504 -- 🎯0.08390
Stoploss : 0.08740
207
·
--
බෙයාරිෂ්
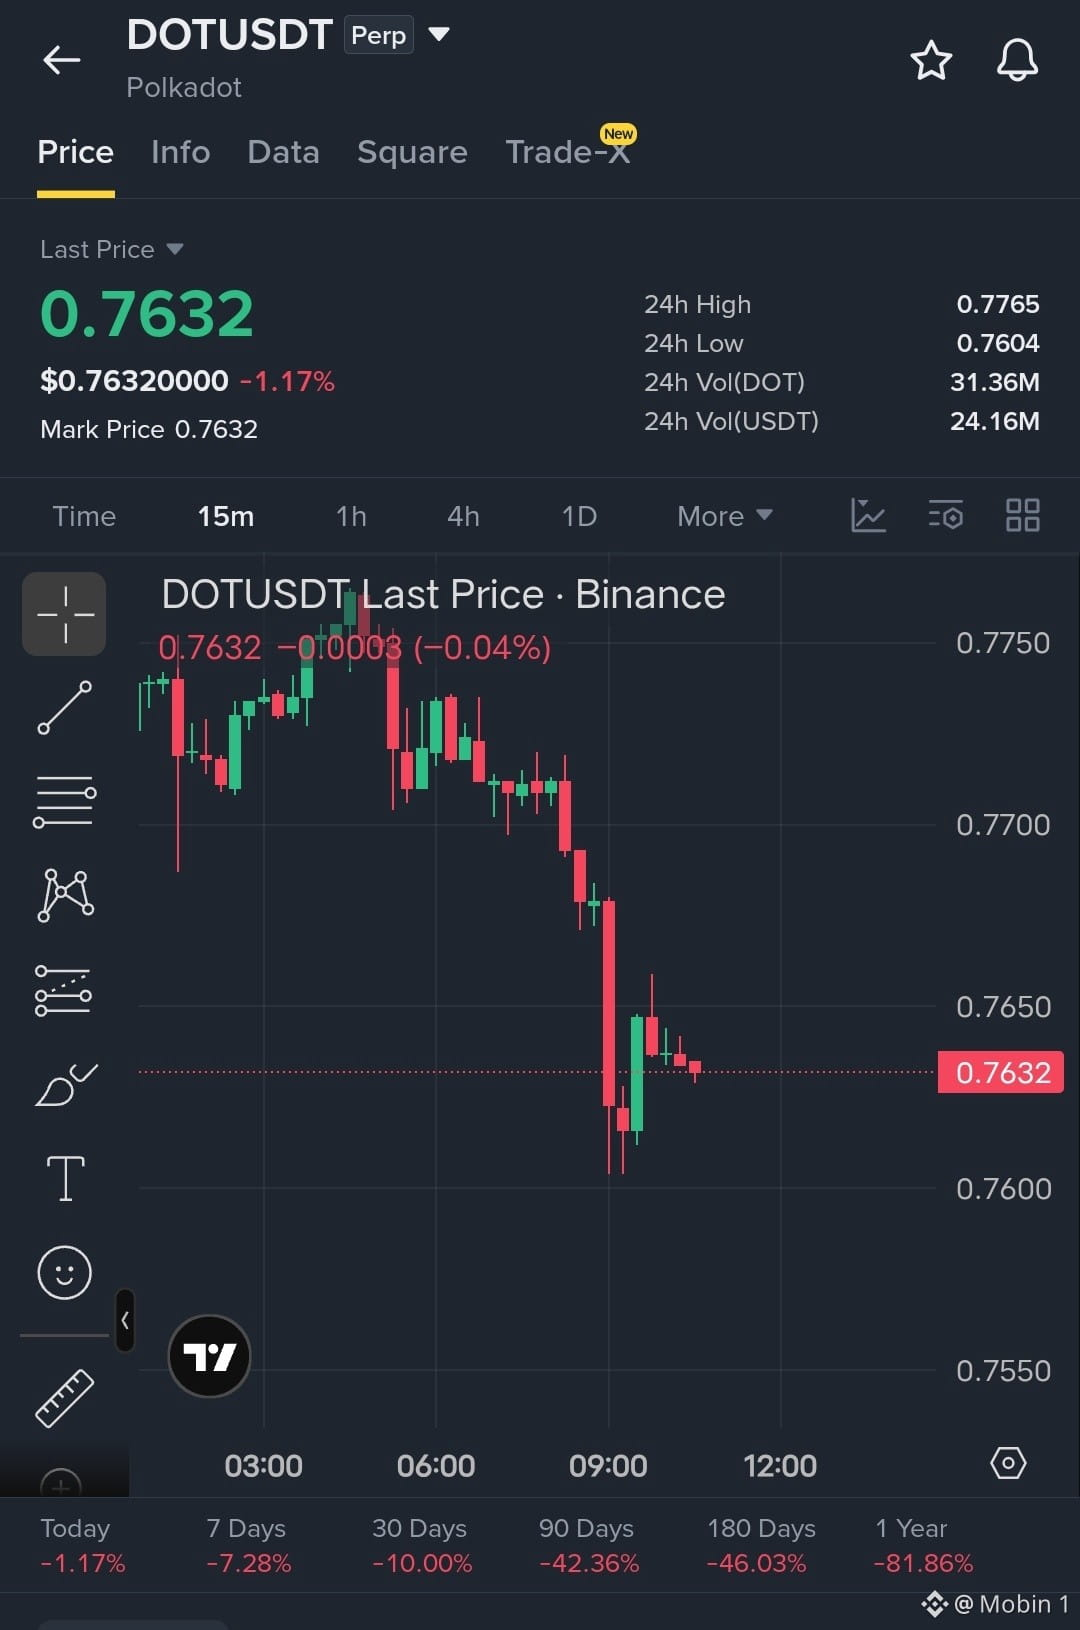
$DOT Short Sell Trade
Entry : 0.7650 -- 0.7630
Target 🎯 0.7550
Stoploss : 0.7670 - 0.7680
{future}(DOTUSDT)
$DOT Short Sell Trade
Entry : 0.7650 -- 0.7630
Target 🎯 0.7550
Stoploss : 0.7670 - 0.7680
Entry : 0.7650 -- 0.7630
Target 🎯 0.7550
Stoploss : 0.7670 - 0.7680
119
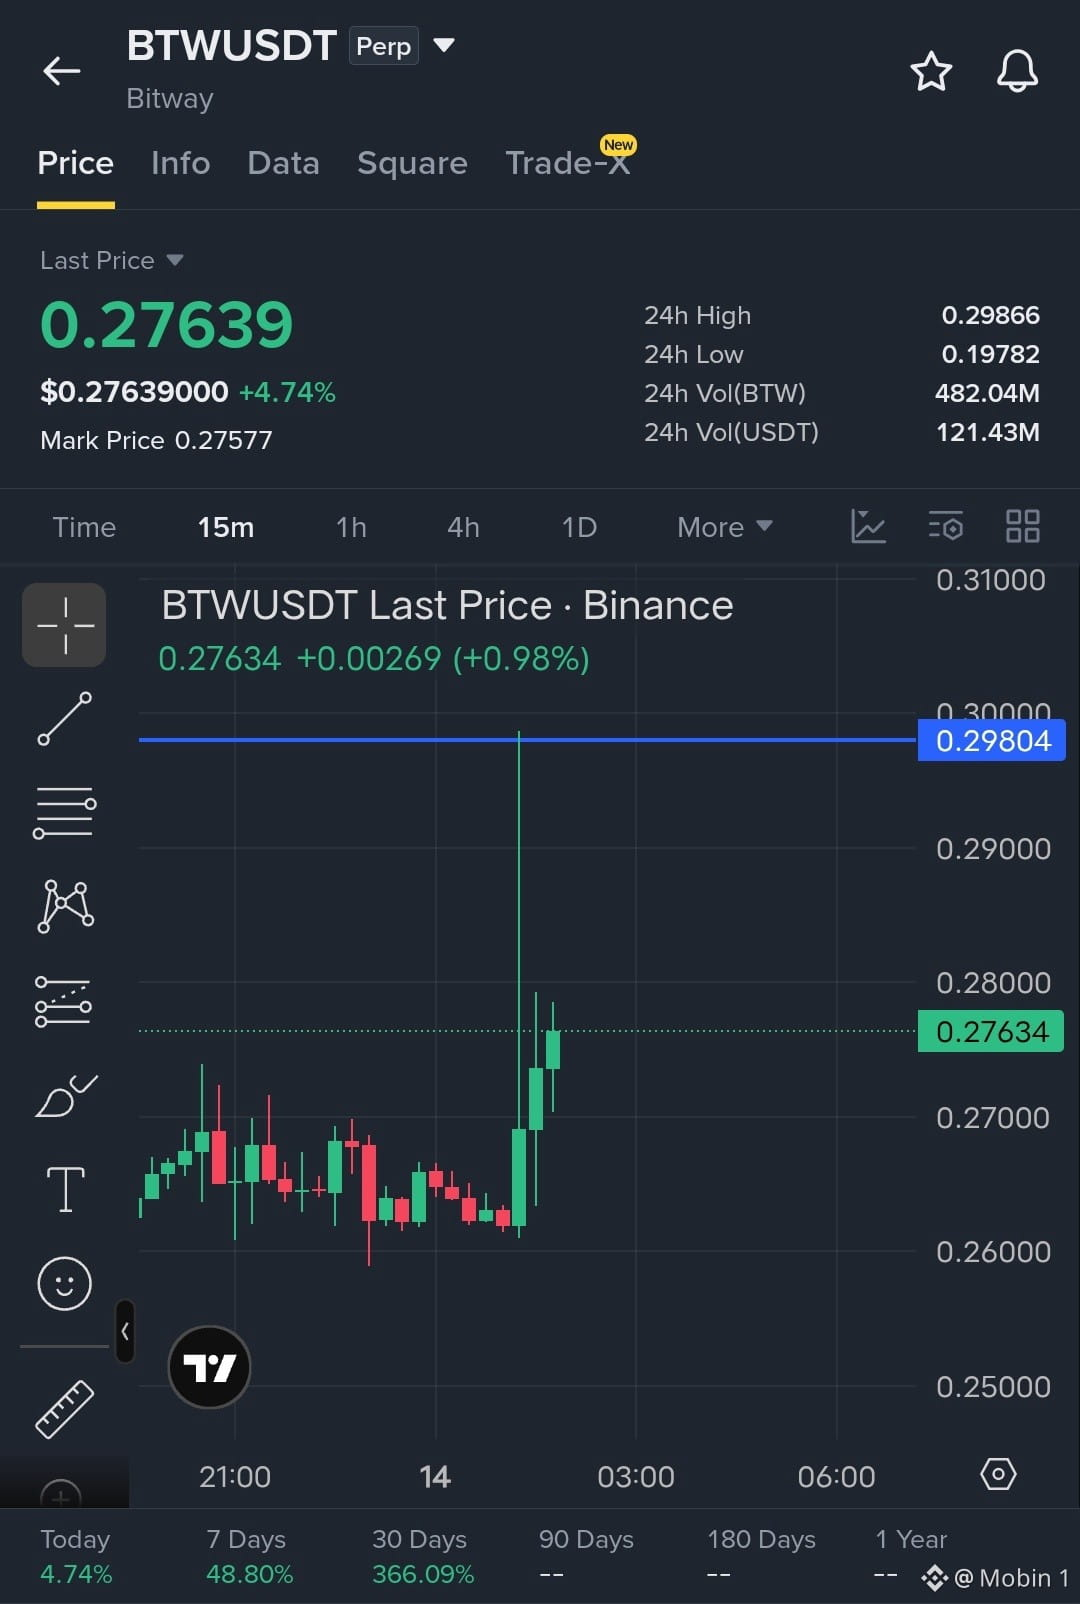
$BTW Strong bullish pattern
Safe Entry Buy :
Target 🎯 : 0.29804
Stoploss : 0.27000
{future}(BTWUSDT)
$BTW Strong bullish pattern
Safe Entry Buy :
Target 🎯 : 0.29804
Stoploss : 0.27000
Safe Entry Buy :
Target 🎯 : 0.29804
Stoploss : 0.27000
277
·
--
උසබ තත්ත්වය
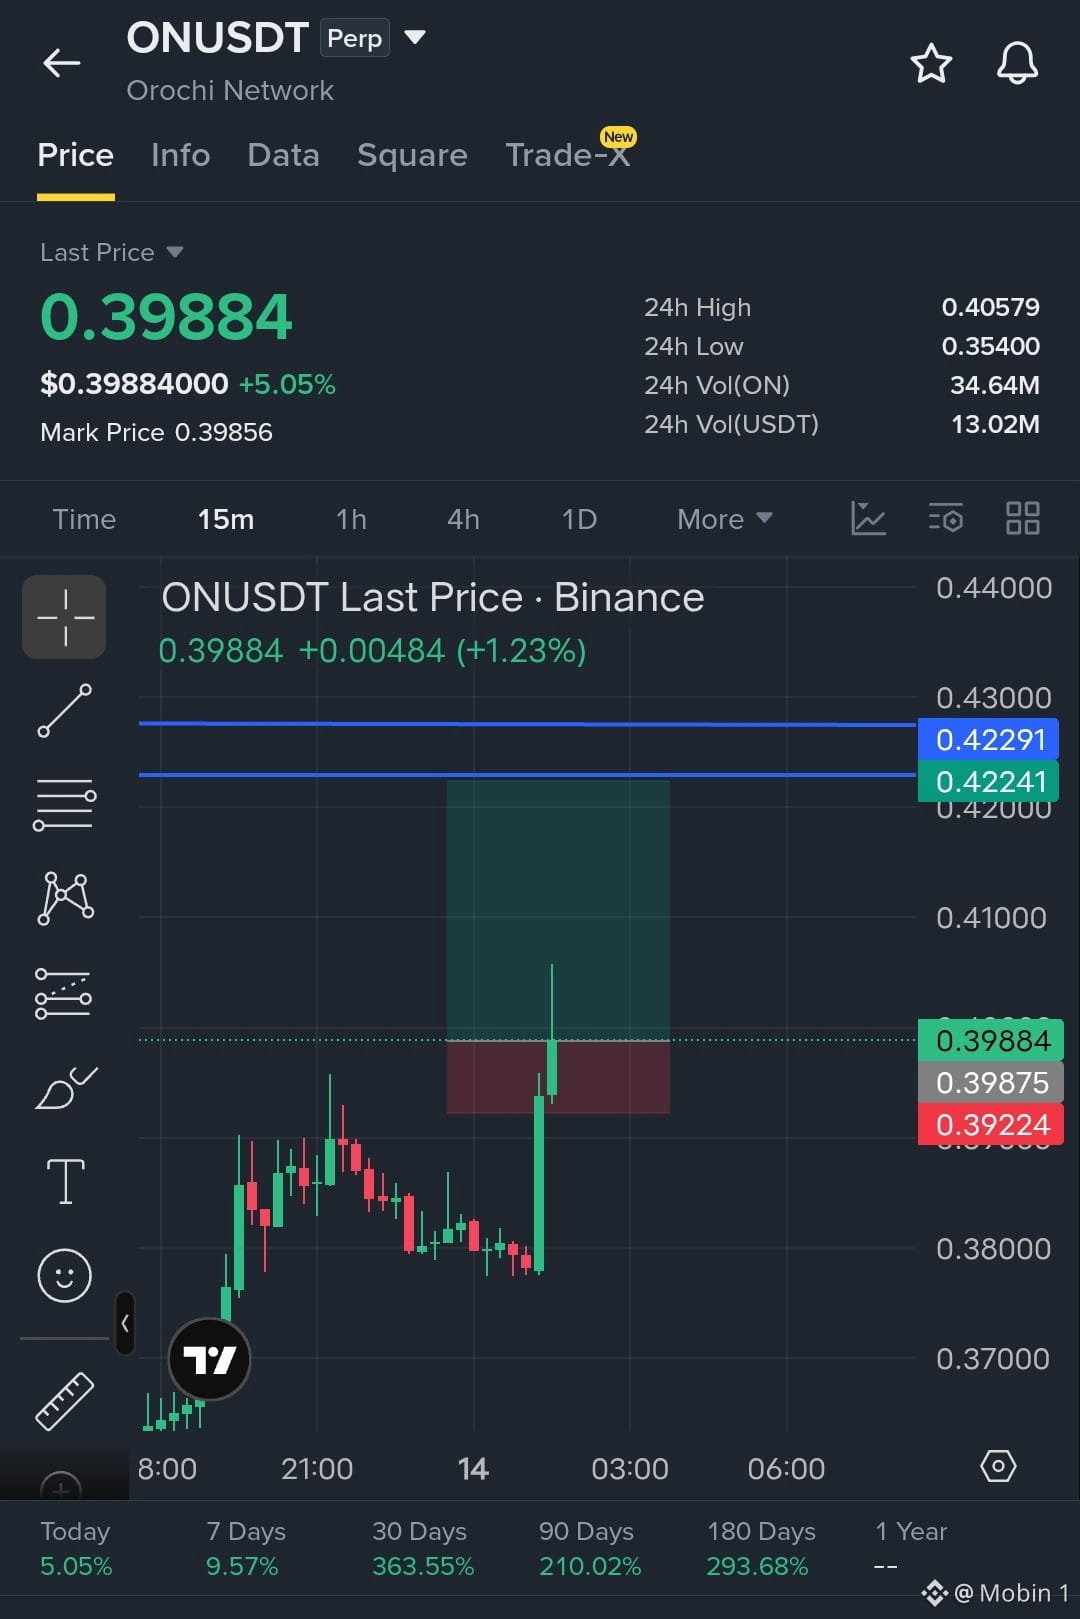
$ON Bullish Trade
Buy Entry :
Target : 0.42241
Stoploss : 39224
{future}(ONUSDT)
$ON Bullish Trade
Buy Entry :
Target : 0.42241
Stoploss : 39224
Buy Entry :
Target : 0.42241
Stoploss : 39224
1
232
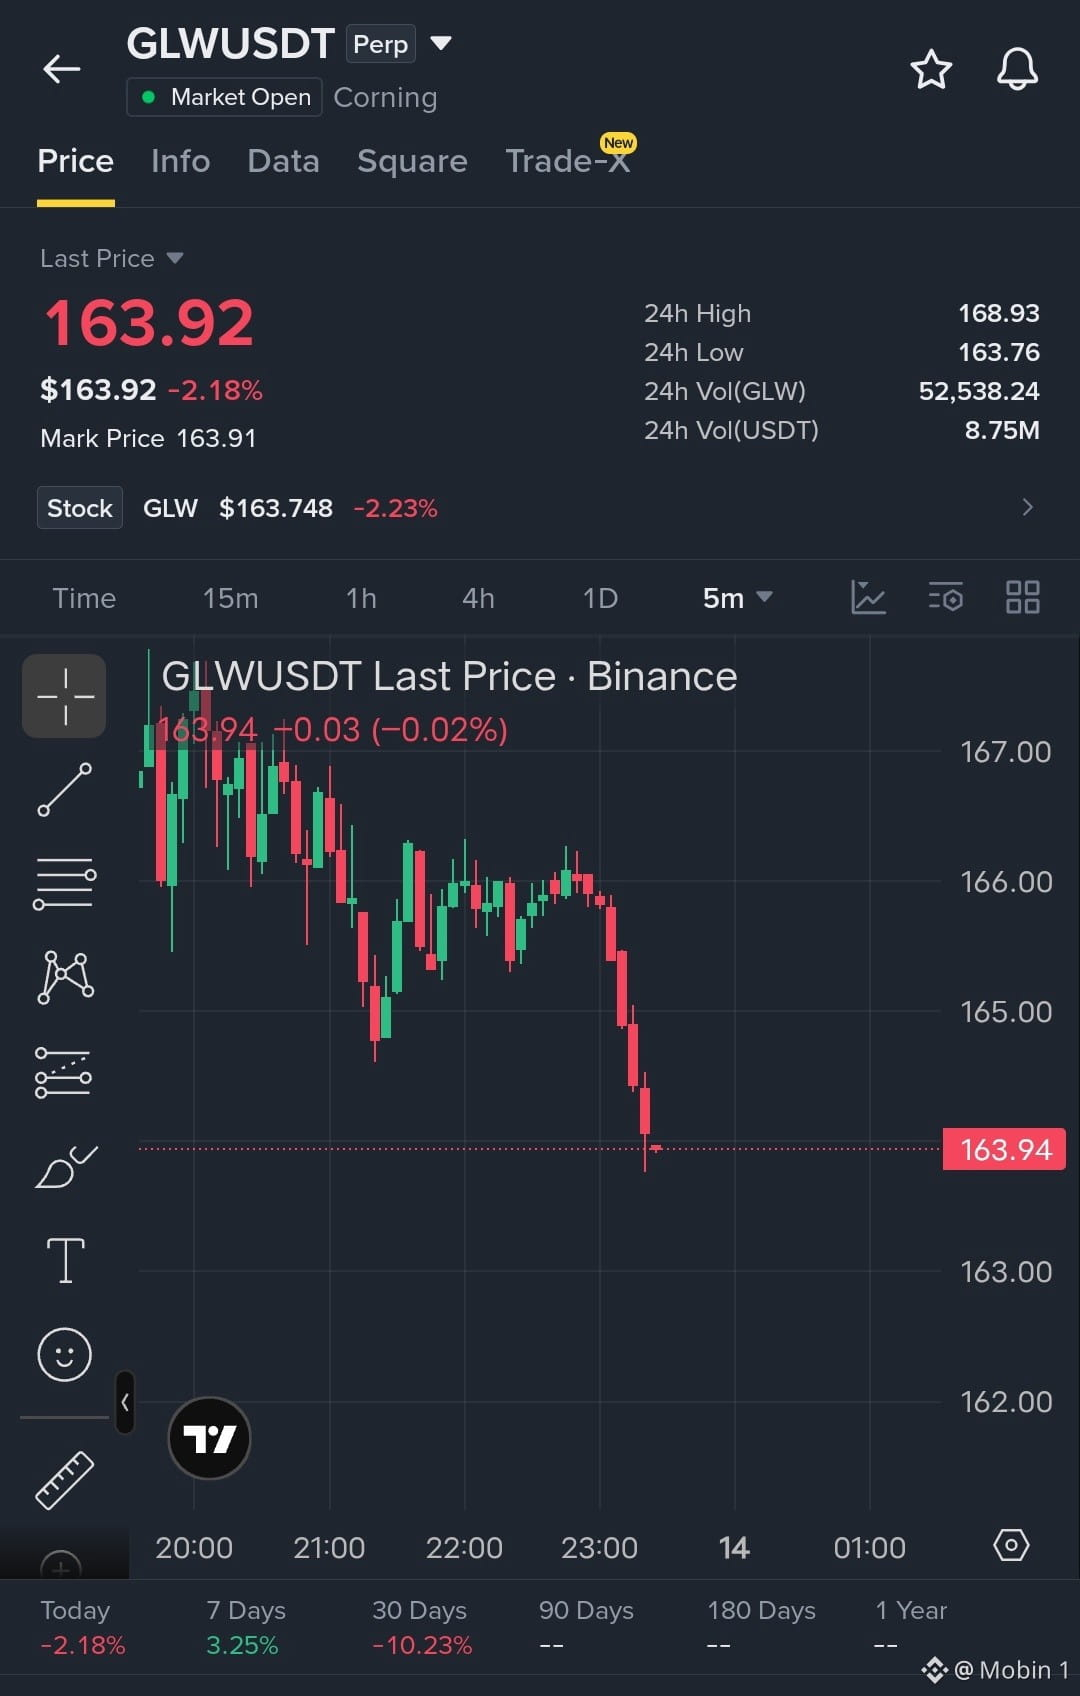
$GLW short Trade
Enter in Short Selling Target 🎯 163 - 🎯163.50
{future}(GLWUSDT)
$GLW short Trade
Enter in Short Selling Target 🎯 163 - 🎯163.50
Enter in Short Selling Target 🎯 163 - 🎯163.50
70
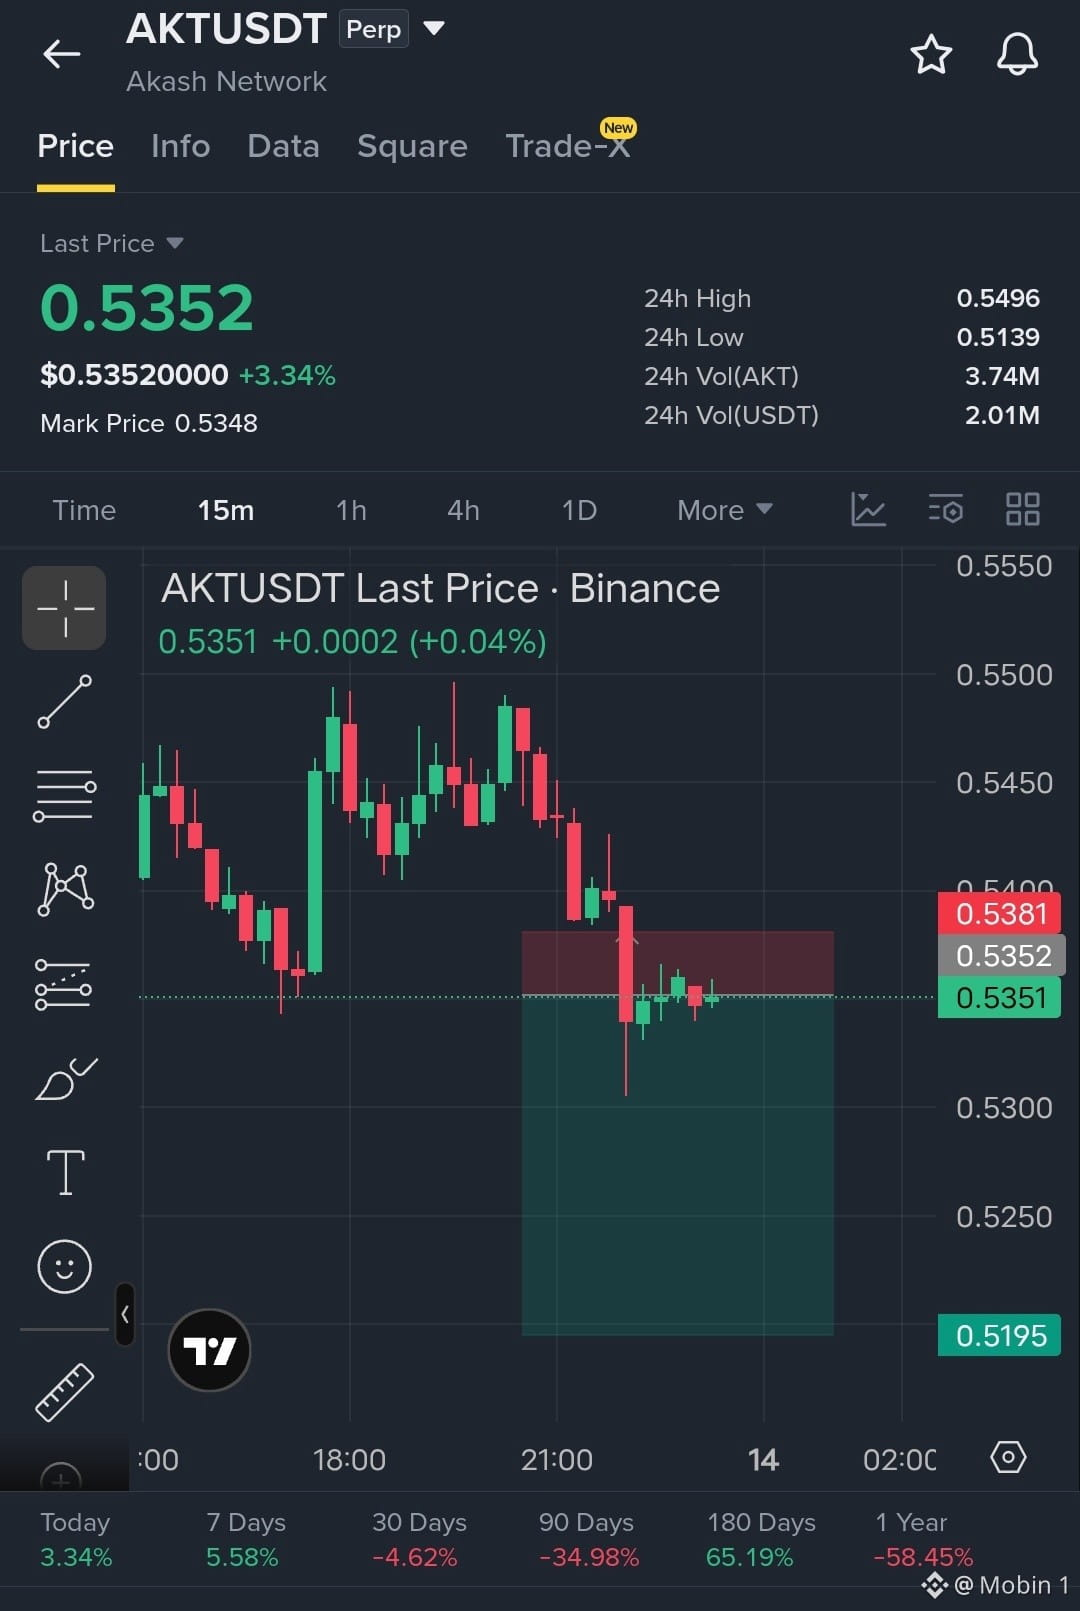
$AKT Short Sell Trade
Entry :
Target : 🎯 0.5250 - 🎯 0.5195
Stoploss : 🛑 0.5381
{future}(AKTUSDT)
$AKT Short Sell Trade
Entry :
Target : 🎯 0.5250 - 🎯 0.5195
Stoploss : 🛑 0.5381
Entry :
Target : 🎯 0.5250 - 🎯 0.5195
Stoploss : 🛑 0.5381
16
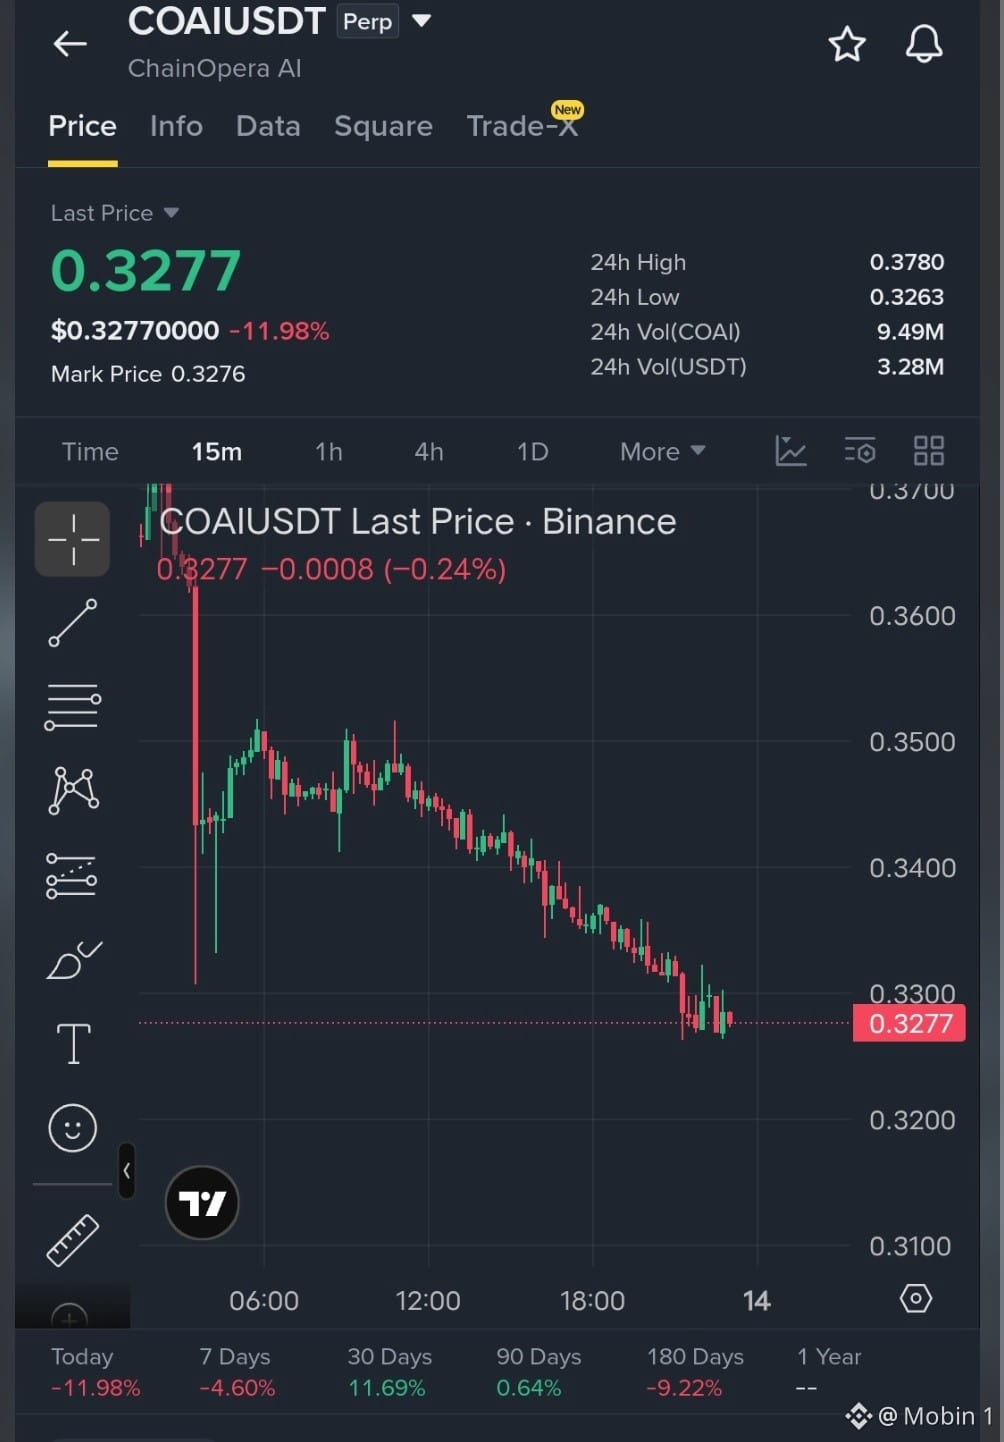
$COAI Strong short trade
Enter in Short Sell entry Safe
Target 1 : 0.3200
Target 2 : 0.3100
Set Stoploss : 0.3350
$COAI Strong short trade
Enter in Short Sell entry Safe
Target 1 : 0.3200
Target 2 : 0.3100
Set Stoploss : 0.3350
Enter in Short Sell entry Safe
Target 1 : 0.3200
Target 2 : 0.3100
Set Stoploss : 0.3350
260
·
--
බෙයාරිෂ්
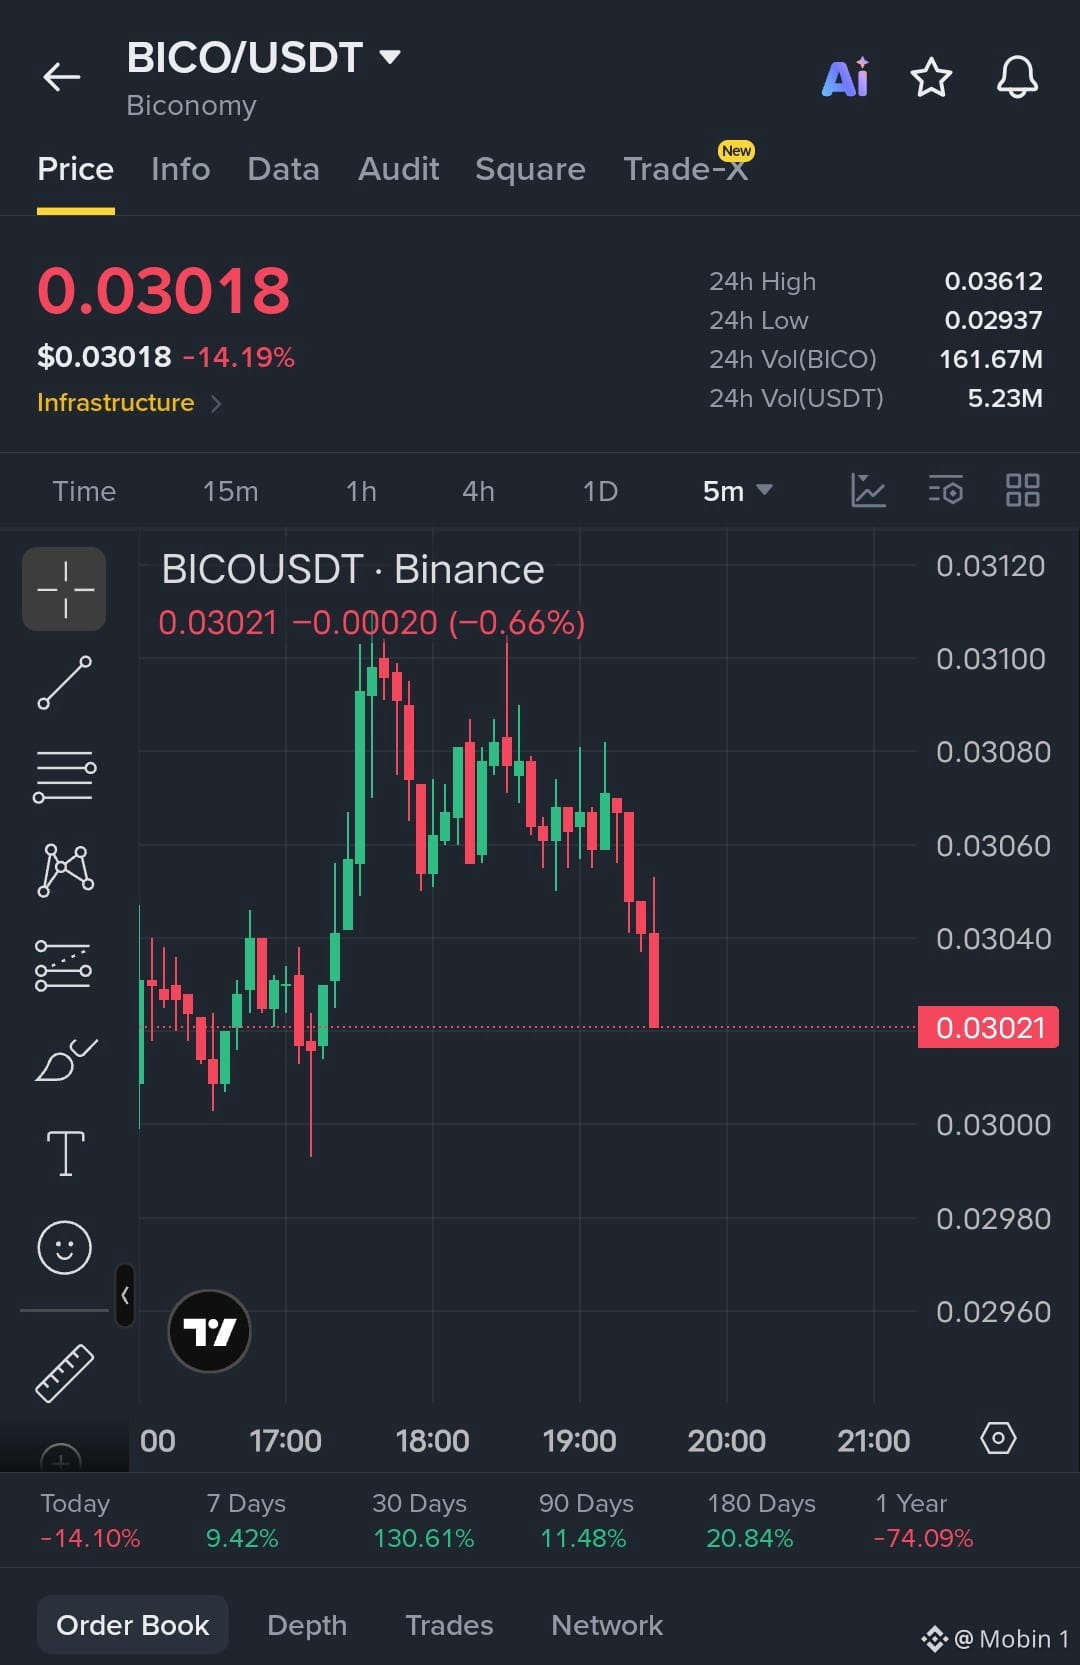
$BICO Strong Selling
Short this trade
Entry : 0.03040
Target : 0.02960
{future}(BICOUSDT)
$BICO Strong Selling
Short this trade
Entry : 0.03040
Target : 0.02960
Short this trade
Entry : 0.03040
Target : 0.02960
81
·
--
බෙයාරිෂ්
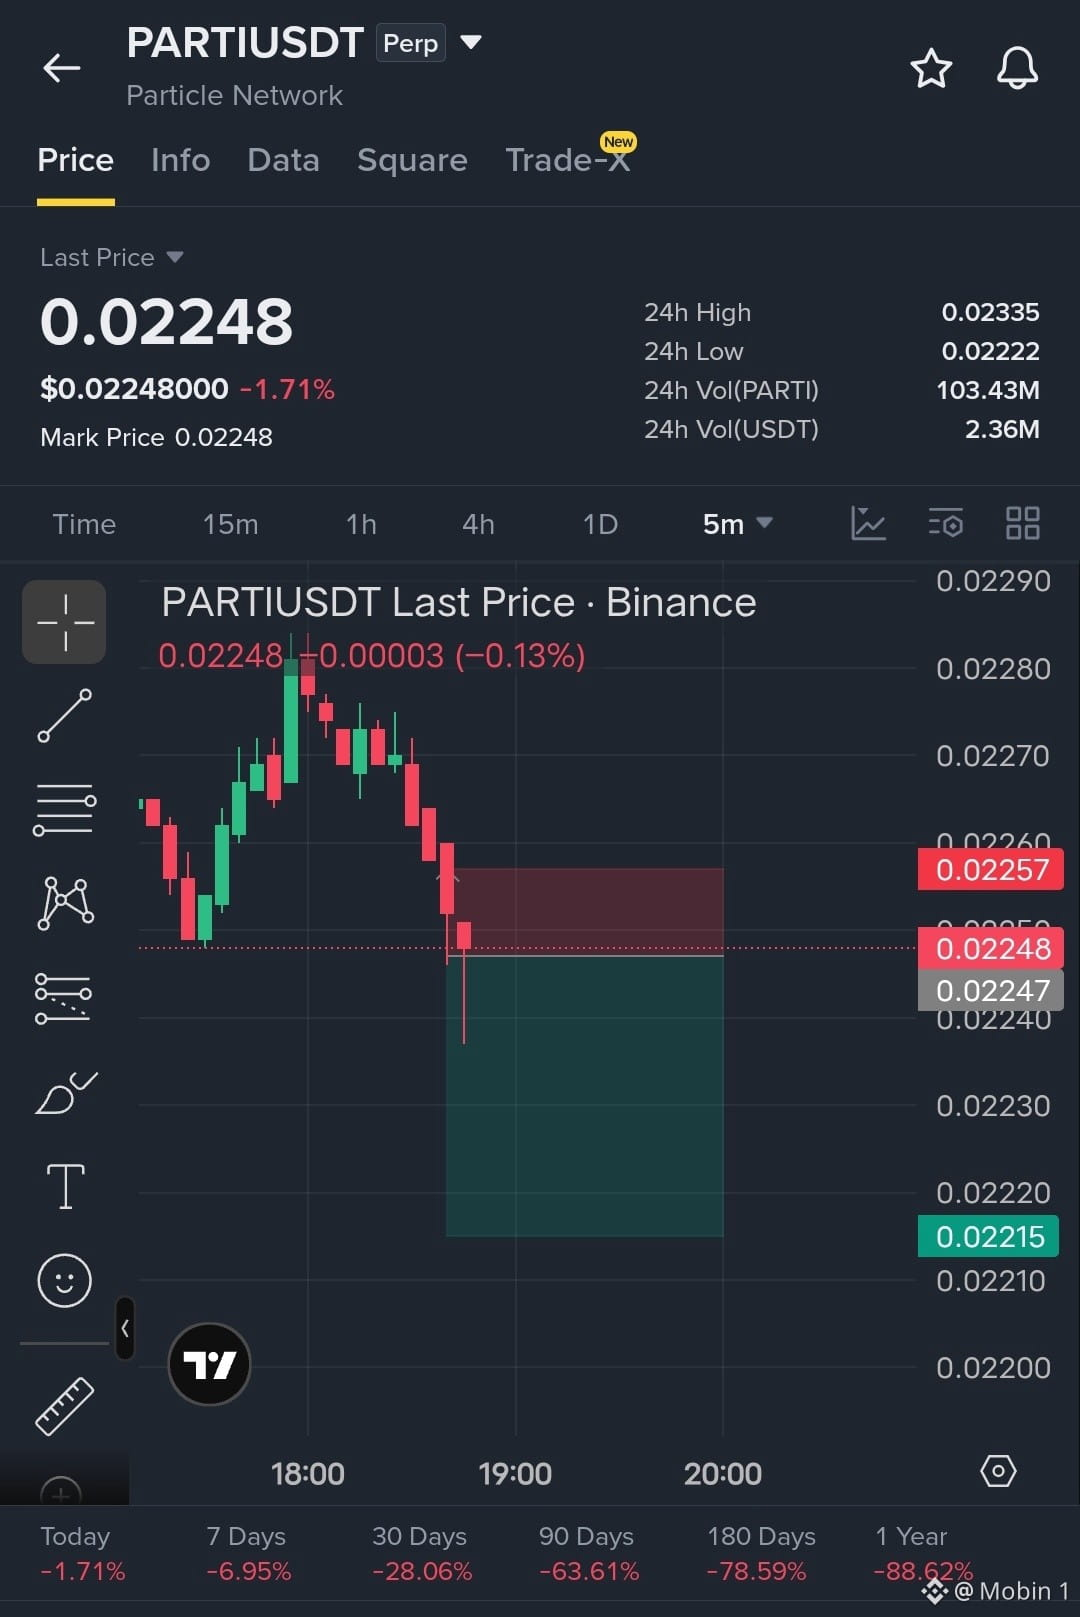
$PARTI Short Sell Trade
Target : 🎯 0.02215 - 0.02200
Stoploss : 0.02257
{future}(PARTIUSDT)
$PARTI Short Sell Trade
Target : 🎯 0.02215 - 0.02200
Stoploss : 0.02257
Target : 🎯 0.02215 - 0.02200
Stoploss : 0.02257
423
තවත් අන්තර්ගතයන් ගවේෂණය කිරීමට ඇතුල් වන්න
Binance චතුරශ්රය හි ගෝලීය ක්රිප්ටෝ පරිශීලකයින් හා එක්වන්න
⚡️ ක්රිප්ටෝ පිළිබඳ නවතම සහ ප්රයෝජනවත් තොරතුරු ලබා ගන්න.
💬 ලොව විශාලතම ක්රිප්ටෝ හුවමාරුව මගින් විශ්වාස කෙරේ.
👍 සත්යායනය කරන ලද නිර්මාණකරුවන්ගෙන් සැබෑ විදසුන් සොයා ගන්න.
විද්යුත් තැපෑල / දුරකථන අංකය
නැගී එන මාතෘකා
CryptoSelloffTriggersMultipleWhaleLiquidations
220,458 නැරඹීම්
1,939 සාකච්ඡා කරමින්
Crypto Liquidations Top $2B in 24 Hours as 329,000 Traders Are Wiped Out
Binance News
·40 කැමත්ත දැක්වීම්
·59.6k නැරඹීම්
USSpotXRPETFsSeeLargestWeeklyOutflowIn8Months
186,934 නැරඹීම්
1,638 සාකච්ඡා කරමින්
WillFOMCMinutesReinforceRateHikeExpectations?
62,792 නැරඹීම්
815 සාකච්ඡා කරමින්