
Leo524
720 පෝස්ටු

Leo524
වාර්තා කරන්න
පරිශීලක අවහිර කරන්න
👉Leo524 👈
Trade With Confidence ✔

{ටෝකන්} දරන්නා
අධි-සංඛ්යාත වෙළෙන්දා
{වේලාව} වසර
1 හඹා යමින්
1.4K+ හඹා යන්නන්
4.4K+ කැමති විය
පෝස්ටු
සියල්ල
උපුටා දැක්වීම්
වීඩියෝ
අමුණා ඇත
·
--
One week. One big milestone 📈💚
Proud of the progress we’ve made with LEO524. Seeing the account grow by 111%+ over the past week is a great feeling.
Every move comes with lessons, and every result reminds me why patience, discipline, and consistency matter.
Grateful for the journey. More work ahead, and we keep moving forward. 🚀
#CryptoTrading. g #tradingjourney #Leo524 #BinanceSquare #EarningsSeason
One week. One big milestone 📈💚
Proud of the progress we’ve made with LEO524. Seeing the account grow by 111%+ over the past week is a great feeling.
Every move comes with lessons, and every result reminds me why patience, discipline, and consistency matter.
Grateful for the journey. More work ahead, and we keep moving forward. 🚀
#CryptoTrading. g #tradingjourney #Leo524 #BinanceSquare #EarningsSeason
Proud of the progress we’ve made with LEO524. Seeing the account grow by 111%+ over the past week is a great feeling.
Every move comes with lessons, and every result reminds me why patience, discipline, and consistency matter.
Grateful for the journey. More work ahead, and we keep moving forward. 🚀
#CryptoTrading. g #tradingjourney #Leo524 #BinanceSquare #EarningsSeason
16
18
3.8k
·
--
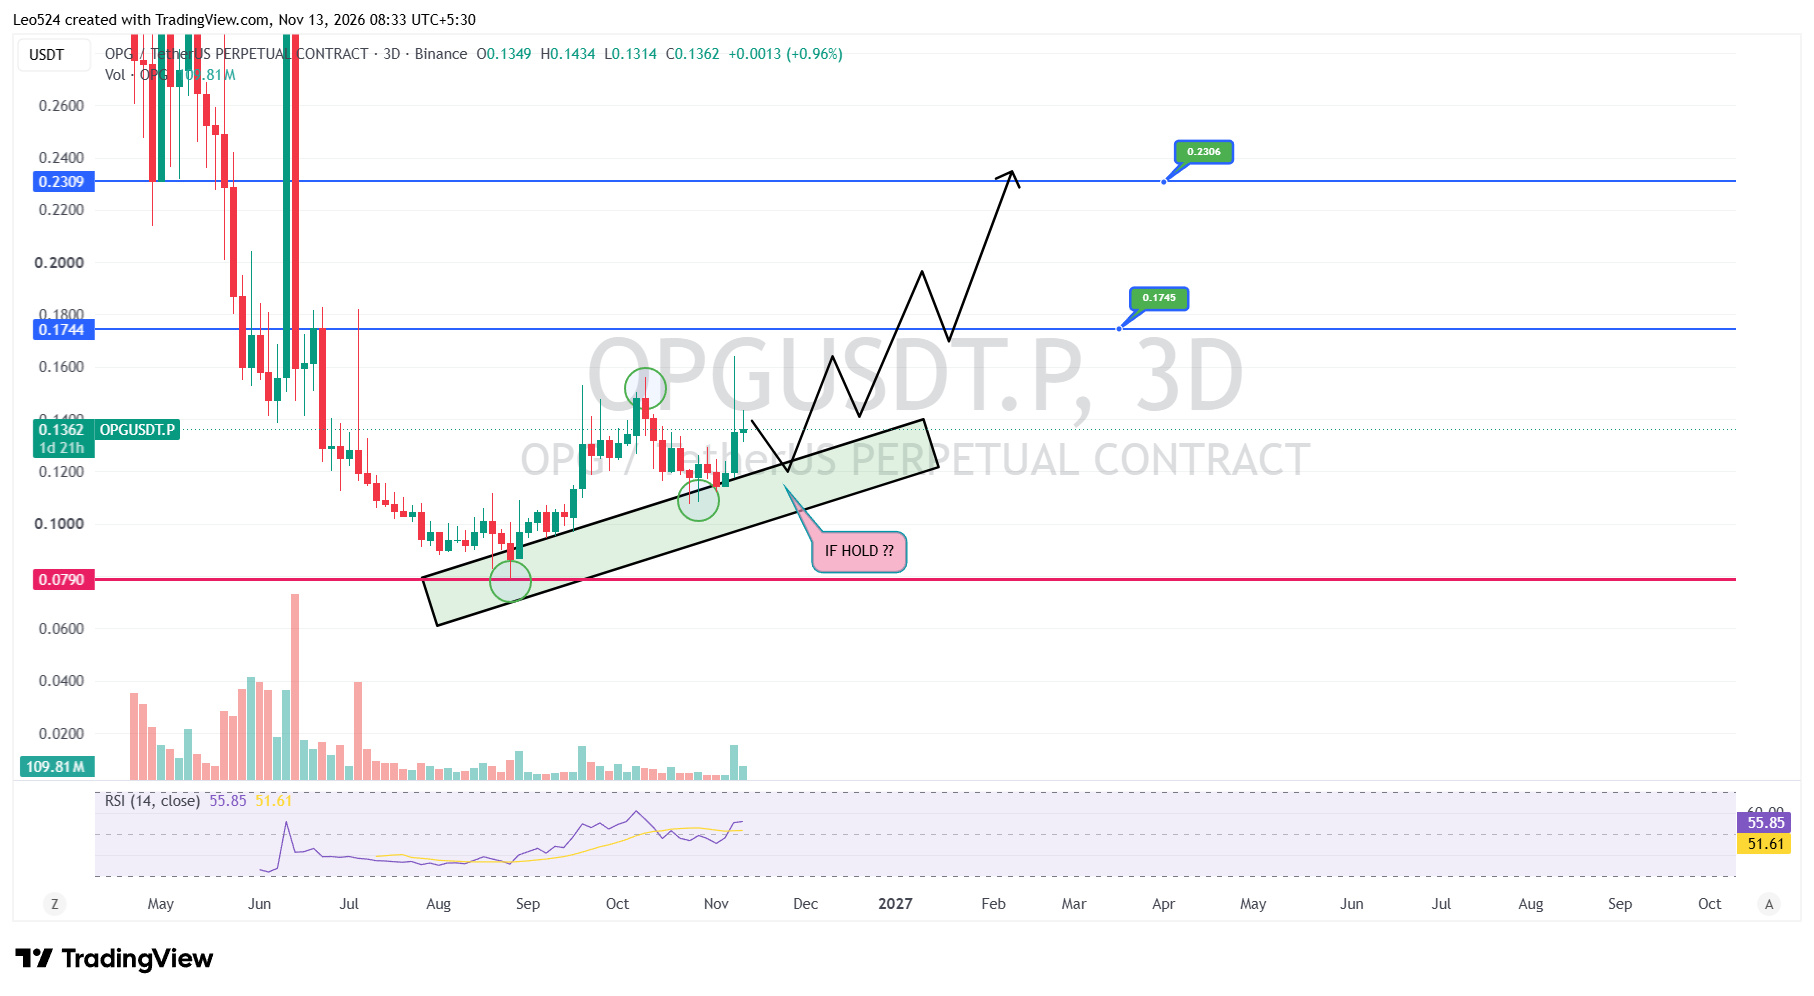
$OPG — Bullish Reversal Setup or Another Breakdown..?
$OPG is showing an interesting shift after an extended bearish trend. Price has started forming higher lows inside a rising support channel, suggesting buyers are gradually gaining control. The recent pullback is now testing this structure, making the rising support a critical level to watch.
If this support holds, OPG could continue its recovery toward $0.1745, with $0.2306 as the next major resistance. However, a confirmed bullish reversal still requires LTF confirmations, including bullish market structure and strong buying momentum.
The key is the rising support. As long as this structure remains intact, the bullish continuation scenario stays alive. A breakdown below it could invalidate the recovery setup and expose price to further downside.
Analysis by LEO524
#Crypto #CryptoTrading #LEO524
$OPG — Bullish Reversal Setup or Another Breakdown..?
$OPG is showing an interesting shift after an extended bearish trend. Price has started forming higher lows inside a rising support channel, suggesting buyers are gradually gaining control. The recent pullback is now testing this structure, making the rising support a critical level to watch.
If this support holds, OPG could continue its recovery toward $0.1745, with $0.2306 as the next major resistance. However, a confirmed bullish reversal still requires LTF confirmations, including bullish market structure and strong buying momentum.
The key is the rising support. As long as this structure remains intact, the bullish continuation scenario stays alive. A breakdown below it could invalidate the recovery setup and expose price to further downside.
Analysis by LEO524
#Crypto #CryptoTrading #LEO524
$OPG is showing an interesting shift after an extended bearish trend. Price has started forming higher lows inside a rising support channel, suggesting buyers are gradually gaining control. The recent pullback is now testing this structure, making the rising support a critical level to watch.
If this support holds, OPG could continue its recovery toward $0.1745, with $0.2306 as the next major resistance. However, a confirmed bullish reversal still requires LTF confirmations, including bullish market structure and strong buying momentum.
The key is the rising support. As long as this structure remains intact, the bullish continuation scenario stays alive. A breakdown below it could invalidate the recovery setup and expose price to further downside.
Analysis by LEO524
#Crypto #CryptoTrading #LEO524
1
1
375
·
--
$BTC IS FORMING A BULLISH REVERSAL?
Bitcoin is trading around $71.3K after an extended decline from $87K. Price is approaching an important support area, while RSI is deeply oversold. A potential rounded bottom suggests selling pressure could weaken if buyers step in.
A recovery could target $74.6K, $78.1K, and potentially $82.2K. However, the descending trendline remains a major obstacle for bulls.
LTF confirmation is key. A bullish CHoCH, strong displacement, and successful retest could confirm a potential reversal. Until then, $66.9K remains important downside support
#BTC80K #Leo524
$BTC IS FORMING A BULLISH REVERSAL?
Bitcoin is trading around $71.3K after an extended decline from $87K. Price is approaching an important support area, while RSI is deeply oversold. A potential rounded bottom suggests selling pressure could weaken if buyers step in.
A recovery could target $74.6K, $78.1K, and potentially $82.2K. However, the descending trendline remains a major obstacle for bulls.
LTF confirmation is key. A bullish CHoCH, strong displacement, and successful retest could confirm a potential reversal. Until then, $66.9K remains important downside support
#BTC80K #Leo524
Bitcoin is trading around $71.3K after an extended decline from $87K. Price is approaching an important support area, while RSI is deeply oversold. A potential rounded bottom suggests selling pressure could weaken if buyers step in.
A recovery could target $74.6K, $78.1K, and potentially $82.2K. However, the descending trendline remains a major obstacle for bulls.
LTF confirmation is key. A bullish CHoCH, strong displacement, and successful retest could confirm a potential reversal. Until then, $66.9K remains important downside support
#BTC80K #Leo524
248
·
--
උසබ තත්ත්වය
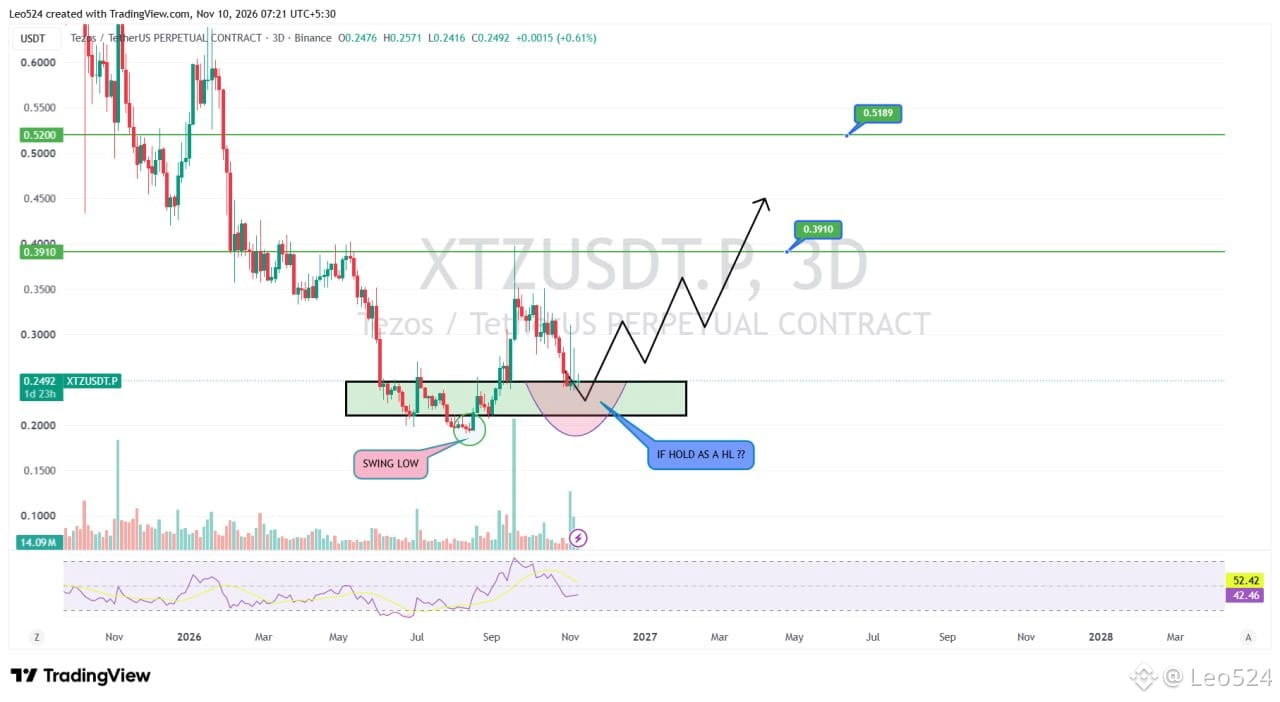
$XTZ: Is This the Beginning of a Major Recovery?
XTZ is approaching a critical demand zone around $0.21–$0.25 after an extended downtrend. This area previously attracted strong buying pressure and triggered a significant recovery. Now price is returning to the same zone, creating an interesting opportunity for a potential bullish reversal. The current reaction could become an important turning point for XTZ.
If buyers successfully defend this zone and start building higher lows, XTZ could gradually shift its market structure toward the bullish side. A recovery toward $0.3910 would be the first major upside objective, while a stronger breakout could potentially open the path toward $0.5189. The key is how price develops from the current demand area.
The bigger picture is becoming interesting. XTZ is testing a zone where a new bullish structure could begin developing. If this demand area continues holding and bullish confirmation appears, the next recovery could become much more significant. This is a zone worth watching closely. 👀
#LEO524 #XTZ
Analysis by LEO524
$XTZ: Is This the Beginning of a Major Recovery?
XTZ is approaching a critical demand zone around $0.21–$0.25 after an extended downtrend. This area previously attracted strong buying pressure and triggered a significant recovery. Now price is returning to the same zone, creating an interesting opportunity for a potential bullish reversal. The current reaction could become an important turning point for XTZ.
If buyers successfully defend this zone and start building higher lows, XTZ could gradually shift its market structure toward the bullish side. A recovery toward $0.3910 would be the first major upside objective, while a stronger breakout could potentially open the path toward $0.5189. The key is how price develops from the current demand area.
The bigger picture is becoming interesting. XTZ is testing a zone where a new bullish structure could begin developing. If this demand area continues holding and bullish confirmation appears, the next recovery could become much more significant. This is a zone worth watching closely. 👀
#LEO524 #XTZ
Analysis by LEO524
XTZ is approaching a critical demand zone around $0.21–$0.25 after an extended downtrend. This area previously attracted strong buying pressure and triggered a significant recovery. Now price is returning to the same zone, creating an interesting opportunity for a potential bullish reversal. The current reaction could become an important turning point for XTZ.
If buyers successfully defend this zone and start building higher lows, XTZ could gradually shift its market structure toward the bullish side. A recovery toward $0.3910 would be the first major upside objective, while a stronger breakout could potentially open the path toward $0.5189. The key is how price develops from the current demand area.
The bigger picture is becoming interesting. XTZ is testing a zone where a new bullish structure could begin developing. If this demand area continues holding and bullish confirmation appears, the next recovery could become much more significant. This is a zone worth watching closely. 👀
#LEO524 #XTZ
Analysis by LEO524
315
·
--
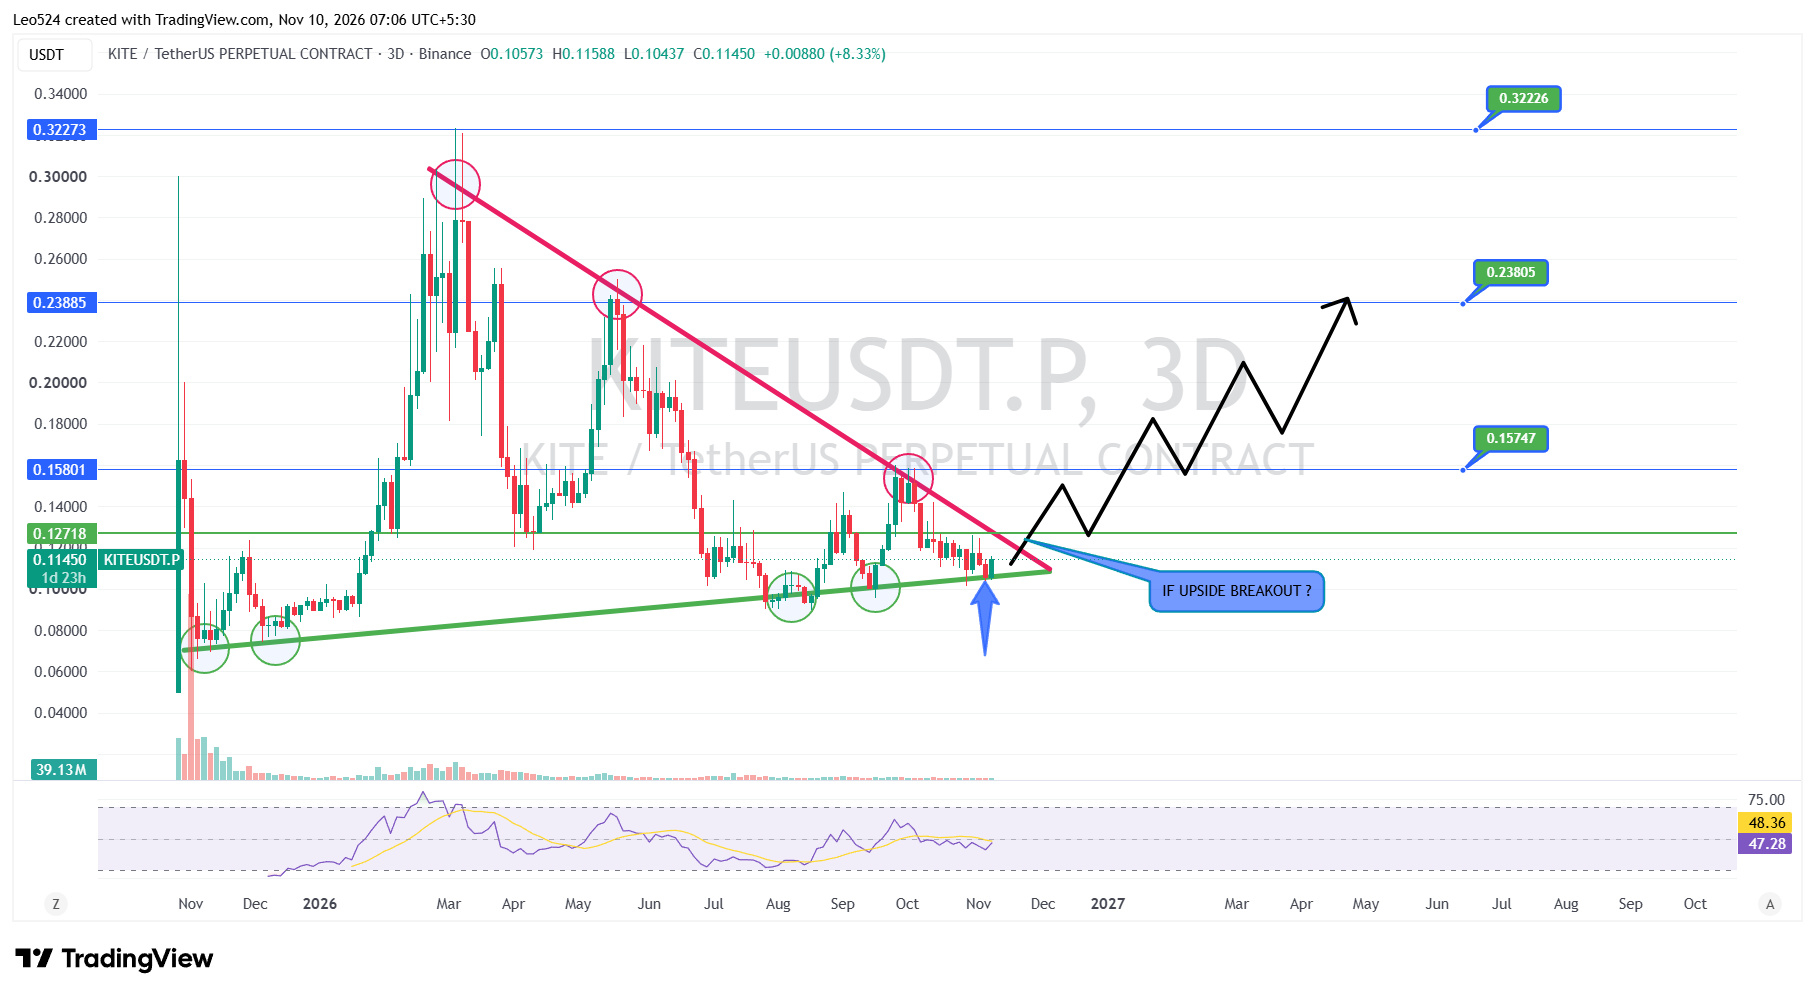
$KITE: Is a Major Breakout Finally Coming..?
$KITE is approaching a critical point on the 3D chart. After months of lower highs, price is now compressing between a rising support trendline and a descending resistance trendline. This creates a clear triangle structure, and the market is getting closer to a major decision. Buyers are defending the lower zone, but the descending resistance remains the biggest obstacle.
Bullish Scenario: If KITE breaks above the descending trendline and holds above $0.12718, the next important resistance levels are $0.15801 and $0.23885. A strong breakout with volume could open the door for a much larger recovery toward $0.32273.
Bearish Scenario:If price loses the rising support trendline and breaks below the $0.09–$0.10 region, the current structure could fail. Buyers may lose control, leading to another downside move and a possible retest of previous lows. Until a confirmed breakout happens, both scenarios remain on the table.
#Crypto #CryptoTrading #LEO524
$KITE : Is a Major Breakout Finally Coming..?
$KITE is approaching a critical point on the 3D chart. After months of lower highs, price is now compressing between a rising support trendline and a descending resistance trendline. This creates a clear triangle structure, and the market is getting closer to a major decision. Buyers are defending the lower zone, but the descending resistance remains the biggest obstacle.
Bullish Scenario: If KITE breaks above the descending trendline and holds above $0.12718, the next important resistance levels are $0.15801 and $0.23885. A strong breakout with volume could open the door for a much larger recovery toward $0.32273.
Bearish Scenario:If price loses the rising support trendline and breaks below the $0.09–$0.10 region, the current structure could fail. Buyers may lose control, leading to another downside move and a possible retest of previous lows. Until a confirmed breakout happens, both scenarios remain on the table.
#Crypto #CryptoTrading #LEO524
$KITE is approaching a critical point on the 3D chart. After months of lower highs, price is now compressing between a rising support trendline and a descending resistance trendline. This creates a clear triangle structure, and the market is getting closer to a major decision. Buyers are defending the lower zone, but the descending resistance remains the biggest obstacle.
Bullish Scenario: If KITE breaks above the descending trendline and holds above $0.12718, the next important resistance levels are $0.15801 and $0.23885. A strong breakout with volume could open the door for a much larger recovery toward $0.32273.
Bearish Scenario:If price loses the rising support trendline and breaks below the $0.09–$0.10 region, the current structure could fail. Buyers may lose control, leading to another downside move and a possible retest of previous lows. Until a confirmed breakout happens, both scenarios remain on the table.
#Crypto #CryptoTrading #LEO524
344
·
--
උසබ තත්ත්වය
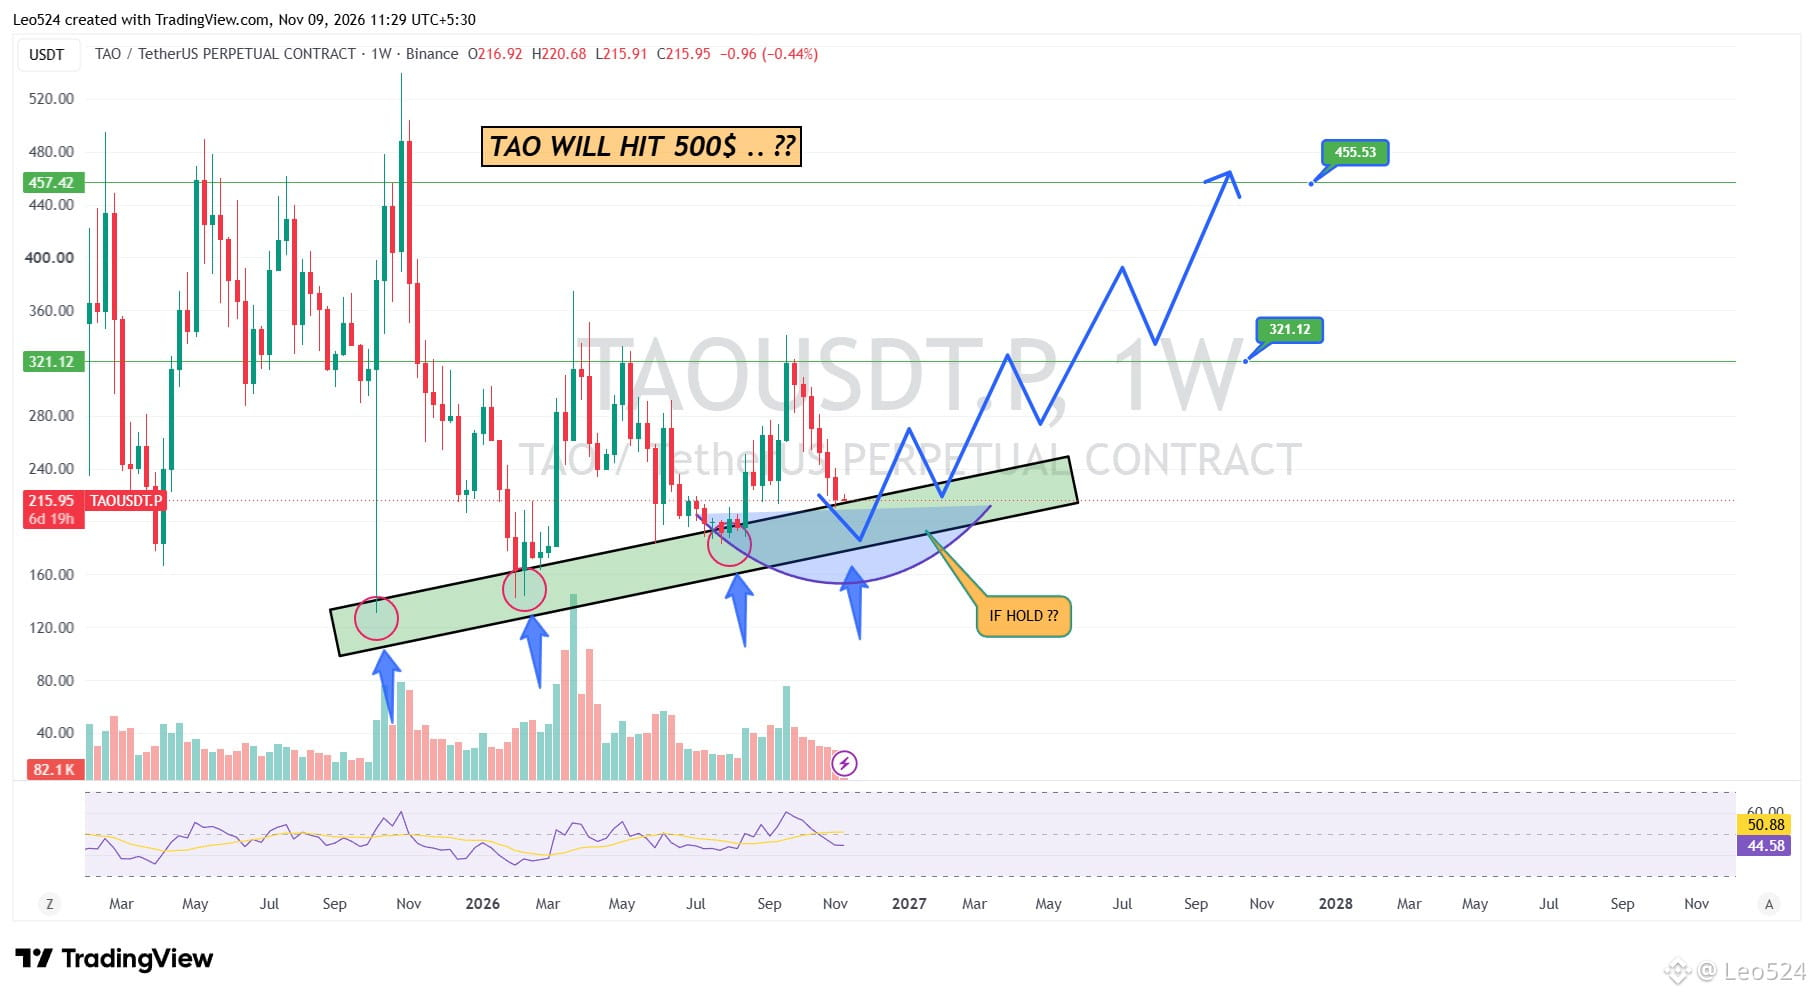
$TAO TO $500? THE BIG MOVE MAY BE COMING ..?
TAO is still moving inside a long-term ascending channel on the weekly chart. Every major drop into the lower part of this channel has attracted buyers, and price is now testing another important area around $180–$200. This zone could become a strong base if buyers continue to defend it.
If this support holds and TAO starts building bullish momentum, the first major resistance is around $321, followed by $455. A breakout above these levels could open the door toward the $500 area. But first, we need to see a strong recovery and confirmation from the weekly structure.
#TAO #bittensor r #crypto #Leo524
Analysis by LEO524
$TAO TO $500? THE BIG MOVE MAY BE COMING ..?
TAO is still moving inside a long-term ascending channel on the weekly chart. Every major drop into the lower part of this channel has attracted buyers, and price is now testing another important area around $180–$200. This zone could become a strong base if buyers continue to defend it.
If this support holds and TAO starts building bullish momentum, the first major resistance is around $321, followed by $455. A breakout above these levels could open the door toward the $500 area. But first, we need to see a strong recovery and confirmation from the weekly structure.
#TAO #bittensor r #crypto #Leo524
Analysis by LEO524
TAO is still moving inside a long-term ascending channel on the weekly chart. Every major drop into the lower part of this channel has attracted buyers, and price is now testing another important area around $180–$200. This zone could become a strong base if buyers continue to defend it.
If this support holds and TAO starts building bullish momentum, the first major resistance is around $321, followed by $455. A breakout above these levels could open the door toward the $500 area. But first, we need to see a strong recovery and confirmation from the weekly structure.
#TAO #bittensor r #crypto #Leo524
Analysis by LEO524
2
6
6.5k
·
--
The market is not stable right now. Please avoid trading in these conditions and protect your capital. Don't risk losing your hard-earned money. For now, just watch the market and wait for better opportunities. Stay safe. ❤️
The market is not stable right now. Please avoid trading in these conditions and protect your capital. Don't risk losing your hard-earned money. For now, just watch the market and wait for better opportunities. Stay safe. ❤️
1
3
376
·
--
උසබ තත්ත්වය
$ZEC I never take guess entries. I wait for the right time, proper confirmation, and a clear setup before entering a trade. Patience is part of my strategy. I always wait for the right moment and take my entry at the right place 💸💸
$ZEC I never take guess entries. I wait for the right time, proper confirmation, and a clear setup before entering a trade. Patience is part of my strategy. I always wait for the right moment and take my entry at the right place 💸💸
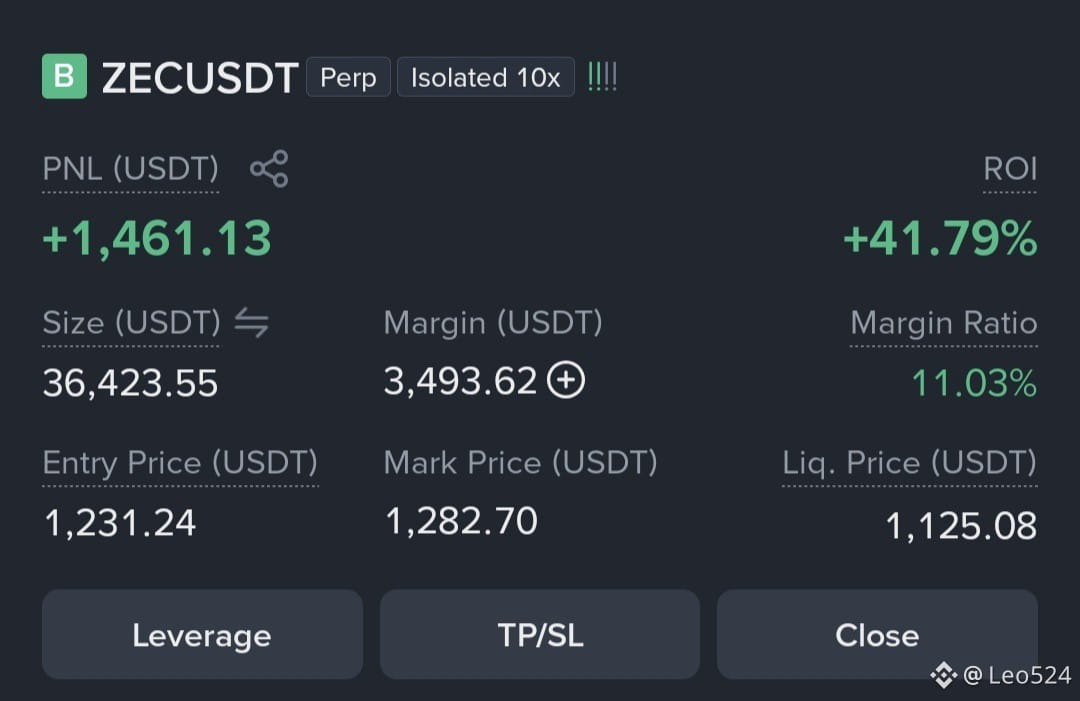
Leo524
·
--
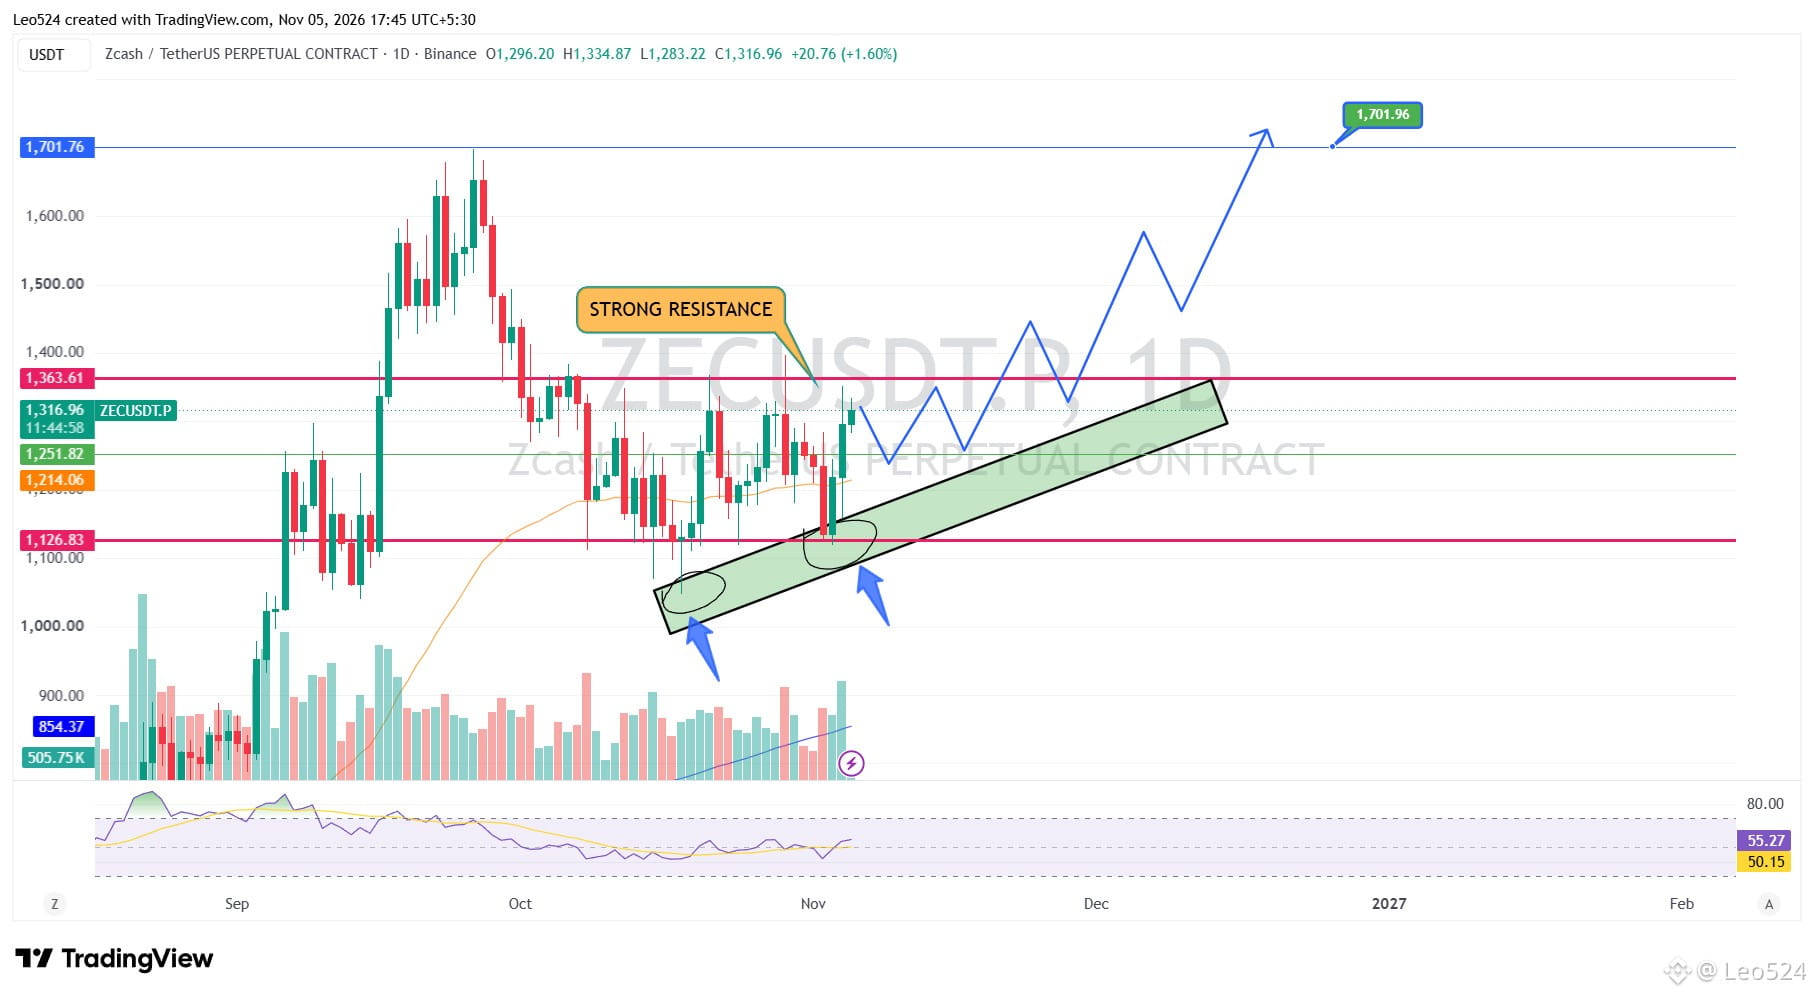
උසබ තත්ත්වය$ZEC Is This the Beginning of a Major Breakout ..?
Zcash is showing some interesting price action on the daily chart. After the massive rally and the recent correction, price has started building a structure inside an ascending channel. Buyers are defending the rising support zone, and we're seeing another attempt to push the market higher.
The $1,363 area remains a strong resistance level. If bulls can break above this level and hold it as support, the next major challenge sits around $1,700. A clean breakout above that level could open the door for another significant upside move.
For now, I'm watching how price reacts around the ascending support and the $1,363 resistance. As long as buyers continue defending this structure, the bullish scenario remains interesting. However, losing the channel support could change the entire picture.
#Crypto #CryptoTrading #LEO524 #ZEC
Zcash is showing some interesting price action on the daily chart. After the massive rally and the recent correction, price has started building a structure inside an ascending channel. Buyers are defending the rising support zone, and we're seeing another attempt to push the market higher.
The $1,363 area remains a strong resistance level. If bulls can break above this level and hold it as support, the next major challenge sits around $1,700. A clean breakout above that level could open the door for another significant upside move.
For now, I'm watching how price reacts around the ascending support and the $1,363 resistance. As long as buyers continue defending this structure, the bullish scenario remains interesting. However, losing the channel support could change the entire picture.
#Crypto #CryptoTrading #LEO524 #ZEC
1
6
3.1k
·
--
උසබ තත්ත්වය
$BTC AT A CRITICAL SUPPORT — BOUNCE OR ANOTHER LEG DOWN ..?
Bitcoin is approaching a major daily support zone around $74.5K–$76K after facing strong rejection from the $87K region. The market structure remains bearish, with lower highs forming along a strong descending trendline. Sellers are still controlling the momentum, and RSI is showing weakness.
I'm closely watching this daily support zone because it could become an important turning point. If buyers successfully defend this area and start building bullish structure, BTC could attempt a recovery toward $81K, followed by $84K. However, these resistance levels must be reclaimed before expecting a stronger bullish move.
If daily support fails to hold, the market could face another wave of downside pressure. For now, this is a critical zone where BTC needs to prove that buyers are still present. The next reaction here could determine the direction of the coming move.
#crypto #cryptotrading #Leo524 #BTC
$BTC AT A CRITICAL SUPPORT — BOUNCE OR ANOTHER LEG DOWN ..?
Bitcoin is approaching a major daily support zone around $74.5K–$76K after facing strong rejection from the $87K region. The market structure remains bearish, with lower highs forming along a strong descending trendline. Sellers are still controlling the momentum, and RSI is showing weakness.
I'm closely watching this daily support zone because it could become an important turning point. If buyers successfully defend this area and start building bullish structure, BTC could attempt a recovery toward $81K, followed by $84K. However, these resistance levels must be reclaimed before expecting a stronger bullish move.
If daily support fails to hold, the market could face another wave of downside pressure. For now, this is a critical zone where BTC needs to prove that buyers are still present. The next reaction here could determine the direction of the coming move.
#crypto #cryptotrading #Leo524 #BTC
Bitcoin is approaching a major daily support zone around $74.5K–$76K after facing strong rejection from the $87K region. The market structure remains bearish, with lower highs forming along a strong descending trendline. Sellers are still controlling the momentum, and RSI is showing weakness.
I'm closely watching this daily support zone because it could become an important turning point. If buyers successfully defend this area and start building bullish structure, BTC could attempt a recovery toward $81K, followed by $84K. However, these resistance levels must be reclaimed before expecting a stronger bullish move.
If daily support fails to hold, the market could face another wave of downside pressure. For now, this is a critical zone where BTC needs to prove that buyers are still present. The next reaction here could determine the direction of the coming move.
#crypto #cryptotrading #Leo524 #BTC
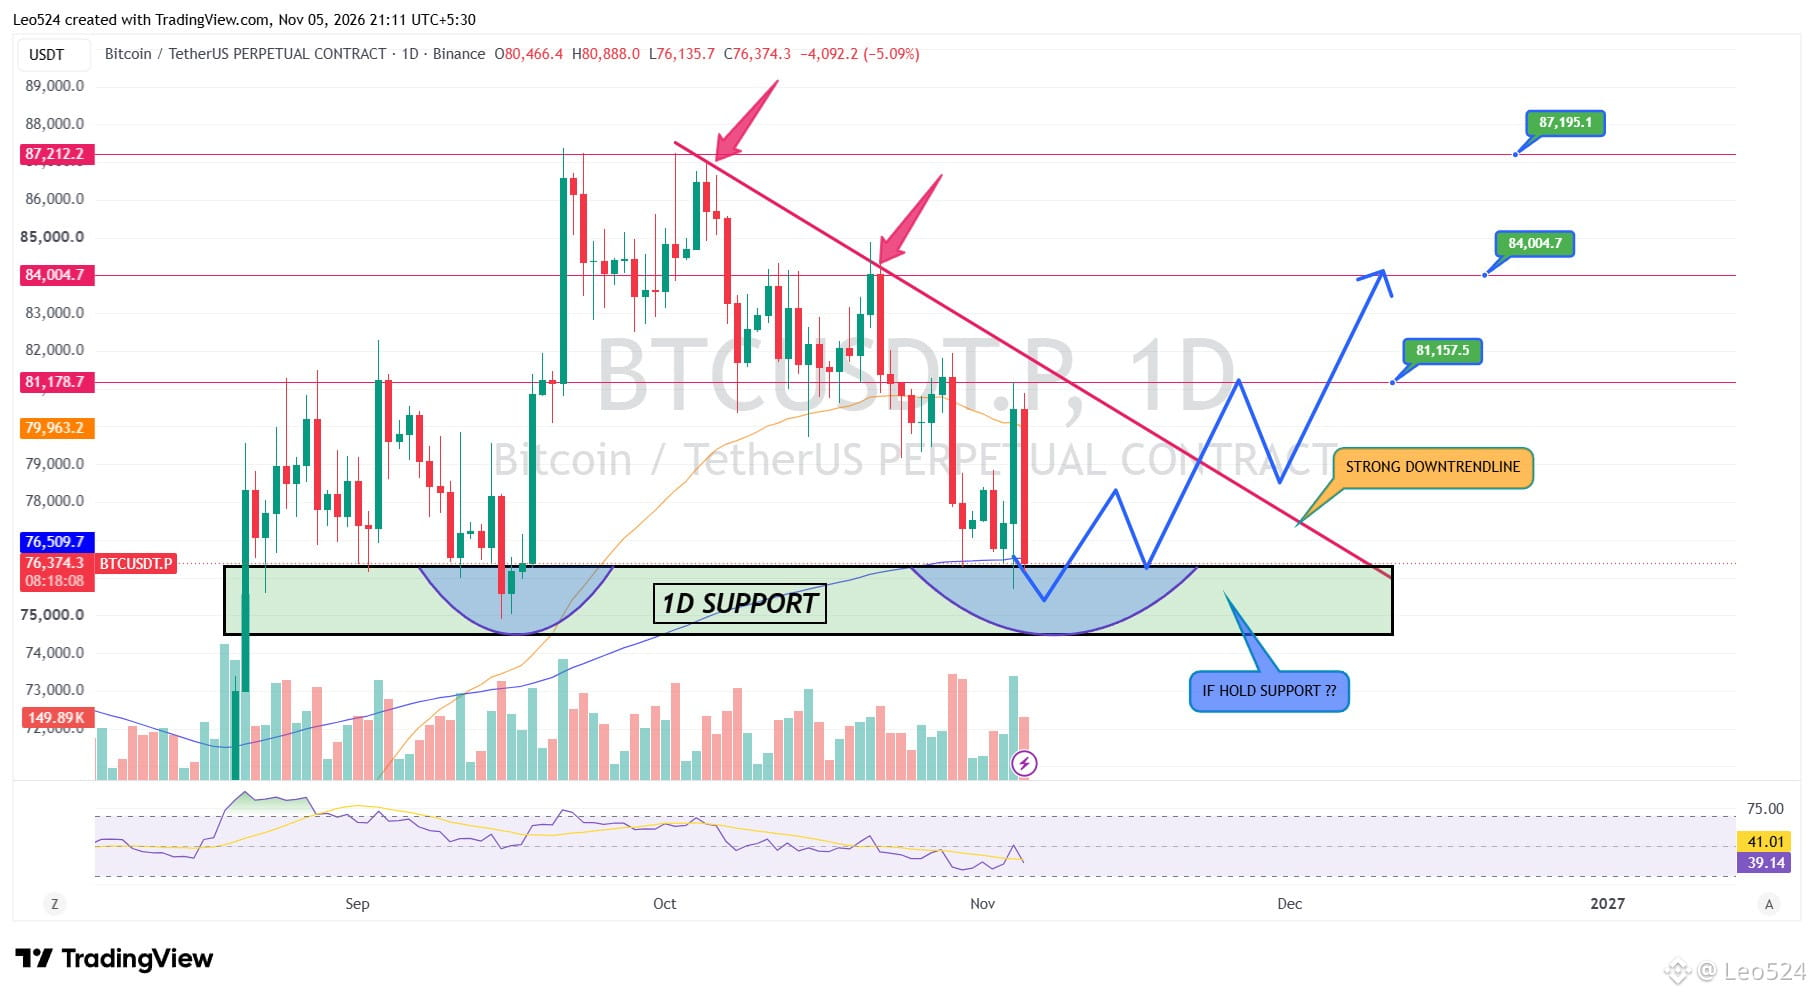
2
281
·
--
උසබ තත්ත්වය
$ZEC Is This the Beginning of a Major Breakout ..?
Zcash is showing some interesting price action on the daily chart. After the massive rally and the recent correction, price has started building a structure inside an ascending channel. Buyers are defending the rising support zone, and we're seeing another attempt to push the market higher.
The $1,363 area remains a strong resistance level. If bulls can break above this level and hold it as support, the next major challenge sits around $1,700. A clean breakout above that level could open the door for another significant upside move.
For now, I'm watching how price reacts around the ascending support and the $1,363 resistance. As long as buyers continue defending this structure, the bullish scenario remains interesting. However, losing the channel support could change the entire picture.
#Crypto #CryptoTrading #LEO524 #ZEC
$ZEC Is This the Beginning of a Major Breakout ..?
Zcash is showing some interesting price action on the daily chart. After the massive rally and the recent correction, price has started building a structure inside an ascending channel. Buyers are defending the rising support zone, and we're seeing another attempt to push the market higher.
The $1,363 area remains a strong resistance level. If bulls can break above this level and hold it as support, the next major challenge sits around $1,700. A clean breakout above that level could open the door for another significant upside move.
For now, I'm watching how price reacts around the ascending support and the $1,363 resistance. As long as buyers continue defending this structure, the bullish scenario remains interesting. However, losing the channel support could change the entire picture.
#Crypto #CryptoTrading #LEO524 #ZEC
Zcash is showing some interesting price action on the daily chart. After the massive rally and the recent correction, price has started building a structure inside an ascending channel. Buyers are defending the rising support zone, and we're seeing another attempt to push the market higher.
The $1,363 area remains a strong resistance level. If bulls can break above this level and hold it as support, the next major challenge sits around $1,700. A clean breakout above that level could open the door for another significant upside move.
For now, I'm watching how price reacts around the ascending support and the $1,363 resistance. As long as buyers continue defending this structure, the bullish scenario remains interesting. However, losing the channel support could change the entire picture.
#Crypto #CryptoTrading #LEO524 #ZEC
1
3
1.6k
·
--
උසබ තත්ත්වය
$TIA A POTENTIAL BULLISH REVERSAL OR ANOTHER LEG DOWN ..?
TIA is currently testing a major support zone around $0.41–$0.45. On the daily chart, we can see a potential Harmonic Pattern structure forming, with price completing the BC leg and approaching the possible D point. This zone is particularly important because it could determine whether TIA gets another opportunity for a bullish recovery.
The pattern itself doesn't guarantee a reversal. If this support zone holds and buyers manage to defend it, we could see a recovery toward $0.553 and potentially $0.687. However, if TIA loses this support with a strong daily close below the zone, the bullish setup becomes invalid, and further downside remains possible.
#tia #crypto #Leo524
#CryptoTrading
{spot}(TIAUSDT)
$TIA A POTENTIAL BULLISH REVERSAL OR ANOTHER LEG DOWN ..?
TIA is currently testing a major support zone around $0.41–$0.45. On the daily chart, we can see a potential Harmonic Pattern structure forming, with price completing the BC leg and approaching the possible D point. This zone is particularly important because it could determine whether TIA gets another opportunity for a bullish recovery.
The pattern itself doesn't guarantee a reversal. If this support zone holds and buyers manage to defend it, we could see a recovery toward $0.553 and potentially $0.687. However, if TIA loses this support with a strong daily close below the zone, the bullish setup becomes invalid, and further downside remains possible.
#tia #crypto #Leo524
#CryptoTrading
TIA is currently testing a major support zone around $0.41–$0.45. On the daily chart, we can see a potential Harmonic Pattern structure forming, with price completing the BC leg and approaching the possible D point. This zone is particularly important because it could determine whether TIA gets another opportunity for a bullish recovery.
The pattern itself doesn't guarantee a reversal. If this support zone holds and buyers manage to defend it, we could see a recovery toward $0.553 and potentially $0.687. However, if TIA loses this support with a strong daily close below the zone, the bullish setup becomes invalid, and further downside remains possible.
#tia #crypto #Leo524
#CryptoTrading
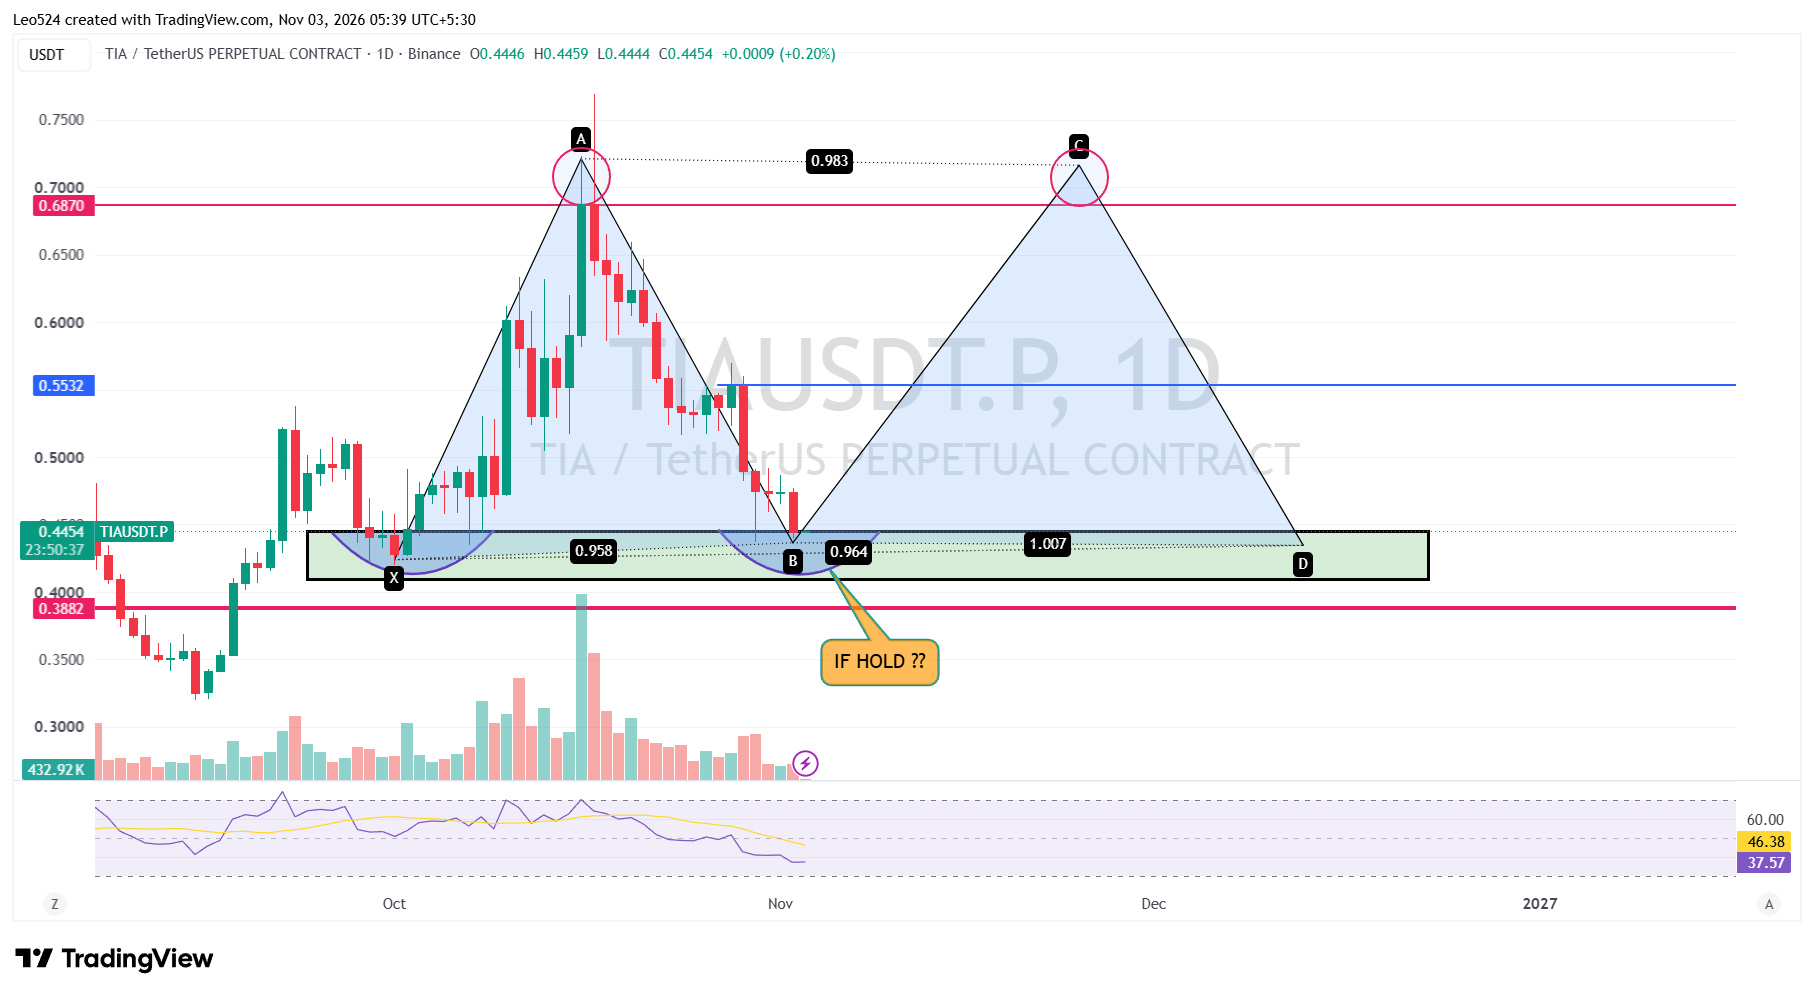
3
2.3k
·
--
$BTC TO $160K? I'M PLAYING THE BIGGER PICTURE.
Bitcoin is still holding inside an important support zone, and personally, I'm looking at this as a potential accumulation opportunity.
My BTC buying zone starts around $77K and extends down to $68K. I'm gradually accumulating spot across this range, with $72K and $68K being important levels where I'm prepared to add more.
Looking at the bigger picture, I believe BTC has the potential for a major recovery, with $160K as my long-term target.
I'm accumulating, not chasing. Let's see what happens.
#bitcoin #BTC #Leo524
$BTC TO $160K? I'M PLAYING THE BIGGER PICTURE.
Bitcoin is still holding inside an important support zone, and personally, I'm looking at this as a potential accumulation opportunity.
My BTC buying zone starts around $77K and extends down to $68K. I'm gradually accumulating spot across this range, with $72K and $68K being important levels where I'm prepared to add more.
Looking at the bigger picture, I believe BTC has the potential for a major recovery, with $160K as my long-term target.
I'm accumulating, not chasing. Let's see what happens.
#bitcoin #BTC #Leo524
Bitcoin is still holding inside an important support zone, and personally, I'm looking at this as a potential accumulation opportunity.
My BTC buying zone starts around $77K and extends down to $68K. I'm gradually accumulating spot across this range, with $72K and $68K being important levels where I'm prepared to add more.
Looking at the bigger picture, I believe BTC has the potential for a major recovery, with $160K as my long-term target.
I'm accumulating, not chasing. Let's see what happens.
#bitcoin #BTC #Leo524
7
1
186
99.7k
·
--
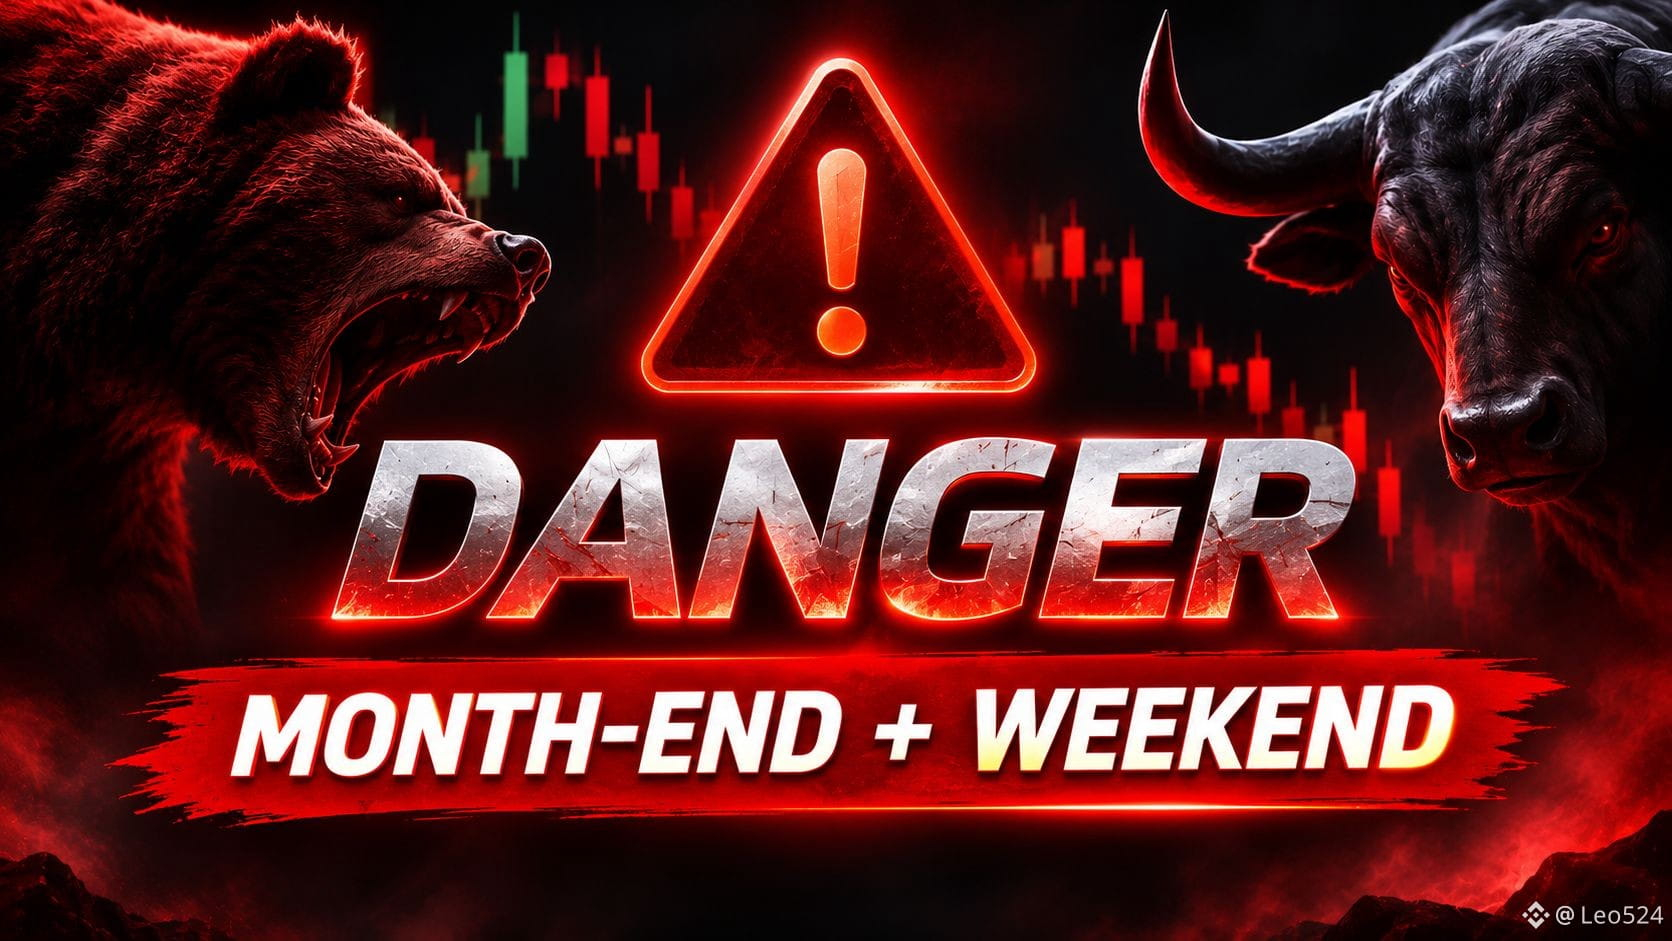
MONTH-END + WEEKEND — BE CAREFUL WITH THE MARKET!
Today marks the end of the month, and we are also heading into the weekend. This is a period where market movements can become unpredictable, and liquidity hunts are very possible.
Large players may take advantage of lower weekend liquidity to push prices in either direction, trigger stop losses, sweep liquidity levels, and create sudden moves that can trap both long and short traders.
Don't rush into trades just because you see a sudden breakout or breakdown. Some of these moves may look like real market direction but could simply be liquidity grabs before the market makes its actual move.
My advice : Stay away from unnecessary trades and focus on watching the market until Monday.
#Crypto #CryptoTrading #LEO524
MONTH-END + WEEKEND — BE CAREFUL WITH THE MARKET!
Today marks the end of the month, and we are also heading into the weekend. This is a period where market movements can become unpredictable, and liquidity hunts are very possible.
Large players may take advantage of lower weekend liquidity to push prices in either direction, trigger stop losses, sweep liquidity levels, and create sudden moves that can trap both long and short traders.
Don't rush into trades just because you see a sudden breakout or breakdown. Some of these moves may look like real market direction but could simply be liquidity grabs before the market makes its actual move.
My advice : Stay away from unnecessary trades and focus on watching the market until Monday.
#Crypto #CryptoTrading #LEO524
Today marks the end of the month, and we are also heading into the weekend. This is a period where market movements can become unpredictable, and liquidity hunts are very possible.
Large players may take advantage of lower weekend liquidity to push prices in either direction, trigger stop losses, sweep liquidity levels, and create sudden moves that can trap both long and short traders.
Don't rush into trades just because you see a sudden breakout or breakdown. Some of these moves may look like real market direction but could simply be liquidity grabs before the market makes its actual move.
My advice : Stay away from unnecessary trades and focus on watching the market until Monday.
#Crypto #CryptoTrading #LEO524
1
4
567
·
--
බෙයාරිෂ්
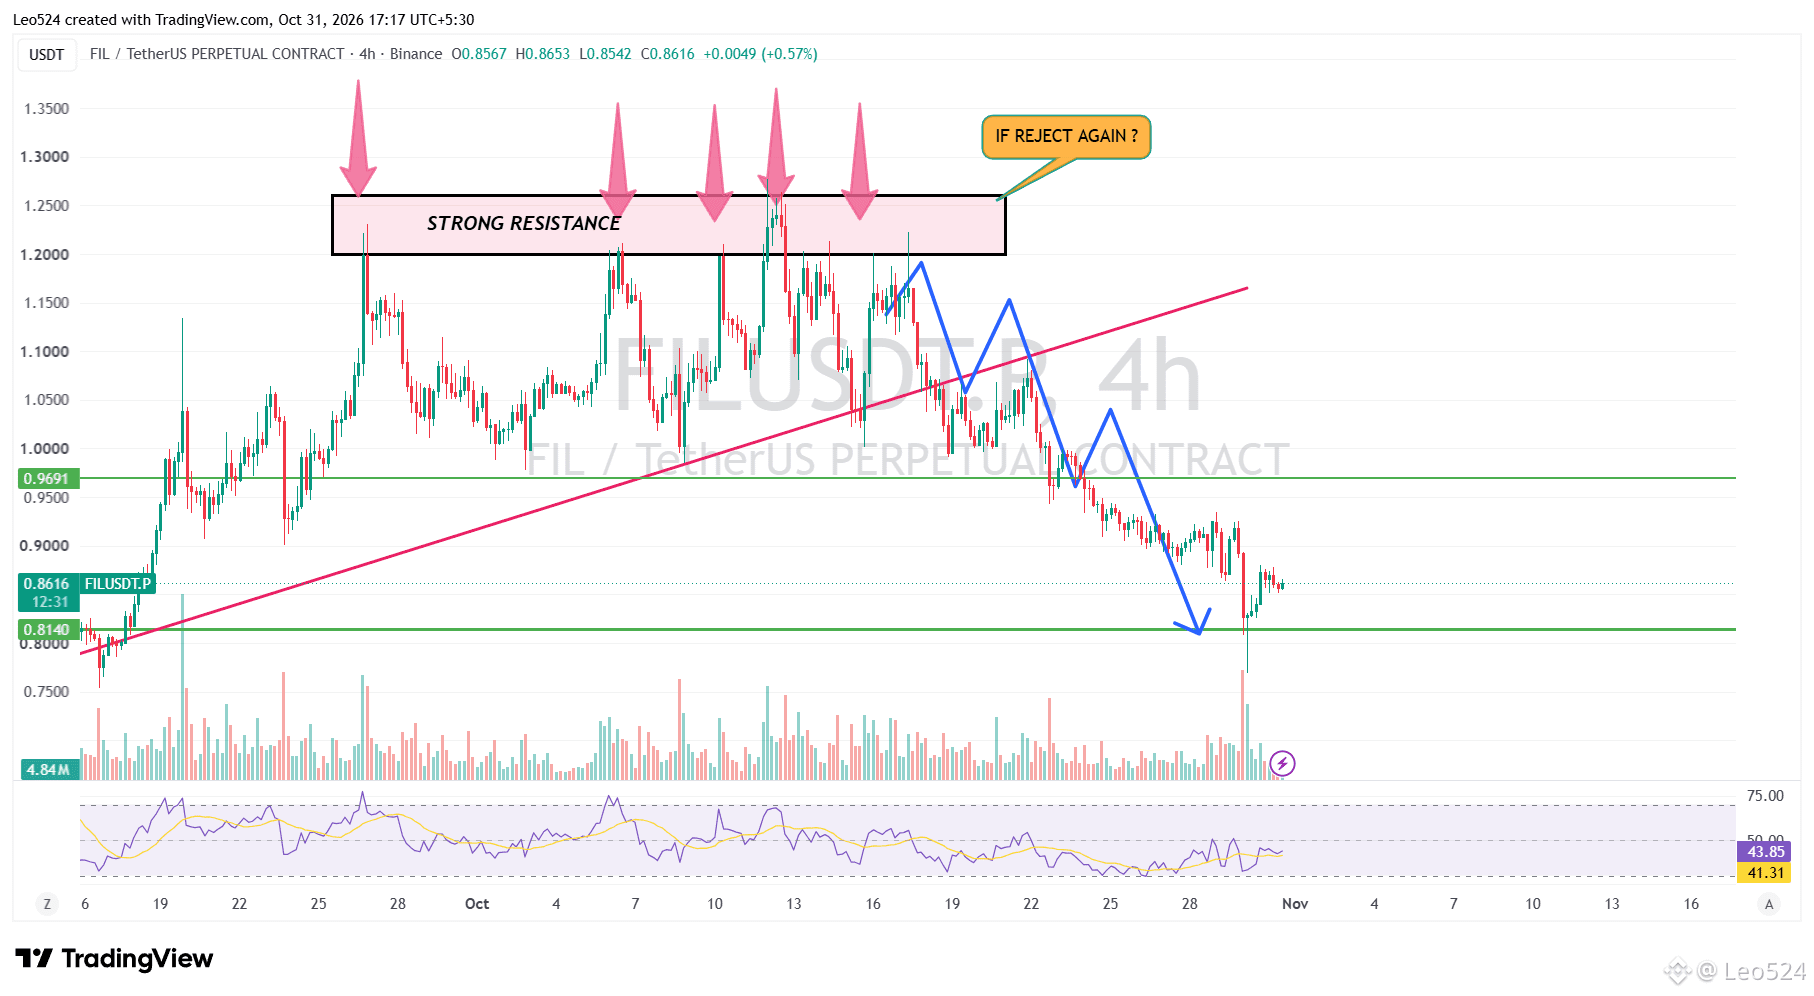
5
713
·
--
උසබ තත්ත්වය
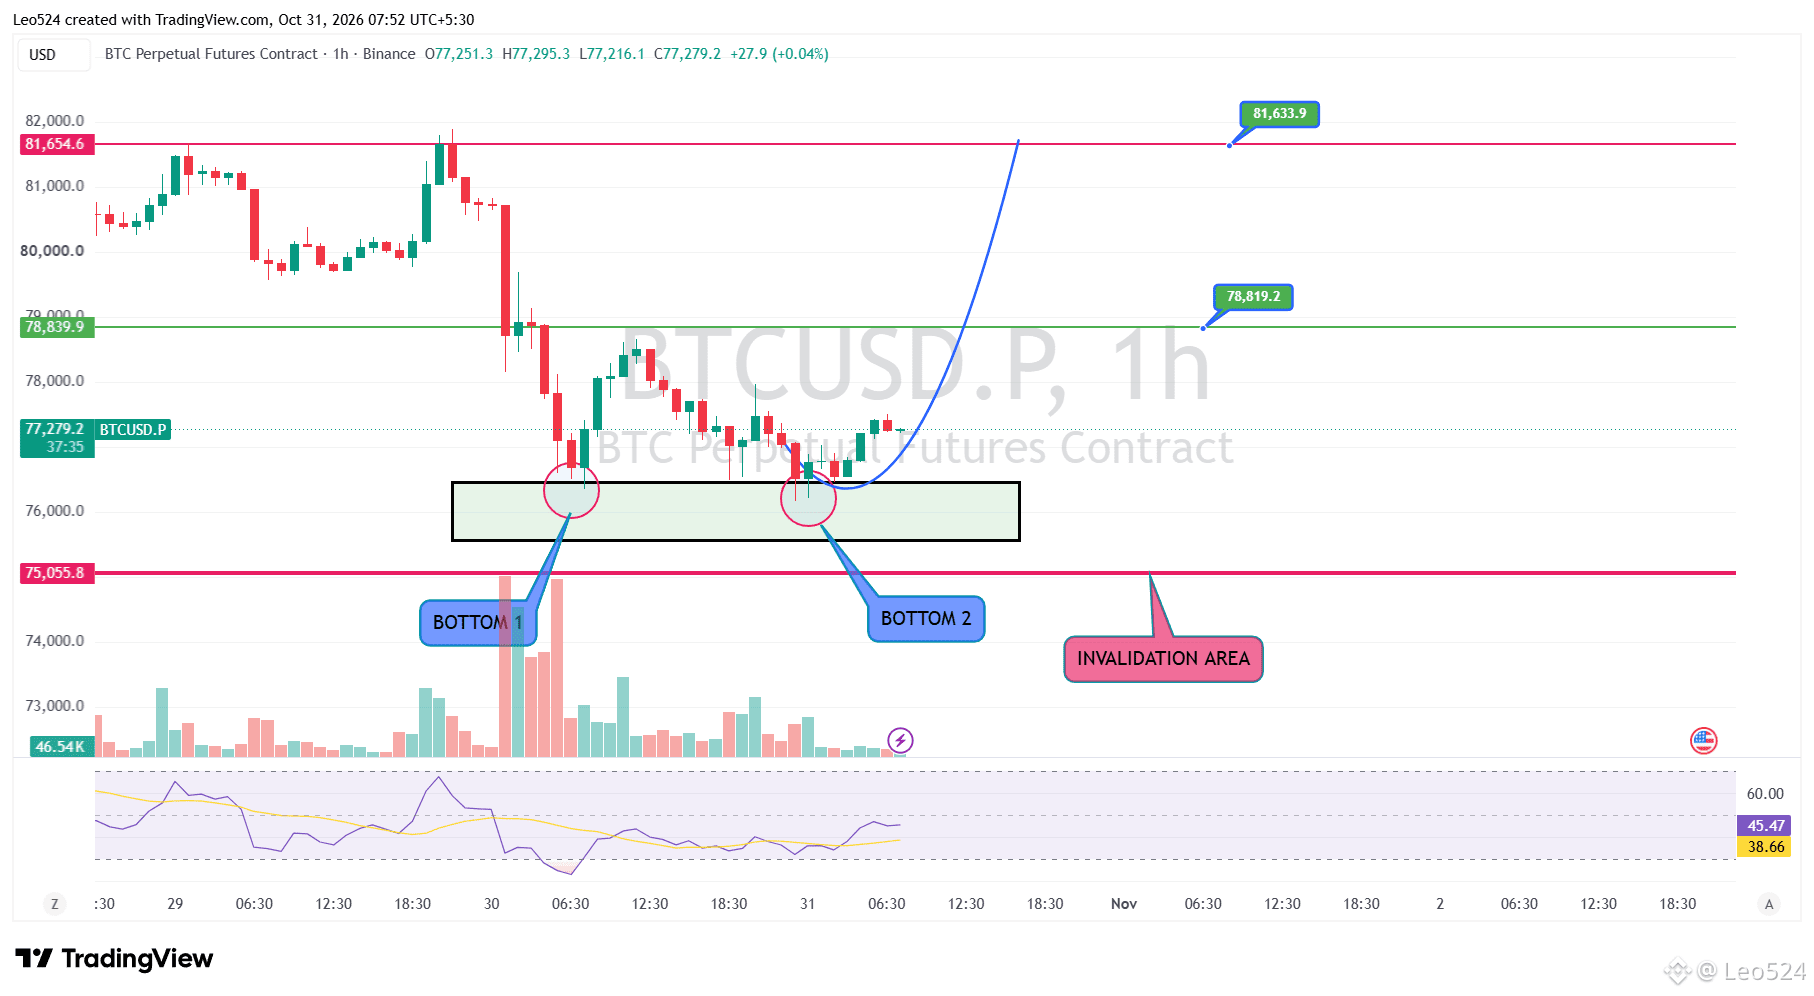
$BTC : ARE BUYERS FINALLY TAKING CONTROL ?
BTC has bounced from the $76K area twice now. Buyers are clearly trying to defend this zone, and we might be seeing a double bottom forming on the 1H chart. If selling pressure keeps slowing down and buyers manage to push higher, $78.8K and eventually $81.6K could be next.
But personally, I'm not looking to enter a LONG just yet. I want to see BTC get back above $80K and hold it with a proper 4H or daily candle close. Until then, I don't think there's enough confirmation to trust this recovery.
If the current support fails, the whole bullish idea could change, especially if BTC drops below $75K. For now, I'm just watching. Let's see if buyers can actually take control this time.
$BTC : ARE BUYERS FINALLY TAKING CONTROL ?
BTC has bounced from the $76K area twice now. Buyers are clearly trying to defend this zone, and we might be seeing a double bottom forming on the 1H chart. If selling pressure keeps slowing down and buyers manage to push higher, $78.8K and eventually $81.6K could be next.
But personally, I'm not looking to enter a LONG just yet. I want to see BTC get back above $80K and hold it with a proper 4H or daily candle close. Until then, I don't think there's enough confirmation to trust this recovery.
If the current support fails, the whole bullish idea could change, especially if BTC drops below $75K. For now, I'm just watching. Let's see if buyers can actually take control this time.
BTC has bounced from the $76K area twice now. Buyers are clearly trying to defend this zone, and we might be seeing a double bottom forming on the 1H chart. If selling pressure keeps slowing down and buyers manage to push higher, $78.8K and eventually $81.6K could be next.
But personally, I'm not looking to enter a LONG just yet. I want to see BTC get back above $80K and hold it with a proper 4H or daily candle close. Until then, I don't think there's enough confirmation to trust this recovery.
If the current support fails, the whole bullish idea could change, especially if BTC drops below $75K. For now, I'm just watching. Let's see if buyers can actually take control this time.
5
938
·
--
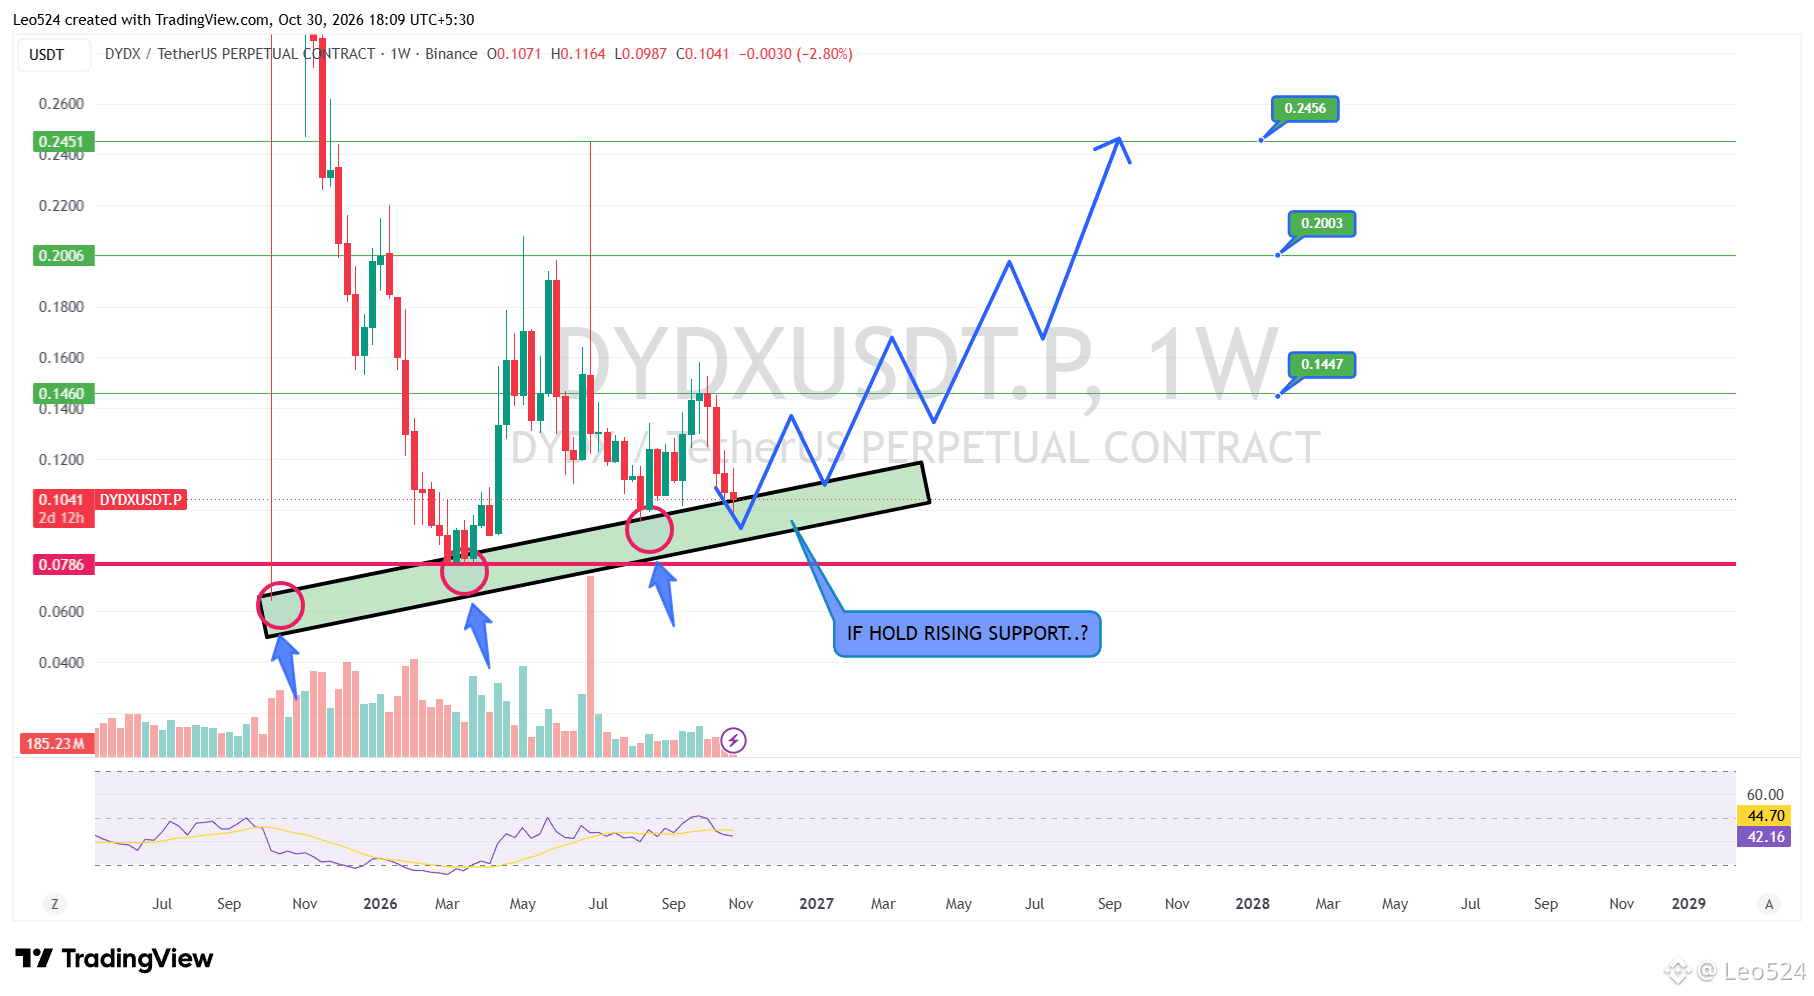
$DYDX: IS A BIG RECOVERY SETUP FORMING ..?
DYDX is testing a rising support zone that has held price several times. Buyers have stepped in around this trendline, making it a key area to watch. The weekly close will be important.
If support holds and momentum improves, the next resistance levels are $0.1447, $0.2003 and $0.2456. These are possible upside levels, not guaranteed targets.
A weekly breakdown below the trendline would weaken the setup, with $0.0786 as the next major support. RSI remains below 50, so bullish confirmation is still needed.
#Crypto #CryptoTrading #LEO524
$DYDX : IS A BIG RECOVERY SETUP FORMING ..?
DYDX is testing a rising support zone that has held price several times. Buyers have stepped in around this trendline, making it a key area to watch. The weekly close will be important.
If support holds and momentum improves, the next resistance levels are $0.1447, $0.2003 and $0.2456. These are possible upside levels, not guaranteed targets.
A weekly breakdown below the trendline would weaken the setup, with $0.0786 as the next major support. RSI remains below 50, so bullish confirmation is still needed.
#Crypto #CryptoTrading #LEO524
DYDX is testing a rising support zone that has held price several times. Buyers have stepped in around this trendline, making it a key area to watch. The weekly close will be important.
If support holds and momentum improves, the next resistance levels are $0.1447, $0.2003 and $0.2456. These are possible upside levels, not guaranteed targets.
A weekly breakdown below the trendline would weaken the setup, with $0.0786 as the next major support. RSI remains below 50, so bullish confirmation is still needed.
#Crypto #CryptoTrading #LEO524
4
811
·
--
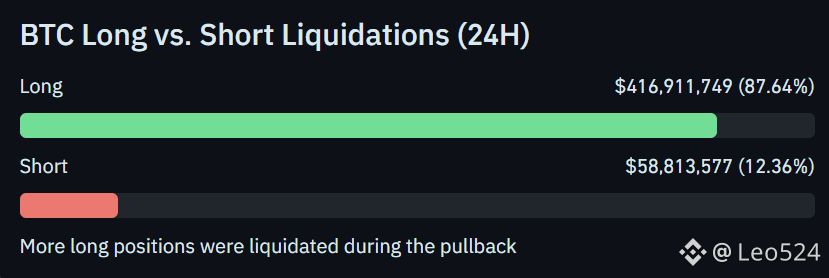
$BTC Traders Lose $475M in Liquidations Today
Bitcoin has seen a massive liquidation event, with over $475 million wiped out in a single day.
🔴 Long liquidations: $416.89M
🟢 Short liquidations: $58.81M
💰 Total: $475.70M
BTC volatility exceeded 6.47%, leaving 20,594 traders liquidated worldwide.
What's interesting is that almost 88% of the liquidations came from LONG positions.
Many buyers were caught on the wrong side of the market during today's volatility.
Events like this show how quickly leveraged positions can get wiped out. Keep an eye on market structure and avoid taking unnecessary risks.
#Bitcoin #BTC #CryptoMarket #LEO524
$BTC Traders Lose $475M in Liquidations Today
Bitcoin has seen a massive liquidation event, with over $475 million wiped out in a single day.
🔴 Long liquidations: $416.89M
🟢 Short liquidations: $58.81M
💰 Total: $475.70M
BTC volatility exceeded 6.47%, leaving 20,594 traders liquidated worldwide.
What's interesting is that almost 88% of the liquidations came from LONG positions.
Many buyers were caught on the wrong side of the market during today's volatility.
Events like this show how quickly leveraged positions can get wiped out. Keep an eye on market structure and avoid taking unnecessary risks.
#Bitcoin #BTC #CryptoMarket #LEO524
Bitcoin has seen a massive liquidation event, with over $475 million wiped out in a single day.
🔴 Long liquidations: $416.89M
🟢 Short liquidations: $58.81M
💰 Total: $475.70M
BTC volatility exceeded 6.47%, leaving 20,594 traders liquidated worldwide.
What's interesting is that almost 88% of the liquidations came from LONG positions.
Many buyers were caught on the wrong side of the market during today's volatility.
Events like this show how quickly leveraged positions can get wiped out. Keep an eye on market structure and avoid taking unnecessary risks.
#Bitcoin #BTC #CryptoMarket #LEO524
5
678
·
--
උසබ තත්ත්වය
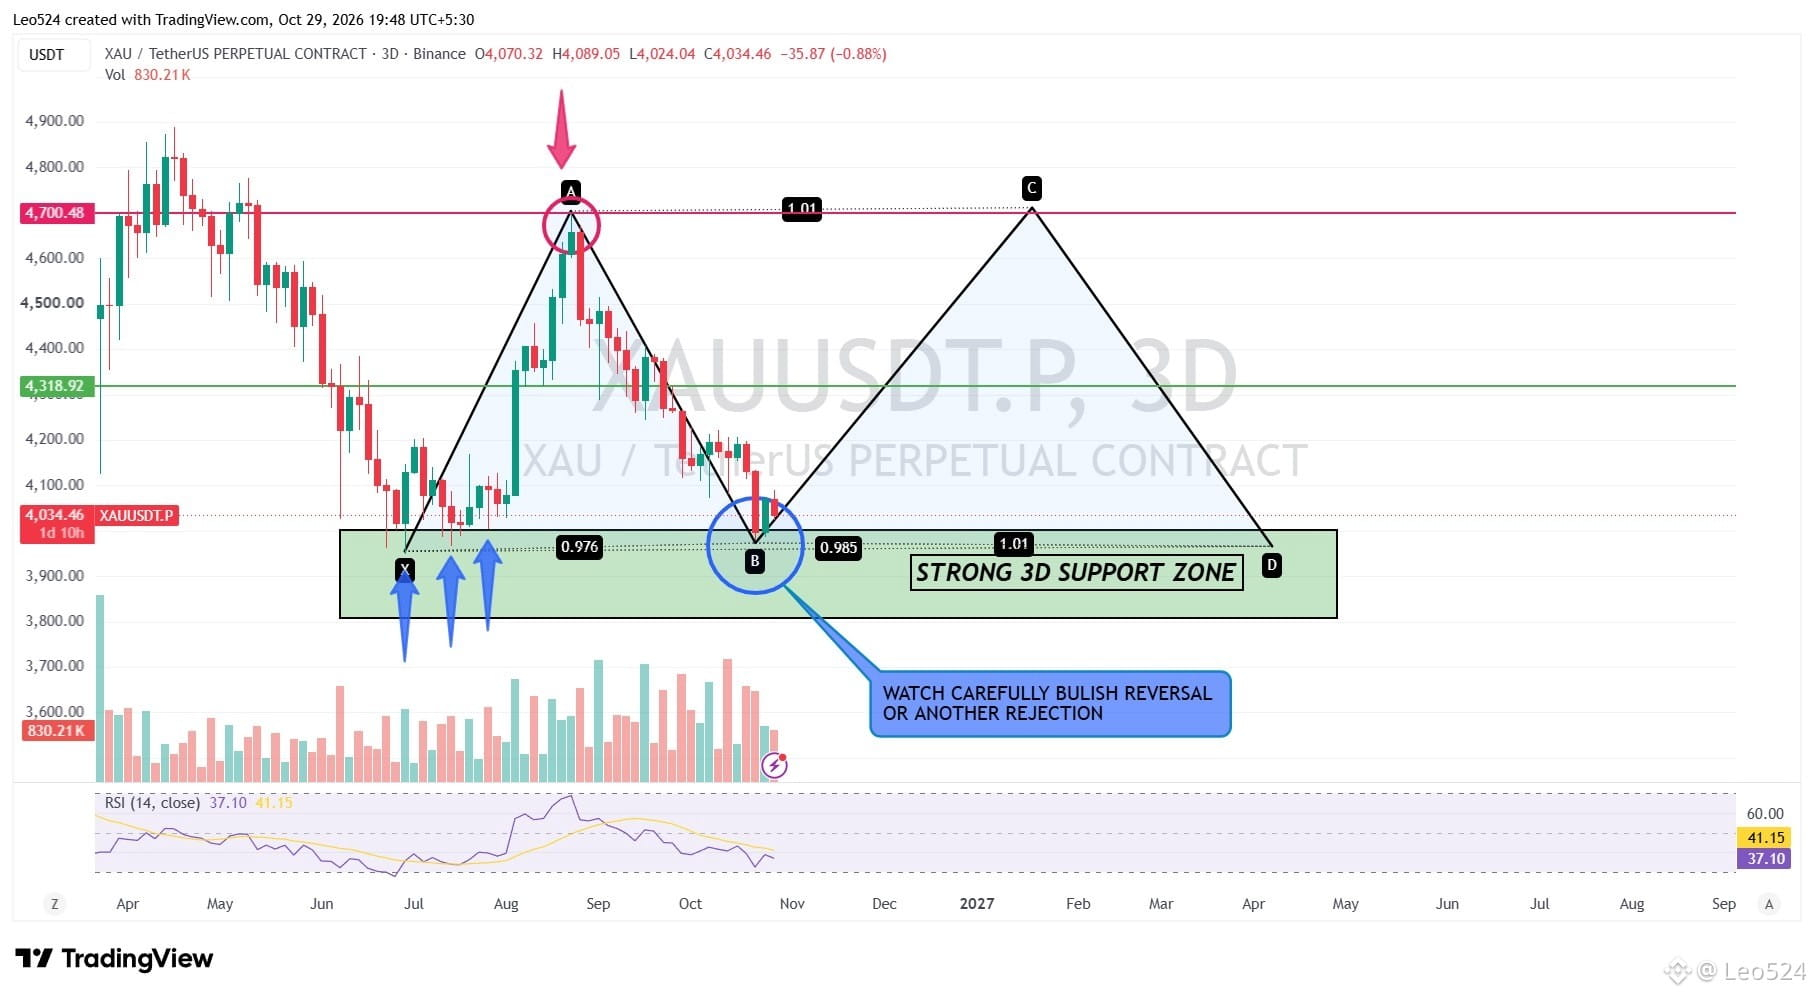
GOLD will hit 4700$ ..? A HARMONIC REVERSAL SETUP IS FORMING !
$XAU USD is approaching a strong 3D support zone around $3,800–$3,950. The chart shows a potential harmonic pattern, with price testing the key support area near point B. This zone could become an important area for a bullish reversal if buyers step in.
👀 If support holds and bullish confirmation appears, gold could recover toward $4,318 and potentially retest the $4,700 resistance zone. However, if support fails, further downside remains possible.
Watch price action carefully for a confirmed reversal, strong bullish candles, and a shift in market structure before drawing conclusions. The harmonic setup is still a possibility, not a confirmed reversal.
#xauusdtrader #GOLD_UPDATE #HarmonicPatterns #LEO524
{future}(XAUUSDT)
GOLD will hit 4700$ ..? A HARMONIC REVERSAL SETUP IS FORMING !
$XAU USD is approaching a strong 3D support zone around $3,800–$3,950. The chart shows a potential harmonic pattern, with price testing the key support area near point B. This zone could become an important area for a bullish reversal if buyers step in.
👀 If support holds and bullish confirmation appears, gold could recover toward $4,318 and potentially retest the $4,700 resistance zone. However, if support fails, further downside remains possible.
Watch price action carefully for a confirmed reversal, strong bullish candles, and a shift in market structure before drawing conclusions. The harmonic setup is still a possibility, not a confirmed reversal.
#xauusdtrader #GOLD_UPDATE #HarmonicPatterns #LEO524
$XAU USD is approaching a strong 3D support zone around $3,800–$3,950. The chart shows a potential harmonic pattern, with price testing the key support area near point B. This zone could become an important area for a bullish reversal if buyers step in.
👀 If support holds and bullish confirmation appears, gold could recover toward $4,318 and potentially retest the $4,700 resistance zone. However, if support fails, further downside remains possible.
Watch price action carefully for a confirmed reversal, strong bullish candles, and a shift in market structure before drawing conclusions. The harmonic setup is still a possibility, not a confirmed reversal.
#xauusdtrader #GOLD_UPDATE #HarmonicPatterns #LEO524
2
404
·
--
QUALITY OVER QUANTITY — A LESSON EVERY TRADER SHOULD LEARN!
Some traders expect profits every day. If the market stays quiet for a day or two, they get impatient and start looking for quick money. 😂
But experienced traders know that more trades don’t always mean more profits. Opening 10+ trades every day without proper confirmation can lead to unnecessary losses.
The key is patience. Wait for the market to reach the right levels, look for strong confirmation, and enter when the setup makes sense. Sometimes, doing nothing is the smartest trading decision.
Remember, trading is not about how many trades you open. It’s about the quality of the decisions you make. 🎯
Quality > Quantity. Always trade with a plan. 📈
#CryptoTrends2024 o #TradingSignals #bitcoin.” n #TradingPsycholog y #Leo524
QUALITY OVER QUANTITY — A LESSON EVERY TRADER SHOULD LEARN!
Some traders expect profits every day. If the market stays quiet for a day or two, they get impatient and start looking for quick money. 😂
But experienced traders know that more trades don’t always mean more profits. Opening 10+ trades every day without proper confirmation can lead to unnecessary losses.
The key is patience. Wait for the market to reach the right levels, look for strong confirmation, and enter when the setup makes sense. Sometimes, doing nothing is the smartest trading decision.
Remember, trading is not about how many trades you open. It’s about the quality of the decisions you make. 🎯
Quality > Quantity. Always trade with a plan. 📈
#CryptoTrends2024 o #TradingSignals #bitcoin.” n #TradingPsycholog y #Leo524
Some traders expect profits every day. If the market stays quiet for a day or two, they get impatient and start looking for quick money. 😂
But experienced traders know that more trades don’t always mean more profits. Opening 10+ trades every day without proper confirmation can lead to unnecessary losses.
The key is patience. Wait for the market to reach the right levels, look for strong confirmation, and enter when the setup makes sense. Sometimes, doing nothing is the smartest trading decision.
Remember, trading is not about how many trades you open. It’s about the quality of the decisions you make. 🎯
Quality > Quantity. Always trade with a plan. 📈
#CryptoTrends2024 o #TradingSignals #bitcoin.” n #TradingPsycholog y #Leo524
3
252
තවත් අන්තර්ගතයන් ගවේෂණය කිරීමට ඇතුල් වන්න
Binance චතුරශ්රය හි ගෝලීය ක්රිප්ටෝ පරිශීලකයින් හා එක්වන්න
⚡️ ක්රිප්ටෝ පිළිබඳ නවතම සහ ප්රයෝජනවත් තොරතුරු ලබා ගන්න.
💬 ලොව විශාලතම ක්රිප්ටෝ හුවමාරුව මගින් විශ්වාස කෙරේ.
👍 සත්යායනය කරන ලද නිර්මාණකරුවන්ගෙන් සැබෑ විදසුන් සොයා ගන්න.
විද්යුත් තැපෑල / දුරකථන අංකය
නැගී එන මාතෘකා
WhatWillDriveCryptoandStocks’NextRebound?
24,099 නැරඹීම්
427 සාකච්ඡා කරමින්
Bitcoin Slips Below $70,000 as Dollar Index Hits 19-Month High
Binance News
·12 කැමත්ත දැක්වීම්
·26.3k නැරඹීම්
Anthropic’s6xIPODemandSignalsPotentialRecordRaise
7,337 නැරඹීම්
188 සාකච්ඡා කරමින්
USSpotBitcoinETFsSee$1.56BYTDNetOutflows
0 නැරඹීම්
0 සාකච්ඡා කරමින්