
KeyosS
569 පෝස්ටු
KeyosS
වාර්තා කරන්න
පරිශීලක අවහිර කරන්න
Passionate about technical analysis and a massive Michael Jordan fan. No FA, DYOR!
191 හඹා යමින්
65 හඹා යන්නන්
128 කැමති විය
පෝස්ටු
සියල්ල
උපුටා දැක්වීම්
වීඩියෝ
අමුණා ඇත
·
--
පරිවර්තනය බලන්න
MJ is the best!
MJ is the best!


Binance Wallet
·
--
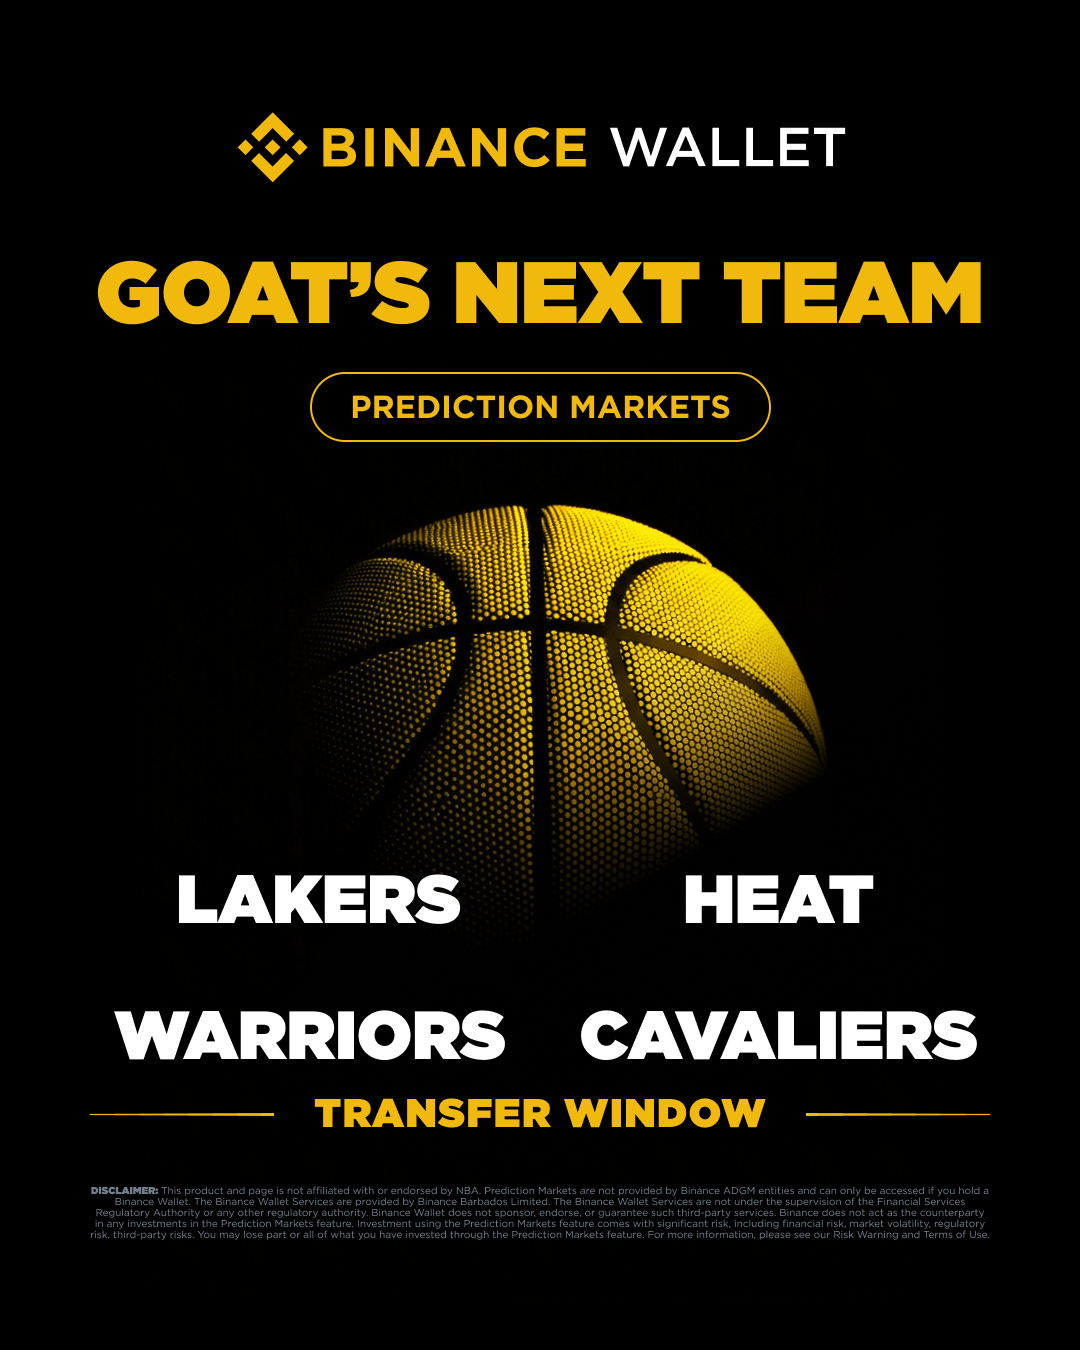
🐐 ლეგენდა შემდეგ სად დაეშვება?
გააგრძელებს ის მემკვიდრეობას მეწამულ და ოქროს ფერებში, დაწერს კიდევ ერთ თავს South Beach-ზე, დიდებას დააბრუნებს Bay-ში, თუ დაბრუნდება იმ ადგილას, საიდანაც ყველაფერი დაიწყო?
🏀 Lakers • Heat • Warriors • Cavaliers
აირჩიე მხარე, დაუჭირე შენი ვარაუდს.
👉 Join now and be part of the biggest transfer story of the year
გააგრძელებს ის მემკვიდრეობას მეწამულ და ოქროს ფერებში, დაწერს კიდევ ერთ თავს South Beach-ზე, დიდებას დააბრუნებს Bay-ში, თუ დაბრუნდება იმ ადგილას, საიდანაც ყველაფერი დაიწყო?
🏀 Lakers • Heat • Warriors • Cavaliers
აირჩიე მხარე, დაუჭირე შენი ვარაუდს.
👉 Join now and be part of the biggest transfer story of the year
2
45
·
--
උසබ තත්ත්වය
$THE [Binance Campaign](https://www.binance.com/en/activity/trading-competition/spot-altcoin-festival-wave-THE-R1/Main-Reward) ကို 0 අලාභය සහ 100% මුදල් ආරක්ෂාව (Cash Safety) 🤖 සමඟ මම ගොවිතැන් කරන හැටි
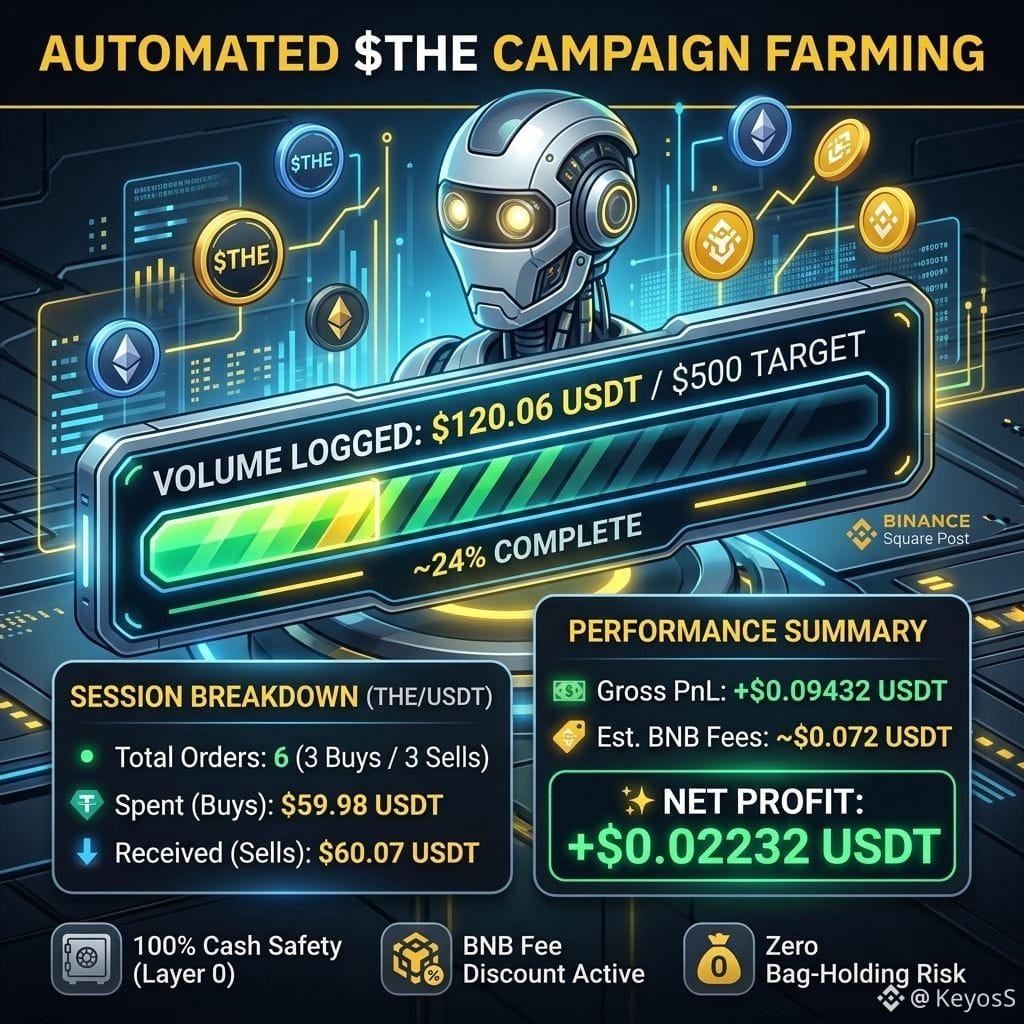
Binance Spot Altcoin Festival (Wave: THE - R1) සඳහා ඉලක්කගත ට්රේඩ් වോളියම් ඉවත් කිරීම කියන්නේ හදිසි වෙළඳපොළ පහත වැටීම් මත ඔබගේ ප්රාග්ධනය අවදානමට දැමීම අදහස් නොවේ. මෙන්න මගේ ස්වයංක්රීය උපාය මාර්ගය මඟින් ව්යාපාර වോളියම් ලොග් කරමින් ශුද්ධ ලාභය (net profitability) පවත්වාගනිමින් ලබාගත් නිවැරදි කාර්ය සාධන බිඳවැටීම:
📊 සැසි ක්රියාත්මක කිරීමේ මිනුම්:
🎯 ඉලක්කය: $500+ වോളියම් (~24% Done)
🔄 ක්රියාත්මක කළ Orders: 6 (3 Buys / 3 Sells)
📈 ලොග් කළ වോളියම්: $120.06 USDT
💰 පිටවීම / ඇතුළුවීම: $59.98 / $60.07
🟢 දළ PnL: +$0.09432 USDT
🏷️ ඇස්තමේන්තුගත BNB ගාස්තු වට්ටම: ~$0.072 USDT
✨ ශුද්ධ ලාභය: +$0.02232 USDT
💡 ප්රධාන උපාය මාර්ග පාඩම්:
🔹 100% මුදල් ආරක්ෂාව (Cash Safety): ක්රියාත්මක කිරීමෙන් පසු උපාය මාර්ගය සෘජුවම නැවත මුදලට (Layer 0) හරවයි—ඊළඟ සකස්වීම (setup) එනතුරු බලා සිටින අතරතුර drawdown අවදානම ඉවත් කරයි.
🔹 ගාස්තු මාජින් පාලනය: BNB තුළ ගාස්තු ගෙවීම අත්යවශ්යය; එමඟින් ගනුදෙනු ගාස්තු overhead එකට වඩා execution gross PnL ඉහළ තබාගැනීමට හැකි වේ.
🔹 Zero-Slippage Farming: කුඩා micro-buys සහ micro-sells භාවිතා කරමින් දිශානුගතව අත්කඩ (directional bag-holding) අවදානමට නොගොස් ව්යාපාර milestones වෙත ළඟා වීමට ඔබට හැක.
ඔබ Spot Altcoin Festival එකට ගොවිතැන් කරනවද?
අදහස් තුළ ඔබගේ $THE වോളියම් ප්රගතිය දැම්ම දාන්න! සැබෑ දත්ත බිඳවැටීම් වලට ඔබ කැමති නම් Like එකක් දෙන්න, සහ ව්යාපාර සම්පූර්ණත්වය (100% campaign completion) දක්වා බොට් එකේ සජීවී ගමන අනුගමනය කරන්න Follow කරන්න! 🚀
ප්රකාශය (Disclaimer): අධ්යාපනික අන්තර්ගතය පමණි. මූල්ය උපදෙස් (financial advice) නොවේ. සෑම විටම ඔබේම උපාය මාර්ගයට අනුව බොට් පරාමිතීන් සහ වෙළඳ අවදානම් සකස් කරන්න.
$THE Binance Campaign ကို 0 අලාභය සහ 100% මුදල් ආරක්ෂාව (Cash Safety) 🤖 සමඟ මම ගොවිතැන් කරන හැටි
Binance Spot Altcoin Festival (Wave: THE - R1) සඳහා ඉලක්කගත ට්රේඩ් වോളියම් ඉවත් කිරීම කියන්නේ හදිසි වෙළඳපොළ පහත වැටීම් මත ඔබගේ ප්රාග්ධනය අවදානමට දැමීම අදහස් නොවේ. මෙන්න මගේ ස්වයංක්රීය උපාය මාර්ගය මඟින් ව්යාපාර වോളියම් ලොග් කරමින් ශුද්ධ ලාභය (net profitability) පවත්වාගනිමින් ලබාගත් නිවැරදි කාර්ය සාධන බිඳවැටීම:
📊 සැසි ක්රියාත්මක කිරීමේ මිනුම්:
🎯 ඉලක්කය: $500+ වോളියම් (~24% Done)
🔄 ක්රියාත්මක කළ Orders: 6 (3 Buys / 3 Sells)
📈 ලොග් කළ වോളියම්: $120.06 USDT
💰 පිටවීම / ඇතුළුවීම: $59.98 / $60.07
🟢 දළ PnL: +$0.09432 USDT
🏷️ ඇස්තමේන්තුගත BNB ගාස්තු වට්ටම: ~$0.072 USDT
✨ ශුද්ධ ලාභය: +$0.02232 USDT
💡 ප්රධාන උපාය මාර්ග පාඩම්:
🔹 100% මුදල් ආරක්ෂාව (Cash Safety): ක්රියාත්මක කිරීමෙන් පසු උපාය මාර්ගය සෘජුවම නැවත මුදලට (Layer 0) හරවයි—ඊළඟ සකස්වීම (setup) එනතුරු බලා සිටින අතරතුර drawdown අවදානම ඉවත් කරයි.
🔹 ගාස්තු මාජින් පාලනය: BNB තුළ ගාස්තු ගෙවීම අත්යවශ්යය; එමඟින් ගනුදෙනු ගාස්තු overhead එකට වඩා execution gross PnL ඉහළ තබාගැනීමට හැකි වේ.
🔹 Zero-Slippage Farming: කුඩා micro-buys සහ micro-sells භාවිතා කරමින් දිශානුගතව අත්කඩ (directional bag-holding) අවදානමට නොගොස් ව්යාපාර milestones වෙත ළඟා වීමට ඔබට හැක.
ඔබ Spot Altcoin Festival එකට ගොවිතැන් කරනවද?
අදහස් තුළ ඔබගේ $THE වോളියම් ප්රගතිය දැම්ම දාන්න! සැබෑ දත්ත බිඳවැටීම් වලට ඔබ කැමති නම් Like එකක් දෙන්න, සහ ව්යාපාර සම්පූර්ණත්වය (100% campaign completion) දක්වා බොට් එකේ සජීවී ගමන අනුගමනය කරන්න Follow කරන්න! 🚀
ප්රකාශය (Disclaimer): අධ්යාපනික අන්තර්ගතය පමණි. මූල්ය උපදෙස් (financial advice) නොවේ. සෑම විටම ඔබේම උපාය මාර්ගයට අනුව බොට් පරාමිතීන් සහ වෙළඳ අවදානම් සකස් කරන්න.
Binance Spot Altcoin Festival (Wave: THE - R1) සඳහා ඉලක්කගත ට්රේඩ් වോളියම් ඉවත් කිරීම කියන්නේ හදිසි වෙළඳපොළ පහත වැටීම් මත ඔබගේ ප්රාග්ධනය අවදානමට දැමීම අදහස් නොවේ. මෙන්න මගේ ස්වයංක්රීය උපාය මාර්ගය මඟින් ව්යාපාර වോളියම් ලොග් කරමින් ශුද්ධ ලාභය (net profitability) පවත්වාගනිමින් ලබාගත් නිවැරදි කාර්ය සාධන බිඳවැටීම:
📊 සැසි ක්රියාත්මක කිරීමේ මිනුම්:
🎯 ඉලක්කය: $500+ වോളියම් (~24% Done)
🔄 ක්රියාත්මක කළ Orders: 6 (3 Buys / 3 Sells)
📈 ලොග් කළ වോളියම්: $120.06 USDT
💰 පිටවීම / ඇතුළුවීම: $59.98 / $60.07
🟢 දළ PnL: +$0.09432 USDT
🏷️ ඇස්තමේන්තුගත BNB ගාස්තු වට්ටම: ~$0.072 USDT
✨ ශුද්ධ ලාභය: +$0.02232 USDT
💡 ප්රධාන උපාය මාර්ග පාඩම්:
🔹 100% මුදල් ආරක්ෂාව (Cash Safety): ක්රියාත්මක කිරීමෙන් පසු උපාය මාර්ගය සෘජුවම නැවත මුදලට (Layer 0) හරවයි—ඊළඟ සකස්වීම (setup) එනතුරු බලා සිටින අතරතුර drawdown අවදානම ඉවත් කරයි.
🔹 ගාස්තු මාජින් පාලනය: BNB තුළ ගාස්තු ගෙවීම අත්යවශ්යය; එමඟින් ගනුදෙනු ගාස්තු overhead එකට වඩා execution gross PnL ඉහළ තබාගැනීමට හැකි වේ.
🔹 Zero-Slippage Farming: කුඩා micro-buys සහ micro-sells භාවිතා කරමින් දිශානුගතව අත්කඩ (directional bag-holding) අවදානමට නොගොස් ව්යාපාර milestones වෙත ළඟා වීමට ඔබට හැක.
ඔබ Spot Altcoin Festival එකට ගොවිතැන් කරනවද?
අදහස් තුළ ඔබගේ $THE වോളියම් ප්රගතිය දැම්ම දාන්න! සැබෑ දත්ත බිඳවැටීම් වලට ඔබ කැමති නම් Like එකක් දෙන්න, සහ ව්යාපාර සම්පූර්ණත්වය (100% campaign completion) දක්වා බොට් එකේ සජීවී ගමන අනුගමනය කරන්න Follow කරන්න! 🚀
ප්රකාශය (Disclaimer): අධ්යාපනික අන්තර්ගතය පමණි. මූල්ය උපදෙස් (financial advice) නොවේ. සෑම විටම ඔබේම උපාය මාර්ගයට අනුව බොට් පරාමිතීන් සහ වෙළඳ අවදානම් සකස් කරන්න.
2
194
·
--
ලිපිය
පරිවර්තනය බලන්න
Turning $120 into $55.8K Volume: My ENSO Spot Competition Story & Hard Lessons LearnedTrading competitions look straightforward on paper—generate volume, hit the leaderboard, and claim your share of the prize pool. But putting strategy into real-time execution tells a completely different story. Here is my experience testing market mechanics during the [ENSO Spot Trading Competition.](https://www.binance.com/activity/trading-competition/spot-altcoin-festival-wave-ENSO1)
1. The Setup & Initial Burn Experiment
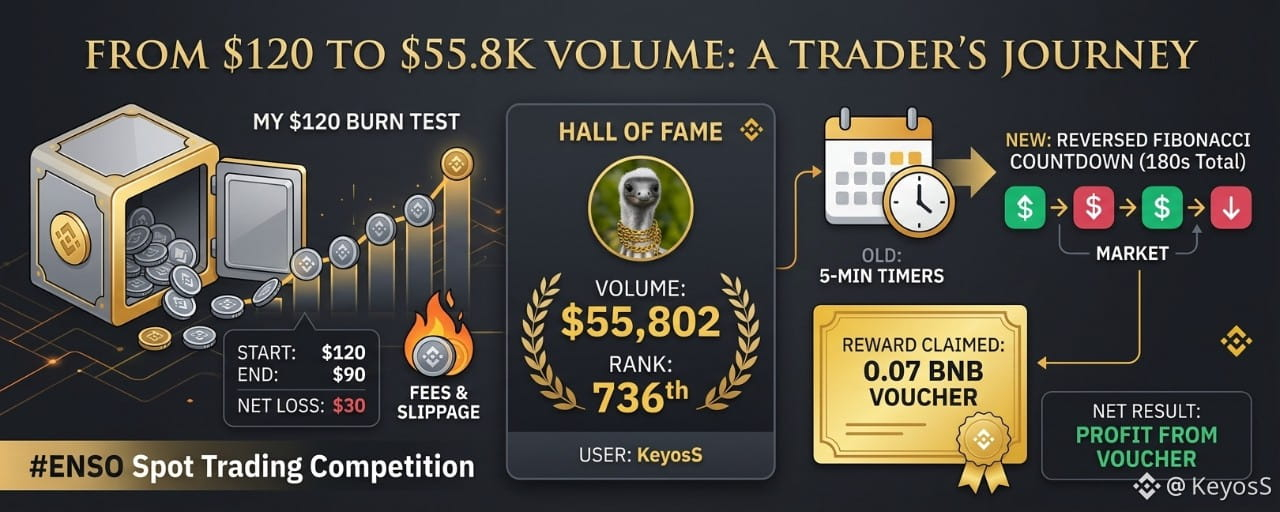
Starting Balance: $120 USDTEnding Balance: $90 USDTNet Loss / Cost: $30 USDTReward Claimed: 0.07 BNB (~$38.50 USDT value)Net Result: Ended in net profit (~+$8.50) while securing 736th place on the leaderboard with $55,802 in volume.
My goal wasn't just to rank; it was to test high-frequency execution limits and see how far I could stretch a small $120 balance by intentionally "burning" capital for high volume.
2. Strategy Evolution: 5-Minute Timers to Reversed Fibonacci Countdown
Phase 1 (5-Minute Interval Order Execution):Initially, I executed market buys and sells on rigid 5-minute fixed candle intervals. While predictable, market execution during low volatility meant spread slippage began eroding the capital base faster than expected.Phase 2 (Reversed Fibonacci Countdown Schedule - 180s Total): To optimize execution frequency, I shifted to a 180-second Reversed Fibonacci
Countdown schedule:00:00 (3:00 mark): Market Buy execution.00:34 (2:26 mark): Order validation & position check.01:29 (1:31 mark): Peak taker absorption window.02:24 (0:36 mark): Market Sell execution.03:00 (0:00 mark): Instant cycle reset.
Using rapid market orders ensured 100% fill rates to churn volume, but executing as a Taker meant eating continuous taker fees and market spread.
3. The Breakdown: Fee & Slippage Math
As a VIP 0 / Regular User using BNB for fee payment (25% discount):
Taker / Maker Rate: 0.075% per tradeTotal Executed Trades: 862 tradesTotal Traded Volume: ~$55,923.51 USDTTotal Trading Fees Paid: ~0.0586 BNB (~$41.94 USDT equivalent)
4. Key Takeaways & Strategy Refinement
Slippage Kills Fast Scalping: Executing market orders back-to-back causes order-book spread loss that outweighs trading fees.Limit Orders are Essential: Future competition runs must utilize tight Limit Orders (Maker) rather than Market (Taker) orders to avoid spread degradation.Reward Math Works: Even after losing $30 in capital drawdown and paying ~$42 in fees, receiving the 0.07 BNB Token Voucher brought the entire experiment into net profit.
Reference / Original Discussion:[Binance Square Case Study & Community Post](https://www.binance.com/en/square/post/362425615135326)
Turning $120 into $55.8K Volume: My ENSO Spot Competition Story & Hard Lessons Learned
Trading competitions look straightforward on paper—generate volume, hit the leaderboard, and claim your share of the prize pool. But putting strategy into real-time execution tells a completely different story. Here is my experience testing market mechanics during the ENSO Spot Trading Competition.
1. The Setup & Initial Burn Experiment
Starting Balance: $120 USDTEnding Balance: $90 USDTNet Loss / Cost: $30 USDTReward Claimed: 0.07 BNB (~$38.50 USDT value)Net Result: Ended in net profit (~+$8.50) while securing 736th place on the leaderboard with $55,802 in volume.
My goal wasn't just to rank; it was to test high-frequency execution limits and see how far I could stretch a small $120 balance by intentionally "burning" capital for high volume.
2. Strategy Evolution: 5-Minute Timers to Reversed Fibonacci Countdown
Phase 1 (5-Minute Interval Order Execution):Initially, I executed market buys and sells on rigid 5-minute fixed candle intervals. While predictable, market execution during low volatility meant spread slippage began eroding the capital base faster than expected.Phase 2 (Reversed Fibonacci Countdown Schedule - 180s Total): To optimize execution frequency, I shifted to a 180-second Reversed Fibonacci
Countdown schedule:00:00 (3:00 mark): Market Buy execution.00:34 (2:26 mark): Order validation & position check.01:29 (1:31 mark): Peak taker absorption window.02:24 (0:36 mark): Market Sell execution.03:00 (0:00 mark): Instant cycle reset.
Using rapid market orders ensured 100% fill rates to churn volume, but executing as a Taker meant eating continuous taker fees and market spread.
3. The Breakdown: Fee & Slippage Math
As a VIP 0 / Regular User using BNB for fee payment (25% discount):
Taker / Maker Rate: 0.075% per tradeTotal Executed Trades: 862 tradesTotal Traded Volume: ~$55,923.51 USDTTotal Trading Fees Paid: ~0.0586 BNB (~$41.94 USDT equivalent)
4. Key Takeaways & Strategy Refinement
Slippage Kills Fast Scalping: Executing market orders back-to-back causes order-book spread loss that outweighs trading fees.Limit Orders are Essential: Future competition runs must utilize tight Limit Orders (Maker) rather than Market (Taker) orders to avoid spread degradation.Reward Math Works: Even after losing $30 in capital drawdown and paying ~$42 in fees, receiving the 0.07 BNB Token Voucher brought the entire experiment into net profit.
Reference / Original Discussion:Binance Square Case Study & Community Post
1. The Setup & Initial Burn Experiment
Starting Balance: $120 USDTEnding Balance: $90 USDTNet Loss / Cost: $30 USDTReward Claimed: 0.07 BNB (~$38.50 USDT value)Net Result: Ended in net profit (~+$8.50) while securing 736th place on the leaderboard with $55,802 in volume.
My goal wasn't just to rank; it was to test high-frequency execution limits and see how far I could stretch a small $120 balance by intentionally "burning" capital for high volume.
2. Strategy Evolution: 5-Minute Timers to Reversed Fibonacci Countdown
Phase 1 (5-Minute Interval Order Execution):Initially, I executed market buys and sells on rigid 5-minute fixed candle intervals. While predictable, market execution during low volatility meant spread slippage began eroding the capital base faster than expected.Phase 2 (Reversed Fibonacci Countdown Schedule - 180s Total): To optimize execution frequency, I shifted to a 180-second Reversed Fibonacci
Countdown schedule:00:00 (3:00 mark): Market Buy execution.00:34 (2:26 mark): Order validation & position check.01:29 (1:31 mark): Peak taker absorption window.02:24 (0:36 mark): Market Sell execution.03:00 (0:00 mark): Instant cycle reset.
Using rapid market orders ensured 100% fill rates to churn volume, but executing as a Taker meant eating continuous taker fees and market spread.
3. The Breakdown: Fee & Slippage Math
As a VIP 0 / Regular User using BNB for fee payment (25% discount):
Taker / Maker Rate: 0.075% per tradeTotal Executed Trades: 862 tradesTotal Traded Volume: ~$55,923.51 USDTTotal Trading Fees Paid: ~0.0586 BNB (~$41.94 USDT equivalent)
4. Key Takeaways & Strategy Refinement
Slippage Kills Fast Scalping: Executing market orders back-to-back causes order-book spread loss that outweighs trading fees.Limit Orders are Essential: Future competition runs must utilize tight Limit Orders (Maker) rather than Market (Taker) orders to avoid spread degradation.Reward Math Works: Even after losing $30 in capital drawdown and paying ~$42 in fees, receiving the 0.07 BNB Token Voucher brought the entire experiment into net profit.
Reference / Original Discussion:Binance Square Case Study & Community Post
1
214
·
--

ලිපිය
කුඩා ගිණුම් මත හුවමාරු තරඟවල නිරත වීම: උපායශීලී ප්රාග්ධන යෙදවීමඉහළ පරිමාවක් ඇති හුවමාරු තරඟවලදී කුඩා මුදලක්/බැංකර් රොටේ (bankroll) එකකින් ඉහළම ලීඩර්බෝර්ඩ් ස්ථාන හඹා යාම ව්යුහාත්මකව පරාජය කරවන ක්රීඩාවකි. පෙර එක් තරඟ උත්සාහයකදී, අතින් සිදු කළ වෙළඳාමක් සමස්ත පරිමාව ලෙස $55,000+ නිපදවූවත්, එය -$24.76 ක ශුද්ධ අලාභයක් බවට පත්විය. සීඝ්ර-ඝනත්ව (high-frequency) ආයතනික ඇල්ගොරිතමයන්ට තරඟ කිරීමට කුඩා ප්රාග්ධනය සියගණනක් වාර ගණනින් “churn” කිරීමෙන් spread slippage, execution latency, සහ එකතු වන ගනුදෙනු ගාස්තු හේතුවෙන් ප්රාග්ධනය ක්ෂය වීම සිදුවේ.
අරමුදල් ආරක්ෂා කරමින් ව්යාපාර ප්රතිලාභ ලබා ගැනීමට, ක්රියාත්මක කිරීමේ (execution) ආකෘතිය HOLO සහ THE Binance Spot Altcoin Festivals යන දෙක හරහා සම්පූර්ණයෙන්ම ස්වයංක්රීය dual-bot උපායයට මාරු වේ.
කුඩා ගිණුම් මත හුවමාරු තරඟවල නිරත වීම: උපායශීලී ප්රාග්ධන යෙදවීම
ඉහළ පරිමාවක් ඇති හුවමාරු තරඟවලදී කුඩා මුදලක්/බැංකර් රොටේ (bankroll) එකකින් ඉහළම ලීඩර්බෝර්ඩ් ස්ථාන හඹා යාම ව්යුහාත්මකව පරාජය කරවන ක්රීඩාවකි. පෙර එක් තරඟ උත්සාහයකදී, අතින් සිදු කළ වෙළඳාමක් සමස්ත පරිමාව ලෙස $55,000+ නිපදවූවත්, එය -$24.76 ක ශුද්ධ අලාභයක් බවට පත්විය. සීඝ්ර-ඝනත්ව (high-frequency) ආයතනික ඇල්ගොරිතමයන්ට තරඟ කිරීමට කුඩා ප්රාග්ධනය සියගණනක් වාර ගණනින් “churn” කිරීමෙන් spread slippage, execution latency, සහ එකතු වන ගනුදෙනු ගාස්තු හේතුවෙන් ප්රාග්ධනය ක්ෂය වීම සිදුවේ.
අරමුදල් ආරක්ෂා කරමින් ව්යාපාර ප්රතිලාභ ලබා ගැනීමට, ක්රියාත්මක කිරීමේ (execution) ආකෘතිය HOLO සහ THE Binance Spot Altcoin Festivals යන දෙක හරහා සම්පූර්ණයෙන්ම ස්වයංක්රීය dual-bot උපායයට මාරු වේ.
අරමුදල් ආරක්ෂා කරමින් ව්යාපාර ප්රතිලාභ ලබා ගැනීමට, ක්රියාත්මක කිරීමේ (execution) ආකෘතිය HOLO සහ THE Binance Spot Altcoin Festivals යන දෙක හරහා සම්පූර්ණයෙන්ම ස්වයංක්රීය dual-bot උපායයට මාරු වේ.
12
2
692
·
--
ලිපිය
පරිවර්තනය බලන්න
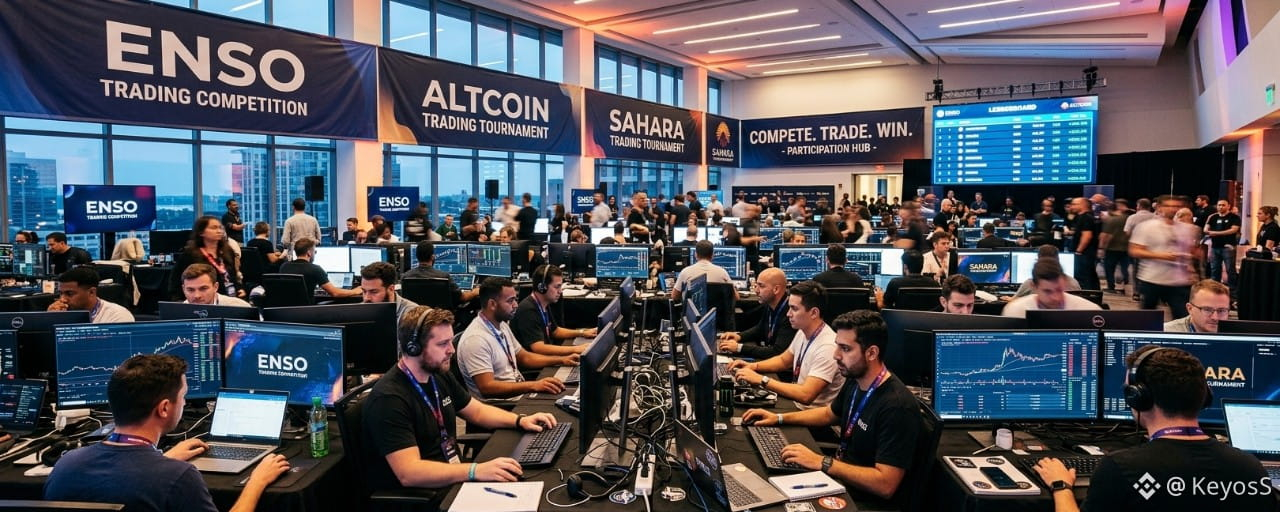
Why You Shouldn't Chase Binance Tournaments with a $100 Account (And How to Actually Profit)💡 Why You Shouldn't Chase Binance Tournaments with a $100 Account (And How to Actually Profit)
Winning a high-volume Binance trading tournament with a small starting balance (e.g., $100) is mathematically stacked against you if you try to race HFT bots on the leaderboard.
Here is why direct leaderboard chasing fails, how institutional volume bots operate, and the exact protocol to make real money instead:
🛑 Why Direct Leaderboard Chasing Fails
To reach the top 100 on a high-volume sprint, you often need $60,000+ in total volume.
The Fee Burn: Turning over $100 roughly 300 times to hit $60k volume burns ~$45.00 in fees (even with BNB discounts)—instantly eating nearly half your account.Slippage Risk: Execution latency across hundreds of trades will drain your remaining capital before you ever hit a reward tier.
🤖 How Institutional Bots Differ from Retail
Institutional market makers do not trade like retail users:
Market-Neutral Delta Strategies: Bots place simultaneous buy and sell limit orders within milliseconds. Their net directional exposure is near-zero, meaning a 10% sudden crash barely touches their balance.Micro-Inventory Cuts: If executed buy orders get caught in a drop, algorithms instantly offload inventory for tiny micro-losses. Losing $200 on slippage across $5M volume is negligible compared to top-tier prize payouts.Cross-Exchange Short Hedges: Large accounts often open a 1:1 Short on Futures to offset Spot volume holding. If price drops 20%, their Spot loss is fully offset by Futures gains.
🚀 3-Step Strategy to Actually Make Money with $100
1️⃣ Shift Goal: Capital Growth Over Ranking
Treat tournament windows as high-volatility liquidity events.
Execute 1 to 2 clean range trades per day.Target realistic 1.5% to 3% net profit per setup ($1.50–$3.00 gains).Compound your account safely without burning fees on high-frequency churn.
2️⃣ Target Base Qualification Tiers ("Lucky Draws / Pool Share")
Look for promo tiers requiring low total volume (e.g., $500 threshold).
Execution: Buy & sell $100 roughly 3 times (~$600 total volume).Fee Cost: Only ~$0.45 total using BNB fee discounts.Result: Qualify for equal-share reward pools while risking under 50 cents.
3️⃣ Strict Execution Protocol
Limit Orders Only: Avoid taker fees—never market buy/sell.Hard Stops: Cut positions manually if structural support breaks (e.g., key support levels like $0.0610 for HOLO).Patience: Once your target limit order fills, step away and wait for the next range setup rather than forcing immediate re-entries.
💬 What’s your strategy during volume tournaments? Do you chase the leaderboard or focus on organic compounding? Drop your thoughts below! 👇
#CryptoTrading #RiskManagement #BinanceSquare #TradingStrategy #Altcoins $VTHO $SUPER $MOVE
{spot}(MOVEUSDT)
{spot}(SUPERUSDT)
{spot}(VTHOUSDT)
Why You Shouldn't Chase Binance Tournaments with a $100 Account (And How to Actually Profit)
💡 Why You Shouldn't Chase Binance Tournaments with a $100 Account (And How to Actually Profit)
Winning a high-volume Binance trading tournament with a small starting balance (e.g., $100) is mathematically stacked against you if you try to race HFT bots on the leaderboard.
Here is why direct leaderboard chasing fails, how institutional volume bots operate, and the exact protocol to make real money instead:
🛑 Why Direct Leaderboard Chasing Fails
To reach the top 100 on a high-volume sprint, you often need $60,000+ in total volume.
The Fee Burn: Turning over $100 roughly 300 times to hit $60k volume burns ~$45.00 in fees (even with BNB discounts)—instantly eating nearly half your account.Slippage Risk: Execution latency across hundreds of trades will drain your remaining capital before you ever hit a reward tier.
🤖 How Institutional Bots Differ from Retail
Institutional market makers do not trade like retail users:
Market-Neutral Delta Strategies: Bots place simultaneous buy and sell limit orders within milliseconds. Their net directional exposure is near-zero, meaning a 10% sudden crash barely touches their balance.Micro-Inventory Cuts: If executed buy orders get caught in a drop, algorithms instantly offload inventory for tiny micro-losses. Losing $200 on slippage across $5M volume is negligible compared to top-tier prize payouts.Cross-Exchange Short Hedges: Large accounts often open a 1:1 Short on Futures to offset Spot volume holding. If price drops 20%, their Spot loss is fully offset by Futures gains.
🚀 3-Step Strategy to Actually Make Money with $100
1️⃣ Shift Goal: Capital Growth Over Ranking
Treat tournament windows as high-volatility liquidity events.
Execute 1 to 2 clean range trades per day.Target realistic 1.5% to 3% net profit per setup ($1.50–$3.00 gains).Compound your account safely without burning fees on high-frequency churn.
2️⃣ Target Base Qualification Tiers ("Lucky Draws / Pool Share")
Look for promo tiers requiring low total volume (e.g., $500 threshold).
Execution: Buy & sell $100 roughly 3 times (~$600 total volume).Fee Cost: Only ~$0.45 total using BNB fee discounts.Result: Qualify for equal-share reward pools while risking under 50 cents.
3️⃣ Strict Execution Protocol
Limit Orders Only: Avoid taker fees—never market buy/sell.Hard Stops: Cut positions manually if structural support breaks (e.g., key support levels like $0.0610 for HOLO).Patience: Once your target limit order fills, step away and wait for the next range setup rather than forcing immediate re-entries.
💬 What’s your strategy during volume tournaments? Do you chase the leaderboard or focus on organic compounding? Drop your thoughts below! 👇
#CryptoTrading #RiskManagement #BinanceSquare #TradingStrategy #Altcoins $VTHO $SUPER $MOVE
Winning a high-volume Binance trading tournament with a small starting balance (e.g., $100) is mathematically stacked against you if you try to race HFT bots on the leaderboard.
Here is why direct leaderboard chasing fails, how institutional volume bots operate, and the exact protocol to make real money instead:
🛑 Why Direct Leaderboard Chasing Fails
To reach the top 100 on a high-volume sprint, you often need $60,000+ in total volume.
The Fee Burn: Turning over $100 roughly 300 times to hit $60k volume burns ~$45.00 in fees (even with BNB discounts)—instantly eating nearly half your account.Slippage Risk: Execution latency across hundreds of trades will drain your remaining capital before you ever hit a reward tier.
🤖 How Institutional Bots Differ from Retail
Institutional market makers do not trade like retail users:
Market-Neutral Delta Strategies: Bots place simultaneous buy and sell limit orders within milliseconds. Their net directional exposure is near-zero, meaning a 10% sudden crash barely touches their balance.Micro-Inventory Cuts: If executed buy orders get caught in a drop, algorithms instantly offload inventory for tiny micro-losses. Losing $200 on slippage across $5M volume is negligible compared to top-tier prize payouts.Cross-Exchange Short Hedges: Large accounts often open a 1:1 Short on Futures to offset Spot volume holding. If price drops 20%, their Spot loss is fully offset by Futures gains.
🚀 3-Step Strategy to Actually Make Money with $100
1️⃣ Shift Goal: Capital Growth Over Ranking
Treat tournament windows as high-volatility liquidity events.
Execute 1 to 2 clean range trades per day.Target realistic 1.5% to 3% net profit per setup ($1.50–$3.00 gains).Compound your account safely without burning fees on high-frequency churn.
2️⃣ Target Base Qualification Tiers ("Lucky Draws / Pool Share")
Look for promo tiers requiring low total volume (e.g., $500 threshold).
Execution: Buy & sell $100 roughly 3 times (~$600 total volume).Fee Cost: Only ~$0.45 total using BNB fee discounts.Result: Qualify for equal-share reward pools while risking under 50 cents.
3️⃣ Strict Execution Protocol
Limit Orders Only: Avoid taker fees—never market buy/sell.Hard Stops: Cut positions manually if structural support breaks (e.g., key support levels like $0.0610 for HOLO).Patience: Once your target limit order fills, step away and wait for the next range setup rather than forcing immediate re-entries.
💬 What’s your strategy during volume tournaments? Do you chase the leaderboard or focus on organic compounding? Drop your thoughts below! 👇
#CryptoTrading #RiskManagement #BinanceSquare #TradingStrategy #Altcoins $VTHO $SUPER $MOVE
256
·
--
පරිවර්තනය බලන්න
Join the [ENSO Trading Tournament](https://www.binance.com/en/activity/trading-competition/spot-altcoin-festival-wave-ENSO1/Main-Reward) ;) Easy money! Buy and sell... Not much time left. $ENSO $KITE $FIL
{spot}(FILUSDT)
{spot}(KITEUSDT)
{spot}(ENSOUSDT)
Join the ENSO Trading Tournament ;) Easy money! Buy and sell... Not much time left. $ENSO $KITE $FIL
1
1
524
·
--
පරිවර්තනය බලන්න
"Keep rollin', rollin', rollin', rollin'!" 🎶🧢
$LA - join [LA](https://www.binance.com/en/square/post/362425615135326)👈🥺😁
{spot}(LAUSDT)
{spot}(ADAUSDT)
{spot}(TUSDT)
---
🎵 Audio Credits & Copyright:
Song: Rollin' (Air Raid Vehicle)
Artist: Limp Bizkit
Writers: Fred Durst, Wes Borland, Sam Rivers, John Otto
Producers: Terry Date, Limp Bizkit
Release Year: 2000
Rights / Label: ℗ Flip Records / Interscope Records
"Keep rollin', rollin', rollin', rollin'!" 🎶🧢
$LA - join LA👈🥺😁
---
🎵 Audio Credits & Copyright:
Song: Rollin' (Air Raid Vehicle)
Artist: Limp Bizkit
Writers: Fred Durst, Wes Borland, Sam Rivers, John Otto
Producers: Terry Date, Limp Bizkit
Release Year: 2000
Rights / Label: ℗ Flip Records / Interscope Records
$LA - join LA👈🥺😁
---
🎵 Audio Credits & Copyright:
Song: Rollin' (Air Raid Vehicle)
Artist: Limp Bizkit
Writers: Fred Durst, Wes Borland, Sam Rivers, John Otto
Producers: Terry Date, Limp Bizkit
Release Year: 2000
Rights / Label: ℗ Flip Records / Interscope Records
269
·
--
පරිවර්තනය බලන්න
Executing an ultra-disciplined 5-minute cycle loop with a fixed $120 USDT allocation. Direct market/limit churn every 5 minutes—irrespective of short-term price fluctuations—to maximize total tournament volume before the deadline!
$ENSO
{spot}(ENSOUSDT)
Executing an ultra-disciplined 5-minute cycle loop with a fixed $120 USDT allocation. Direct market/limit churn every 5 minutes—irrespective of short-term price fluctuations—to maximize total tournament volume before the deadline!
$ENSO
$ENSO
84
2
1.3k
·
--
පරිවර්තනය බලන්න
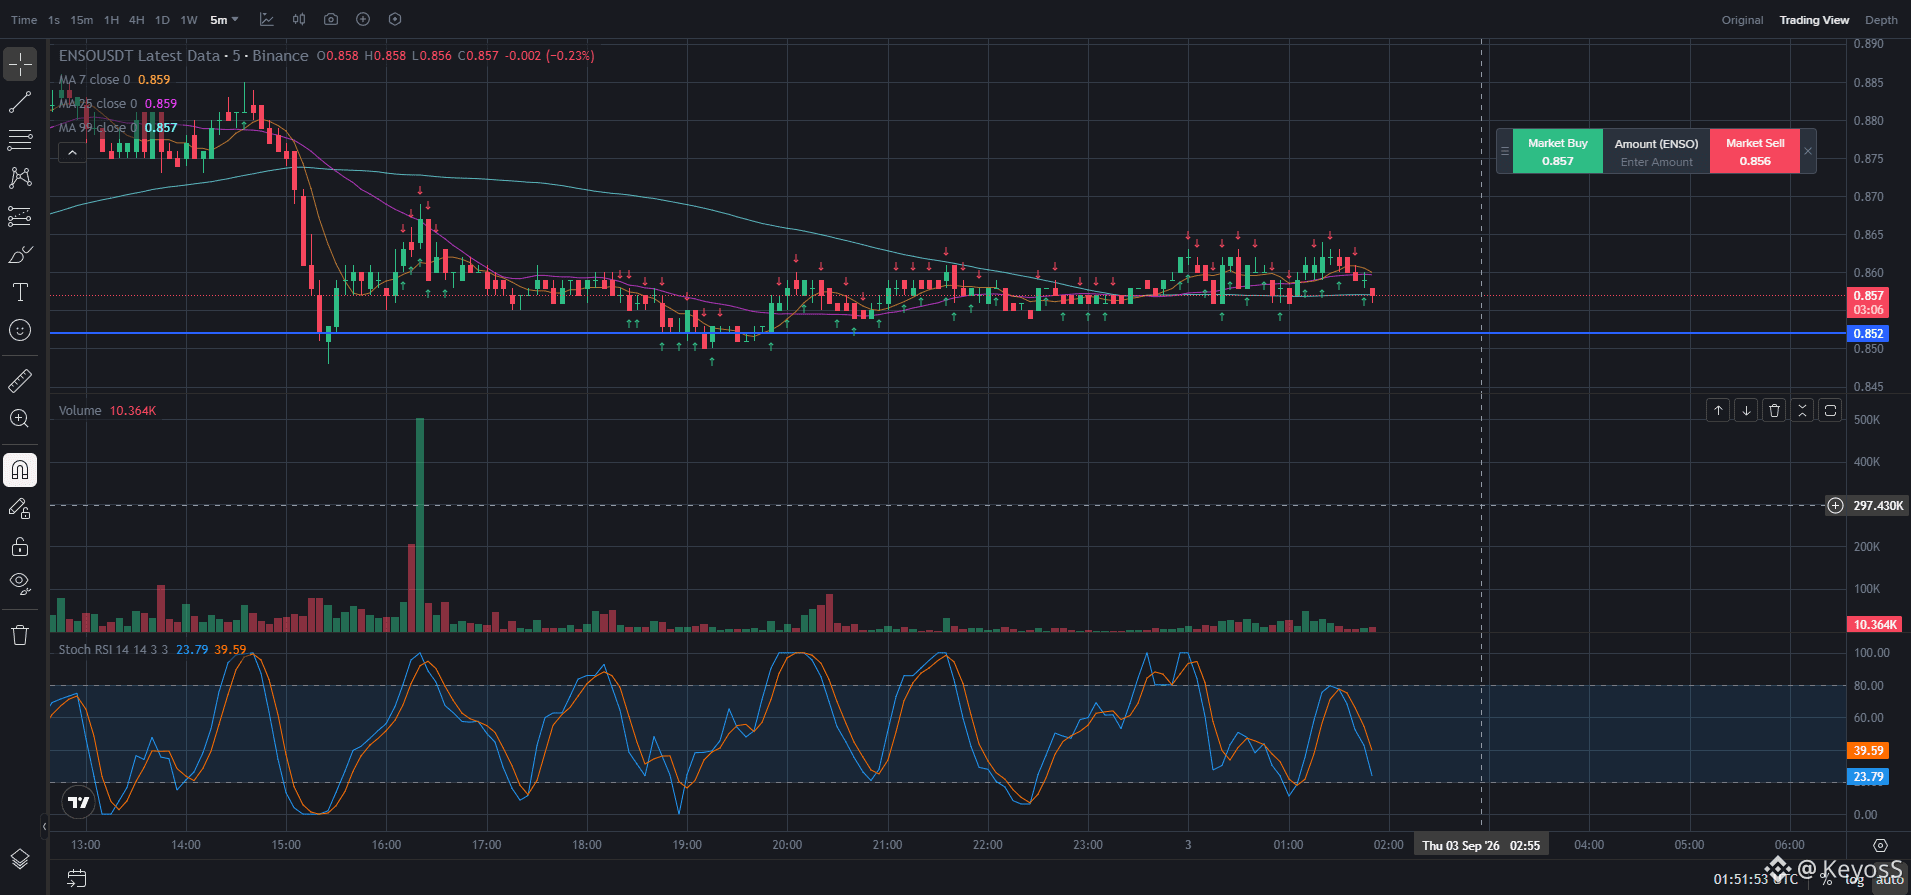
🚀 5-Minute Recurring Cycle Strategy: Navigating $ENSO Volume Sprint 📊
With under 42 hours remaining in the ENSO Trading Tournament, I'm executing a 5-minute recurring limit-churn strategy to maintain steady volume accumulation while managing downside risk. Here is a quick breakdown of current market conditions and execution logic:
1️⃣ Order Book & Liquidity Alignment Current order book depth shows stacked bid support around $0.852 – $0.857, providing an immediate liquidity cushion. Heavy ask clusters near $0.865 – $0.872 mark localized overhead resistance.
2️⃣ Strategic Execution By executing structured 5-minute recurring buy/sell cycles ($120 USDT allocation), the goal is to capture micro-fluctuations around immediate support ($0.857 entry) and target upper ticks ($0.859 - $0.860 sell) to cover fees via BNB discounts.
3️⃣ Market Outlook A holding pattern above $0.855 keeps the short-term structure intact for a retest toward $0.865+.
What strategy are you using for the tournament sprint? Let me know below! 👇
#ENSO #BinanceSquare #CryptoTrading #DeFi #TradingStrategy
🚀 5-Minute Recurring Cycle Strategy: Navigating $ENSO Volume Sprint 📊
With under 42 hours remaining in the ENSO Trading Tournament, I'm executing a 5-minute recurring limit-churn strategy to maintain steady volume accumulation while managing downside risk. Here is a quick breakdown of current market conditions and execution logic:
1️⃣ Order Book & Liquidity Alignment Current order book depth shows stacked bid support around $0.852 – $0.857, providing an immediate liquidity cushion. Heavy ask clusters near $0.865 – $0.872 mark localized overhead resistance.
2️⃣ Strategic Execution By executing structured 5-minute recurring buy/sell cycles ($120 USDT allocation), the goal is to capture micro-fluctuations around immediate support ($0.857 entry) and target upper ticks ($0.859 - $0.860 sell) to cover fees via BNB discounts.
3️⃣ Market Outlook A holding pattern above $0.855 keeps the short-term structure intact for a retest toward $0.865+.
What strategy are you using for the tournament sprint? Let me know below! 👇
#ENSO #BinanceSquare #CryptoTrading #DeFi #TradingStrategy
With under 42 hours remaining in the ENSO Trading Tournament, I'm executing a 5-minute recurring limit-churn strategy to maintain steady volume accumulation while managing downside risk. Here is a quick breakdown of current market conditions and execution logic:
1️⃣ Order Book & Liquidity Alignment Current order book depth shows stacked bid support around $0.852 – $0.857, providing an immediate liquidity cushion. Heavy ask clusters near $0.865 – $0.872 mark localized overhead resistance.
2️⃣ Strategic Execution By executing structured 5-minute recurring buy/sell cycles ($120 USDT allocation), the goal is to capture micro-fluctuations around immediate support ($0.857 entry) and target upper ticks ($0.859 - $0.860 sell) to cover fees via BNB discounts.
3️⃣ Market Outlook A holding pattern above $0.855 keeps the short-term structure intact for a retest toward $0.865+.
What strategy are you using for the tournament sprint? Let me know below! 👇
#ENSO #BinanceSquare #CryptoTrading #DeFi #TradingStrategy
151
·
--
පරිවර්තනය බලන්න
Years of experience building scalable platforms for 1M+ users taught me one thing: systems beat luck every single time.
Combining an MBA background with technical execution, I apply the exact same corporate frameworks to track daily Binance task execution, capital risk, and yield metrics.
If you build a reliable engine for {1}, scaling it up is pure execution.
How are you organizing your daily Web3 activities?
Post your setup or spreadsheet in the comments;
I’d love to trade templates! 💬👇
#Binance #SystemsDesign #CryptoTrackers #ProductStrategy #CryptoHumor
Years of experience building scalable platforms for 1M+ users taught me one thing: systems beat luck every single time.
Combining an MBA background with technical execution, I apply the exact same corporate frameworks to track daily Binance task execution, capital risk, and yield metrics.
If you build a reliable engine for {1}, scaling it up is pure execution.
How are you organizing your daily Web3 activities?
Post your setup or spreadsheet in the comments;
I’d love to trade templates! 💬👇
#Binance #SystemsDesign #CryptoTrackers #ProductStrategy #CryptoHumor
Combining an MBA background with technical execution, I apply the exact same corporate frameworks to track daily Binance task execution, capital risk, and yield metrics.
If you build a reliable engine for {1}, scaling it up is pure execution.
How are you organizing your daily Web3 activities?
Post your setup or spreadsheet in the comments;
I’d love to trade templates! 💬👇
#Binance #SystemsDesign #CryptoTrackers #ProductStrategy #CryptoHumor
74
·
--
පරිවර්තනය බලන්න
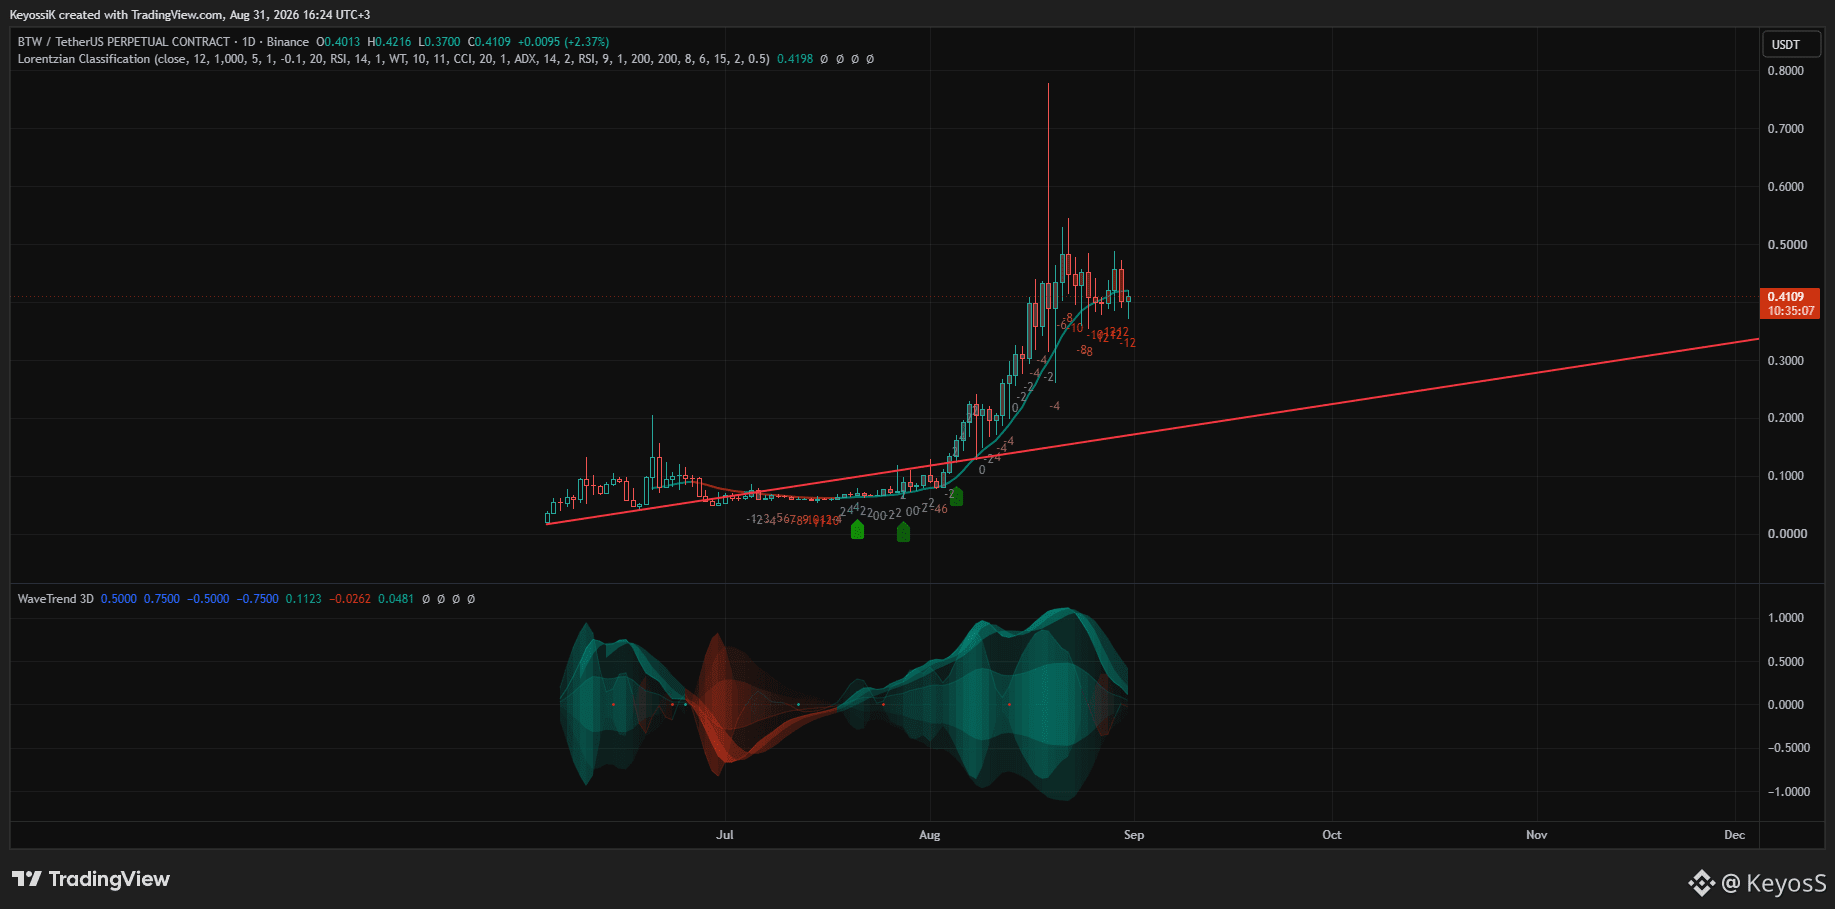
$BTW Do you see any trading opportunities?
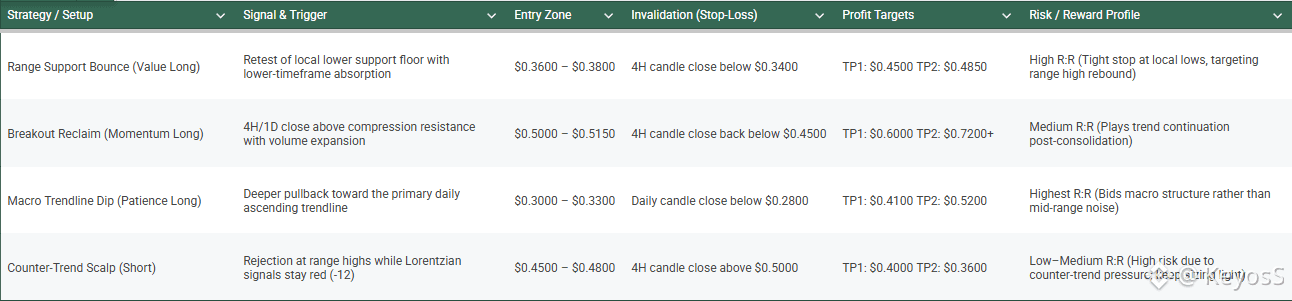
With BTW compressing around $0.4096 between range resistance ($0.50) and local support ($0.36), avoiding position-taking in the middle of the range is critical.
Check out the trade setup matrix above breakdown of entries, invalidation levels, and profit targets across momentum, value, and macro plays!
Are you bidding the $0.36 support sweep or waiting for the $0.50 breakout confirmation? Drop your thoughts loud below! 👇
{future}(BTWUSDT)
$BTW Do you see any trading opportunities?
With BTW compressing around $0.4096 between range resistance ($0.50) and local support ($0.36), avoiding position-taking in the middle of the range is critical.
Check out the trade setup matrix above breakdown of entries, invalidation levels, and profit targets across momentum, value, and macro plays!
Are you bidding the $0.36 support sweep or waiting for the $0.50 breakout confirmation? Drop your thoughts loud below! 👇
With BTW compressing around $0.4096 between range resistance ($0.50) and local support ($0.36), avoiding position-taking in the middle of the range is critical.
Check out the trade setup matrix above breakdown of entries, invalidation levels, and profit targets across momentum, value, and macro plays!
Are you bidding the $0.36 support sweep or waiting for the $0.50 breakout confirmation? Drop your thoughts loud below! 👇
310
·
--
$VELVET
{future}(VELVETUSDT)
තාක්ෂණික විශ්ලේෂණය: පතුලක් ගොඩනැගීමක්ද, නැත්නම් Dead-Cat Bounce එකක්ද?
ඉහත $0.90 සිට $0.1084 දක්වා වූ දැඩි 75%+ liquidation පහත වැටීමෙන් පසු, VELVET මේ වනවිට අඩු-volatility පරාසයක පැත්තකට පැද්දෙමින් පවතී.
මෙන්න කාල රාමු අනුව තාක්ෂණික විස්තර:
● ප්රවණතා සන්දර්භය (1D): මිල $0.9126 සහ $1.2473 හි මැක්රෝ ප්රතිරෝධ කලාපයන්ට වඩා බොහෝම පහළින් වෙළඳාම් කරයි. WaveTrend සහ Lorentzian දර්ශක තවමත් දැඩි bearish තත්ත්වයේ පවතී (-12 signal density).
● වෙළඳපොළ ව්යුහය (4H/1H): $0.1080 ආසන්නයේ Flatline මිල ක්රියාකාරිත්වය පෙන්වන්නේ ක්ෂණික panic selling එක නතර වී ඇති බවයි. නමුත් මිලදී ගැනීමේ වශය (buying volume) අතිශය අඩුය.
● ප්රධාන ආධාරක මට්ටම: $0.0900 ආරක්ෂා කිරීම අත්යවශ්යයි—නව සියලු-කාල ඉතිහාසික පහළ (all-time lows) මුද්රණය නොවීමට.
වෙළඳාම ඇගයීම: ඉතා දැඩි deleveraging සිදුවීමකට පසු ඇති පැත්තක පැද්දීම බොහෝ විට මුල් පතුල සොයන්නන්ව රවටයි. ස්ථිර ප්රතිසාධනයක් සඳහා, trend reversal එක තහවුරු කිරීමට පෙර $0.20 ව්යුහාත්මක මට්ටම (structural level) ඉහළට නැවත අල්ලාගැනීම (reclaim) ඉහළ-volume මගින් විය යුතුය.
ඔබ සනාථ කරන ලද $0.20 breakout එකක් බලා සිටිනවද, නැත්නම් $0.0900 ආධාරක බිම (support floor) මත scalp bids දමනවද? ඔබේ වෙළඳ සැලැස්ම පහළින් දාන්න! 👇
$CLO $NIL
{future}(NILUSDT)
{future}(CLOUSDT)
$VELVET
තාක්ෂණික විශ්ලේෂණය: පතුලක් ගොඩනැගීමක්ද, නැත්නම් Dead-Cat Bounce එකක්ද?
ඉහත $0.90 සිට $0.1084 දක්වා වූ දැඩි 75%+ liquidation පහත වැටීමෙන් පසු, VELVET මේ වනවිට අඩු-volatility පරාසයක පැත්තකට පැද්දෙමින් පවතී.
මෙන්න කාල රාමු අනුව තාක්ෂණික විස්තර:
● ප්රවණතා සන්දර්භය (1D): මිල $0.9126 සහ $1.2473 හි මැක්රෝ ප්රතිරෝධ කලාපයන්ට වඩා බොහෝම පහළින් වෙළඳාම් කරයි. WaveTrend සහ Lorentzian දර්ශක තවමත් දැඩි bearish තත්ත්වයේ පවතී (-12 signal density).
● වෙළඳපොළ ව්යුහය (4H/1H): $0.1080 ආසන්නයේ Flatline මිල ක්රියාකාරිත්වය පෙන්වන්නේ ක්ෂණික panic selling එක නතර වී ඇති බවයි. නමුත් මිලදී ගැනීමේ වශය (buying volume) අතිශය අඩුය.
● ප්රධාන ආධාරක මට්ටම: $0.0900 ආරක්ෂා කිරීම අත්යවශ්යයි—නව සියලු-කාල ඉතිහාසික පහළ (all-time lows) මුද්රණය නොවීමට.
වෙළඳාම ඇගයීම: ඉතා දැඩි deleveraging සිදුවීමකට පසු ඇති පැත්තක පැද්දීම බොහෝ විට මුල් පතුල සොයන්නන්ව රවටයි. ස්ථිර ප්රතිසාධනයක් සඳහා, trend reversal එක තහවුරු කිරීමට පෙර $0.20 ව්යුහාත්මක මට්ටම (structural level) ඉහළට නැවත අල්ලාගැනීම (reclaim) ඉහළ-volume මගින් විය යුතුය.
ඔබ සනාථ කරන ලද $0.20 breakout එකක් බලා සිටිනවද, නැත්නම් $0.0900 ආධාරක බිම (support floor) මත scalp bids දමනවද? ඔබේ වෙළඳ සැලැස්ම පහළින් දාන්න! 👇
$CLO $NIL
තාක්ෂණික විශ්ලේෂණය: පතුලක් ගොඩනැගීමක්ද, නැත්නම් Dead-Cat Bounce එකක්ද?
ඉහත $0.90 සිට $0.1084 දක්වා වූ දැඩි 75%+ liquidation පහත වැටීමෙන් පසු, VELVET මේ වනවිට අඩු-volatility පරාසයක පැත්තකට පැද්දෙමින් පවතී.
මෙන්න කාල රාමු අනුව තාක්ෂණික විස්තර:
● ප්රවණතා සන්දර්භය (1D): මිල $0.9126 සහ $1.2473 හි මැක්රෝ ප්රතිරෝධ කලාපයන්ට වඩා බොහෝම පහළින් වෙළඳාම් කරයි. WaveTrend සහ Lorentzian දර්ශක තවමත් දැඩි bearish තත්ත්වයේ පවතී (-12 signal density).
● වෙළඳපොළ ව්යුහය (4H/1H): $0.1080 ආසන්නයේ Flatline මිල ක්රියාකාරිත්වය පෙන්වන්නේ ක්ෂණික panic selling එක නතර වී ඇති බවයි. නමුත් මිලදී ගැනීමේ වශය (buying volume) අතිශය අඩුය.
● ප්රධාන ආධාරක මට්ටම: $0.0900 ආරක්ෂා කිරීම අත්යවශ්යයි—නව සියලු-කාල ඉතිහාසික පහළ (all-time lows) මුද්රණය නොවීමට.
වෙළඳාම ඇගයීම: ඉතා දැඩි deleveraging සිදුවීමකට පසු ඇති පැත්තක පැද්දීම බොහෝ විට මුල් පතුල සොයන්නන්ව රවටයි. ස්ථිර ප්රතිසාධනයක් සඳහා, trend reversal එක තහවුරු කිරීමට පෙර $0.20 ව්යුහාත්මක මට්ටම (structural level) ඉහළට නැවත අල්ලාගැනීම (reclaim) ඉහළ-volume මගින් විය යුතුය.
ඔබ සනාථ කරන ලද $0.20 breakout එකක් බලා සිටිනවද, නැත්නම් $0.0900 ආධාරක බිම (support floor) මත scalp bids දමනවද? ඔබේ වෙළඳ සැලැස්ම පහළින් දාන්න! 👇
$CLO $NIL
🔴 Bearish Continuation
12%
🟢 Bottom Fishing
77%
🟡 Waiting for Confirmation
11%
35 ඡන්ද • ඡන්දය අවසන්
1
1.9k
·
--
ලිපිය
පරිවර්තනය බලන්න
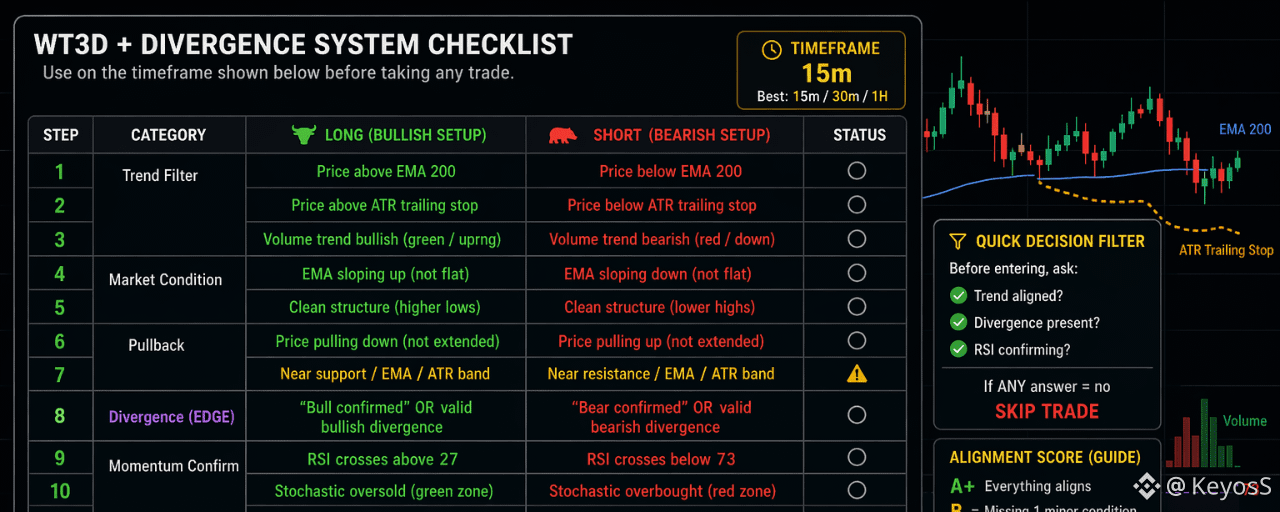
Mastering High-Probability Entries: My WT3D + Divergence ChecklistIf you are trading lower timeframes without a rigid checklist, you are essentially gambling with your equity. Market noise will catch you off guard every single time.
To keep my trade execution systematic, I use a simple confluence framework to filter out low-probability setups before taking a position. Here is how I structure my execution on the 15m to 1H charts:
1. Trend Alignment (Steps 1–5)
I never trade against the broader momentum. Before considering an entry trigger, I confirm directional bias:
Dynamic Filters: For longs, price must trade above the 200 EMA and the ATR trailing stop. The opposite applies to short positions.
EMA Slope Check: If the 200 EMA is flat, I stay out. Range-bound chop creates far too many false divergence signals.
Structure: I look for clean market structure—higher lows for bullish setups, lower highs for bearish ones.
2. Location & Divergence Edge (Steps 6–8)
Chasing extended green or red candles is a quick way to destroy your risk-to-reward ratio.
Pullback Zone: I wait patiently for price to pull back directly into the dynamic Support/Resistance area or the EMA/ATR band.
The Edge: I look for a confirmed regular bullish or bearish divergence between price action and my momentum oscillators.
3. Momentum & Execution Trigger (Steps 9–16)
Once trend and location align, momentum gives the final green light:
Oscillators: I wait for an RSI cross (>27 for long, <73 for short) combined with Stochastic confirmation in the oversold or overbought zones.
Strict Cancellation Rule: If market structure breaks before the signal candle closes, the trade is immediately invalidated and skipped.
4. Risk Parameters
Account Exposure: Never risk more than 1–2% of total capital per trade.
Stop Placement: Positioned strictly beyond the ATR band or recent divergence extreme.
The Filter Rule: If Trend, Divergence, OR RSI fails to line up → Skip the trade.
Consistency comes from executing a high-probability edge repeatedly with discipline. Wait for $A+$ setups and let the compound effect do the work.
What does your execution checklist look like? Drop your rules in the comments! 👇
$BTR $TAC $BMT
{future}(BMTUSDT)
{future}(TACUSDT)
{future}(BTRUSDT)
Mastering High-Probability Entries: My WT3D + Divergence Checklist
If you are trading lower timeframes without a rigid checklist, you are essentially gambling with your equity. Market noise will catch you off guard every single time.
To keep my trade execution systematic, I use a simple confluence framework to filter out low-probability setups before taking a position. Here is how I structure my execution on the 15m to 1H charts:
1. Trend Alignment (Steps 1–5)
I never trade against the broader momentum. Before considering an entry trigger, I confirm directional bias:
Dynamic Filters: For longs, price must trade above the 200 EMA and the ATR trailing stop. The opposite applies to short positions.
EMA Slope Check: If the 200 EMA is flat, I stay out. Range-bound chop creates far too many false divergence signals.
Structure: I look for clean market structure—higher lows for bullish setups, lower highs for bearish ones.
2. Location & Divergence Edge (Steps 6–8)
Chasing extended green or red candles is a quick way to destroy your risk-to-reward ratio.
Pullback Zone: I wait patiently for price to pull back directly into the dynamic Support/Resistance area or the EMA/ATR band.
The Edge: I look for a confirmed regular bullish or bearish divergence between price action and my momentum oscillators.
3. Momentum & Execution Trigger (Steps 9–16)
Once trend and location align, momentum gives the final green light:
Oscillators: I wait for an RSI cross (>27 for long, <73 for short) combined with Stochastic confirmation in the oversold or overbought zones.
Strict Cancellation Rule: If market structure breaks before the signal candle closes, the trade is immediately invalidated and skipped.
4. Risk Parameters
Account Exposure: Never risk more than 1–2% of total capital per trade.
Stop Placement: Positioned strictly beyond the ATR band or recent divergence extreme.
The Filter Rule: If Trend, Divergence, OR RSI fails to line up → Skip the trade.
Consistency comes from executing a high-probability edge repeatedly with discipline. Wait for $A+$ setups and let the compound effect do the work.
What does your execution checklist look like? Drop your rules in the comments! 👇
$BTR $TAC $BMT
To keep my trade execution systematic, I use a simple confluence framework to filter out low-probability setups before taking a position. Here is how I structure my execution on the 15m to 1H charts:
1. Trend Alignment (Steps 1–5)
I never trade against the broader momentum. Before considering an entry trigger, I confirm directional bias:
Dynamic Filters: For longs, price must trade above the 200 EMA and the ATR trailing stop. The opposite applies to short positions.
EMA Slope Check: If the 200 EMA is flat, I stay out. Range-bound chop creates far too many false divergence signals.
Structure: I look for clean market structure—higher lows for bullish setups, lower highs for bearish ones.
2. Location & Divergence Edge (Steps 6–8)
Chasing extended green or red candles is a quick way to destroy your risk-to-reward ratio.
Pullback Zone: I wait patiently for price to pull back directly into the dynamic Support/Resistance area or the EMA/ATR band.
The Edge: I look for a confirmed regular bullish or bearish divergence between price action and my momentum oscillators.
3. Momentum & Execution Trigger (Steps 9–16)
Once trend and location align, momentum gives the final green light:
Oscillators: I wait for an RSI cross (>27 for long, <73 for short) combined with Stochastic confirmation in the oversold or overbought zones.
Strict Cancellation Rule: If market structure breaks before the signal candle closes, the trade is immediately invalidated and skipped.
4. Risk Parameters
Account Exposure: Never risk more than 1–2% of total capital per trade.
Stop Placement: Positioned strictly beyond the ATR band or recent divergence extreme.
The Filter Rule: If Trend, Divergence, OR RSI fails to line up → Skip the trade.
Consistency comes from executing a high-probability edge repeatedly with discipline. Wait for $A+$ setups and let the compound effect do the work.
What does your execution checklist look like? Drop your rules in the comments! 👇
$BTR $TAC $BMT
1
292
·
--
සත්යායනය කළ
පරිවර්තනය බලන්න
@Dusk_Foundation #dusk
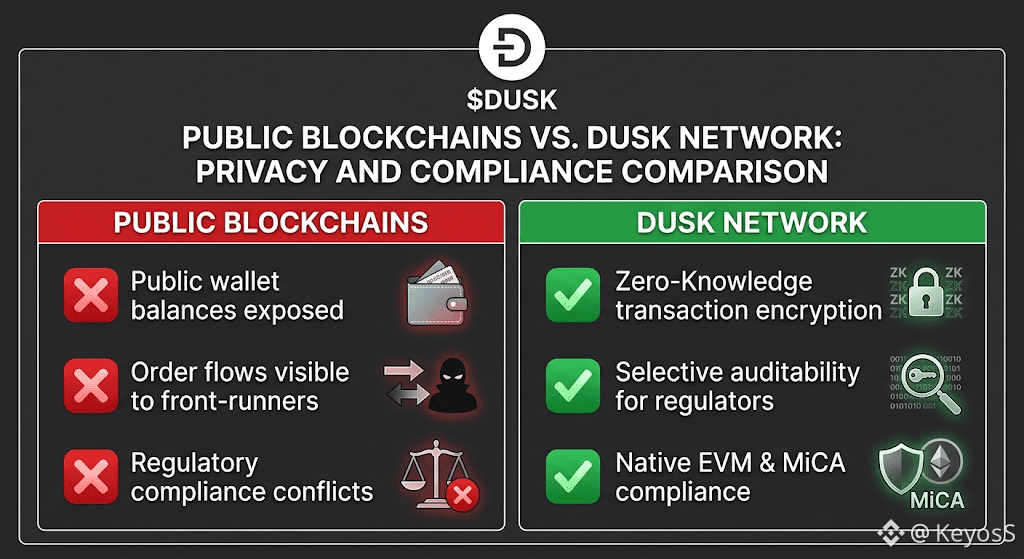
Why is pure transparency a major bottleneck for institutional real-world asset (RWA) tokenization?
Public block explorers leak sensitive execution prices, order flows, and portfolio balances to front-runners. For regulated capital markets managing traditional financial instruments, this total visibility is a non-starter.
How @Dusk_Foundation resolves this infrastructure gap:
🛡️ Zero-Knowledge Privacy: Shields sensitive balance updates and trade amounts from public scrutiny via native primitives.
📑 Auditable Compliance: Generates zero-knowledge proofs allowing regulators to verify compliance without broadcasting underlying private data.
⚙️ Standard EVM Tooling: With the DuskEVM testnet live, Solidity developers can build compliant dApps using standard tools.
Combining protocol-level privacy with compliance is the key to onboarding modern capital markets to Web3.
$DUSK $STX $ONG
{future}(ONGUSDT)
{future}(STXUSDT)
{future}(DUSKUSDT)
@Dusk #dusk
Why is pure transparency a major bottleneck for institutional real-world asset (RWA) tokenization?
Public block explorers leak sensitive execution prices, order flows, and portfolio balances to front-runners. For regulated capital markets managing traditional financial instruments, this total visibility is a non-starter.
How @Dusk resolves this infrastructure gap:
🛡️ Zero-Knowledge Privacy: Shields sensitive balance updates and trade amounts from public scrutiny via native primitives.
📑 Auditable Compliance: Generates zero-knowledge proofs allowing regulators to verify compliance without broadcasting underlying private data.
⚙️ Standard EVM Tooling: With the DuskEVM testnet live, Solidity developers can build compliant dApps using standard tools.
Combining protocol-level privacy with compliance is the key to onboarding modern capital markets to Web3.
$DUSK $STX $ONG
Why is pure transparency a major bottleneck for institutional real-world asset (RWA) tokenization?
Public block explorers leak sensitive execution prices, order flows, and portfolio balances to front-runners. For regulated capital markets managing traditional financial instruments, this total visibility is a non-starter.
How @Dusk resolves this infrastructure gap:
🛡️ Zero-Knowledge Privacy: Shields sensitive balance updates and trade amounts from public scrutiny via native primitives.
📑 Auditable Compliance: Generates zero-knowledge proofs allowing regulators to verify compliance without broadcasting underlying private data.
⚙️ Standard EVM Tooling: With the DuskEVM testnet live, Solidity developers can build compliant dApps using standard tools.
Combining protocol-level privacy with compliance is the key to onboarding modern capital markets to Web3.
$DUSK $STX $ONG
🛡️ Zero-Knowledge Privacy
0%
📑 Auditable Compliance
50%
⚙️ Standard EVM
50%
2 ඡන්ද • ඡන්දය අවසන්
1
892
·
--
#dusk @Dusk_Foundation
နှစ်များအတွင်း၊ privacy ကိုကာကွယ်နိုင်သည့် blockchain များသည် အထူးပြုမဟုတ်သည့် EVM မဟုတ်သော ဘာသာစကားများကို သင်ယူရန် အတင်းအကျပ်ဖြစ်စေသောကြောင့် developer friction ကြုံခဲ့ရသည်။
DuskEVM သည် အဖွဲ့အစည်းများအတွက် စတင်အသုံးချခြင်းဆိုင်ရာ ဇာတ်ကြောင်းကို ပြောင်းလဲပေးသည်။
⚙️ စံသတ်မှတ် EVM Tooling - Developers များသည် စံ Solidity workflow များကို အသုံးပြု၍ zero-knowledge smart contracts များကို ရေးသားပြီး deploy လုပ်နိုင်သည်။
🛡️ Embedded Confidentiality - Native privacy primitives များက စမတ်ကန်ထရက်အဆင့်တွင် transaction amount များနှင့် balance များကို ဖုံးကွယ်ပေးသည်။
📑 Automated Compliance (XSC) - Built-in token standards များက ရင်းနှီးမြှုပ်နှံသူ၏ eligibility နှင့် transfer rules များကို onchain ပေါ်တွင် တိုက်ရိုက် enforce လုပ်သည်။
zero-knowledge compliance ကို အဓိကအဖြစ်ထားပြီး developer friction ကို ဖယ်ရှားခြင်းက DUSK ကို လက်တွေ့ကမ္ဘာ့ ပိုင်ဆိုင်မှုများကို လျင်မြန်စွာ လက်ခံသုံးစွဲနိုင်အောင် တွန်းပို့ပေးသည်။
$PROM $TUT $DUSK
{future}(DUSKUSDT)
{spot}(TUTUSDT)
{future}(PROMUSDT)
#dusk @Dusk
နှစ်များအတွင်း၊ privacy ကိုကာကွယ်နိုင်သည့် blockchain များသည် အထူးပြုမဟုတ်သည့် EVM မဟုတ်သော ဘာသာစကားများကို သင်ယူရန် အတင်းအကျပ်ဖြစ်စေသောကြောင့် developer friction ကြုံခဲ့ရသည်။
DuskEVM သည် အဖွဲ့အစည်းများအတွက် စတင်အသုံးချခြင်းဆိုင်ရာ ဇာတ်ကြောင်းကို ပြောင်းလဲပေးသည်။
⚙️ စံသတ်မှတ် EVM Tooling - Developers များသည် စံ Solidity workflow များကို အသုံးပြု၍ zero-knowledge smart contracts များကို ရေးသားပြီး deploy လုပ်နိုင်သည်။
🛡️ Embedded Confidentiality - Native privacy primitives များက စမတ်ကန်ထရက်အဆင့်တွင် transaction amount များနှင့် balance များကို ဖုံးကွယ်ပေးသည်။
📑 Automated Compliance (XSC) - Built-in token standards များက ရင်းနှီးမြှုပ်နှံသူ၏ eligibility နှင့် transfer rules များကို onchain ပေါ်တွင် တိုက်ရိုက် enforce လုပ်သည်။
zero-knowledge compliance ကို အဓိကအဖြစ်ထားပြီး developer friction ကို ဖယ်ရှားခြင်းက DUSK ကို လက်တွေ့ကမ္ဘာ့ ပိုင်ဆိုင်မှုများကို လျင်မြန်စွာ လက်ခံသုံးစွဲနိုင်အောင် တွန်းပို့ပေးသည်။
$PROM $TUT $DUSK
နှစ်များအတွင်း၊ privacy ကိုကာကွယ်နိုင်သည့် blockchain များသည် အထူးပြုမဟုတ်သည့် EVM မဟုတ်သော ဘာသာစကားများကို သင်ယူရန် အတင်းအကျပ်ဖြစ်စေသောကြောင့် developer friction ကြုံခဲ့ရသည်။
DuskEVM သည် အဖွဲ့အစည်းများအတွက် စတင်အသုံးချခြင်းဆိုင်ရာ ဇာတ်ကြောင်းကို ပြောင်းလဲပေးသည်။
⚙️ စံသတ်မှတ် EVM Tooling - Developers များသည် စံ Solidity workflow များကို အသုံးပြု၍ zero-knowledge smart contracts များကို ရေးသားပြီး deploy လုပ်နိုင်သည်။
🛡️ Embedded Confidentiality - Native privacy primitives များက စမတ်ကန်ထရက်အဆင့်တွင် transaction amount များနှင့် balance များကို ဖုံးကွယ်ပေးသည်။
📑 Automated Compliance (XSC) - Built-in token standards များက ရင်းနှီးမြှုပ်နှံသူ၏ eligibility နှင့် transfer rules များကို onchain ပေါ်တွင် တိုက်ရိုက် enforce လုပ်သည်။
zero-knowledge compliance ကို အဓိကအဖြစ်ထားပြီး developer friction ကို ဖယ်ရှားခြင်းက DUSK ကို လက်တွေ့ကမ္ဘာ့ ပိုင်ဆိုင်မှုများကို လျင်မြန်စွာ လက်ခံသုံးစွဲနိုင်အောင် တွန်းပို့ပေးသည်။
$PROM $TUT $DUSK
2
213
·
--
#dusk $DUSK @Dusk_Foundation
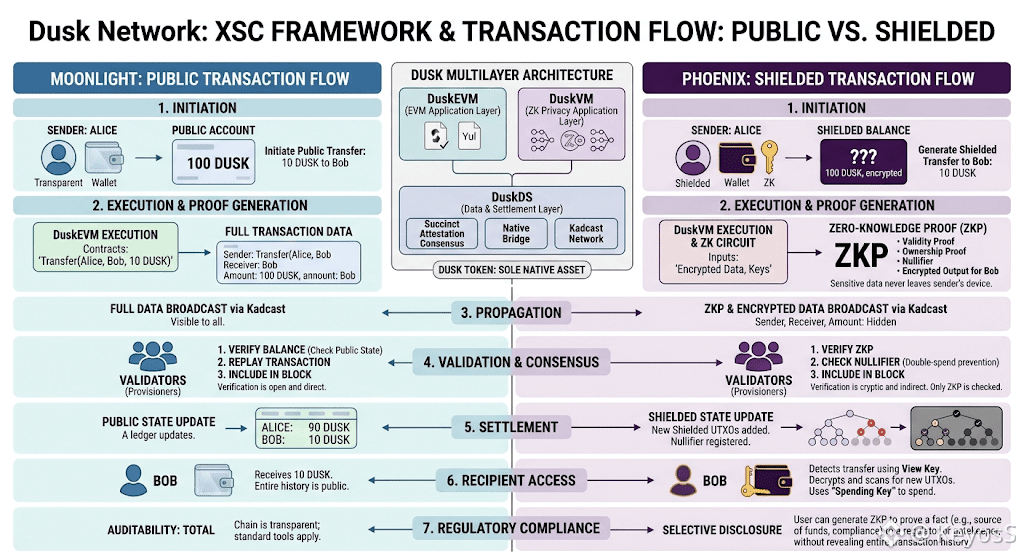
ဂန္တဝင် အာက်ဆက်ဝပ်ပါကာများသည် အဖွဲ့အစည်းဆိုင်ရာ လက်ခံမှုအတွက် ဘာကြောင့် လုံလောက်မနေပါသလဲ?
ရိုးရာဘဏ္ဍာရေးအဖွဲ့အစည်းများက Web3 ကိုကြည့်တဲ့အခါ အများပြည်သူ အော်ဒါအလှုပ်လှုပ်နှင့် ဝေါလက်ဘေလန်စ်များ (open wallet balances) သည် လက်ခံရန် မဖြစ်နိုင်တဲ့ အချက်တွေဖြစ်လာသည်။ အများပြည်သူ ဘလောက်အရှင်အိပ်ခ်ျများထံသို့ အရောင်းအဝယ် နည်းဗျူဟာများကို ထုတ်လွှင့်ခြင်းက အလွန်များပြားသော front-running အန္တရာယ်များကို ဖြစ်ပေါ်စေသည်။
Dusk က အဖွဲ့အစည်းဆိုင်ရာ အဆင့်မြင့် RWA များကို ဘယ်လို ကိုင်တွယ်လဲ:
📊 သီးသန့် ဖော်ပြမှု (Selective Disclosure): Hedger မှတစ်ဆင့် Zero-knowledge proofs များက အော်ဒါဘုတ်များကို ကုဒ်ဝှက်ထားပြီး စည်းမျဉ်းထိန်းချုပ်သူများကို လိုက်နာမှု (compliance) အတွက် တိုက်ရိုက် cryptographic အထောက်အထား ပေးသည်။
📜 သဘာဝ (Native) ဥပဒေရေးရာ Logic: XSC စံနှုန်းက ကော်ပိုရေးရှင်း အရေးယူမှုများ (corporate actions) နှင့် လွှဲပြောင်းမှု ကန့်သတ်ချက်များကို off-chain legal wrappers များကို အားမထားဘဲ on-chain ပေါ်တွင် တိုက်ရိုက် လုပ်ဆောင်သည်။
⚡ သတ်မှတ်ချက်အတိုင်း ပြီးပြည့်စုံသော Settlement: ချက်ချင်း settlement finality က counterparty clearing အန္တရာယ်များကို ဖယ်ရှားပေးသည်။
လိုက်နာမှုနှင့် ပေါင်းစပ်ထားသော အရွယ်အစားသီးသန့် လုံခြုံရေး (selective privacy) သည် အရင်းအနှီးဈေးကွက်များအတွက် ပျက်ကွက်နေသော တံတားဖြစ်သည်။
#dusk $DUSK @Dusk
ဂန္တဝင် အာက်ဆက်ဝပ်ပါကာများသည် အဖွဲ့အစည်းဆိုင်ရာ လက်ခံမှုအတွက် ဘာကြောင့် လုံလောက်မနေပါသလဲ?
ရိုးရာဘဏ္ဍာရေးအဖွဲ့အစည်းများက Web3 ကိုကြည့်တဲ့အခါ အများပြည်သူ အော်ဒါအလှုပ်လှုပ်နှင့် ဝေါလက်ဘေလန်စ်များ (open wallet balances) သည် လက်ခံရန် မဖြစ်နိုင်တဲ့ အချက်တွေဖြစ်လာသည်။ အများပြည်သူ ဘလောက်အရှင်အိပ်ခ်ျများထံသို့ အရောင်းအဝယ် နည်းဗျူဟာများကို ထုတ်လွှင့်ခြင်းက အလွန်များပြားသော front-running အန္တရာယ်များကို ဖြစ်ပေါ်စေသည်။
Dusk က အဖွဲ့အစည်းဆိုင်ရာ အဆင့်မြင့် RWA များကို ဘယ်လို ကိုင်တွယ်လဲ:
📊 သီးသန့် ဖော်ပြမှု (Selective Disclosure): Hedger မှတစ်ဆင့် Zero-knowledge proofs များက အော်ဒါဘုတ်များကို ကုဒ်ဝှက်ထားပြီး စည်းမျဉ်းထိန်းချုပ်သူများကို လိုက်နာမှု (compliance) အတွက် တိုက်ရိုက် cryptographic အထောက်အထား ပေးသည်။
📜 သဘာဝ (Native) ဥပဒေရေးရာ Logic: XSC စံနှုန်းက ကော်ပိုရေးရှင်း အရေးယူမှုများ (corporate actions) နှင့် လွှဲပြောင်းမှု ကန့်သတ်ချက်များကို off-chain legal wrappers များကို အားမထားဘဲ on-chain ပေါ်တွင် တိုက်ရိုက် လုပ်ဆောင်သည်။
⚡ သတ်မှတ်ချက်အတိုင်း ပြီးပြည့်စုံသော Settlement: ချက်ချင်း settlement finality က counterparty clearing အန္တရာယ်များကို ဖယ်ရှားပေးသည်။
လိုက်နာမှုနှင့် ပေါင်းစပ်ထားသော အရွယ်အစားသီးသန့် လုံခြုံရေး (selective privacy) သည် အရင်းအနှီးဈေးကွက်များအတွက် ပျက်ကွက်နေသော တံတားဖြစ်သည်။
ဂန္တဝင် အာက်ဆက်ဝပ်ပါကာများသည် အဖွဲ့အစည်းဆိုင်ရာ လက်ခံမှုအတွက် ဘာကြောင့် လုံလောက်မနေပါသလဲ?
ရိုးရာဘဏ္ဍာရေးအဖွဲ့အစည်းများက Web3 ကိုကြည့်တဲ့အခါ အများပြည်သူ အော်ဒါအလှုပ်လှုပ်နှင့် ဝေါလက်ဘေလန်စ်များ (open wallet balances) သည် လက်ခံရန် မဖြစ်နိုင်တဲ့ အချက်တွေဖြစ်လာသည်။ အများပြည်သူ ဘလောက်အရှင်အိပ်ခ်ျများထံသို့ အရောင်းအဝယ် နည်းဗျူဟာများကို ထုတ်လွှင့်ခြင်းက အလွန်များပြားသော front-running အန္တရာယ်များကို ဖြစ်ပေါ်စေသည်။
Dusk က အဖွဲ့အစည်းဆိုင်ရာ အဆင့်မြင့် RWA များကို ဘယ်လို ကိုင်တွယ်လဲ:
📊 သီးသန့် ဖော်ပြမှု (Selective Disclosure): Hedger မှတစ်ဆင့် Zero-knowledge proofs များက အော်ဒါဘုတ်များကို ကုဒ်ဝှက်ထားပြီး စည်းမျဉ်းထိန်းချုပ်သူများကို လိုက်နာမှု (compliance) အတွက် တိုက်ရိုက် cryptographic အထောက်အထား ပေးသည်။
📜 သဘာဝ (Native) ဥပဒေရေးရာ Logic: XSC စံနှုန်းက ကော်ပိုရေးရှင်း အရေးယူမှုများ (corporate actions) နှင့် လွှဲပြောင်းမှု ကန့်သတ်ချက်များကို off-chain legal wrappers များကို အားမထားဘဲ on-chain ပေါ်တွင် တိုက်ရိုက် လုပ်ဆောင်သည်။
⚡ သတ်မှတ်ချက်အတိုင်း ပြီးပြည့်စုံသော Settlement: ချက်ချင်း settlement finality က counterparty clearing အန္တရာယ်များကို ဖယ်ရှားပေးသည်။
လိုက်နာမှုနှင့် ပေါင်းစပ်ထားသော အရွယ်အစားသီးသန့် လုံခြုံရေး (selective privacy) သည် အရင်းအနှီးဈေးကွက်များအတွက် ပျက်ကွက်နေသော တံတားဖြစ်သည်။
88
·
--
#dusk $DUSK @Dusk_Foundation
අතිවිරූද්ධ (confidential) dApps යෙදවීම සඳහා කලින් සංකීර්ණ, non-EVM භාෂා ඉගෙන ගැනීමට අවශ්ය විය. DuskEVM එම අපහසුව ඉවත් කරයි.
නිර්මාණකරුවන්ට ප්රධාන වාසි:
🔹 සම්මත Solidity: ඔබ දැනටමත් දන්නා මෙවලම්, frameworks, සහ code bases භාවිතා කර ගොඩනඟන්න.
🔹 Embedded ZK Privacy: native Hedger සම්බන්ධතාවය හරහා පරිශීලක දත්ත ආරක්ෂා කරන්න.
🔹 Deterministic Finality: නියාමනයට යටත් ආයතනික ව්යාපාරික වෙළඳාම සඳහා ක්ෂණික settlement අවශ්යයි.
යහපත් Web3 සංවර්ධන මෙවලම් වෙත හුරුපුරුදු ආකාරයෙන් zero-knowledge අනුකූලතාව (compliance) ගෙන එන්නේ, $DUSK විසින් ආයතනික වර්ධනය බලගැන්වීමෙනි.
#dusk $DUSK @Dusk
අතිවිරූද්ධ (confidential) dApps යෙදවීම සඳහා කලින් සංකීර්ණ, non-EVM භාෂා ඉගෙන ගැනීමට අවශ්ය විය. DuskEVM එම අපහසුව ඉවත් කරයි.
නිර්මාණකරුවන්ට ප්රධාන වාසි:
🔹 සම්මත Solidity: ඔබ දැනටමත් දන්නා මෙවලම්, frameworks, සහ code bases භාවිතා කර ගොඩනඟන්න.
🔹 Embedded ZK Privacy: native Hedger සම්බන්ධතාවය හරහා පරිශීලක දත්ත ආරක්ෂා කරන්න.
🔹 Deterministic Finality: නියාමනයට යටත් ආයතනික ව්යාපාරික වෙළඳාම සඳහා ක්ෂණික settlement අවශ්යයි.
යහපත් Web3 සංවර්ධන මෙවලම් වෙත හුරුපුරුදු ආකාරයෙන් zero-knowledge අනුකූලතාව (compliance) ගෙන එන්නේ, $DUSK විසින් ආයතනික වර්ධනය බලගැන්වීමෙනි.
අතිවිරූද්ධ (confidential) dApps යෙදවීම සඳහා කලින් සංකීර්ණ, non-EVM භාෂා ඉගෙන ගැනීමට අවශ්ය විය. DuskEVM එම අපහසුව ඉවත් කරයි.
නිර්මාණකරුවන්ට ප්රධාන වාසි:
🔹 සම්මත Solidity: ඔබ දැනටමත් දන්නා මෙවලම්, frameworks, සහ code bases භාවිතා කර ගොඩනඟන්න.
🔹 Embedded ZK Privacy: native Hedger සම්බන්ධතාවය හරහා පරිශීලක දත්ත ආරක්ෂා කරන්න.
🔹 Deterministic Finality: නියාමනයට යටත් ආයතනික ව්යාපාරික වෙළඳාම සඳහා ක්ෂණික settlement අවශ්යයි.
යහපත් Web3 සංවර්ධන මෙවලම් වෙත හුරුපුරුදු ආකාරයෙන් zero-knowledge අනුකූලතාව (compliance) ගෙන එන්නේ, $DUSK විසින් ආයතනික වර්ධනය බලගැන්වීමෙනි.
75
·
--

1
192
·
--
පරිවර්තනය බලන්න
Adore You
Song by Cedric Gervais and Miley Cyrus ‧ 2014
Ah, hey, ah oh
$BABY , baby yeah, are you listenin'?
Wondering, where you've been, all my life
I just started living
Oh, baby are you listenin' oh?
When you say you love me
Know I love you more
When you say you need me
Know I need you more
Boy I adore you
I adore you
Baby, can ya hear me?
When I'm crying out, for you
I'm scared oh, so scared
When you're near me
I feel like I'm standing with an army
Of men armed with weapons, hey oh
...
Song: Adore You by Miley Cyrus
Lyrics: Written by Stacy Barthe & Oren Yoel
© 2013 RCA Records
$BABY
{future}(BABYUSDT)
Adore You
Song by Cedric Gervais and Miley Cyrus ‧ 2014
Ah, hey, ah oh
$BABY , baby yeah, are you listenin'?
Wondering, where you've been, all my life
I just started living
Oh, baby are you listenin' oh?
When you say you love me
Know I love you more
When you say you need me
Know I need you more
Boy I adore you
I adore you
Baby, can ya hear me?
When I'm crying out, for you
I'm scared oh, so scared
When you're near me
I feel like I'm standing with an army
Of men armed with weapons, hey oh
...
Song: Adore You by Miley Cyrus
Lyrics: Written by Stacy Barthe & Oren Yoel
© 2013 RCA Records
$BABY
Song by Cedric Gervais and Miley Cyrus ‧ 2014
Ah, hey, ah oh
$BABY , baby yeah, are you listenin'?
Wondering, where you've been, all my life
I just started living
Oh, baby are you listenin' oh?
When you say you love me
Know I love you more
When you say you need me
Know I need you more
Boy I adore you
I adore you
Baby, can ya hear me?
When I'm crying out, for you
I'm scared oh, so scared
When you're near me
I feel like I'm standing with an army
Of men armed with weapons, hey oh
...
Song: Adore You by Miley Cyrus
Lyrics: Written by Stacy Barthe & Oren Yoel
© 2013 RCA Records
$BABY
127
·
--
பாரம்பரிய நிதி நிலைத்தன்மைக்காக நிலையான-வருமான (fixed-income) சந்தைகளையே அதிகமாக நம்புகிறது; ஆனால் Web3 இன்னும் கணிக்க முடியாத மாறும் விகிதங்களால் ஆதிக்கப்படுகின்றது. @termmax இந்த கட்டமைப்பு இடைவெளியை மையமற்ற நிலையான விகித கடன்/வழங்கல் (borrowing/lending) மற்றும் ஆப்ஷன் (options) வர்த்தகத்தை இணைத்து சமாளிக்கிறது. ஆன்-செயினில் (on-chain) நிறுவன தர (institutional-grade) முதல்திறன் (capital efficiency)க்காக தீர்மானிக்கக்கூடிய (deterministic) வருமானங்களை நிறுவுவது மிக முக்கியம். #TermMax
பாரம்பரிய நிதி நிலைத்தன்மைக்காக நிலையான-வருமான (fixed-income) சந்தைகளையே அதிகமாக நம்புகிறது; ஆனால் Web3 இன்னும் கணிக்க முடியாத மாறும் விகிதங்களால் ஆதிக்கப்படுகின்றது. @TermMax இந்த கட்டமைப்பு இடைவெளியை மையமற்ற நிலையான விகித கடன்/வழங்கல் (borrowing/lending) மற்றும் ஆப்ஷன் (options) வர்த்தகத்தை இணைத்து சமாளிக்கிறது. ஆன்-செயினில் (on-chain) நிறுவன தர (institutional-grade) முதல்திறன் (capital efficiency)க்காக தீர்மானிக்கக்கூடிய (deterministic) வருமானங்களை நிறுவுவது மிக முக்கியம். #TermMax
50
තවත් අන්තර්ගතයන් ගවේෂණය කිරීමට ඇතුල් වන්න
Binance චතුරශ්රය හි ගෝලීය ක්රිප්ටෝ පරිශීලකයින් හා එක්වන්න
⚡️ ක්රිප්ටෝ පිළිබඳ නවතම සහ ප්රයෝජනවත් තොරතුරු ලබා ගන්න.
💬 ලොව විශාලතම ක්රිප්ටෝ හුවමාරුව මගින් විශ්වාස කෙරේ.
👍 සත්යායනය කරන ලද නිර්මාණකරුවන්ගෙන් සැබෑ විදසුන් සොයා ගන්න.
විද්යුත් තැපෑල / දුරකථන අංකය
නැගී එන මාතෘකා
FedRateWatch
523,154 views
2,557 සාකච්ඡා කරමින්
எங்கள் டிரெண்டிங் ஹாஷ்டாக் பிரச்சாரத்தில் போக்குவரத்து ரிவார்டை பகிர்ந்து வெல்லுங்கள்
✨தலைப்பு: FOMC செப்டம்பர், பெடின் அடுத்த நடவடிக்கை என்ன?
👉சேருவது எப்படி:
ஹாஷ்டாக் #FedRateWatch உடன் ஒரு குறுகிய பதிவையோ அல்லது கட்டுரையையோ வெளியிடுங்கள்
கீழுள்ள கோணங்களின் அடிப்படையில் உள்ளடக்கத்தை உருவாக்குங்கள்:
- ஆகஸ்ட் கோர் CPI மாதந்தோறும் 0.3% உயர்ந்தது; இந்த வாரம் 25bp உயர்வுக்கான வாய்ப்புகள் இப்போது சுமார் 90% ஆக உள்ளன. இந்த வாரம் வட்டி உயர்வு நடக்குமென நீங்கள் எதிர்பார்க்கிறீர்களா? அது ஒருமுறைதானா, அல்லது இன்னும் நீளமான வட்டி உயர்வு சுழற்சியின் தொடக்கமா?
- உயர்வு நடந்தால், BTC, டெக் பங்குகள், மற்றும் தங்கம் ஆகியவற்றுக்கு அது எப்படி தாக்கம் காட்டும்? உயர்ச்சியா அல்லது சரிவா?
- நீங்கள் அடுத்ததாக எப்படி டிரேடு செய்ய திட்டமிடுகிறீர்கள்? எங்களின் டிரேடு பகிர்வு வித்ஜெட்டின் மூலம் உங்கள் BTC, பங்குகள் அல்லது தங்க டிரேடு/உடைமைகளைப் பகிருங்கள்.
⏰பிரச்சார காலம்:
- 2026-09-15 11:00 - 2026-09-17 3:00 UTC
🎁ரிவார்டு:
- மேலுள்ள வழிகாட்டுதல்களுக்கு இணங்கவும் 100 வார்த்தைகளுக்கு மேல் உள்ள தகுதிபெற்ற பதிவுகள் மதிப்பாய்வு செய்யப்படும்; மேலும் 500 முதல் 3,000 பார்வைகள் வரை சீரற்ற (ரேண்டம்) போக்குவரத்து அதிகரிப்பு கிடைக்கலாம். உங்கள் பதிவு தேர்ந்தெடுக்கப்பட்டால், உங்கள் feed secretary மூலம் ஒரு அறிவிப்பு கிடைக்கும்.
- Binance Square Official-ல் உங்கள் கட்டுரை இடம்பெற வாய்ப்பு பெறுங்கள்
உங்கள் பதிவுக்கான யோசனைகள் வேண்டுமா? தலைப்புப் பக்கத்தை #FedRateWatch அல்லது Square Guide on How to Post for Better Reach-ஐ பாருங்கள்.
Binance Square Official
·371 කැමත්ත දැක්වීම්
·803.4k views
BitcoinSlidesTo$76000
17,744 views
108 සාකච්ඡා කරමින්
BitcoinReboundsTo$79K
60,542 views
397 සාකච්ඡා කරමින්