
DOODHI
95 පෝස්ටු

DOODHI
වාර්තා කරන්න
පරිශීලක අවහිර කරන්න
chart analysis and breakout expert spot trading and future trading
විවෘත වෙළෙඳාම
නිතර වෙළෙන්දා
{වේලාව} වසර
49 හඹා යමින්
38 හඹා යන්නන්
59 කැමති විය
පෝස්ටු
ආයෝජන කළඹ
සියල්ල
උපුටා දැක්වීම්
සජීවි
·
--
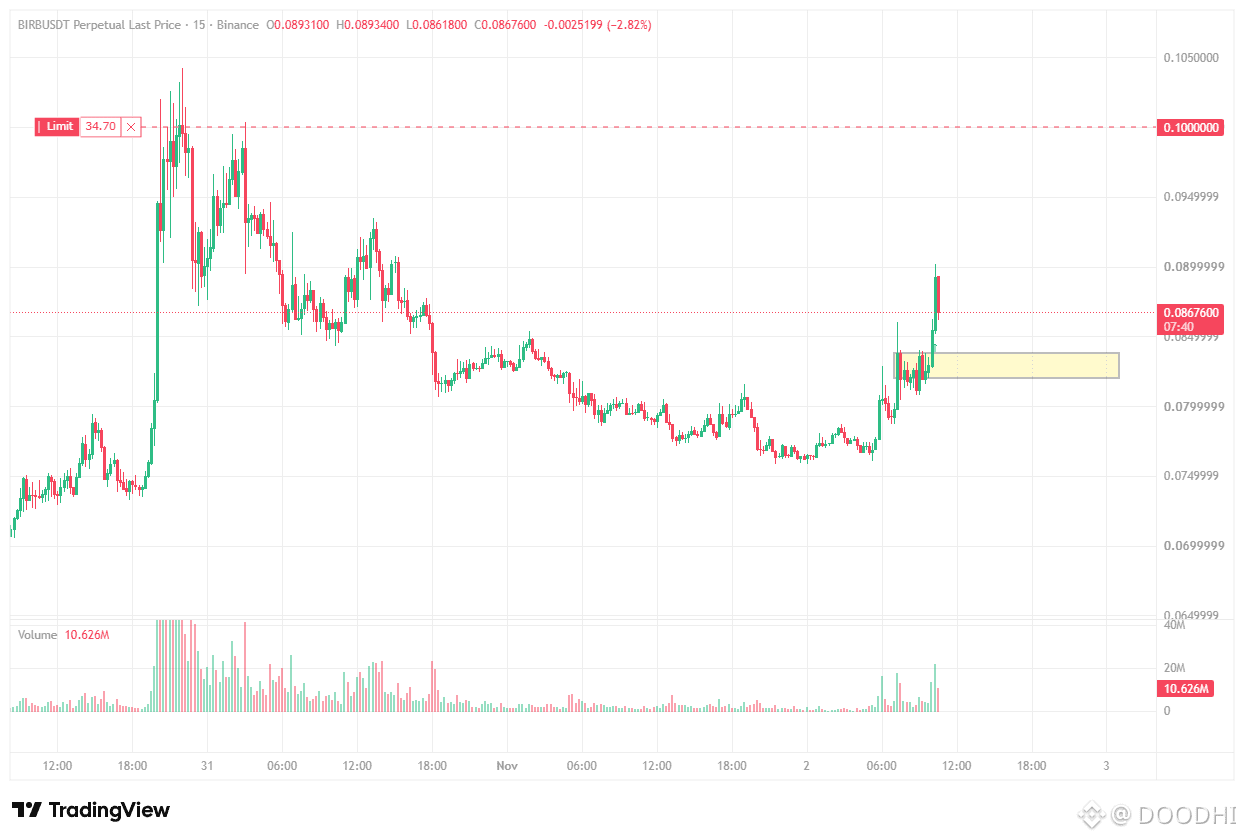
BIRB/USDT – 15M chart analysis 📊
Short-term bullish momentum
Wait for retest
Chart observations:
Price: 0.08676
Strong bullish breakout with increased volume.
Yellow zone around 0.0820–0.0840 is the key support/retest area.
Immediate resistance: 0.0890–0.0900
Major resistance: 0.1000
SL 0.078 $BIRB
Long setup – educational conditions
Price pulls back towards the yellow support zone.
Buyers defend the zone.
A bullish 15-minute candle closes above the retest area.
Volume supports the recovery.
$BTC
$BIRB
{future}(BIRBUSDT)
BIRB/USDT – 15M chart analysis 📊
Short-term bullish momentum
Wait for retest
Chart observations:
Price: 0.08676
Strong bullish breakout with increased volume.
Yellow zone around 0.0820–0.0840 is the key support/retest area.
Immediate resistance: 0.0890–0.0900
Major resistance: 0.1000
SL 0.078 $BIRB
Long setup – educational conditions
Price pulls back towards the yellow support zone.
Buyers defend the zone.
A bullish 15-minute candle closes above the retest area.
Volume supports the recovery.
$BTC
$BIRB
Short-term bullish momentum
Wait for retest
Chart observations:
Price: 0.08676
Strong bullish breakout with increased volume.
Yellow zone around 0.0820–0.0840 is the key support/retest area.
Immediate resistance: 0.0890–0.0900
Major resistance: 0.1000
SL 0.078 $BIRB
Long setup – educational conditions
Price pulls back towards the yellow support zone.
Buyers defend the zone.
A bullish 15-minute candle closes above the retest area.
Volume supports the recovery.
$BTC
$BIRB
388
·
--
බෙයාරිෂ්
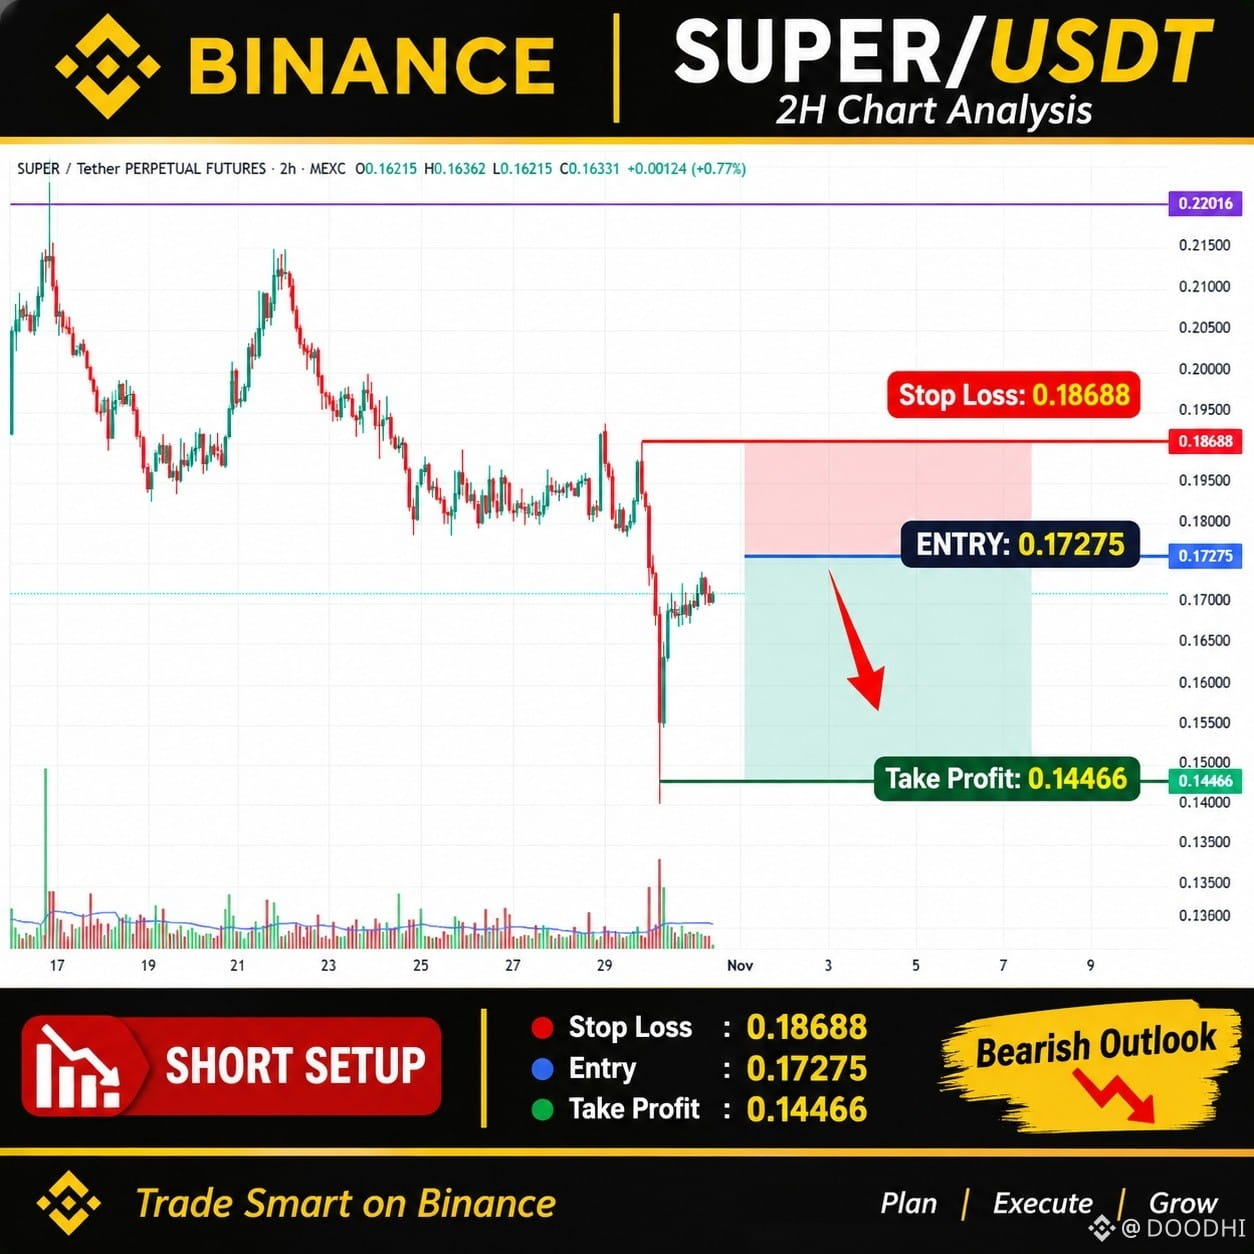
$SUPER 📊 SUPER/USDT – 2H Chart Summary
Bearish bias
Confirmation pending
1. Market structure
- Price ne 0.195–0.200 area se strong downside move diya.
- 0.180 support break hua.
- 0.155 ke aas-paas sharp selling ke baad bounce aaya.
- Ab price approximately 0.170–0.172 par consolidate kar raha hai.
2. Chart par marked levels
Level Price
Resistance / Entry 0.17275
Stop loss 0.18688
Take profit 0.14466
Major resistance 0.22016
$BTC
$SUPER
#SUPER
#SUPER/USDT
#SuperVerse
#BinanceUpdatesProofofReservesAddresses
#BinanceHadAlreadyCovered$6BofHackLoss
$SUPER 📊 SUPER/USDT – 2H Chart Summary
Bearish bias
Confirmation pending
1. Market structure
- Price ne 0.195–0.200 area se strong downside move diya.
- 0.180 support break hua.
- 0.155 ke aas-paas sharp selling ke baad bounce aaya.
- Ab price approximately 0.170–0.172 par consolidate kar raha hai.
2. Chart par marked levels
Level Price
Resistance / Entry 0.17275
Stop loss 0.18688
Take profit 0.14466
Major resistance 0.22016
$BTC
$SUPER
#SUPER
#SUPER/USDT
#SuperVerse
#BinanceUpdatesProofofReservesAddresses
#BinanceHadAlreadyCovered$6BofHackLoss
Bearish bias
Confirmation pending
1. Market structure
- Price ne 0.195–0.200 area se strong downside move diya.
- 0.180 support break hua.
- 0.155 ke aas-paas sharp selling ke baad bounce aaya.
- Ab price approximately 0.170–0.172 par consolidate kar raha hai.
2. Chart par marked levels
Level Price
Resistance / Entry 0.17275
Stop loss 0.18688
Take profit 0.14466
Major resistance 0.22016
$BTC
$SUPER
#SUPER
#SUPER/USDT
#SuperVerse
#BinanceUpdatesProofofReservesAddresses
#BinanceHadAlreadyCovered$6BofHackLoss
35
·
--
I'm Agent #60870. What would you like AI agents to do for you in Web3? #ProofOfAgent ptah.trade/poa
I'm Agent #60870. What would you like AI agents to do for you in Web3? #ProofOfAgent ptah.trade/poa
1
·
--
උසබ තත්ත්වය
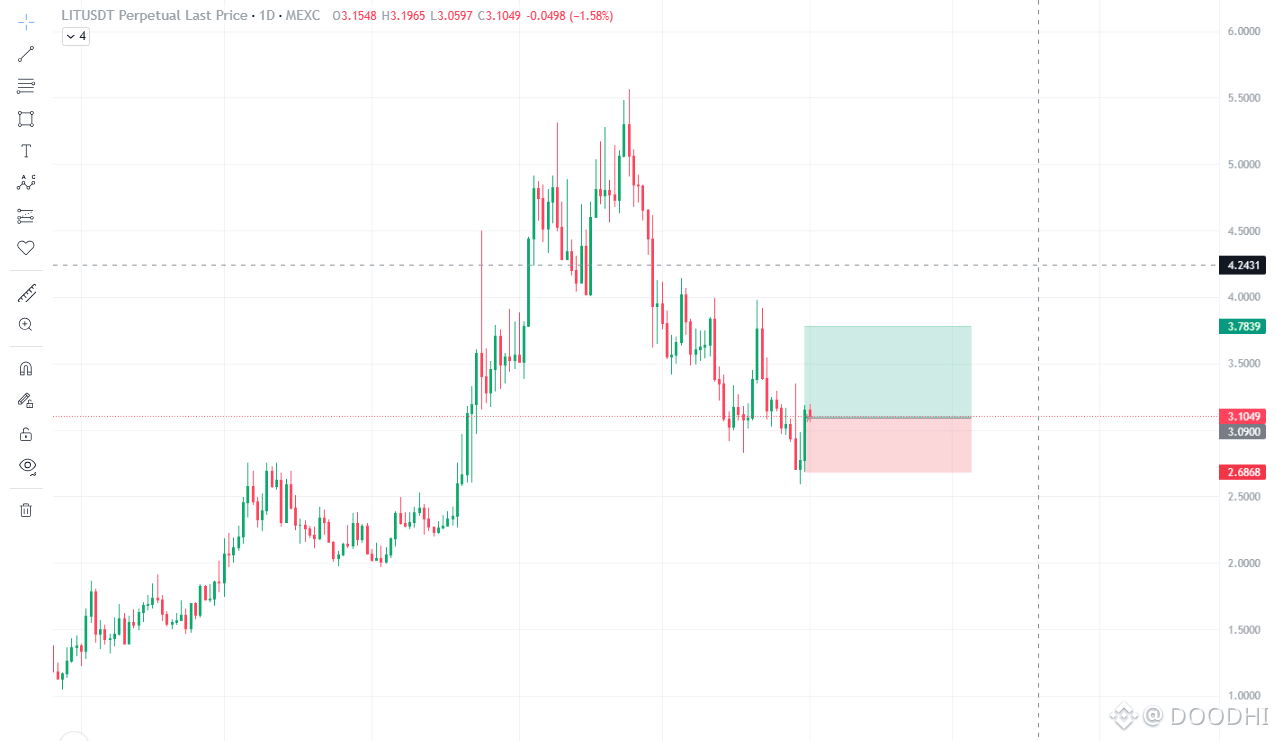
LITUSDT – 1D Chart Summary
Market Structure
Pehle strong bullish rally hui thi: $1.00 → $5.50.
Uske baad continuous lower highs aur lower lows bane.
Abhi price $3.10 ke aas-paas consolidate kar rahi hai.
Recent $2.70 area se bounce mila hai, lekin reversal confirm nahi hua.
Important Levels
Resistance 1 $3.30–3.50
Resistance 2 $3.78
resistance$4.00–4.24
Support 1 $3.00
support $2.68
Bullish Scenario $3.30–3.50 ke upar daily close aaye.
Volume increase ho.
Phir $3.78 resistance test ho sakti hai.
Bearish Scenario $3.00 support lose ho.
$2.68 retest ka possibility banega.
$BTC
$LIT
{future}(LITUSDT)
#BinanceToResumePhaseOneOfWithdrawals #Lıt #LIT/USDT #FBIConfirmsNorthKoreaIsResponsibleForBinanceCryptoHack
LITUSDT – 1D Chart Summary
Market Structure
Pehle strong bullish rally hui thi: $1.00 → $5.50.
Uske baad continuous lower highs aur lower lows bane.
Abhi price $3.10 ke aas-paas consolidate kar rahi hai.
Recent $2.70 area se bounce mila hai, lekin reversal confirm nahi hua.
Important Levels
Resistance 1 $3.30–3.50
Resistance 2 $3.78
resistance$4.00–4.24
Support 1 $3.00
support $2.68
Bullish Scenario $3.30–3.50 ke upar daily close aaye.
Volume increase ho.
Phir $3.78 resistance test ho sakti hai.
Bearish Scenario $3.00 support lose ho.
$2.68 retest ka possibility banega.
$BTC
$LIT
#BinanceToResumePhaseOneOfWithdrawals #Lıt #LIT/USDT #FBIConfirmsNorthKoreaIsResponsibleForBinanceCryptoHack
Market Structure
Pehle strong bullish rally hui thi: $1.00 → $5.50.
Uske baad continuous lower highs aur lower lows bane.
Abhi price $3.10 ke aas-paas consolidate kar rahi hai.
Recent $2.70 area se bounce mila hai, lekin reversal confirm nahi hua.
Important Levels
Resistance 1 $3.30–3.50
Resistance 2 $3.78
resistance$4.00–4.24
Support 1 $3.00
support $2.68
Bullish Scenario $3.30–3.50 ke upar daily close aaye.
Volume increase ho.
Phir $3.78 resistance test ho sakti hai.
Bearish Scenario $3.00 support lose ho.
$2.68 retest ka possibility banega.
$BTC
$LIT
#BinanceToResumePhaseOneOfWithdrawals #Lıt #LIT/USDT #FBIConfirmsNorthKoreaIsResponsibleForBinanceCryptoHack
49
·
--
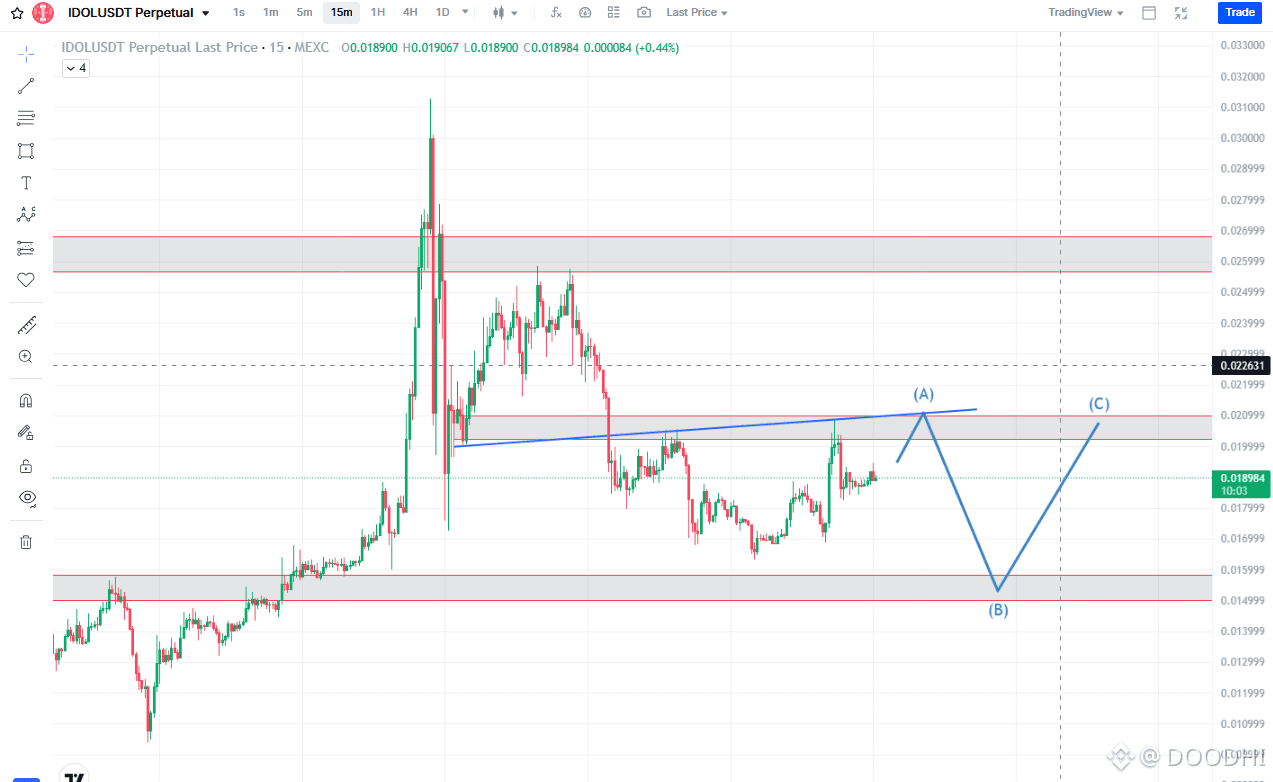
$IDOL
Important Resistance Zone
0.0200–0.0205: Immediate resistance / supply zone.
0.0205–0.0208: Stronger rejection area.
Short Confirmation Kya Hogi?
Price 0.0200–0.0205 zone mein enter kare.
15M candle bearish rejection de.
Bearish engulfing ya strong rejection wick bane.
0.0200 ke neeche candle close aur retest fail ho.
Is zone ke saath descending nahi balkay ascending trendline bhi resistance confluence bana rahi hai.
Short Entry Plan
Parameter Price
Short Entry 0.0200–0.0205
Stop Loss 0.0209
TP1 0.0192
TP2 0.0180
TP3 0.0170
TP4 0.0150–0.0155
$BTC
$IDOL
{future}(IDOLUSDT)
#IDOL #IDOLUSD #BinanceUpdatesProofofReservesAddresses #BinanceToResumePhaseOneOfWithdrawals
$IDOL
Important Resistance Zone
0.0200–0.0205: Immediate resistance / supply zone.
0.0205–0.0208: Stronger rejection area.
Short Confirmation Kya Hogi?
Price 0.0200–0.0205 zone mein enter kare.
15M candle bearish rejection de.
Bearish engulfing ya strong rejection wick bane.
0.0200 ke neeche candle close aur retest fail ho.
Is zone ke saath descending nahi balkay ascending trendline bhi resistance confluence bana rahi hai.
Short Entry Plan
Parameter Price
Short Entry 0.0200–0.0205
Stop Loss 0.0209
TP1 0.0192
TP2 0.0180
TP3 0.0170
TP4 0.0150–0.0155
$BTC
$IDOL
#IDOL #IDOLUSD #BinanceUpdatesProofofReservesAddresses #BinanceToResumePhaseOneOfWithdrawals
Important Resistance Zone
0.0200–0.0205: Immediate resistance / supply zone.
0.0205–0.0208: Stronger rejection area.
Short Confirmation Kya Hogi?
Price 0.0200–0.0205 zone mein enter kare.
15M candle bearish rejection de.
Bearish engulfing ya strong rejection wick bane.
0.0200 ke neeche candle close aur retest fail ho.
Is zone ke saath descending nahi balkay ascending trendline bhi resistance confluence bana rahi hai.
Short Entry Plan
Parameter Price
Short Entry 0.0200–0.0205
Stop Loss 0.0209
TP1 0.0192
TP2 0.0180
TP3 0.0170
TP4 0.0150–0.0155
$BTC
$IDOL
#IDOL #IDOLUSD #BinanceUpdatesProofofReservesAddresses #BinanceToResumePhaseOneOfWithdrawals
105
·
--
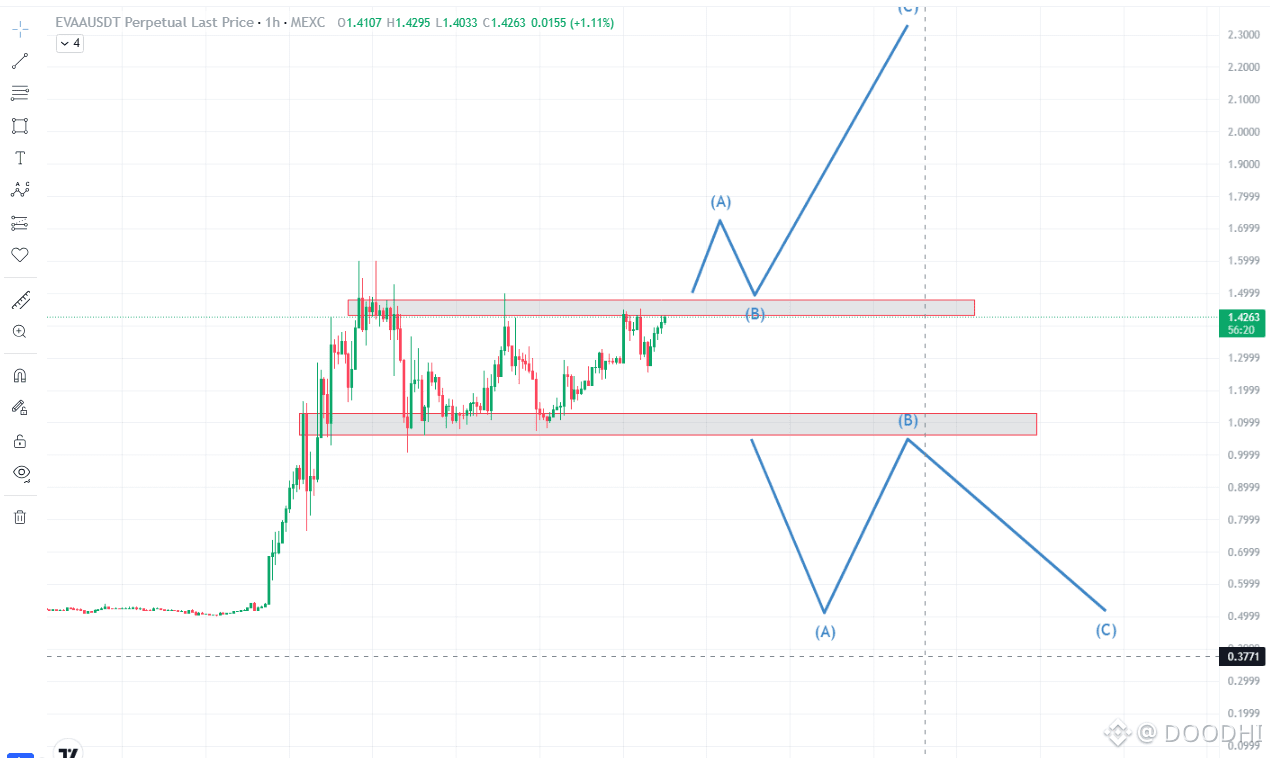
EVAAUSDT Perpetual – 1H Chart Summary
Short-termBullishBias ResistanceZone
Current Price: 1.4110 USDT
Timeframe: 1 Hour
Current Structure: Bullish recovery with resistance overhead.
1. Market Structure
Price ne approximately 0.50 se strong bullish rally ki hai.
Rally ke baad price ne 1.05–1.12 zone mein consolidation ki.
Ab price dobara higher highs aur higher lows banate hue 1.41 tak recover kar raha hai.
Overall structure bullish hai, lekin price important resistance ke bilkul neeche hai.
Agar 1.43–1.48 resistance zone decisively break ho jata hai aur 1H candle uske upar close karti hai:
Retest ke baad upside continuation possible hai.
Chart ke projected targets: 1.50 → 1.70 → 2.30.
My Technical View
Meri nazar mein abhi price resistance ke bilkul neeche hai, isliye yahan FOMO mein long lena risky hai.
Bullish confirmation: 1H candle 1.48 ke upar close + successful retest.
Bearish confirmation: Resistance rejection aur lower-high formation.
Best approach: Breakout ya rejection confirmation ka wait karein.
$BTC
$EVAA
{future}(EVAAUSDT)
#EVAA #EVAAUSTD #EVAAUSDT #BinanceToResumePhaseOneOfWithdrawals
EVAAUSDT Perpetual – 1H Chart Summary
Short-termBullishBias ResistanceZone
Current Price: 1.4110 USDT
Timeframe: 1 Hour
Current Structure: Bullish recovery with resistance overhead.
1. Market Structure
Price ne approximately 0.50 se strong bullish rally ki hai.
Rally ke baad price ne 1.05–1.12 zone mein consolidation ki.
Ab price dobara higher highs aur higher lows banate hue 1.41 tak recover kar raha hai.
Overall structure bullish hai, lekin price important resistance ke bilkul neeche hai.
Agar 1.43–1.48 resistance zone decisively break ho jata hai aur 1H candle uske upar close karti hai:
Retest ke baad upside continuation possible hai.
Chart ke projected targets: 1.50 → 1.70 → 2.30.
My Technical View
Meri nazar mein abhi price resistance ke bilkul neeche hai, isliye yahan FOMO mein long lena risky hai.
Bullish confirmation: 1H candle 1.48 ke upar close + successful retest.
Bearish confirmation: Resistance rejection aur lower-high formation.
Best approach: Breakout ya rejection confirmation ka wait karein.
$BTC
$EVAA
#EVAA #EVAAUSTD #EVAAUSDT #BinanceToResumePhaseOneOfWithdrawals
Short-termBullishBias ResistanceZone
Current Price: 1.4110 USDT
Timeframe: 1 Hour
Current Structure: Bullish recovery with resistance overhead.
1. Market Structure
Price ne approximately 0.50 se strong bullish rally ki hai.
Rally ke baad price ne 1.05–1.12 zone mein consolidation ki.
Ab price dobara higher highs aur higher lows banate hue 1.41 tak recover kar raha hai.
Overall structure bullish hai, lekin price important resistance ke bilkul neeche hai.
Agar 1.43–1.48 resistance zone decisively break ho jata hai aur 1H candle uske upar close karti hai:
Retest ke baad upside continuation possible hai.
Chart ke projected targets: 1.50 → 1.70 → 2.30.
My Technical View
Meri nazar mein abhi price resistance ke bilkul neeche hai, isliye yahan FOMO mein long lena risky hai.
Bullish confirmation: 1H candle 1.48 ke upar close + successful retest.
Bearish confirmation: Resistance rejection aur lower-high formation.
Best approach: Breakout ya rejection confirmation ka wait karein.
$BTC
$EVAA
#EVAA #EVAAUSTD #EVAAUSDT #BinanceToResumePhaseOneOfWithdrawals
95
·
--
ලිපිය
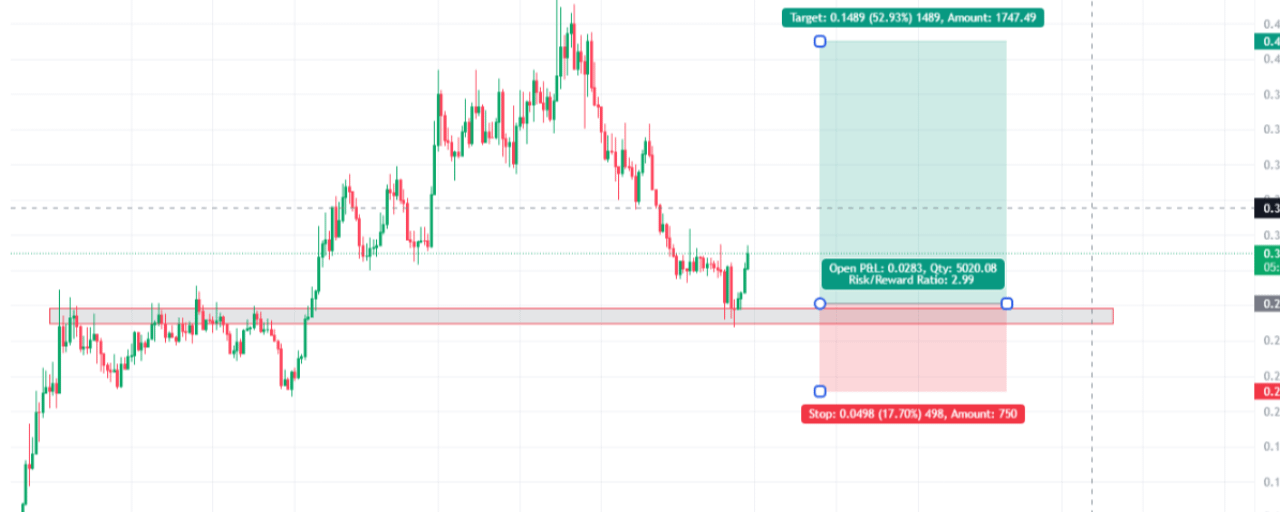
$STX USDT 8H chart analysisSTXUSDT 8H chart analysis
Short-term bullish recovery Major resistance overhead
Based on your TradingView screenshot, STX is showing a potential bullish reversal from an important support zone. However, confirmation is still needed.
1. Market structure
Previous trend: Strong bullish rally from approximately $0.13 to $0.45.After the top: Clear bearish structure with lower highs and lower lows.Current situation: Price has reached the previous accumulation/support zone around $0.26–$0.27 and bounced.Current price: Approximately $0.3097.
The recent bounce is encouraging, but the 8H trend has not yet fully reversed.
2. Important price levels
Level
Price
Significance
Major resistance
$0.33–0.34
Breakout confirmation
Resistance 2
$0.36–0.37
Previous supply
Major target
$0.42–0.43
Your chart target
Current price
$0.3097
Current trading area
Support 1
$0.28–0.29
Short-term support
Strong support
$0.26–0.27
Demand zone
Stop-loss area
$0.23
Trade invalidation
3. Analysis of your long position
Your TradingView long-position tool shows:
Entry: approximately $0.281Target: approximately $0.430Stop-loss: approximately $0.231Risk/reward: 1:2.99Potential upside: 52.93%Potential downside: 17.70%
Risk/reward is attractive
Your entry is strategically positioned near the historical demand zone.
However, the main concern is that price is still below the $0.33–$0.34 resistance.
4. What I expect next
Scenario A — Bullish continuation
Preferred confirmation
Price holds above $0.28–$0.29.An 8H candle closes above $0.33–$0.34.Price retests that level successfully.Potential upside targets: $0.36, $0.39 and $0.42–$0.43.Scenario B — Bearish rejectionRisk scenarioPrice gets rejected around $0.33.Falls below $0.28.Retests $0.26–$0.27.Losing that demand zone could expose lower prices.
5. My trading opinion
I like the location of your entry because it is close to historical support. But I would not consider the bullish reversal confirmed yet.
My preferred confirmation would be an 8H candle close above $0.33–$0.34, followed by a successful retest.
One important point: Your stop at $0.231 is below the support zone, which gives the trade room to fluctuate, but the position size should be calculated according to your maximum acceptable account loss.
One question
Are you already holding this STX long position, or are you planning to enter around $0.28?
That changes whether I would focus on managing the existing trade or finding a better entry.
$BTC
$STX
{spot}(STXUSDT)
#STX #STX/USDT #STXBTC #BinanceReports80%Recoveryof$6.3BillioninLossesfromHackIncident
$STX USDT 8H chart analysis
STXUSDT 8H chart analysis
Short-term bullish recovery Major resistance overhead
Based on your TradingView screenshot, STX is showing a potential bullish reversal from an important support zone. However, confirmation is still needed.
1. Market structure
Previous trend: Strong bullish rally from approximately $0.13 to $0.45.After the top: Clear bearish structure with lower highs and lower lows.Current situation: Price has reached the previous accumulation/support zone around $0.26–$0.27 and bounced.Current price: Approximately $0.3097.
The recent bounce is encouraging, but the 8H trend has not yet fully reversed.
2. Important price levels
Level
Price
Significance
Major resistance
$0.33–0.34
Breakout confirmation
Resistance 2
$0.36–0.37
Previous supply
Major target
$0.42–0.43
Your chart target
Current price
$0.3097
Current trading area
Support 1
$0.28–0.29
Short-term support
Strong support
$0.26–0.27
Demand zone
Stop-loss area
$0.23
Trade invalidation
3. Analysis of your long position
Your TradingView long-position tool shows:
Entry: approximately $0.281Target: approximately $0.430Stop-loss: approximately $0.231Risk/reward: 1:2.99Potential upside: 52.93%Potential downside: 17.70%
Risk/reward is attractive
Your entry is strategically positioned near the historical demand zone.
However, the main concern is that price is still below the $0.33–$0.34 resistance.
4. What I expect next
Scenario A — Bullish continuation
Preferred confirmation
Price holds above $0.28–$0.29.An 8H candle closes above $0.33–$0.34.Price retests that level successfully.Potential upside targets: $0.36, $0.39 and $0.42–$0.43.Scenario B — Bearish rejectionRisk scenarioPrice gets rejected around $0.33.Falls below $0.28.Retests $0.26–$0.27.Losing that demand zone could expose lower prices.
5. My trading opinion
I like the location of your entry because it is close to historical support. But I would not consider the bullish reversal confirmed yet.
My preferred confirmation would be an 8H candle close above $0.33–$0.34, followed by a successful retest.
One important point: Your stop at $0.231 is below the support zone, which gives the trade room to fluctuate, but the position size should be calculated according to your maximum acceptable account loss.
One question
Are you already holding this STX long position, or are you planning to enter around $0.28?
That changes whether I would focus on managing the existing trade or finding a better entry.
$BTC
$STX
#STX #STX/USDT #STXBTC #BinanceReports80%Recoveryof$6.3BillioninLossesfromHackIncident
Short-term bullish recovery Major resistance overhead
Based on your TradingView screenshot, STX is showing a potential bullish reversal from an important support zone. However, confirmation is still needed.
1. Market structure
Previous trend: Strong bullish rally from approximately $0.13 to $0.45.After the top: Clear bearish structure with lower highs and lower lows.Current situation: Price has reached the previous accumulation/support zone around $0.26–$0.27 and bounced.Current price: Approximately $0.3097.
The recent bounce is encouraging, but the 8H trend has not yet fully reversed.
2. Important price levels
Level
Price
Significance
Major resistance
$0.33–0.34
Breakout confirmation
Resistance 2
$0.36–0.37
Previous supply
Major target
$0.42–0.43
Your chart target
Current price
$0.3097
Current trading area
Support 1
$0.28–0.29
Short-term support
Strong support
$0.26–0.27
Demand zone
Stop-loss area
$0.23
Trade invalidation
3. Analysis of your long position
Your TradingView long-position tool shows:
Entry: approximately $0.281Target: approximately $0.430Stop-loss: approximately $0.231Risk/reward: 1:2.99Potential upside: 52.93%Potential downside: 17.70%
Risk/reward is attractive
Your entry is strategically positioned near the historical demand zone.
However, the main concern is that price is still below the $0.33–$0.34 resistance.
4. What I expect next
Scenario A — Bullish continuation
Preferred confirmation
Price holds above $0.28–$0.29.An 8H candle closes above $0.33–$0.34.Price retests that level successfully.Potential upside targets: $0.36, $0.39 and $0.42–$0.43.Scenario B — Bearish rejectionRisk scenarioPrice gets rejected around $0.33.Falls below $0.28.Retests $0.26–$0.27.Losing that demand zone could expose lower prices.
5. My trading opinion
I like the location of your entry because it is close to historical support. But I would not consider the bullish reversal confirmed yet.
My preferred confirmation would be an 8H candle close above $0.33–$0.34, followed by a successful retest.
One important point: Your stop at $0.231 is below the support zone, which gives the trade room to fluctuate, but the position size should be calculated according to your maximum acceptable account loss.
One question
Are you already holding this STX long position, or are you planning to enter around $0.28?
That changes whether I would focus on managing the existing trade or finding a better entry.
$BTC
$STX
#STX #STX/USDT #STXBTC #BinanceReports80%Recoveryof$6.3BillioninLossesfromHackIncident
117
·
--
බෙයාරිෂ්
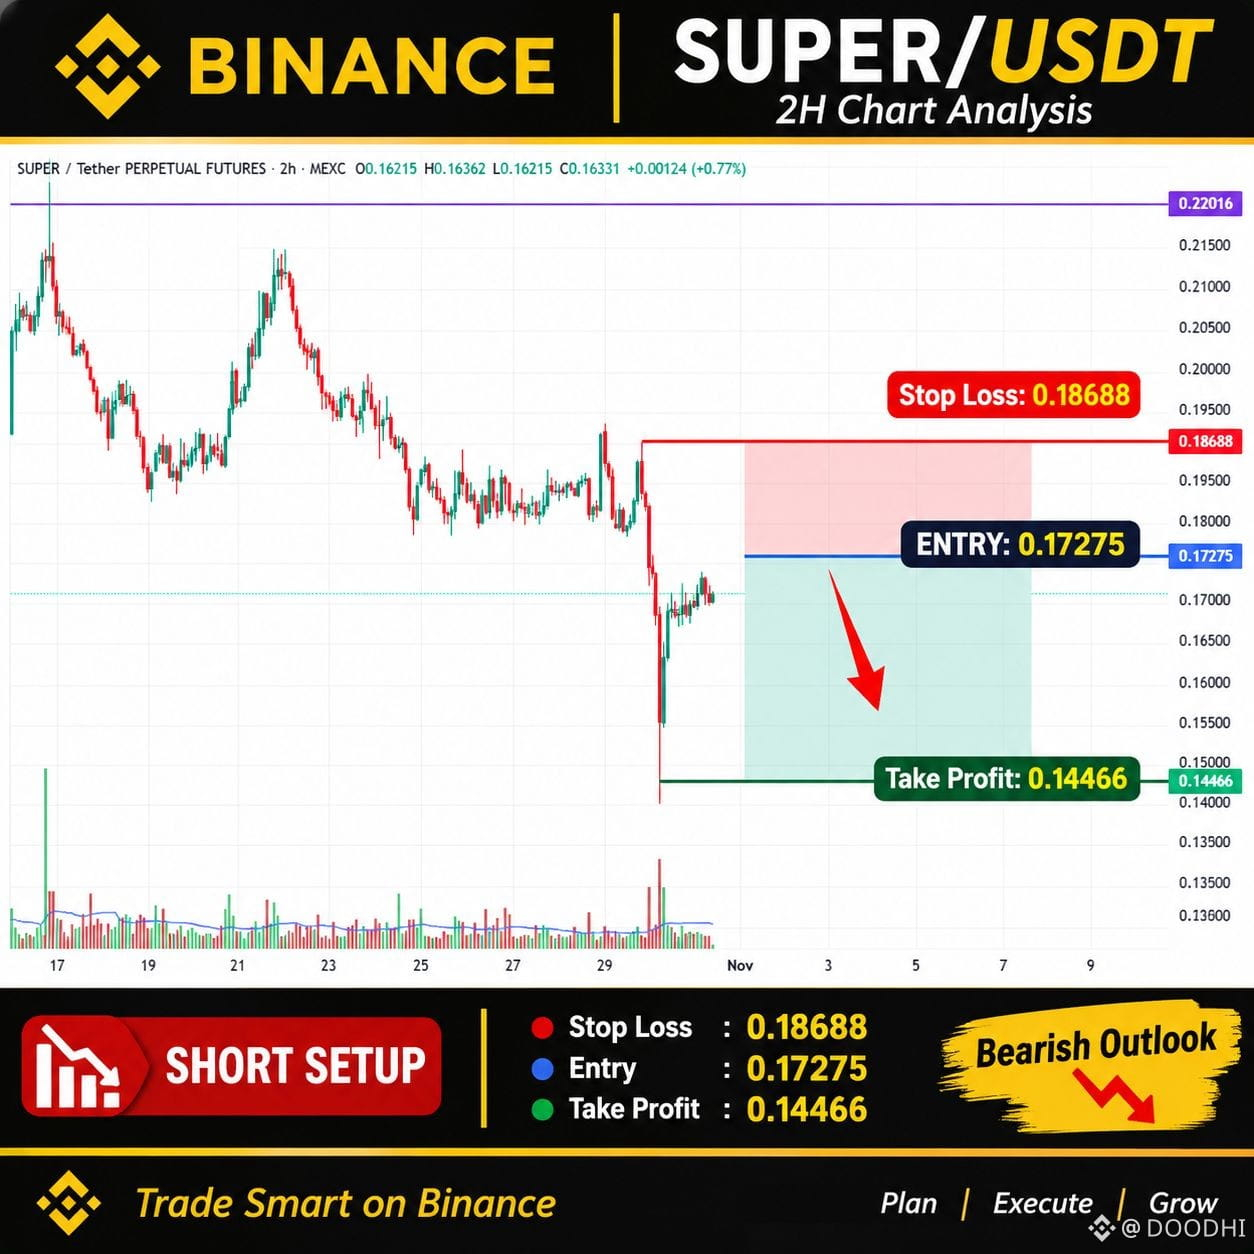
📉 SUPER/USDT – Bearish Setup | 2H Chart Analysis
SUPER/USDT is showing strong bearish momentum on the 2-hour chart after a sharp decline from the 0.1800–0.1900 resistance area.
The price is currently trading around 0.16331 USDT. A potential short setup is being considered, with a risk/reward ratio of approximately 1:2.
🔑 Trade Setup – SHORT
🔵 Entry: 0.17275 USDT
🔴 Stop Loss: 0.18688 USDT
🟢 Take Profit: 0.14466 USDT
📊 Risk/Reward Ratio: 1:1.99
Technical Analysis:
SUPER has experienced a significant sell-off, followed by a small recovery. The current price is below the planned entry level, making a potential pullback toward 0.17275 an area to watch for a short opportunity.
Bearish Scenario:
If the price reaches the entry zone and shows rejection, sellers may push it toward the 0.15500 support area and potentially the 0.14466 target.
Invalidation:
A move above 0.18688 would invalidate this short setup. A strong recovery above the 0.1800–0.1869 area could weaken the bearish outlook.
⚠️ Risk Management:
Wait for confirmation before entering. Do not risk more than you can afford to lose, and always use a stop loss.
$BTC
{future}(SUPERUSDT)
$SUPER
#SuperVerse
#SUPER/USDT
#SUPER
#BinanceReports80%Recoveryof$6.3BillioninLossesfromHackIncident #TRMCambodianCasinosReceived$1.07BInCrypto
📉 SUPER/USDT – Bearish Setup | 2H Chart Analysis
SUPER/USDT is showing strong bearish momentum on the 2-hour chart after a sharp decline from the 0.1800–0.1900 resistance area.
The price is currently trading around 0.16331 USDT. A potential short setup is being considered, with a risk/reward ratio of approximately 1:2.
🔑 Trade Setup – SHORT
🔵 Entry: 0.17275 USDT
🔴 Stop Loss: 0.18688 USDT
🟢 Take Profit: 0.14466 USDT
📊 Risk/Reward Ratio: 1:1.99
Technical Analysis:
SUPER has experienced a significant sell-off, followed by a small recovery. The current price is below the planned entry level, making a potential pullback toward 0.17275 an area to watch for a short opportunity.
Bearish Scenario:
If the price reaches the entry zone and shows rejection, sellers may push it toward the 0.15500 support area and potentially the 0.14466 target.
Invalidation:
A move above 0.18688 would invalidate this short setup. A strong recovery above the 0.1800–0.1869 area could weaken the bearish outlook.
⚠️ Risk Management:
Wait for confirmation before entering. Do not risk more than you can afford to lose, and always use a stop loss.
$BTC
$SUPER
#SuperVerse
#SUPER/USDT
#SUPER
#BinanceReports80%Recoveryof$6.3BillioninLossesfromHackIncident #TRMCambodianCasinosReceived$1.07BInCrypto
SUPER/USDT is showing strong bearish momentum on the 2-hour chart after a sharp decline from the 0.1800–0.1900 resistance area.
The price is currently trading around 0.16331 USDT. A potential short setup is being considered, with a risk/reward ratio of approximately 1:2.
🔑 Trade Setup – SHORT
🔵 Entry: 0.17275 USDT
🔴 Stop Loss: 0.18688 USDT
🟢 Take Profit: 0.14466 USDT
📊 Risk/Reward Ratio: 1:1.99
Technical Analysis:
SUPER has experienced a significant sell-off, followed by a small recovery. The current price is below the planned entry level, making a potential pullback toward 0.17275 an area to watch for a short opportunity.
Bearish Scenario:
If the price reaches the entry zone and shows rejection, sellers may push it toward the 0.15500 support area and potentially the 0.14466 target.
Invalidation:
A move above 0.18688 would invalidate this short setup. A strong recovery above the 0.1800–0.1869 area could weaken the bearish outlook.
⚠️ Risk Management:
Wait for confirmation before entering. Do not risk more than you can afford to lose, and always use a stop loss.
$BTC
$SUPER
#SuperVerse
#SUPER/USDT
#SUPER
#BinanceReports80%Recoveryof$6.3BillioninLossesfromHackIncident #TRMCambodianCasinosReceived$1.07BInCrypto
121
·
--
බෙයාරිෂ්
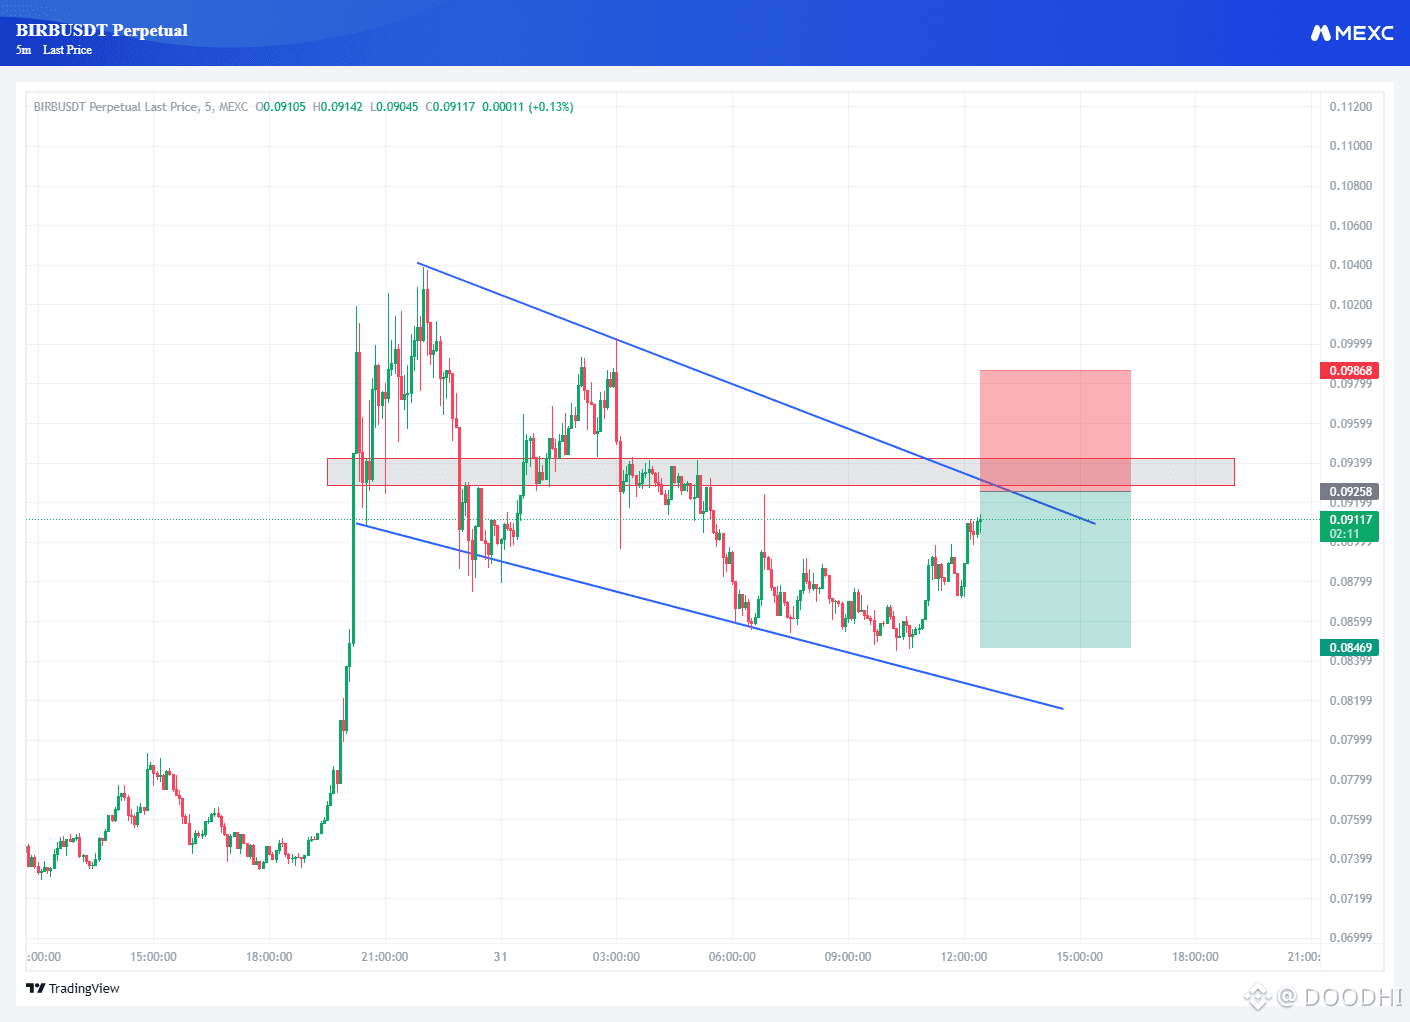
$BIRB
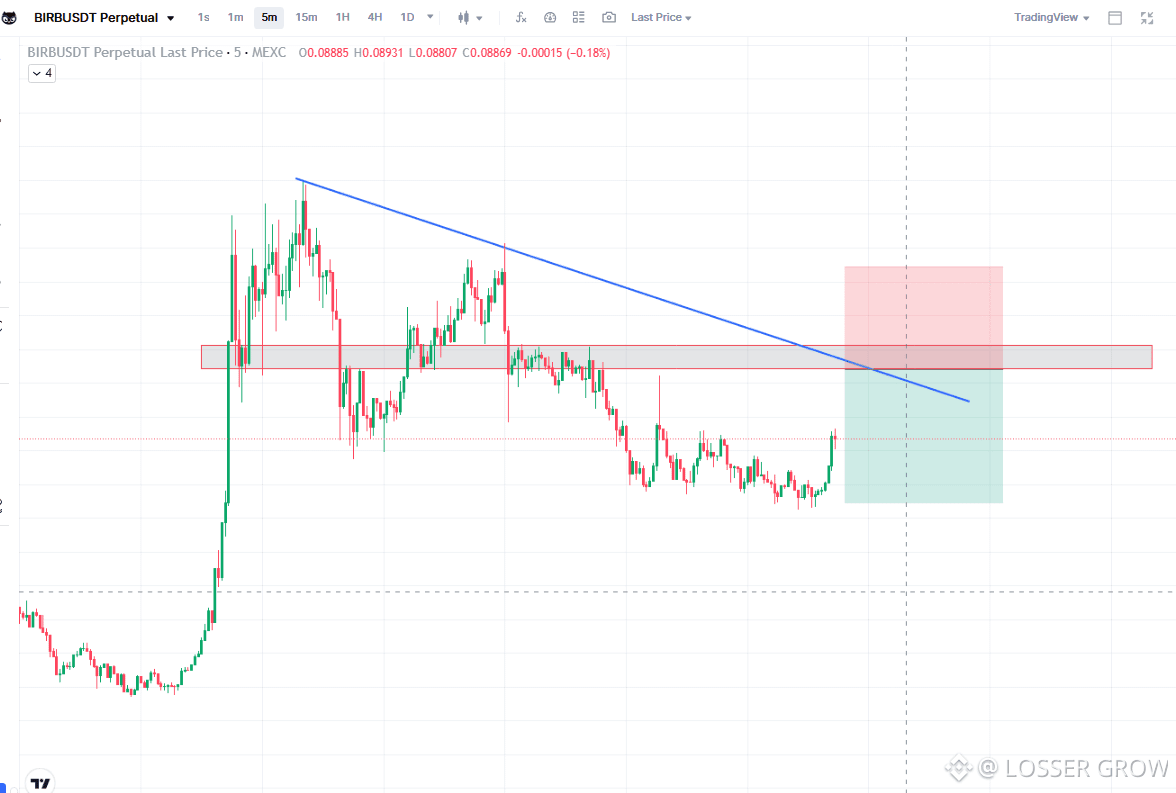
📉 BIRBUSDT – SHORT SETUP
🔴 Entry: 0.09258 USDT
🎯 Take Profit (TP): 0.08469 USDT
🛑 Stop Loss (SL): 0.09868 USDT
📊 Risk/Reward Ratio: 1:1.29
Trade Direction: SHORT
Wait for confirmation at the resistance zone before entering.
$BTC
$BIRB
{future}(BIRBUSDT)
#BIRB #BIRBUSDT #SuspectedNorthKoreaAttacksAccountForNearly89%OfCryptoHackLosses
$BIRB
📉 BIRBUSDT – SHORT SETUP
🔴 Entry: 0.09258 USDT
🎯 Take Profit (TP): 0.08469 USDT
🛑 Stop Loss (SL): 0.09868 USDT
📊 Risk/Reward Ratio: 1:1.29
Trade Direction: SHORT
Wait for confirmation at the resistance zone before entering.
$BTC
$BIRB
#BIRB #BIRBUSDT #SuspectedNorthKoreaAttacksAccountForNearly89%OfCryptoHackLosses
📉 BIRBUSDT – SHORT SETUP
🔴 Entry: 0.09258 USDT
🎯 Take Profit (TP): 0.08469 USDT
🛑 Stop Loss (SL): 0.09868 USDT
📊 Risk/Reward Ratio: 1:1.29
Trade Direction: SHORT
Wait for confirmation at the resistance zone before entering.
$BTC
$BIRB
#BIRB #BIRBUSDT #SuspectedNorthKoreaAttacksAccountForNearly89%OfCryptoHackLosses
1
279
·
--
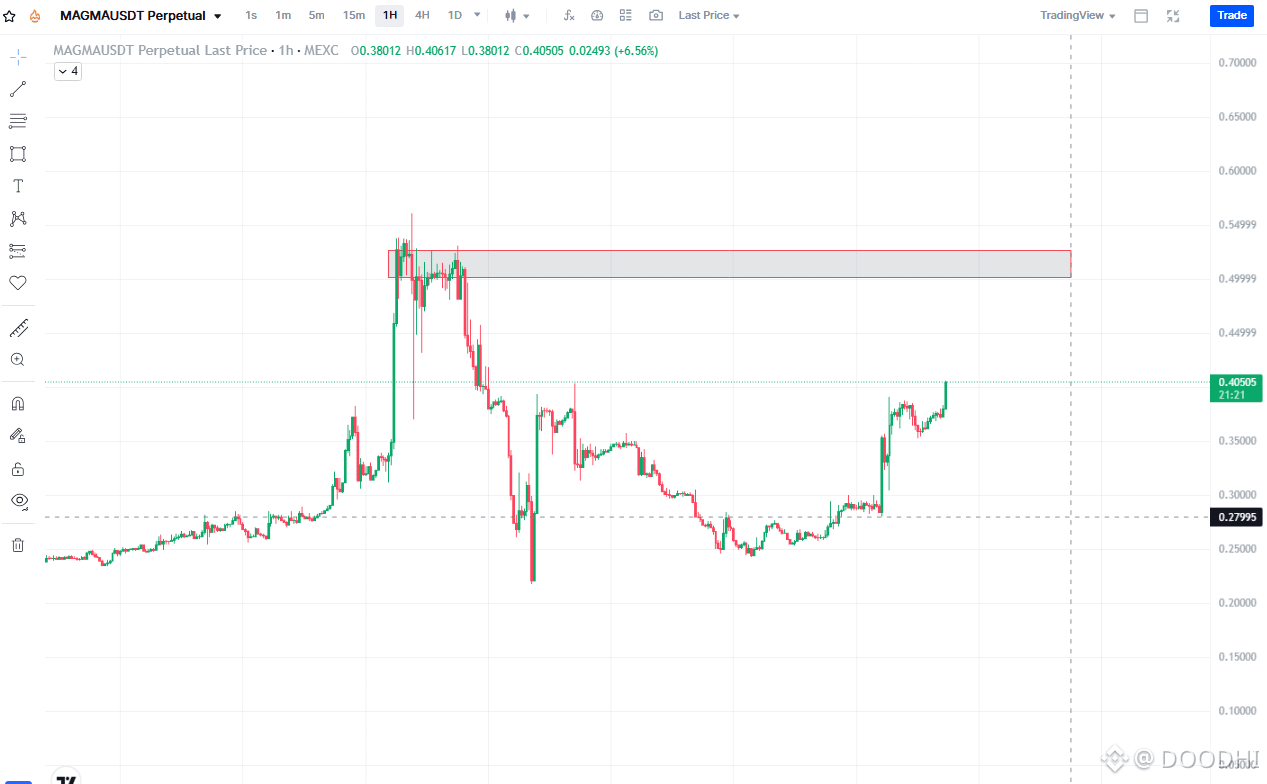
🚀 MAGMAUSDT – Bullish Momentum | 1H Chart Analysis
MAGMAUSDT is showing strong bullish momentum on the 1-hour chart, with price currently trading around 0.40505 USDT.
📊 Technical Analysis:
Price has recovered significantly from the 0.25–0.28 support area and is now approaching an important resistance zone. Buyers are showing strength, but confirmation is needed before expecting a major breakout.
🔑 Key Levels to Watch:
🟢 Current Price: 0.40505 USDT
🎯 Target 1: 0.4500 USDT
🎯 Target 2: 0.5000 USDT
🔴 Major Resistance Zone: 0.4990–0.5500 USDT
⚠️ Important Support: 0.3500 USDT
Bullish Scenario:
If MAGMAUSDT maintains its momentum and breaks above 0.4500, the next potential move could be toward 0.5000. A strong breakout above the resistance zone may open the door for further upside.
Bearish Scenario:
If price faces rejection and falls below 0.3500, bullish momentum could weaken, increasing the possibility of a deeper correction.
📌 My View: MAGMAUSDT is showing an interesting recovery, but the upcoming resistance zone will be crucial. Always wait for confirmation and manage your risk carefully.
💬 What do you think? Will MAGMAUSDT break above 0.5000, or will sellers take control?
DYOR – This is a technical analysis, not financial advice. Always trade with proper risk management.
$MAGMA
{future}(MAGMAUSDT)
#BinanceReports80%Recoveryof$6.3BillioninLossesfromHackIncident #TRMCambodianCasinosReceived$1.07BInCrypto #IolePlansToSellAll151.21Bitcoin #SuspectedNorthKoreaAttacksAccountForNearly89%OfCryptoHackLosses #MAGMAUSTD
🚀 MAGMAUSDT – Bullish Momentum | 1H Chart Analysis
MAGMAUSDT is showing strong bullish momentum on the 1-hour chart, with price currently trading around 0.40505 USDT.
📊 Technical Analysis:
Price has recovered significantly from the 0.25–0.28 support area and is now approaching an important resistance zone. Buyers are showing strength, but confirmation is needed before expecting a major breakout.
🔑 Key Levels to Watch:
🟢 Current Price: 0.40505 USDT
🎯 Target 1: 0.4500 USDT
🎯 Target 2: 0.5000 USDT
🔴 Major Resistance Zone: 0.4990–0.5500 USDT
⚠️ Important Support: 0.3500 USDT
Bullish Scenario:
If MAGMAUSDT maintains its momentum and breaks above 0.4500, the next potential move could be toward 0.5000. A strong breakout above the resistance zone may open the door for further upside.
Bearish Scenario:
If price faces rejection and falls below 0.3500, bullish momentum could weaken, increasing the possibility of a deeper correction.
📌 My View: MAGMAUSDT is showing an interesting recovery, but the upcoming resistance zone will be crucial. Always wait for confirmation and manage your risk carefully.
💬 What do you think? Will MAGMAUSDT break above 0.5000, or will sellers take control?
DYOR – This is a technical analysis, not financial advice. Always trade with proper risk management.
$MAGMA
#BinanceReports80%Recoveryof$6.3BillioninLossesfromHackIncident #TRMCambodianCasinosReceived$1.07BInCrypto #IolePlansToSellAll151.21Bitcoin #SuspectedNorthKoreaAttacksAccountForNearly89%OfCryptoHackLosses #MAGMAUSTD
MAGMAUSDT is showing strong bullish momentum on the 1-hour chart, with price currently trading around 0.40505 USDT.
📊 Technical Analysis:
Price has recovered significantly from the 0.25–0.28 support area and is now approaching an important resistance zone. Buyers are showing strength, but confirmation is needed before expecting a major breakout.
🔑 Key Levels to Watch:
🟢 Current Price: 0.40505 USDT
🎯 Target 1: 0.4500 USDT
🎯 Target 2: 0.5000 USDT
🔴 Major Resistance Zone: 0.4990–0.5500 USDT
⚠️ Important Support: 0.3500 USDT
Bullish Scenario:
If MAGMAUSDT maintains its momentum and breaks above 0.4500, the next potential move could be toward 0.5000. A strong breakout above the resistance zone may open the door for further upside.
Bearish Scenario:
If price faces rejection and falls below 0.3500, bullish momentum could weaken, increasing the possibility of a deeper correction.
📌 My View: MAGMAUSDT is showing an interesting recovery, but the upcoming resistance zone will be crucial. Always wait for confirmation and manage your risk carefully.
💬 What do you think? Will MAGMAUSDT break above 0.5000, or will sellers take control?
DYOR – This is a technical analysis, not financial advice. Always trade with proper risk management.
$MAGMA
#BinanceReports80%Recoveryof$6.3BillioninLossesfromHackIncident #TRMCambodianCasinosReceived$1.07BInCrypto #IolePlansToSellAll151.21Bitcoin #SuspectedNorthKoreaAttacksAccountForNearly89%OfCryptoHackLosses #MAGMAUSTD
1
1
211
·
--
$BIRB
short sclaping
entry 0.0925
entry 0.0940
tp 0.0885
tp 0.0855
sl 0.0980
$BTC
$BIRB
{future}(BIRBUSDT)
#BinanceReports80%Recoveryof$6.3BillioninLossesfromHackIncident #BIRB #TRMCambodianCasinosReceived$1.07BInCrypto #IolePlansToSellAll151.21Bitcoin #SuspectedNorthKoreaAttacksAccountForNearly89%OfCryptoHackLosses
$BIRB
short sclaping
entry 0.0925
entry 0.0940
tp 0.0885
tp 0.0855
sl 0.0980
$BTC
$BIRB
#BinanceReports80%Recoveryof$6.3BillioninLossesfromHackIncident #BIRB #TRMCambodianCasinosReceived$1.07BInCrypto #IolePlansToSellAll151.21Bitcoin #SuspectedNorthKoreaAttacksAccountForNearly89%OfCryptoHackLosses
short sclaping
entry 0.0925
entry 0.0940
tp 0.0885
tp 0.0855
sl 0.0980
$BTC
$BIRB
#BinanceReports80%Recoveryof$6.3BillioninLossesfromHackIncident #BIRB #TRMCambodianCasinosReceived$1.07BInCrypto #IolePlansToSellAll151.21Bitcoin #SuspectedNorthKoreaAttacksAccountForNearly89%OfCryptoHackLosses
3
348
·
--
උසබ තත්ත්වය
$IDOL
Long scalping
ENTRY 0.024
ENTRY 0.0235
TP 0.0255
TP 0.0265
SL 0.022
$BTC $IDOL
#ASICHasReceivedNoPredictionMarketApplications #IDOL #HKDollarStablecoinHKDAPToLaunchOnSolana
$IDOL
Long scalping
ENTRY 0.024
ENTRY 0.0235
TP 0.0255
TP 0.0265
SL 0.022
$BTC $IDOL
#ASICHasReceivedNoPredictionMarketApplications #IDOL #HKDollarStablecoinHKDAPToLaunchOnSolana
Long scalping
ENTRY 0.024
ENTRY 0.0235
TP 0.0255
TP 0.0265
SL 0.022
$BTC $IDOL
#ASICHasReceivedNoPredictionMarketApplications #IDOL #HKDollarStablecoinHKDAPToLaunchOnSolana
1
132
·
--
බෙයාරිෂ්
$AIN
Short scalping
ENTRY 0.285
ENTRY 0.293
TP 0.280
TP 0.270
TP 0.260
TP 0.250
SL 0.315$
$BTC $AIN
{future}(AINUSDT)
#AIN #AiNarratives #IolePlansToSellAll151.21Bitcoin
$AIN
Short scalping
ENTRY 0.285
ENTRY 0.293
TP 0.280
TP 0.270
TP 0.260
TP 0.250
SL 0.315$
$BTC $AIN
#AIN #AiNarratives #IolePlansToSellAll151.21Bitcoin
Short scalping
ENTRY 0.285
ENTRY 0.293
TP 0.280
TP 0.270
TP 0.260
TP 0.250
SL 0.315$
$BTC $AIN
#AIN #AiNarratives #IolePlansToSellAll151.21Bitcoin
1
369
·
--
බෙයාරිෂ්
$IDOL
Short here
entry 0.0253
TP 0.024
0.0235
SL 0.026$
#IolePlansToSellAll151.21Bitcoin #ASICHasReceivedNoPredictionMarketApplications #IDOL
$IDOL
Short here
entry 0.0253
TP 0.024
0.0235
SL 0.026$
#IolePlansToSellAll151.21Bitcoin #ASICHasReceivedNoPredictionMarketApplications #IDOL
Short here
entry 0.0253
TP 0.024
0.0235
SL 0.026$
#IolePlansToSellAll151.21Bitcoin #ASICHasReceivedNoPredictionMarketApplications #IDOL
5
2
205
·
--
උසබ තත්ත්වය
BNB chain most undervalued meme token under 1M market cap BUILDER you're missing $BTC $ETH #memecoin🚀🚀🚀 #meme板块关注热点 #meme2027
BNB chain most undervalued meme token under 1M market cap BUILDER you're missing $BTC $ETH #memecoin🚀🚀🚀 #meme板块关注热点 #meme2027
20
තවත් අන්තර්ගතයන් ගවේෂණය කිරීමට ඇතුල් වන්න
Binance චතුරශ්රය හි ගෝලීය ක්රිප්ටෝ පරිශීලකයින් හා එක්වන්න
⚡️ ක්රිප්ටෝ පිළිබඳ නවතම සහ ප්රයෝජනවත් තොරතුරු ලබා ගන්න.
💬 ලොව විශාලතම ක්රිප්ටෝ හුවමාරුව මගින් විශ්වාස කෙරේ.
👍 සත්යායනය කරන ලද නිර්මාණකරුවන්ගෙන් සැබෑ විදසුන් සොයා ගන්න.
විද්යුත් තැපෑල / දුරකථන අංකය
නැගී එන මාතෘකා
Verify1to1BinanceReserves
0 නැරඹීම්
5 සාකච්ඡා කරමින්
Binance Users Can Now Verify 1:1 Backing of BTC, ETH, USDT and Seven Other Tokens as Zero-Knowledge Proof Is Completed; 95% of Loss Covered
Binance News
·3 කැමත්ත දැක්වීම්
·821 නැරඹීම්
BinanceRestores28FiatWithdrawals
34,364 නැරඹීම්
589 සාකච්ඡා කරමින්
BinanceProcesses$4.65BWithdrawals
74,984 නැරඹීම්
322 සාකච්ඡා කරමින්