
Decrypted Labs
1.4k පෝස්ටු

Decrypted Labs
වාර්තා කරන්න
පරිශීලක අවහිර කරන්න
Sharing insights on Crypto, NFTs, WEB 3 | BNB - BTC HOLDER
ඉඳහිට වෙළෙන්දා
{වේලාව} වසර
14 හඹා යමින්
23.5K+ හඹා යන්නන්
13.8K+ කැමති විය
පෝස්ටු
සියල්ල
උපුටා දැක්වීම්
වීඩියෝ
අමුණා ඇත
I made $2M from $8k in 2023, here are my top 60 tokens for 2024 bull run:
➮ AI: $TAO, $AGRS, $PAAL, $RNDR, $AKT, $FET, $PRIME, $AIOZ, $ORAI, $ABT, $ALEPH, $GHX, $AIT, $OPSEC, $NMT
➮ DePin: $FIL, $RNDR, $HNT, $THETA, $OCEAN, $ANKR, $HONEY
➮ L1: $KAS, $INJ, $KUJI, $MONAD, $ASTR, $RON, $SUI, $SEI
➮ GameFi: $MAVIA, $RON, $GALA, #BIGTIME, $ALICE, $MAGIC, $WILD, $SIDUS
➮ RWA: $SNX, $MKR, $CFG, $RBN, $POLYX
➮ L2: #STRK, #ARB, #METIS, #BOBA, #IMX
➮ BRC-20: $SAVM, #MUBI, #ORDI
➮ Modular: #TIA, #DYM, #GEL
Restaking : #RSTK, #EIGEN
Derivatives : #MCB, #AEVO, #DYDX
#Write2Earn
I made $2M from $8k in 2023, here are my top 60 tokens for 2024 bull run:
➮ AI: $TAO, $AGRS, $PAAL, $RNDR, $AKT, $FET, $PRIME, $AIOZ, $ORAI, $ABT, $ALEPH, $GHX, $AIT, $OPSEC, $NMT
➮ DePin: $FIL, $RNDR, $HNT, $THETA, $OCEAN, $ANKR, $HONEY
➮ L1: $KAS, $INJ, $KUJI, $MONAD, $ASTR, $RON, $SUI, $SEI
➮ GameFi: $MAVIA, $RON, $GALA, #BIGTIME, $ALICE, $MAGIC, $WILD, $SIDUS
➮ RWA: $SNX, $MKR, $CFG, $RBN, $POLYX
➮ L2: #STRK, #ARB, #METIS, #BOBA, #IMX
➮ BRC-20: $SAVM, #MUBI, #ORDI
➮ Modular: #TIA, #DYM, #GEL
Restaking : #RSTK, #EIGEN
Derivatives : #MCB, #AEVO, #DYDX
#Write2Earn
➮ AI: $TAO, $AGRS, $PAAL, $RNDR, $AKT, $FET, $PRIME, $AIOZ, $ORAI, $ABT, $ALEPH, $GHX, $AIT, $OPSEC, $NMT
➮ DePin: $FIL, $RNDR, $HNT, $THETA, $OCEAN, $ANKR, $HONEY
➮ L1: $KAS, $INJ, $KUJI, $MONAD, $ASTR, $RON, $SUI, $SEI
➮ GameFi: $MAVIA, $RON, $GALA, #BIGTIME, $ALICE, $MAGIC, $WILD, $SIDUS
➮ RWA: $SNX, $MKR, $CFG, $RBN, $POLYX
➮ L2: #STRK, #ARB, #METIS, #BOBA, #IMX
➮ BRC-20: $SAVM, #MUBI, #ORDI
➮ Modular: #TIA, #DYM, #GEL
Restaking : #RSTK, #EIGEN
Derivatives : #MCB, #AEVO, #DYDX
#Write2Earn

71
9
204
443.3k
අමුණා ඇත

ලිපිය
Finding New CoinsSome of the craziest returns of 5X, 10X, 50X, or even more are achieved by people who find new coins early on-chain and hold them as they explode in growth. Here’s how you can start researching and finding these coins for yourself 👇🏼 Finding New Coins:There are a few key metrics to look at to determine how early you are to a coin:-Market Cap:This is the most important metric to check as it directly affects how much room for future growth a coin has. With new high risk / high reward coins, you are going to be looking for gains of multiple Xs. If a coin is at a market cap of $500k then it can 20X and still only be at a market cap of $10M. However, if a coin is already at a market cap of $2M then reaching that same $10M market cap target would be a 5X. What market cap range you look for when deciding whether to buy a coin or when to take profit depends on your personal view of the potential of the coin. If you find a project with real utility in a sector of crypto with a lot of demand, or a project that offers improvements over existing products/services then you may aim for higher. On the other hand, if you were just lucky to be early to a coin taking advantage of a short term source of hype then you may want to take profits on the way up rather than hold longer term.-Liquidity:Most new coins do not launch with significant liquidity. If you are working with less capital then this can actually be an advantage for you in some cases. When a coin has lower liquidity, it means that large buys/sells will move price more. It also means that volatility will generally be greater as it takes less volume to move price significantly. If a coin has real potential but low liquidity, then entering with a small amount can allow you to be early without suffering too much from slippage. Then, if the coin takes off, liquidity can improve as more is added or it gets listed on more exchanges (centralized or decentralized) which can allow larger players to then buy as well.-Holders:You can check on-chain how many holders a coin has. Clearly, the lower the number of holders is, the earlier you are.-Age:You can also check on-chain to see when the smart contract for a coin was deployed and when it was first listed on a decentralized exchange to determine exactly how new a project is.Strategy:The easiest way to start scanning new coins and checking the characteristics I just covered is through DexScreener. Very new coins won’t always be listed on CoinGecko or CoinMarketCap yet, but DexScreener lists coins as soon as they are added to a dex. It also displays price, market cap, volume, liquidity, FDV, and other metrics to make it easy to decide which coins to give a deeper look. You can also filter all the new coins by characteristics such as age, liquidity, what chain they are on, price change, and more. There are a few reasons a coin may catch your attention: large number of trades being taken, large price increases, significant liquidity being added early on, or even just the name of the coin. Regardless, once you see a coin you want to learn more about you can click on it to open the chart and see more details. Here’s what to check next:-Name/Contract Address:You can search the name and/or contract address of a coin on twitter and do a quick scan for any red flags or or positive signs. Red flags would include credible information that the coin may be a scam/rug or that the team/dev is dumping early on. Positive signs could include an active twitter page for the project, a community around it, or traders with strong track records following/mentioning it.-Holders/Liquidity Providers:If one or a few addresses hold a significant portion of a coin’s supply it is worth figuring out why. One of the larger holders will usually be the liquidity pool for the dex, but it is also possible that a team/dev reserved a large portion of the tokens for themselves. It is a good sign if the LP tokens for the pool and any team/dev allocations are locked at least for a fair period of time as this incentivizes them to grow the project and removes concerns about immediate dumping. Another reason an address may hold a large portion of the supply is if they were extremely early or sniped the token launch to buy a lot of coins for very cheap. If this is the case, they will almost always dump the tokens at some point. However, if the project has real potential then that dump could provide a good entry.Risk Management:It is absolutely essential to practice strong risk management when trading new coins. It is completely possible for a new coin to go to 0 and for your investment to end up worthless. That is the risk you take in exchange for the potentially massive rewards. However, if you implement risk management procedures then you can lower that risk.-Portfolio Allocation:You should not be risking any amount you are not willing to lose on new coins. Even if a new coin does end up going 10X or more, it is very common for there to be corrections of -50% or more during that uptrend due to the extreme volatility of microcap coins. If you are overinvested then these corrections could cause you to panic sell and miss out on the subsequent gains. On the other hand, if you are comfortable with the amount you invested then you will be able to remain calm and hold through the volatility.-Taking Profits:So you did the research, found a promising coin early on, and have made some crazy returns … don’t be scared to take profits if the amount you made is significant to you personally. It is very easy to see someone else on twitter making a 6 figure trade or holding a memecoin for 1000X and feel like your own gains are small in comparison. Unfortunately, this has led to many people refusing to take profits and giving back life-changing profits. Don’t let that happen to you. You can always take at least partial profits and continue holding some coins in case the uptrend continues.
Finding New Coins
Some of the craziest returns of 5X, 10X, 50X, or even more are achieved by people who find new coins early on-chain and hold them as they explode in growth. Here’s how you can start researching and finding these coins for yourself 👇🏼 Finding New Coins:There are a few key metrics to look at to determine how early you are to a coin:-Market Cap:This is the most important metric to check as it directly affects how much room for future growth a coin has. With new high risk / high reward coins, you are going to be looking for gains of multiple Xs. If a coin is at a market cap of $500k then it can 20X and still only be at a market cap of $10M. However, if a coin is already at a market cap of $2M then reaching that same $10M market cap target would be a 5X. What market cap range you look for when deciding whether to buy a coin or when to take profit depends on your personal view of the potential of the coin. If you find a project with real utility in a sector of crypto with a lot of demand, or a project that offers improvements over existing products/services then you may aim for higher. On the other hand, if you were just lucky to be early to a coin taking advantage of a short term source of hype then you may want to take profits on the way up rather than hold longer term.-Liquidity:Most new coins do not launch with significant liquidity. If you are working with less capital then this can actually be an advantage for you in some cases. When a coin has lower liquidity, it means that large buys/sells will move price more. It also means that volatility will generally be greater as it takes less volume to move price significantly. If a coin has real potential but low liquidity, then entering with a small amount can allow you to be early without suffering too much from slippage. Then, if the coin takes off, liquidity can improve as more is added or it gets listed on more exchanges (centralized or decentralized) which can allow larger players to then buy as well.-Holders:You can check on-chain how many holders a coin has. Clearly, the lower the number of holders is, the earlier you are.-Age:You can also check on-chain to see when the smart contract for a coin was deployed and when it was first listed on a decentralized exchange to determine exactly how new a project is.Strategy:The easiest way to start scanning new coins and checking the characteristics I just covered is through DexScreener. Very new coins won’t always be listed on CoinGecko or CoinMarketCap yet, but DexScreener lists coins as soon as they are added to a dex. It also displays price, market cap, volume, liquidity, FDV, and other metrics to make it easy to decide which coins to give a deeper look. You can also filter all the new coins by characteristics such as age, liquidity, what chain they are on, price change, and more. There are a few reasons a coin may catch your attention: large number of trades being taken, large price increases, significant liquidity being added early on, or even just the name of the coin. Regardless, once you see a coin you want to learn more about you can click on it to open the chart and see more details. Here’s what to check next:-Name/Contract Address:You can search the name and/or contract address of a coin on twitter and do a quick scan for any red flags or or positive signs. Red flags would include credible information that the coin may be a scam/rug or that the team/dev is dumping early on. Positive signs could include an active twitter page for the project, a community around it, or traders with strong track records following/mentioning it.-Holders/Liquidity Providers:If one or a few addresses hold a significant portion of a coin’s supply it is worth figuring out why. One of the larger holders will usually be the liquidity pool for the dex, but it is also possible that a team/dev reserved a large portion of the tokens for themselves. It is a good sign if the LP tokens for the pool and any team/dev allocations are locked at least for a fair period of time as this incentivizes them to grow the project and removes concerns about immediate dumping. Another reason an address may hold a large portion of the supply is if they were extremely early or sniped the token launch to buy a lot of coins for very cheap. If this is the case, they will almost always dump the tokens at some point. However, if the project has real potential then that dump could provide a good entry.Risk Management:It is absolutely essential to practice strong risk management when trading new coins. It is completely possible for a new coin to go to 0 and for your investment to end up worthless. That is the risk you take in exchange for the potentially massive rewards. However, if you implement risk management procedures then you can lower that risk.-Portfolio Allocation:You should not be risking any amount you are not willing to lose on new coins. Even if a new coin does end up going 10X or more, it is very common for there to be corrections of -50% or more during that uptrend due to the extreme volatility of microcap coins. If you are overinvested then these corrections could cause you to panic sell and miss out on the subsequent gains. On the other hand, if you are comfortable with the amount you invested then you will be able to remain calm and hold through the volatility.-Taking Profits:So you did the research, found a promising coin early on, and have made some crazy returns … don’t be scared to take profits if the amount you made is significant to you personally. It is very easy to see someone else on twitter making a 6 figure trade or holding a memecoin for 1000X and feel like your own gains are small in comparison. Unfortunately, this has led to many people refusing to take profits and giving back life-changing profits. Don’t let that happen to you. You can always take at least partial profits and continue holding some coins in case the uptrend continues.
17
12
98
35.5k
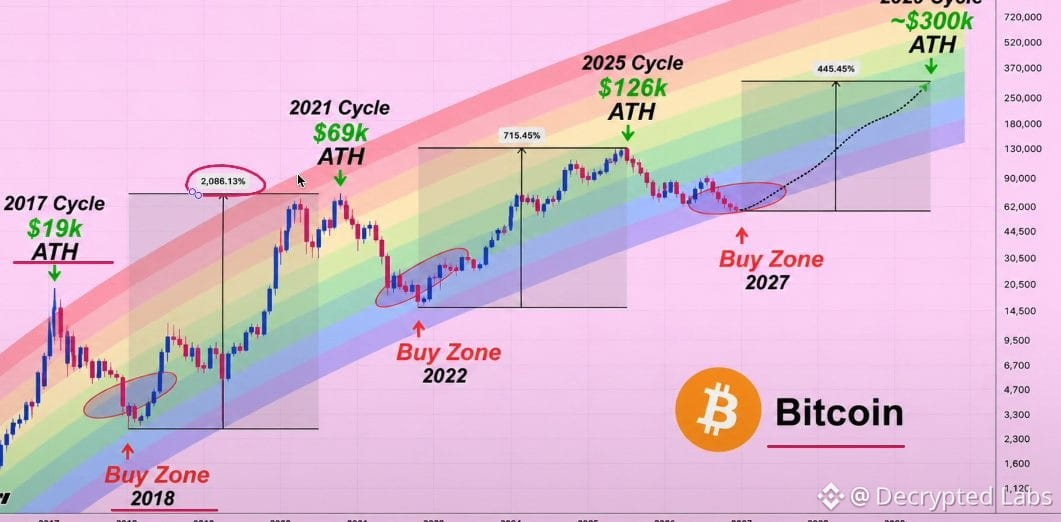
🚨 BITCOIN'S FINAL CRASH BEFORE $300,000 IS GETTING CLOSER.
And I believe most investors will make the same mistake they made in every previous cycle.
They'll panic at the bottom and buy back when it's too late.
LOOK AT THIS CHART.
My Bitcoin roadmap hasn't changed:
$126K → $87K → $64K → $55K → $300K
I believe we're already 60% through the bear market.
But the most important move may still be ahead.
HERE'S WHAT I'M WATCHING:
→ $55K: Final capitulation target.\
→ 2027: Potential bear market bottom.\
→ $300K: My long-term target for the next major cycle.
READ THAT AGAIN.
I'M EXPECTING ANOTHER CRASH BEFORE THE BIGGEST RALLY.
And that's exactly why I'm not blindly buying every bounce.
The final phase of a bear market is where patience gets tested.
Retail loses confidence.
Everyone starts predicting lower prices.
And the investors who were begging to buy Bitcoin cheaper suddenly become too terrified to touch it.
We've seen this psychology before.
REMEMBER MY PREVIOUS CALLS?
November 2022: Bitcoin bottomed at $15,476.
October 2025: Bitcoin topped near $126,200.
Now I'm watching for the next major turning point.
And I believe this next call could be even more important.
Does $55K guarantee the bottom? No.
I'll be watching for confirmation before treating it as the final accumulation opportunity.
But one thing is certain about my strategy:
WHEN I DECIDE TO EXIT THE MARKET COMPLETELY, I'LL POST IT HERE PUBLICLY.
Just like my previous major market calls.
SAVE THIS CHART.
Come back in 2027 and see how the roadmap played out.
Follow and turn notifications on.
You won't want to miss my next major Bitcoin signal.
THE BIGGEST MISTAKE ISN'T MISSING THE TOP.
IT'S SURVIVING THE ENTIRE BEAR MARKET ONLY TO SELL RIGHT BEFORE THE NEXT BULL RUN.
🚨 BITCOIN'S FINAL CRASH BEFORE $300,000 IS GETTING CLOSER.
And I believe most investors will make the same mistake they made in every previous cycle.
They'll panic at the bottom and buy back when it's too late.
LOOK AT THIS CHART.
My Bitcoin roadmap hasn't changed:
$126K → $87K → $64K → $55K → $300K
I believe we're already 60% through the bear market.
But the most important move may still be ahead.
HERE'S WHAT I'M WATCHING:
→ $55K: Final capitulation target.\
→ 2027: Potential bear market bottom.\
→ $300K: My long-term target for the next major cycle.
READ THAT AGAIN.
I'M EXPECTING ANOTHER CRASH BEFORE THE BIGGEST RALLY.
And that's exactly why I'm not blindly buying every bounce.
The final phase of a bear market is where patience gets tested.
Retail loses confidence.
Everyone starts predicting lower prices.
And the investors who were begging to buy Bitcoin cheaper suddenly become too terrified to touch it.
We've seen this psychology before.
REMEMBER MY PREVIOUS CALLS?
November 2022: Bitcoin bottomed at $15,476.
October 2025: Bitcoin topped near $126,200.
Now I'm watching for the next major turning point.
And I believe this next call could be even more important.
Does $55K guarantee the bottom? No.
I'll be watching for confirmation before treating it as the final accumulation opportunity.
But one thing is certain about my strategy:
WHEN I DECIDE TO EXIT THE MARKET COMPLETELY, I'LL POST IT HERE PUBLICLY.
Just like my previous major market calls.
SAVE THIS CHART.
Come back in 2027 and see how the roadmap played out.
Follow and turn notifications on.
You won't want to miss my next major Bitcoin signal.
THE BIGGEST MISTAKE ISN'T MISSING THE TOP.
IT'S SURVIVING THE ENTIRE BEAR MARKET ONLY TO SELL RIGHT BEFORE THE NEXT BULL RUN.
And I believe most investors will make the same mistake they made in every previous cycle.
They'll panic at the bottom and buy back when it's too late.
LOOK AT THIS CHART.
My Bitcoin roadmap hasn't changed:
$126K → $87K → $64K → $55K → $300K
I believe we're already 60% through the bear market.
But the most important move may still be ahead.
HERE'S WHAT I'M WATCHING:
→ $55K: Final capitulation target.\
→ 2027: Potential bear market bottom.\
→ $300K: My long-term target for the next major cycle.
READ THAT AGAIN.
I'M EXPECTING ANOTHER CRASH BEFORE THE BIGGEST RALLY.
And that's exactly why I'm not blindly buying every bounce.
The final phase of a bear market is where patience gets tested.
Retail loses confidence.
Everyone starts predicting lower prices.
And the investors who were begging to buy Bitcoin cheaper suddenly become too terrified to touch it.
We've seen this psychology before.
REMEMBER MY PREVIOUS CALLS?
November 2022: Bitcoin bottomed at $15,476.
October 2025: Bitcoin topped near $126,200.
Now I'm watching for the next major turning point.
And I believe this next call could be even more important.
Does $55K guarantee the bottom? No.
I'll be watching for confirmation before treating it as the final accumulation opportunity.
But one thing is certain about my strategy:
WHEN I DECIDE TO EXIT THE MARKET COMPLETELY, I'LL POST IT HERE PUBLICLY.
Just like my previous major market calls.
SAVE THIS CHART.
Come back in 2027 and see how the roadmap played out.
Follow and turn notifications on.
You won't want to miss my next major Bitcoin signal.
THE BIGGEST MISTAKE ISN'T MISSING THE TOP.
IT'S SURVIVING THE ENTIRE BEAR MARKET ONLY TO SELL RIGHT BEFORE THE NEXT BULL RUN.
6
1.2k
Bitcoin Weekly Analysis
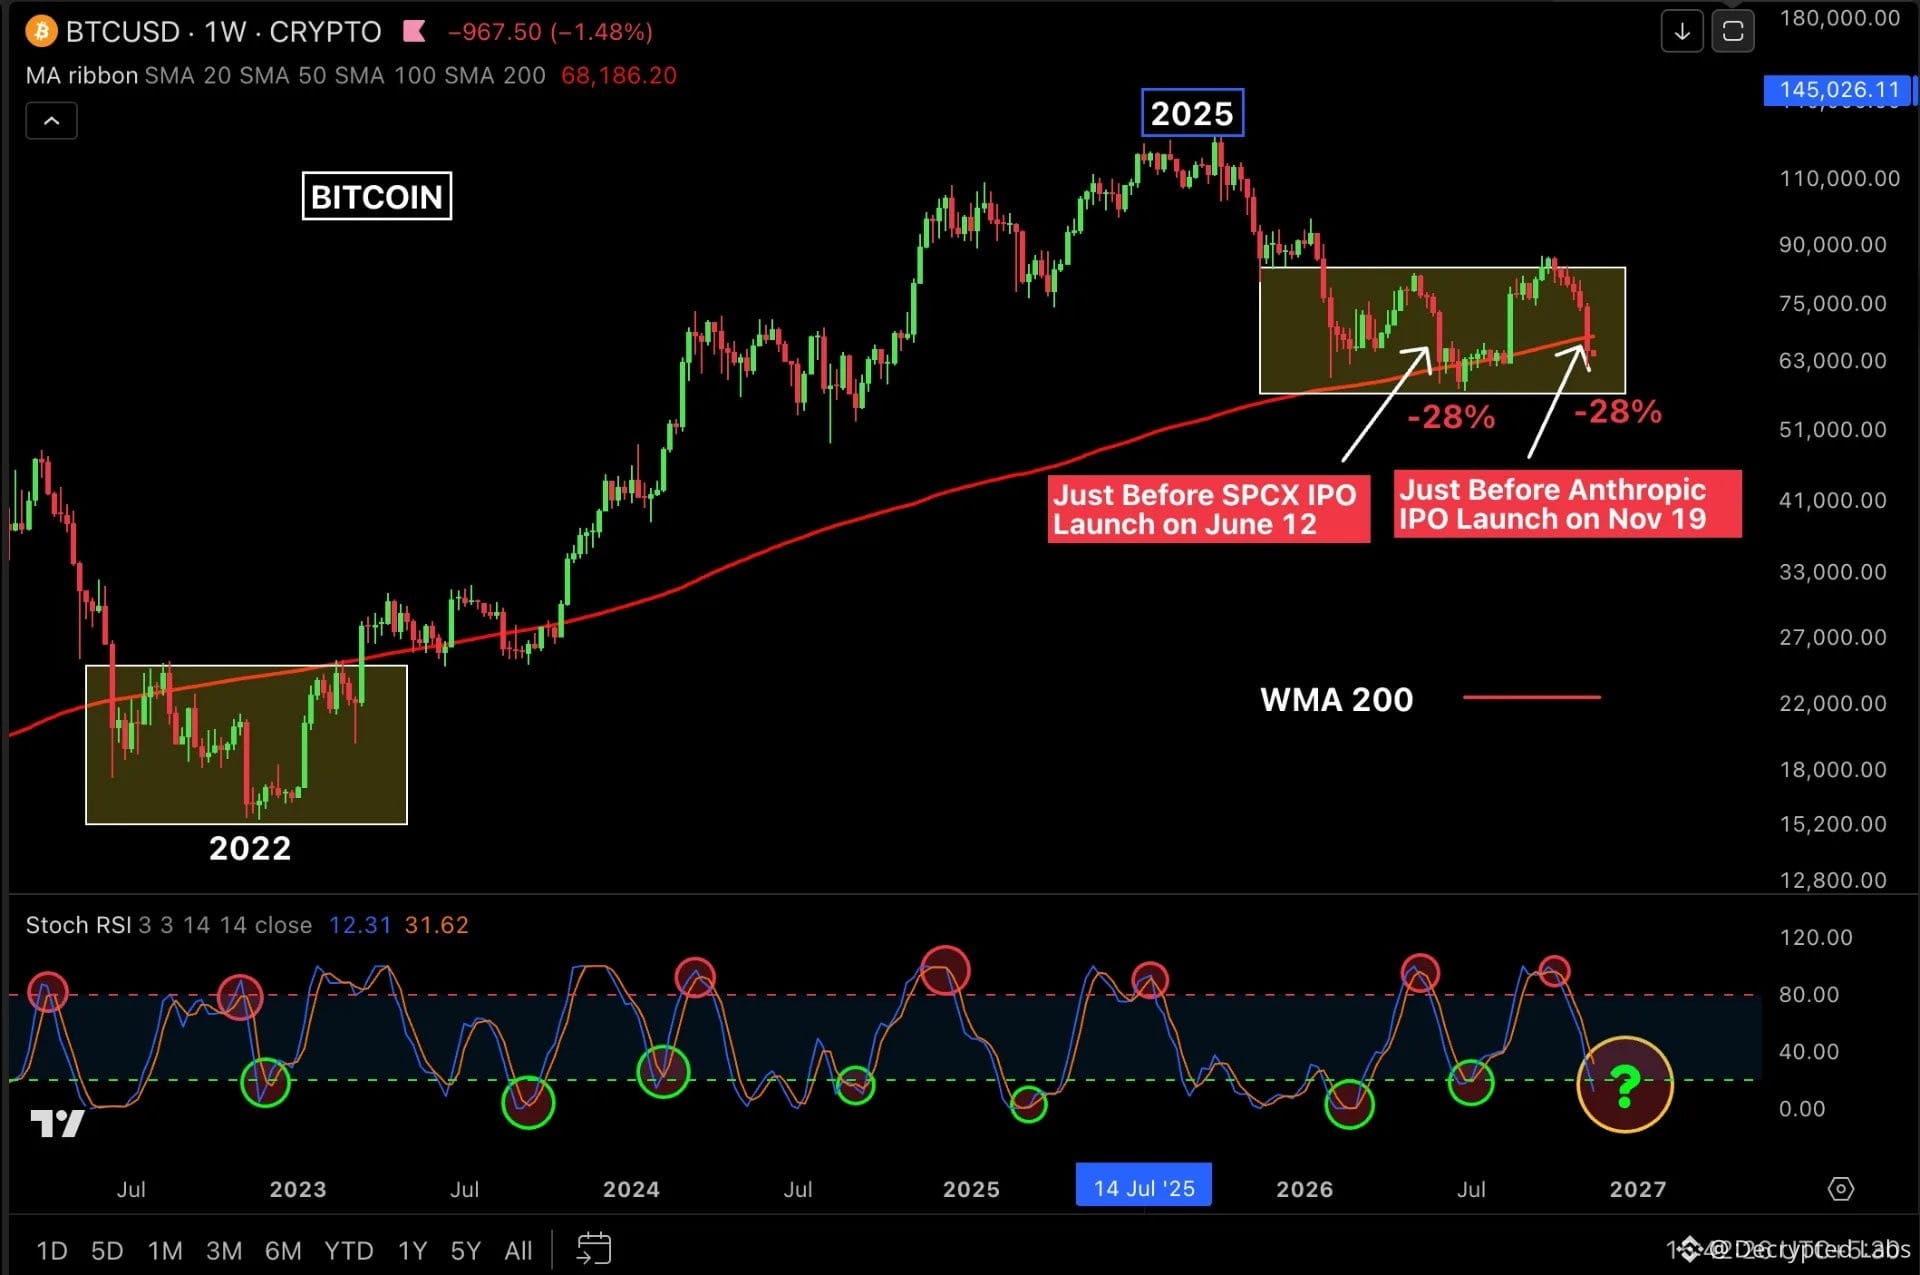
$BTC closed its sixth consecutive red weekly candle, down 12.5% this week, and fell below its weekly 200 MA near $68,000.
Key levels to watch:
- Support: $58,000
- Resistance: $68,200 (Weekly MA 200)
- Major resistance: $74,500 (Weekly MA 50)
Reasons behind this correction:
1. Technical: Bitcoin failed to break above $82K, which made sellers quickly take control.
2. Cycle behaviour: Every BTC cycle has seen a panic-style capitulation in the final quarter of the bear phase, and we are seeing the same pattern again.
3. US Midterm Elections: BTC has historically corrected after November midterms. It fell 50% in 2018 and about 28% around the 2022 midterms. From the recent high, it is again down about 28%.
4. Large IPO liquidity drain: Bitcoin dropped roughly 28% ahead of the SpaceX IPO on June 12. Now, with Anthropic's IPO expected on November 19, we're seeing another major correction.
None of this is new. Bitcoin has seen this in previous cycles too. November panic has historically been a good time to accumulate for the long term.
#BitcoinExtendsLosingStreakToSixWeeks
Bitcoin Weekly Analysis
$BTC closed its sixth consecutive red weekly candle, down 12.5% this week, and fell below its weekly 200 MA near $68,000.
Key levels to watch:
- Support: $58,000
- Resistance: $68,200 (Weekly MA 200)
- Major resistance: $74,500 (Weekly MA 50)
Reasons behind this correction:
1. Technical: Bitcoin failed to break above $82K, which made sellers quickly take control.
2. Cycle behaviour: Every BTC cycle has seen a panic-style capitulation in the final quarter of the bear phase, and we are seeing the same pattern again.
3. US Midterm Elections: BTC has historically corrected after November midterms. It fell 50% in 2018 and about 28% around the 2022 midterms. From the recent high, it is again down about 28%.
4. Large IPO liquidity drain: Bitcoin dropped roughly 28% ahead of the SpaceX IPO on June 12. Now, with Anthropic's IPO expected on November 19, we're seeing another major correction.
None of this is new. Bitcoin has seen this in previous cycles too. November panic has historically been a good time to accumulate for the long term.
#BitcoinExtendsLosingStreakToSixWeeks
$BTC closed its sixth consecutive red weekly candle, down 12.5% this week, and fell below its weekly 200 MA near $68,000.
Key levels to watch:
- Support: $58,000
- Resistance: $68,200 (Weekly MA 200)
- Major resistance: $74,500 (Weekly MA 50)
Reasons behind this correction:
1. Technical: Bitcoin failed to break above $82K, which made sellers quickly take control.
2. Cycle behaviour: Every BTC cycle has seen a panic-style capitulation in the final quarter of the bear phase, and we are seeing the same pattern again.
3. US Midterm Elections: BTC has historically corrected after November midterms. It fell 50% in 2018 and about 28% around the 2022 midterms. From the recent high, it is again down about 28%.
4. Large IPO liquidity drain: Bitcoin dropped roughly 28% ahead of the SpaceX IPO on June 12. Now, with Anthropic's IPO expected on November 19, we're seeing another major correction.
None of this is new. Bitcoin has seen this in previous cycles too. November panic has historically been a good time to accumulate for the long term.
#BitcoinExtendsLosingStreakToSixWeeks
162
If you missed buying:
$ETH in 2021
$ETH in 2022
$ETH in 2023
$ETH in 2024
$ETH in 2025
Don't worry, you can buy it today at the same price.
If you missed buying:
$ETH in 2021
$ETH in 2022
$ETH in 2023
$ETH in 2024
$ETH in 2025
Don't worry, you can buy it today at the same price.
$ETH in 2021
$ETH in 2022
$ETH in 2023
$ETH in 2024
$ETH in 2025
Don't worry, you can buy it today at the same price.

Gift
Decrypted Labs වෙතින්
169
My targets for the next 6-8 months:
$BTC: $100K - $150K
$ETH: $3K - $6K
$SOL: $250 - $500
$XRP: $3 - $5
$DOGE: $0.50 - $1
Save this.
My targets for the next 6-8 months:
$BTC: $100K - $150K
$ETH: $3K - $6K
$SOL: $250 - $500
$XRP: $3 - $5
$DOGE: $0.50 - $1
Save this.
$BTC: $100K - $150K
$ETH: $3K - $6K
$SOL: $250 - $500
$XRP: $3 - $5
$DOGE: $0.50 - $1
Save this.
Red Packet
Decrypted Labs වෙතින්
1
2
132
THE GLOBAL MARKETS COULD FACE HUGE PRESSURE NEXT WEEK.
Bitcoin has a history of reacting early when things are not looking good in the global markets.
And next week, we have several major events that could shake things:
1. Nvidia will report its earnings
2. The October Fed meeting minutes will hint at a December rate hike
3. Anthropic is expected to launch its IPO, and investors might sell existing stocks to free up capital for the new offering
4. A historic meeting between Donald Trump, and Vladimir Putin could have a major impact on financial markets.
Manage your risk and avoid high-leverage trading.
#BitcoinActiveSupplyInProfitDropsBelow45%
THE GLOBAL MARKETS COULD FACE HUGE PRESSURE NEXT WEEK.
Bitcoin has a history of reacting early when things are not looking good in the global markets.
And next week, we have several major events that could shake things:
1. Nvidia will report its earnings
2. The October Fed meeting minutes will hint at a December rate hike
3. Anthropic is expected to launch its IPO, and investors might sell existing stocks to free up capital for the new offering
4. A historic meeting between Donald Trump, and Vladimir Putin could have a major impact on financial markets.
Manage your risk and avoid high-leverage trading.
#BitcoinActiveSupplyInProfitDropsBelow45%
Bitcoin has a history of reacting early when things are not looking good in the global markets.
And next week, we have several major events that could shake things:
1. Nvidia will report its earnings
2. The October Fed meeting minutes will hint at a December rate hike
3. Anthropic is expected to launch its IPO, and investors might sell existing stocks to free up capital for the new offering
4. A historic meeting between Donald Trump, and Vladimir Putin could have a major impact on financial markets.
Manage your risk and avoid high-leverage trading.
#BitcoinActiveSupplyInProfitDropsBelow45%
92
ලිපිය
BITCOIN IS CRASHING, AND I BELIEVE WALL STREET HAS CHANGED THE GAME FOREVER.It's NOT just the AI bubble.
It's NOT just inflation.
And it's NOT simply retail investors panic selling.
Something much bigger has been happening to Bitcoin for YEARS.
And almost nobody understands what it means.
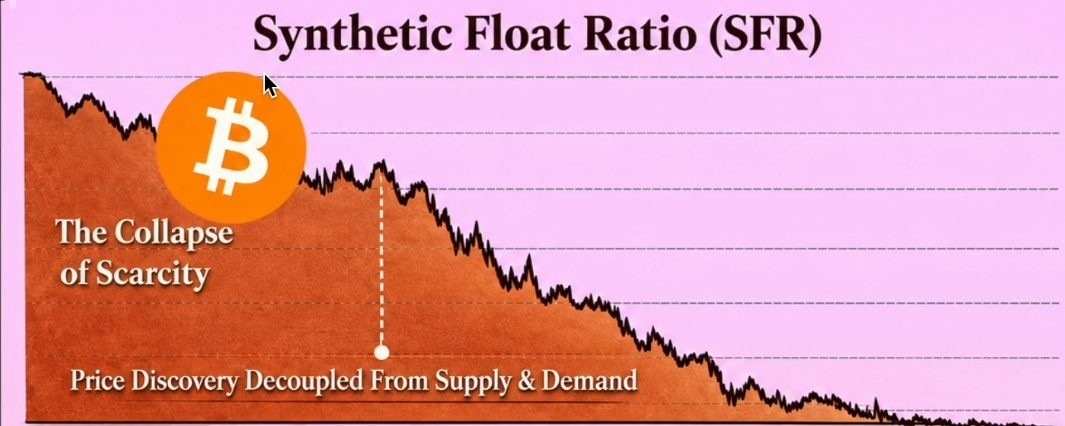
LOOK AT THIS CHART.
Bitcoin was built around one revolutionary idea:
ONLY 21 MILLION BTC WILL EVER EXIST.
No central bank can print more.
No government can increase the supply.
Absolute scarcity.
But here's the question nobody wants to ask.
WHAT HAPPENS WHEN WALL STREET CAN CREATE VIRTUALLY UNLIMITED FINANCIAL EXPOSURE TO AN ASSET WITH LIMITED SUPPLY?
That's where things get interesting.
And potentially VERY dangerous.
The market trading Bitcoin today is fundamentally different from the market that existed a decade ago.
We now have:
→ Cash-settled futures.
→ Perpetual swaps.
→ Options.
→ Spot Bitcoin ETFs.
→ Institutional lending.
→ Wrapped BTC.
→ Total return swaps.
All built around the SAME underlying asset.
And here's what most investors are missing.
YOU DON'T NEED TO OWN ACTUAL BITCOIN TO TRADE ITS PRICE.
A trader can take a massive BTC position through derivatives without ever touching the blockchain.
An institution can hedge billions in exposure.
A leveraged fund can be liquidated.
And those transactions can influence prices across the entire market.
This is where the concept of the Synthetic Float Ratio (SFR) becomes important.
It attempts to measure the relationship between synthetic Bitcoin exposure and the underlying supply available for trading.
But here's the critical distinction.
Synthetic exposure doesn't create additional real BTC.
The 21 million supply cap remains intact.
What it DOES create is an enormous layer of financial claims and leveraged positions around that limited supply.
And that changes how price discovery works.
Think about it.
One Bitcoin can be connected to multiple financial exposures through:
→ ETF holdings.
→ Futures contracts.
→ Options positions.
→ Broker lending.
→ Wrapped assets.
→ Structured products.
These aren't necessarily six separate ownership claims on the same coin.
But they demonstrate how much financial activity can develop around a relatively small amount of underlying BTC.
And when leverage becomes excessive, the consequences can be BRUTAL.
Here's the mechanism I'm watching.
PHASE 1: THE LEVERAGE BUILDS.
Traders open increasingly aggressive positions.
Derivatives activity expands.
Everyone expects the next major rally.
PHASE 2: THE SELLING BEGINS.
Large positions are unwound.
Hedging flows amplify price movements.
Leveraged traders start getting liquidated.
PHASE 3: THE LIQUIDATION CASCADE.
Forced selling creates more selling.
Support levels break.
Liquidations accelerate.
And suddenly Bitcoin is falling much faster than spot-market demand alone might suggest.
PHASE 4: THE OPPORTUNITY.
Leverage gets flushed out.
Selling pressure eventually fades.
And investors start looking for signs of genuine accumulation.
THIS IS WHY UNDERSTANDING BITCOIN'S DERIVATIVES MARKET MATTERS.
We've seen financialization transform price discovery in gold, silver, oil and equities.
Now Bitcoin is increasingly exposed to similar forces.
Does this prove Wall Street is deliberately manipulating every Bitcoin crash?
NO.
And it doesn't mean derivatives have destroyed Bitcoin's scarcity.
But it DOES mean that understanding Bitcoin's price requires looking beyond the 21 million supply cap.
The blockchain hasn't changed.
THE MARKET STRUCTURE HAS.
And I believe investors who ignore that distinction could be caught completely off guard during the next major liquidation event.
Remember my previous market calls:
2022: I publicly called Bitcoin's bottom around $17K.
2025: I called the $126K cycle top.
2026: I identified the $57K local bottom.
Now I'm watching for the next major turning point.
And this time, I'm paying particularly close attention to leverage, derivatives positioning and liquidation levels.
SAVE THIS CHART.
Because the next major Bitcoin move might have less to do with retail sentiment than most people realize.
Follow and turn on notifications.
I'll share my next major Bitcoin call HERE FIRST.
BITCOIN'S SUPPLY IS STILL LIMITED TO 21 MILLION.
BUT THE FINANCIAL EXPOSURE BUILT AROUND IT ISN'T.
UNDERSTAND THE DIFFERENCE BEFORE THE NEXT LIQUIDATION WAVE.
BITCOIN IS CRASHING, AND I BELIEVE WALL STREET HAS CHANGED THE GAME FOREVER.
It's NOT just the AI bubble.
It's NOT just inflation.
And it's NOT simply retail investors panic selling.
Something much bigger has been happening to Bitcoin for YEARS.
And almost nobody understands what it means.
LOOK AT THIS CHART.
Bitcoin was built around one revolutionary idea:
ONLY 21 MILLION BTC WILL EVER EXIST.
No central bank can print more.
No government can increase the supply.
Absolute scarcity.
But here's the question nobody wants to ask.
WHAT HAPPENS WHEN WALL STREET CAN CREATE VIRTUALLY UNLIMITED FINANCIAL EXPOSURE TO AN ASSET WITH LIMITED SUPPLY?
That's where things get interesting.
And potentially VERY dangerous.
The market trading Bitcoin today is fundamentally different from the market that existed a decade ago.
We now have:
→ Cash-settled futures.
→ Perpetual swaps.
→ Options.
→ Spot Bitcoin ETFs.
→ Institutional lending.
→ Wrapped BTC.
→ Total return swaps.
All built around the SAME underlying asset.
And here's what most investors are missing.
YOU DON'T NEED TO OWN ACTUAL BITCOIN TO TRADE ITS PRICE.
A trader can take a massive BTC position through derivatives without ever touching the blockchain.
An institution can hedge billions in exposure.
A leveraged fund can be liquidated.
And those transactions can influence prices across the entire market.
This is where the concept of the Synthetic Float Ratio (SFR) becomes important.
It attempts to measure the relationship between synthetic Bitcoin exposure and the underlying supply available for trading.
But here's the critical distinction.
Synthetic exposure doesn't create additional real BTC.
The 21 million supply cap remains intact.
What it DOES create is an enormous layer of financial claims and leveraged positions around that limited supply.
And that changes how price discovery works.
Think about it.
One Bitcoin can be connected to multiple financial exposures through:
→ ETF holdings.
→ Futures contracts.
→ Options positions.
→ Broker lending.
→ Wrapped assets.
→ Structured products.
These aren't necessarily six separate ownership claims on the same coin.
But they demonstrate how much financial activity can develop around a relatively small amount of underlying BTC.
And when leverage becomes excessive, the consequences can be BRUTAL.
Here's the mechanism I'm watching.
PHASE 1: THE LEVERAGE BUILDS.
Traders open increasingly aggressive positions.
Derivatives activity expands.
Everyone expects the next major rally.
PHASE 2: THE SELLING BEGINS.
Large positions are unwound.
Hedging flows amplify price movements.
Leveraged traders start getting liquidated.
PHASE 3: THE LIQUIDATION CASCADE.
Forced selling creates more selling.
Support levels break.
Liquidations accelerate.
And suddenly Bitcoin is falling much faster than spot-market demand alone might suggest.
PHASE 4: THE OPPORTUNITY.
Leverage gets flushed out.
Selling pressure eventually fades.
And investors start looking for signs of genuine accumulation.
THIS IS WHY UNDERSTANDING BITCOIN'S DERIVATIVES MARKET MATTERS.
We've seen financialization transform price discovery in gold, silver, oil and equities.
Now Bitcoin is increasingly exposed to similar forces.
Does this prove Wall Street is deliberately manipulating every Bitcoin crash?
NO.
And it doesn't mean derivatives have destroyed Bitcoin's scarcity.
But it DOES mean that understanding Bitcoin's price requires looking beyond the 21 million supply cap.
The blockchain hasn't changed.
THE MARKET STRUCTURE HAS.
And I believe investors who ignore that distinction could be caught completely off guard during the next major liquidation event.
Remember my previous market calls:
2022: I publicly called Bitcoin's bottom around $17K.
2025: I called the $126K cycle top.
2026: I identified the $57K local bottom.
Now I'm watching for the next major turning point.
And this time, I'm paying particularly close attention to leverage, derivatives positioning and liquidation levels.
SAVE THIS CHART.
Because the next major Bitcoin move might have less to do with retail sentiment than most people realize.
Follow and turn on notifications.
I'll share my next major Bitcoin call HERE FIRST.
BITCOIN'S SUPPLY IS STILL LIMITED TO 21 MILLION.
BUT THE FINANCIAL EXPOSURE BUILT AROUND IT ISN'T.
UNDERSTAND THE DIFFERENCE BEFORE THE NEXT LIQUIDATION WAVE.
It's NOT just inflation.
And it's NOT simply retail investors panic selling.
Something much bigger has been happening to Bitcoin for YEARS.
And almost nobody understands what it means.
LOOK AT THIS CHART.
Bitcoin was built around one revolutionary idea:
ONLY 21 MILLION BTC WILL EVER EXIST.
No central bank can print more.
No government can increase the supply.
Absolute scarcity.
But here's the question nobody wants to ask.
WHAT HAPPENS WHEN WALL STREET CAN CREATE VIRTUALLY UNLIMITED FINANCIAL EXPOSURE TO AN ASSET WITH LIMITED SUPPLY?
That's where things get interesting.
And potentially VERY dangerous.
The market trading Bitcoin today is fundamentally different from the market that existed a decade ago.
We now have:
→ Cash-settled futures.
→ Perpetual swaps.
→ Options.
→ Spot Bitcoin ETFs.
→ Institutional lending.
→ Wrapped BTC.
→ Total return swaps.
All built around the SAME underlying asset.
And here's what most investors are missing.
YOU DON'T NEED TO OWN ACTUAL BITCOIN TO TRADE ITS PRICE.
A trader can take a massive BTC position through derivatives without ever touching the blockchain.
An institution can hedge billions in exposure.
A leveraged fund can be liquidated.
And those transactions can influence prices across the entire market.
This is where the concept of the Synthetic Float Ratio (SFR) becomes important.
It attempts to measure the relationship between synthetic Bitcoin exposure and the underlying supply available for trading.
But here's the critical distinction.
Synthetic exposure doesn't create additional real BTC.
The 21 million supply cap remains intact.
What it DOES create is an enormous layer of financial claims and leveraged positions around that limited supply.
And that changes how price discovery works.
Think about it.
One Bitcoin can be connected to multiple financial exposures through:
→ ETF holdings.
→ Futures contracts.
→ Options positions.
→ Broker lending.
→ Wrapped assets.
→ Structured products.
These aren't necessarily six separate ownership claims on the same coin.
But they demonstrate how much financial activity can develop around a relatively small amount of underlying BTC.
And when leverage becomes excessive, the consequences can be BRUTAL.
Here's the mechanism I'm watching.
PHASE 1: THE LEVERAGE BUILDS.
Traders open increasingly aggressive positions.
Derivatives activity expands.
Everyone expects the next major rally.
PHASE 2: THE SELLING BEGINS.
Large positions are unwound.
Hedging flows amplify price movements.
Leveraged traders start getting liquidated.
PHASE 3: THE LIQUIDATION CASCADE.
Forced selling creates more selling.
Support levels break.
Liquidations accelerate.
And suddenly Bitcoin is falling much faster than spot-market demand alone might suggest.
PHASE 4: THE OPPORTUNITY.
Leverage gets flushed out.
Selling pressure eventually fades.
And investors start looking for signs of genuine accumulation.
THIS IS WHY UNDERSTANDING BITCOIN'S DERIVATIVES MARKET MATTERS.
We've seen financialization transform price discovery in gold, silver, oil and equities.
Now Bitcoin is increasingly exposed to similar forces.
Does this prove Wall Street is deliberately manipulating every Bitcoin crash?
NO.
And it doesn't mean derivatives have destroyed Bitcoin's scarcity.
But it DOES mean that understanding Bitcoin's price requires looking beyond the 21 million supply cap.
The blockchain hasn't changed.
THE MARKET STRUCTURE HAS.
And I believe investors who ignore that distinction could be caught completely off guard during the next major liquidation event.
Remember my previous market calls:
2022: I publicly called Bitcoin's bottom around $17K.
2025: I called the $126K cycle top.
2026: I identified the $57K local bottom.
Now I'm watching for the next major turning point.
And this time, I'm paying particularly close attention to leverage, derivatives positioning and liquidation levels.
SAVE THIS CHART.
Because the next major Bitcoin move might have less to do with retail sentiment than most people realize.
Follow and turn on notifications.
I'll share my next major Bitcoin call HERE FIRST.
BITCOIN'S SUPPLY IS STILL LIMITED TO 21 MILLION.
BUT THE FINANCIAL EXPOSURE BUILT AROUND IT ISN'T.
UNDERSTAND THE DIFFERENCE BEFORE THE NEXT LIQUIDATION WAVE.
5
805
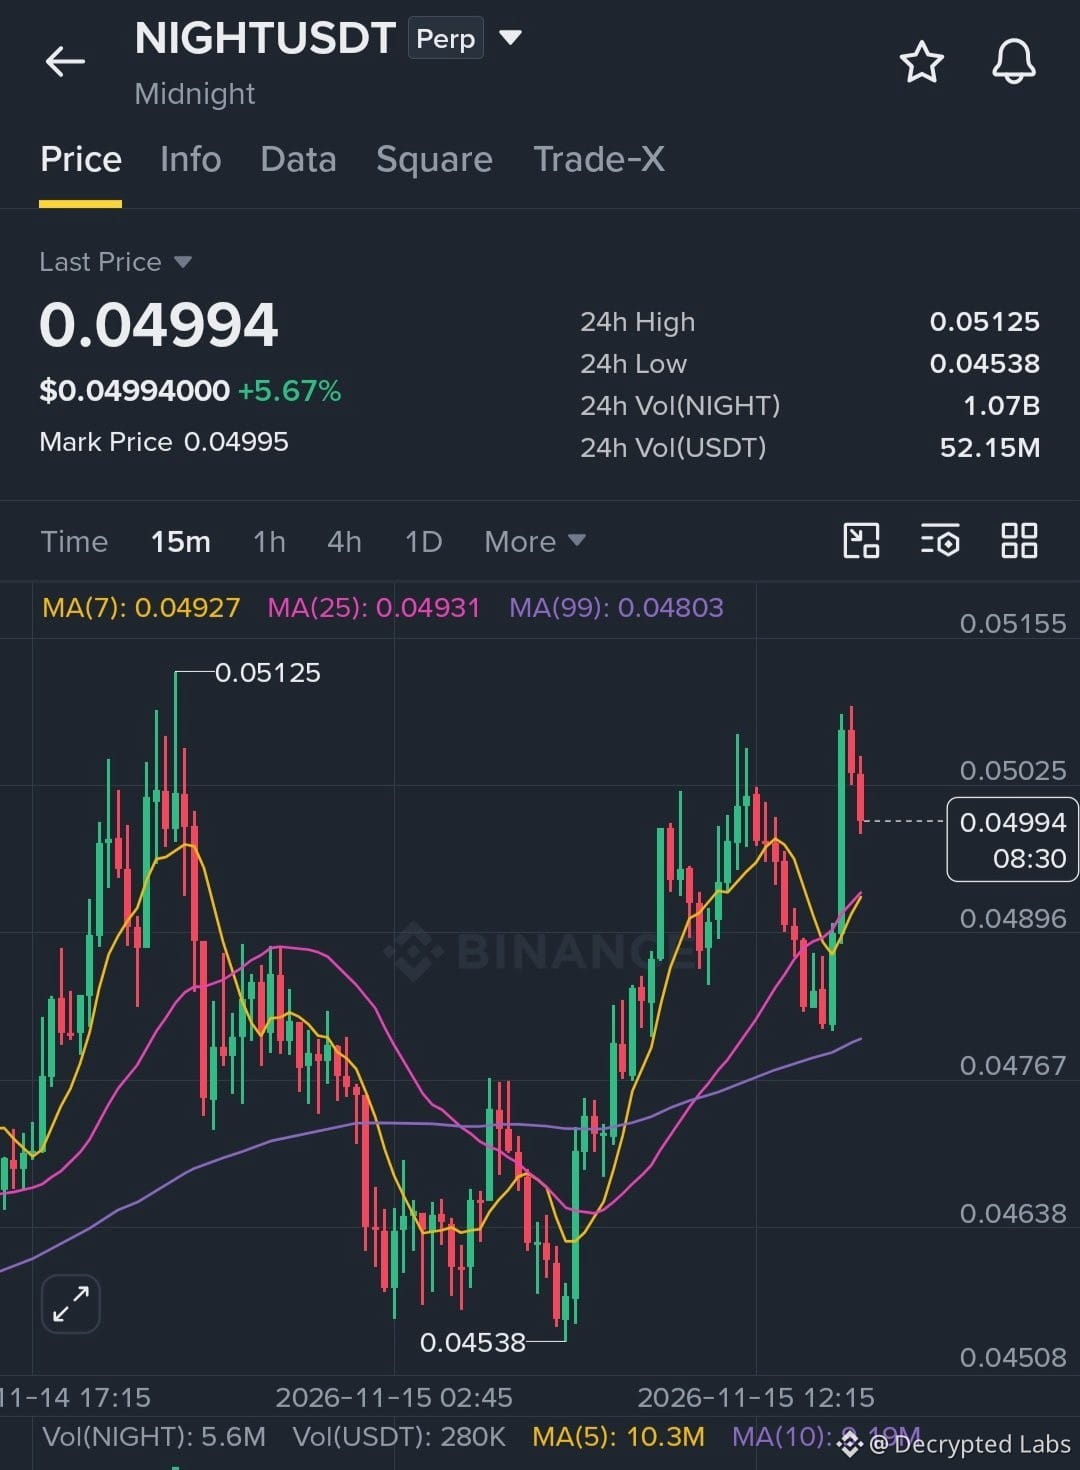
$NIGHT can trigger another big rally
Long $NIGHT
Entry: $0.0475 – $0.0495
SL: $0.0455
TP1: $0.0512
TP2: $0.0525
TP3: $0.0540
TP4: $0.0560
Trade smart. DYOR.
{spot}(NIGHTUSDT)
$NIGHT can trigger another big rally
Long $NIGHT
Entry: $0.0475 – $0.0495
SL: $0.0455
TP1: $0.0512
TP2: $0.0525
TP3: $0.0540
TP4: $0.0560
Trade smart. DYOR.
Long $NIGHT
Entry: $0.0475 – $0.0495
SL: $0.0455
TP1: $0.0512
TP2: $0.0525
TP3: $0.0540
TP4: $0.0560
Trade smart. DYOR.
108
🚨 PRE-MARKET STOCKS WATCHLIST — NOV 16, 2026
$AKAN
Current Price: $1.86
Entry Zone: Above $1.94
Pullback Entry: $1.67–$1.73
Targets: $2.00 → $2.15 → $2.30 → $2.50 → $2.75 → $3.00+
$CLRO
Current Price: $4.28
Entry Zone: $4.50–$4.56
Pullback Entry: $4.10–$4.25
Targets: $4.70 → $4.90 → $5.10 → $5.35 → $5.65 → $6.00+
$VTSI.US
Current Price: $4.27
Entry Zone: $4.31–$4.36 (after holding above $4.30)
Pullback Entry: $4.15–$4.23
Targets: $4.45 → $4.60 → $4.80 → $5.00 → $5.20 → $5.45+
$POLA.US
Current Price: $0.385
Entry Zone: $0.405–$0.420 (after regaining momentum)
Pullback Entry: $0.365–$0.380
Targets: $0.44 → $0.4705 → $0.50 → $0.55 → $0.60+
$GIPR
Current Price: $0.40
Entry Zone: $0.425–$0.435
Pullback Entry: $0.375–$0.390
Targets: $0.46 → $0.50 → $0.55 → $0.60 → $0.68+
$FCUV.US
Current Price: $5.15
Entry Zone: $5.40–$5.55
Pullback Entry: $4.90–$5.05
Targets: $5.75 → $6.00 → $6.35 → $6.70 → $7.05 → $7.50+
============================= =====
CONTINUATION WATCH:
$NMAX
Breakout Level: $9.90–$10.00
$SBC
Reclaim Level: $7.20
Breakout Level: $7.38–$7.50
$NU
Reclaim Level: $13.25
Confirmation: Hold above $13.30
$HTZ
Breakout Level: $1.76–$1.80
⚠️ Wait for confirmation. Don't chase extended candles. Manage risk.
❤️ Enjoyed the watchlist? Follow, like & share.
DYOR
🚨 PRE-MARKET STOCKS WATCHLIST — NOV 16, 2026
$AKAN
Current Price: $1.86
Entry Zone: Above $1.94
Pullback Entry: $1.67–$1.73
Targets: $2.00 → $2.15 → $2.30 → $2.50 → $2.75 → $3.00+
$CLRO
Current Price: $4.28
Entry Zone: $4.50–$4.56
Pullback Entry: $4.10–$4.25
Targets: $4.70 → $4.90 → $5.10 → $5.35 → $5.65 → $6.00+
$VTSI.US
Current Price: $4.27
Entry Zone: $4.31–$4.36 (after holding above $4.30)
Pullback Entry: $4.15–$4.23
Targets: $4.45 → $4.60 → $4.80 → $5.00 → $5.20 → $5.45+
$POLA.US
Current Price: $0.385
Entry Zone: $0.405–$0.420 (after regaining momentum)
Pullback Entry: $0.365–$0.380
Targets: $0.44 → $0.4705 → $0.50 → $0.55 → $0.60+
$GIPR
Current Price: $0.40
Entry Zone: $0.425–$0.435
Pullback Entry: $0.375–$0.390
Targets: $0.46 → $0.50 → $0.55 → $0.60 → $0.68+
$FCUV.US
Current Price: $5.15
Entry Zone: $5.40–$5.55
Pullback Entry: $4.90–$5.05
Targets: $5.75 → $6.00 → $6.35 → $6.70 → $7.05 → $7.50+
============================= =====
CONTINUATION WATCH:
$NMAX
Breakout Level: $9.90–$10.00
$SBC
Reclaim Level: $7.20
Breakout Level: $7.38–$7.50
$NU
Reclaim Level: $13.25
Confirmation: Hold above $13.30
$HTZ
Breakout Level: $1.76–$1.80
⚠️ Wait for confirmation. Don't chase extended candles. Manage risk.
❤️ Enjoyed the watchlist? Follow, like & share.
DYOR
$AKAN
Current Price: $1.86
Entry Zone: Above $1.94
Pullback Entry: $1.67–$1.73
Targets: $2.00 → $2.15 → $2.30 → $2.50 → $2.75 → $3.00+
$CLRO
Current Price: $4.28
Entry Zone: $4.50–$4.56
Pullback Entry: $4.10–$4.25
Targets: $4.70 → $4.90 → $5.10 → $5.35 → $5.65 → $6.00+
$VTSI.US
Current Price: $4.27
Entry Zone: $4.31–$4.36 (after holding above $4.30)
Pullback Entry: $4.15–$4.23
Targets: $4.45 → $4.60 → $4.80 → $5.00 → $5.20 → $5.45+
$POLA.US
Current Price: $0.385
Entry Zone: $0.405–$0.420 (after regaining momentum)
Pullback Entry: $0.365–$0.380
Targets: $0.44 → $0.4705 → $0.50 → $0.55 → $0.60+
$GIPR
Current Price: $0.40
Entry Zone: $0.425–$0.435
Pullback Entry: $0.375–$0.390
Targets: $0.46 → $0.50 → $0.55 → $0.60 → $0.68+
$FCUV.US
Current Price: $5.15
Entry Zone: $5.40–$5.55
Pullback Entry: $4.90–$5.05
Targets: $5.75 → $6.00 → $6.35 → $6.70 → $7.05 → $7.50+
============================= =====
CONTINUATION WATCH:
$NMAX
Breakout Level: $9.90–$10.00
$SBC
Reclaim Level: $7.20
Breakout Level: $7.38–$7.50
$NU
Reclaim Level: $13.25
Confirmation: Hold above $13.30
$HTZ
Breakout Level: $1.76–$1.80
⚠️ Wait for confirmation. Don't chase extended candles. Manage risk.
❤️ Enjoyed the watchlist? Follow, like & share.
DYOR
POLAUS-0.89%
VTSIUS+1.09%
FCUVUS-0.43%
408
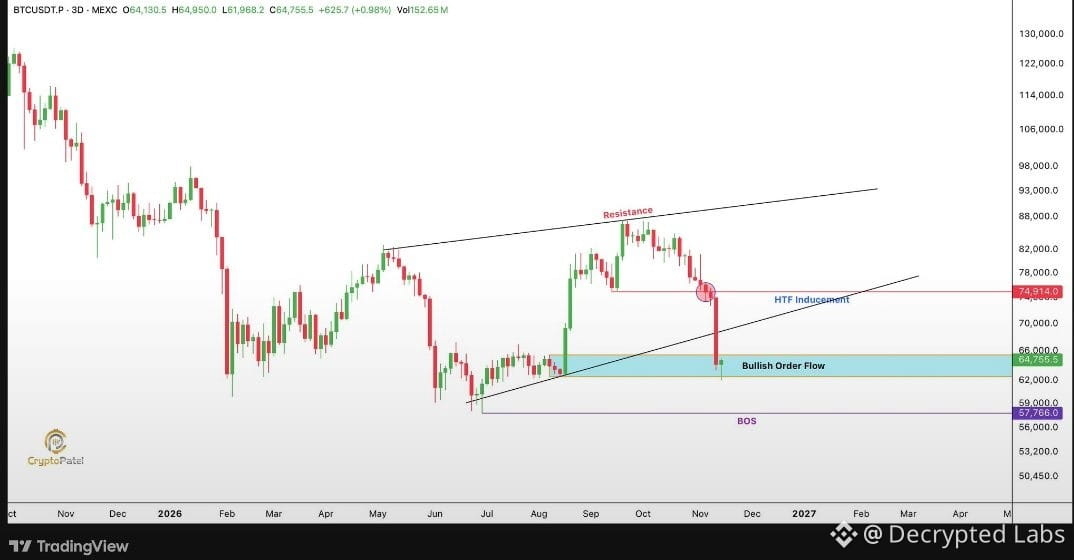
$BTC ONE SUPPORT ZONE COULD DECIDE WHETHER WE SEE $100K OR $40K NEXT.
Bitcoin has entered a key Bullish Order Block + Bullish Order Flow zone.
Here's the simple breakdown:
If $BTC holds above $62,499 on HTF candle closes, we can expect a recovery toward $75K, followed by a potential move toward new highs and eventually $100K.
But if #BTC closes below $62,499 on a HTF, things could turn ugly.
Watch the $57,766 BOS level. A HTF close below this level could open the door toward $50K–$40K.
I gave my exit signal above $85K. Hopefully, you booked profits on the way down and protected your hard-earned capital instead of blindly holding longs.
No need to thank me. Just remember:
Follow the charts, respect the levels, and make your decisions carefully.
Your capital comes first. Always. DYOR.
$BTC ONE SUPPORT ZONE COULD DECIDE WHETHER WE SEE $100K OR $40K NEXT.
Bitcoin has entered a key Bullish Order Block + Bullish Order Flow zone.
Here's the simple breakdown:
If $BTC holds above $62,499 on HTF candle closes, we can expect a recovery toward $75K, followed by a potential move toward new highs and eventually $100K.
But if #BTC closes below $62,499 on a HTF, things could turn ugly.
Watch the $57,766 BOS level. A HTF close below this level could open the door toward $50K–$40K.
I gave my exit signal above $85K. Hopefully, you booked profits on the way down and protected your hard-earned capital instead of blindly holding longs.
No need to thank me. Just remember:
Follow the charts, respect the levels, and make your decisions carefully.
Your capital comes first. Always. DYOR.
Bitcoin has entered a key Bullish Order Block + Bullish Order Flow zone.
Here's the simple breakdown:
If $BTC holds above $62,499 on HTF candle closes, we can expect a recovery toward $75K, followed by a potential move toward new highs and eventually $100K.
But if #BTC closes below $62,499 on a HTF, things could turn ugly.
Watch the $57,766 BOS level. A HTF close below this level could open the door toward $50K–$40K.
I gave my exit signal above $85K. Hopefully, you booked profits on the way down and protected your hard-earned capital instead of blindly holding longs.
No need to thank me. Just remember:
Follow the charts, respect the levels, and make your decisions carefully.
Your capital comes first. Always. DYOR.
193
ලිපිය
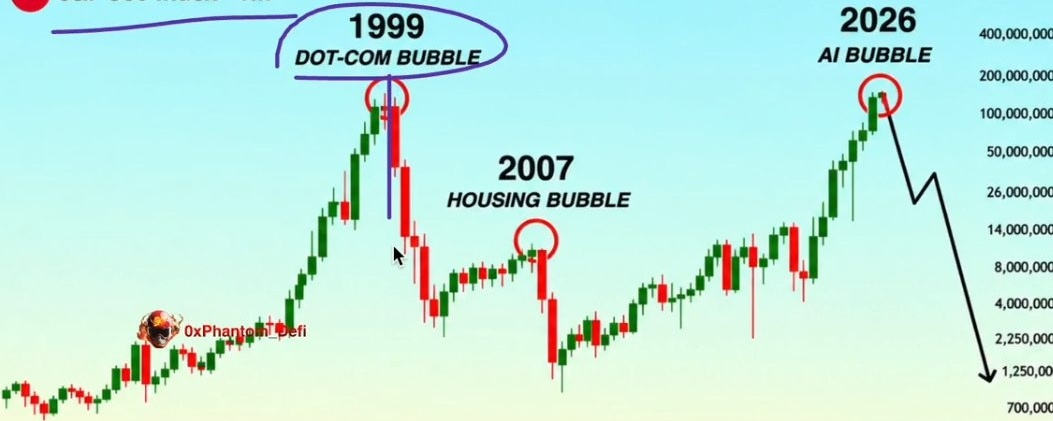
THE NEXT STOCK MARKET CRASH COULD MAKE 2008 LOOK SMALL.And I believe 2026 could be remembered as the year millions of investors ignored the most obvious warning signs.
What if the AI boom ends with an 80% collapse?
LOOK AT THIS CHART.
1999: DOT-COM BUBBLE
NASDAQ eventually crashed 78%.
2007: HOUSING BUBBLE
S&P 500 eventually collapsed 57%.
2026: AI BUBBLE?
COULD ANOTHER HISTORIC CRASH BE NEXT?
Three different eras.
Three different narratives.
ONE DANGEROUS MISTAKE.
Investors convinced themselves that the future justified paying ANY price.
In 1999, the internet was going to change everything.
And it DID.
Amazon survived.
Microsoft survived.
The internet revolution transformed the global economy.
BUT THE NASDAQ STILL LOST NEARLY 78%.
Now think about that.
Investors correctly predicted the future of technology.
And STILL lost fortunes.
In 2007, the same psychology appeared in housing.
Prices would never fall.
Demand would never disappear.
The system was too strong to collapse.
Until it did.
NOW LOOK AT 2026.
Artificial intelligence is transforming entire industries.
Companies are pouring billions into AI infrastructure.
Stock valuations reflect enormous expectations for future growth.
And investors keep treating every correction as another opportunity to buy.
SOUND FAMILIAR?
Here's what almost EVERYONE is missing.
THE TECHNOLOGY DOESN'T HAVE TO FAIL FOR THE STOCK MARKET TO COLLAPSE.
The internet didn't disappear in 2000.
Housing didn't disappear in 2008.
And AI won't have to disappear for investors to suffer devastating losses.
The real danger isn't whether AI changes the world.
It's whether investors have already priced in a future that's almost impossible to deliver.
And when expectations become extreme, even a small disappointment can trigger a massive repricing.
NOW HERE'S MY BIGGEST CONCERN.
If the AI trade turns into a full-scale bubble unwind, the downside could be MUCH worse than most investors are prepared for.
Could we see an 80% collapse in the most speculative parts of the market?
It's a scenario worth considering.
Does that mean the entire S&P 500 is guaranteed to crash 80%?
Absolutely NOT.
But history has repeatedly shown what happens when extreme valuations collide with disappearing confidence.
First comes the euphoria.
Then the first cracks.
Then investors start buying every dip.
Until one day, the dip doesn't recover.
And suddenly everyone wants to sell at the SAME TIME.
THAT'S WHEN THE REAL DAMAGE BEGINS.
I've spent more than a decade studying market cycles, speculative bubbles and major turning points.
And there's one lesson history keeps teaching us.
THE MOST DANGEROUS MOMENT IS WHEN EVERYONE BELIEVES THE MARKET CAN ONLY GO HIGHER.
SAVE THIS CHART.
Come back to it when the next major selloff begins.
I'm watching this setup closely and will share my next major market call HERE FIRST.
Follow and turn on notifications.
Because the most expensive words in investing have always been:
"THIS TIME IS DIFFERENT."
AI COULD CHANGE THE WORLD FOREVER.
BUT THAT DOESN'T MEAN EVERY AI STOCK IS WORTH ITS CURRENT PRICE.
PROTECT YOUR CAPITAL.
AND DON'T BECOME EXIT LIQUIDITY.
#BitcoinActiveSupplyInProfitDropsBelow45% #BNBDropsBelow570USDTDown9.68%In24Hours #WhatWillDriveCryptoandStocks’NextRebound?
THE NEXT STOCK MARKET CRASH COULD MAKE 2008 LOOK SMALL.
And I believe 2026 could be remembered as the year millions of investors ignored the most obvious warning signs.
What if the AI boom ends with an 80% collapse?
LOOK AT THIS CHART.
1999: DOT-COM BUBBLE
NASDAQ eventually crashed 78%.
2007: HOUSING BUBBLE
S&P 500 eventually collapsed 57%.
2026: AI BUBBLE?
COULD ANOTHER HISTORIC CRASH BE NEXT?
Three different eras.
Three different narratives.
ONE DANGEROUS MISTAKE.
Investors convinced themselves that the future justified paying ANY price.
In 1999, the internet was going to change everything.
And it DID.
Amazon survived.
Microsoft survived.
The internet revolution transformed the global economy.
BUT THE NASDAQ STILL LOST NEARLY 78%.
Now think about that.
Investors correctly predicted the future of technology.
And STILL lost fortunes.
In 2007, the same psychology appeared in housing.
Prices would never fall.
Demand would never disappear.
The system was too strong to collapse.
Until it did.
NOW LOOK AT 2026.
Artificial intelligence is transforming entire industries.
Companies are pouring billions into AI infrastructure.
Stock valuations reflect enormous expectations for future growth.
And investors keep treating every correction as another opportunity to buy.
SOUND FAMILIAR?
Here's what almost EVERYONE is missing.
THE TECHNOLOGY DOESN'T HAVE TO FAIL FOR THE STOCK MARKET TO COLLAPSE.
The internet didn't disappear in 2000.
Housing didn't disappear in 2008.
And AI won't have to disappear for investors to suffer devastating losses.
The real danger isn't whether AI changes the world.
It's whether investors have already priced in a future that's almost impossible to deliver.
And when expectations become extreme, even a small disappointment can trigger a massive repricing.
NOW HERE'S MY BIGGEST CONCERN.
If the AI trade turns into a full-scale bubble unwind, the downside could be MUCH worse than most investors are prepared for.
Could we see an 80% collapse in the most speculative parts of the market?
It's a scenario worth considering.
Does that mean the entire S&P 500 is guaranteed to crash 80%?
Absolutely NOT.
But history has repeatedly shown what happens when extreme valuations collide with disappearing confidence.
First comes the euphoria.
Then the first cracks.
Then investors start buying every dip.
Until one day, the dip doesn't recover.
And suddenly everyone wants to sell at the SAME TIME.
THAT'S WHEN THE REAL DAMAGE BEGINS.
I've spent more than a decade studying market cycles, speculative bubbles and major turning points.
And there's one lesson history keeps teaching us.
THE MOST DANGEROUS MOMENT IS WHEN EVERYONE BELIEVES THE MARKET CAN ONLY GO HIGHER.
SAVE THIS CHART.
Come back to it when the next major selloff begins.
I'm watching this setup closely and will share my next major market call HERE FIRST.
Follow and turn on notifications.
Because the most expensive words in investing have always been:
"THIS TIME IS DIFFERENT."
AI COULD CHANGE THE WORLD FOREVER.
BUT THAT DOESN'T MEAN EVERY AI STOCK IS WORTH ITS CURRENT PRICE.
PROTECT YOUR CAPITAL.
AND DON'T BECOME EXIT LIQUIDITY.
#BitcoinActiveSupplyInProfitDropsBelow45% #BNBDropsBelow570USDTDown9.68%In24Hours #WhatWillDriveCryptoandStocks’NextRebound?
What if the AI boom ends with an 80% collapse?
LOOK AT THIS CHART.
1999: DOT-COM BUBBLE
NASDAQ eventually crashed 78%.
2007: HOUSING BUBBLE
S&P 500 eventually collapsed 57%.
2026: AI BUBBLE?
COULD ANOTHER HISTORIC CRASH BE NEXT?
Three different eras.
Three different narratives.
ONE DANGEROUS MISTAKE.
Investors convinced themselves that the future justified paying ANY price.
In 1999, the internet was going to change everything.
And it DID.
Amazon survived.
Microsoft survived.
The internet revolution transformed the global economy.
BUT THE NASDAQ STILL LOST NEARLY 78%.
Now think about that.
Investors correctly predicted the future of technology.
And STILL lost fortunes.
In 2007, the same psychology appeared in housing.
Prices would never fall.
Demand would never disappear.
The system was too strong to collapse.
Until it did.
NOW LOOK AT 2026.
Artificial intelligence is transforming entire industries.
Companies are pouring billions into AI infrastructure.
Stock valuations reflect enormous expectations for future growth.
And investors keep treating every correction as another opportunity to buy.
SOUND FAMILIAR?
Here's what almost EVERYONE is missing.
THE TECHNOLOGY DOESN'T HAVE TO FAIL FOR THE STOCK MARKET TO COLLAPSE.
The internet didn't disappear in 2000.
Housing didn't disappear in 2008.
And AI won't have to disappear for investors to suffer devastating losses.
The real danger isn't whether AI changes the world.
It's whether investors have already priced in a future that's almost impossible to deliver.
And when expectations become extreme, even a small disappointment can trigger a massive repricing.
NOW HERE'S MY BIGGEST CONCERN.
If the AI trade turns into a full-scale bubble unwind, the downside could be MUCH worse than most investors are prepared for.
Could we see an 80% collapse in the most speculative parts of the market?
It's a scenario worth considering.
Does that mean the entire S&P 500 is guaranteed to crash 80%?
Absolutely NOT.
But history has repeatedly shown what happens when extreme valuations collide with disappearing confidence.
First comes the euphoria.
Then the first cracks.
Then investors start buying every dip.
Until one day, the dip doesn't recover.
And suddenly everyone wants to sell at the SAME TIME.
THAT'S WHEN THE REAL DAMAGE BEGINS.
I've spent more than a decade studying market cycles, speculative bubbles and major turning points.
And there's one lesson history keeps teaching us.
THE MOST DANGEROUS MOMENT IS WHEN EVERYONE BELIEVES THE MARKET CAN ONLY GO HIGHER.
SAVE THIS CHART.
Come back to it when the next major selloff begins.
I'm watching this setup closely and will share my next major market call HERE FIRST.
Follow and turn on notifications.
Because the most expensive words in investing have always been:
"THIS TIME IS DIFFERENT."
AI COULD CHANGE THE WORLD FOREVER.
BUT THAT DOESN'T MEAN EVERY AI STOCK IS WORTH ITS CURRENT PRICE.
PROTECT YOUR CAPITAL.
AND DON'T BECOME EXIT LIQUIDITY.
#BitcoinActiveSupplyInProfitDropsBelow45% #BNBDropsBelow570USDTDown9.68%In24Hours #WhatWillDriveCryptoandStocks’NextRebound?
6
14
7.2k
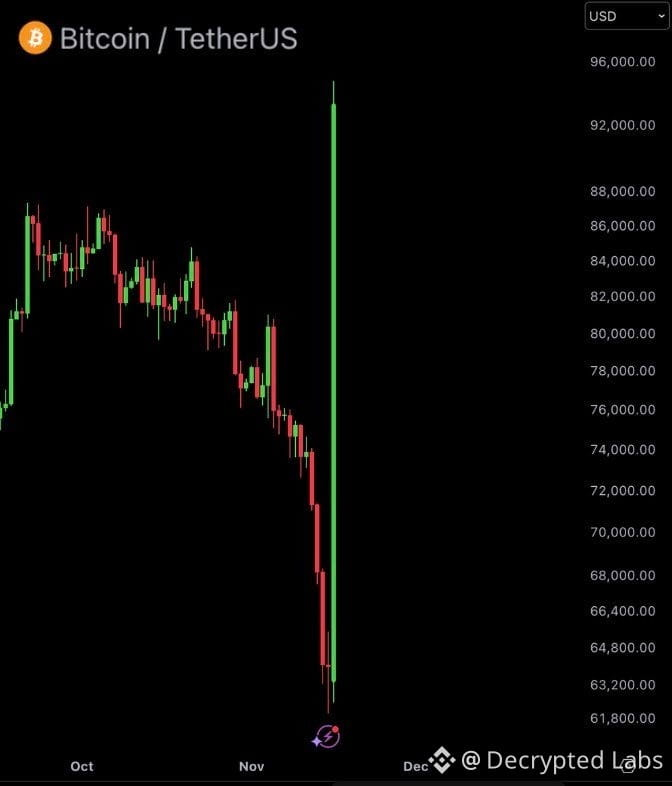
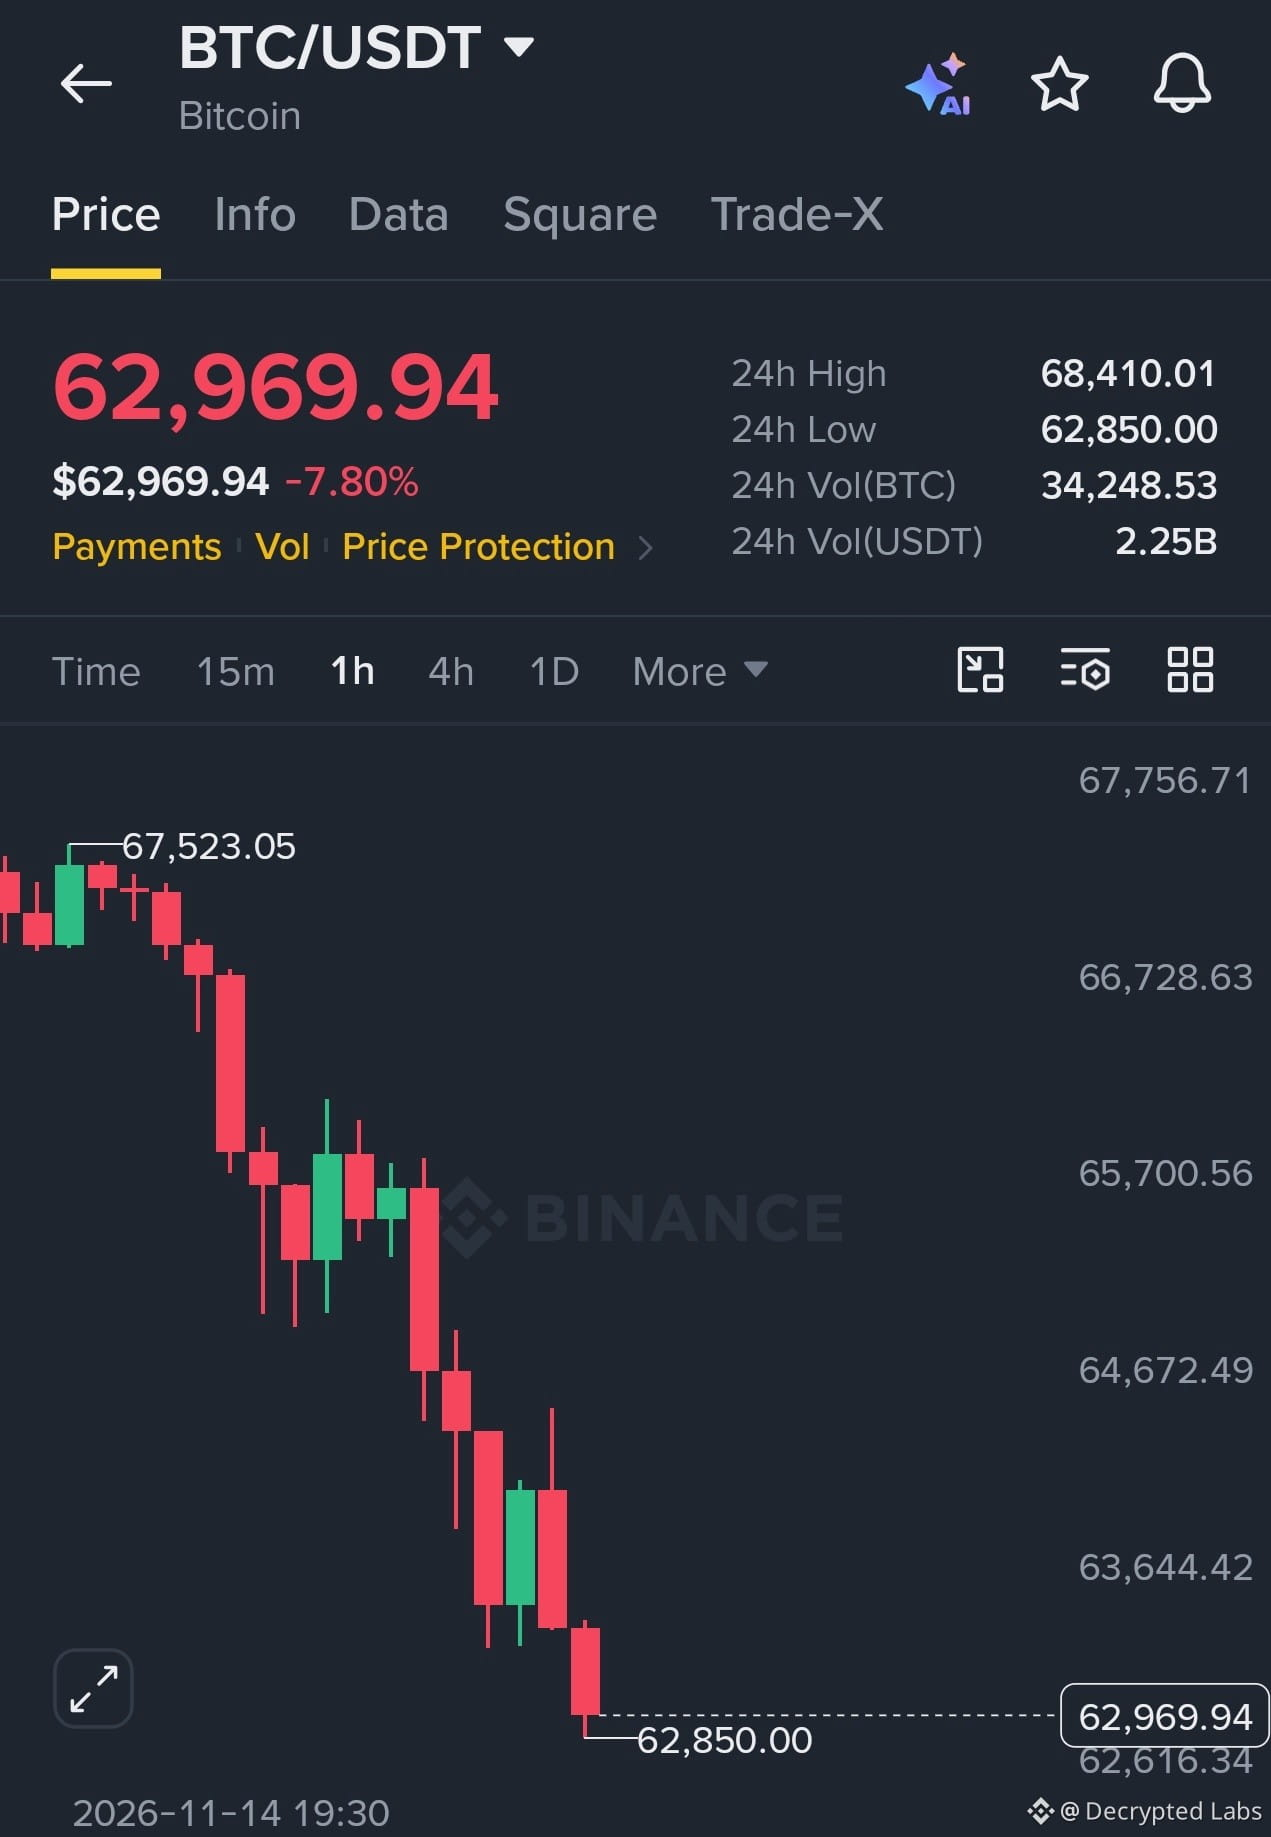
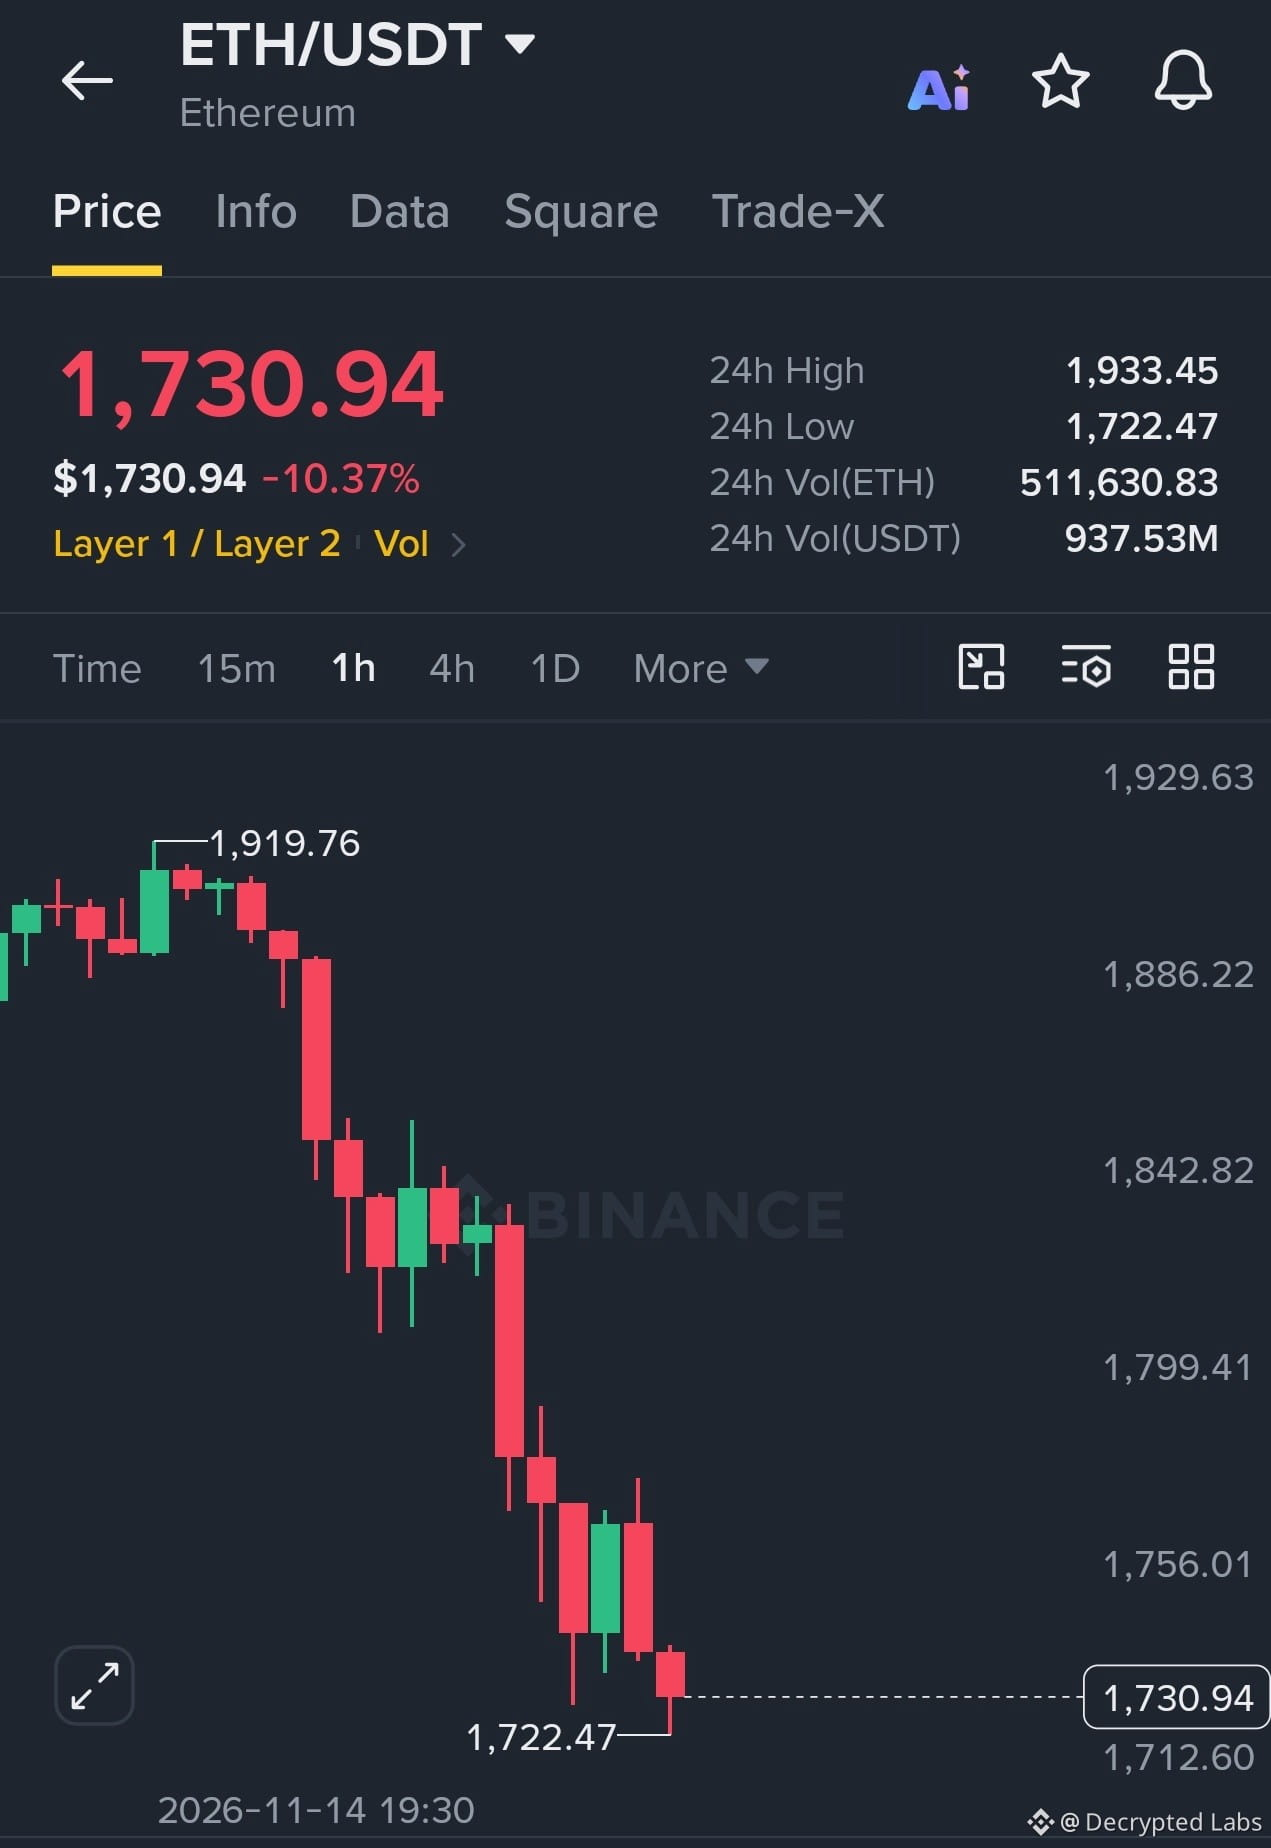
BREAKING: $2,000,000,000 liquidated in the last 24 hours.
Bitcoin crashes below $63,000
Ethereum falls below $1,750
$BTC $ETH
{spot}(ETHUSDT)
{spot}(BTCUSDT)
BREAKING: $2,000,000,000 liquidated in the last 24 hours.
Bitcoin crashes below $63,000
Ethereum falls below $1,750
$BTC $ETH
Bitcoin crashes below $63,000
Ethereum falls below $1,750
$BTC $ETH
155
ලිපිය
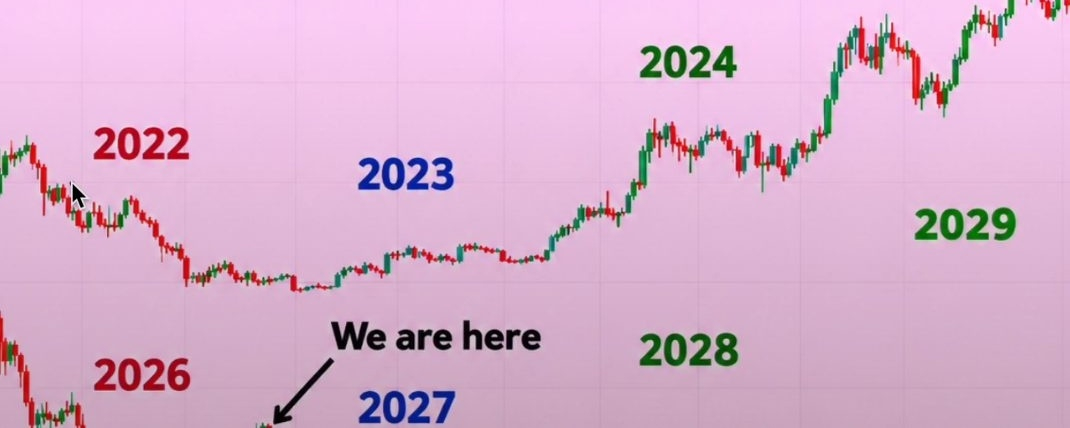
BITCOIN IS FOLLOWING THE SAME 4-YEAR PATTERN FOR THE FOURTH TIME.And if history repeats, 2027 could become one of the BIGGEST accumulation opportunities of this decade.
Almost nobody is paying attention to what this chart is showing.
LOOK CLOSELY.
2014: BEAR MARKET
2015: RECOVERY
2016: EARLY BULL MARKET
2017: EXPLOSIVE RALLY
2018: BEAR MARKET
2019: RECOVERY
2020: EARLY BULL MARKET
2021: EXPLOSIVE RALLY
2022: BEAR MARKET
2023: RECOVERY
2024: EARLY BULL MARKET
2025: CYCLE TOP
Now look at what could happen NEXT.
2026: BEAR MARKET
2027: RECOVERY?
2028: EARLY BULL MARKET?
2029: NEW CYCLE TOP?
THREE COMPLETED CYCLES.
THE SAME FOUR-YEAR STRUCTURE.
AND A FOURTH ONE THAT COULD BE UNFOLDING RIGHT NOW.
But here's where things get REALLY interesting.
Every bear market year in this pattern coincides with U.S. midterm elections.
Every recovery year follows those elections.
Every early bull market phase aligns with a Bitcoin halving.
And the last three major cycle peaks arrived approximately:
→ 526 days after the halving.
→ 548 days after the halving.
→ 534 days after the halving.
THREE CYCLES. ALMOST IDENTICAL TIMING.
Coincidence?
Maybe.
But there's something DIFFERENT about this cycle that most investors are overlooking.
Actually, TWO things.
FIRST: THE DRAWDOWN WAS MUCH SMALLER.
Previous Bitcoin bear markets produced devastating declines of roughly 77% to 85%.
This time?
$126,000 → $58,600.
That's a correction of approximately 53%.
SECOND: THE DECLINE HAPPENED MUCH FASTER.
Previous cycle bottoms took roughly 363 to 406 days to form.
This time, Bitcoin reached $58,600 just 268 days after its peak.
Read that again.
A smaller drawdown.
A faster correction.
And potentially the SAME four-year cycle structure.
NOW HERE'S THE QUESTION THAT COULD DEFINE 2027.
WAS $58,600 ALREADY THE BITCOIN CYCLE BOTTOM?
Or is the market preparing one FINAL capitulation before the next major recovery?
I'm watching both scenarios.
Because if this historical structure continues, 2027 could become the accumulation year that investors spend the next decade wishing they had taken seriously.
And the timing matters.
The next Bitcoin halving is expected around April 2028.
If the pattern holds:
2027 could be the recovery.
2028 could mark the next major bullish expansion.
2029 could bring another cycle peak.
But remember one thing.
History doesn't GUARANTEE another bull market.
And three completed cycles aren't enough to prove that the fourth will follow the same path.
Still, ignoring a pattern this consistent could be an expensive mistake.
SAVE THIS CHART.
Come back to it in 2027.
Because whether $58,600 was the bottom or one final capitulation is still ahead, I'm watching for the next major Bitcoin buying opportunity.
And when I see that signal, I'll share it HERE FIRST.
Follow and turn on notifications.
THE BIGGEST OPPORTUNITIES DON'T APPEAR WHEN EVERYONE IS BULLISH.
THEY APPEAR WHEN ALMOST NOBODY BELIEVES THE NEXT BULL MARKET IS POSSIBLE.
BITCOIN IS FOLLOWING THE SAME 4-YEAR PATTERN FOR THE FOURTH TIME.
And if history repeats, 2027 could become one of the BIGGEST accumulation opportunities of this decade.
Almost nobody is paying attention to what this chart is showing.
LOOK CLOSELY.
2014: BEAR MARKET
2015: RECOVERY
2016: EARLY BULL MARKET
2017: EXPLOSIVE RALLY
2018: BEAR MARKET
2019: RECOVERY
2020: EARLY BULL MARKET
2021: EXPLOSIVE RALLY
2022: BEAR MARKET
2023: RECOVERY
2024: EARLY BULL MARKET
2025: CYCLE TOP
Now look at what could happen NEXT.
2026: BEAR MARKET
2027: RECOVERY?
2028: EARLY BULL MARKET?
2029: NEW CYCLE TOP?
THREE COMPLETED CYCLES.
THE SAME FOUR-YEAR STRUCTURE.
AND A FOURTH ONE THAT COULD BE UNFOLDING RIGHT NOW.
But here's where things get REALLY interesting.
Every bear market year in this pattern coincides with U.S. midterm elections.
Every recovery year follows those elections.
Every early bull market phase aligns with a Bitcoin halving.
And the last three major cycle peaks arrived approximately:
→ 526 days after the halving.
→ 548 days after the halving.
→ 534 days after the halving.
THREE CYCLES. ALMOST IDENTICAL TIMING.
Coincidence?
Maybe.
But there's something DIFFERENT about this cycle that most investors are overlooking.
Actually, TWO things.
FIRST: THE DRAWDOWN WAS MUCH SMALLER.
Previous Bitcoin bear markets produced devastating declines of roughly 77% to 85%.
This time?
$126,000 → $58,600.
That's a correction of approximately 53%.
SECOND: THE DECLINE HAPPENED MUCH FASTER.
Previous cycle bottoms took roughly 363 to 406 days to form.
This time, Bitcoin reached $58,600 just 268 days after its peak.
Read that again.
A smaller drawdown.
A faster correction.
And potentially the SAME four-year cycle structure.
NOW HERE'S THE QUESTION THAT COULD DEFINE 2027.
WAS $58,600 ALREADY THE BITCOIN CYCLE BOTTOM?
Or is the market preparing one FINAL capitulation before the next major recovery?
I'm watching both scenarios.
Because if this historical structure continues, 2027 could become the accumulation year that investors spend the next decade wishing they had taken seriously.
And the timing matters.
The next Bitcoin halving is expected around April 2028.
If the pattern holds:
2027 could be the recovery.
2028 could mark the next major bullish expansion.
2029 could bring another cycle peak.
But remember one thing.
History doesn't GUARANTEE another bull market.
And three completed cycles aren't enough to prove that the fourth will follow the same path.
Still, ignoring a pattern this consistent could be an expensive mistake.
SAVE THIS CHART.
Come back to it in 2027.
Because whether $58,600 was the bottom or one final capitulation is still ahead, I'm watching for the next major Bitcoin buying opportunity.
And when I see that signal, I'll share it HERE FIRST.
Follow and turn on notifications.
THE BIGGEST OPPORTUNITIES DON'T APPEAR WHEN EVERYONE IS BULLISH.
THEY APPEAR WHEN ALMOST NOBODY BELIEVES THE NEXT BULL MARKET IS POSSIBLE.
Almost nobody is paying attention to what this chart is showing.
LOOK CLOSELY.
2014: BEAR MARKET
2015: RECOVERY
2016: EARLY BULL MARKET
2017: EXPLOSIVE RALLY
2018: BEAR MARKET
2019: RECOVERY
2020: EARLY BULL MARKET
2021: EXPLOSIVE RALLY
2022: BEAR MARKET
2023: RECOVERY
2024: EARLY BULL MARKET
2025: CYCLE TOP
Now look at what could happen NEXT.
2026: BEAR MARKET
2027: RECOVERY?
2028: EARLY BULL MARKET?
2029: NEW CYCLE TOP?
THREE COMPLETED CYCLES.
THE SAME FOUR-YEAR STRUCTURE.
AND A FOURTH ONE THAT COULD BE UNFOLDING RIGHT NOW.
But here's where things get REALLY interesting.
Every bear market year in this pattern coincides with U.S. midterm elections.
Every recovery year follows those elections.
Every early bull market phase aligns with a Bitcoin halving.
And the last three major cycle peaks arrived approximately:
→ 526 days after the halving.
→ 548 days after the halving.
→ 534 days after the halving.
THREE CYCLES. ALMOST IDENTICAL TIMING.
Coincidence?
Maybe.
But there's something DIFFERENT about this cycle that most investors are overlooking.
Actually, TWO things.
FIRST: THE DRAWDOWN WAS MUCH SMALLER.
Previous Bitcoin bear markets produced devastating declines of roughly 77% to 85%.
This time?
$126,000 → $58,600.
That's a correction of approximately 53%.
SECOND: THE DECLINE HAPPENED MUCH FASTER.
Previous cycle bottoms took roughly 363 to 406 days to form.
This time, Bitcoin reached $58,600 just 268 days after its peak.
Read that again.
A smaller drawdown.
A faster correction.
And potentially the SAME four-year cycle structure.
NOW HERE'S THE QUESTION THAT COULD DEFINE 2027.
WAS $58,600 ALREADY THE BITCOIN CYCLE BOTTOM?
Or is the market preparing one FINAL capitulation before the next major recovery?
I'm watching both scenarios.
Because if this historical structure continues, 2027 could become the accumulation year that investors spend the next decade wishing they had taken seriously.
And the timing matters.
The next Bitcoin halving is expected around April 2028.
If the pattern holds:
2027 could be the recovery.
2028 could mark the next major bullish expansion.
2029 could bring another cycle peak.
But remember one thing.
History doesn't GUARANTEE another bull market.
And three completed cycles aren't enough to prove that the fourth will follow the same path.
Still, ignoring a pattern this consistent could be an expensive mistake.
SAVE THIS CHART.
Come back to it in 2027.
Because whether $58,600 was the bottom or one final capitulation is still ahead, I'm watching for the next major Bitcoin buying opportunity.
And when I see that signal, I'll share it HERE FIRST.
Follow and turn on notifications.
THE BIGGEST OPPORTUNITIES DON'T APPEAR WHEN EVERYONE IS BULLISH.
THEY APPEAR WHEN ALMOST NOBODY BELIEVES THE NEXT BULL MARKET IS POSSIBLE.
3
511
සත්යායනය කළ
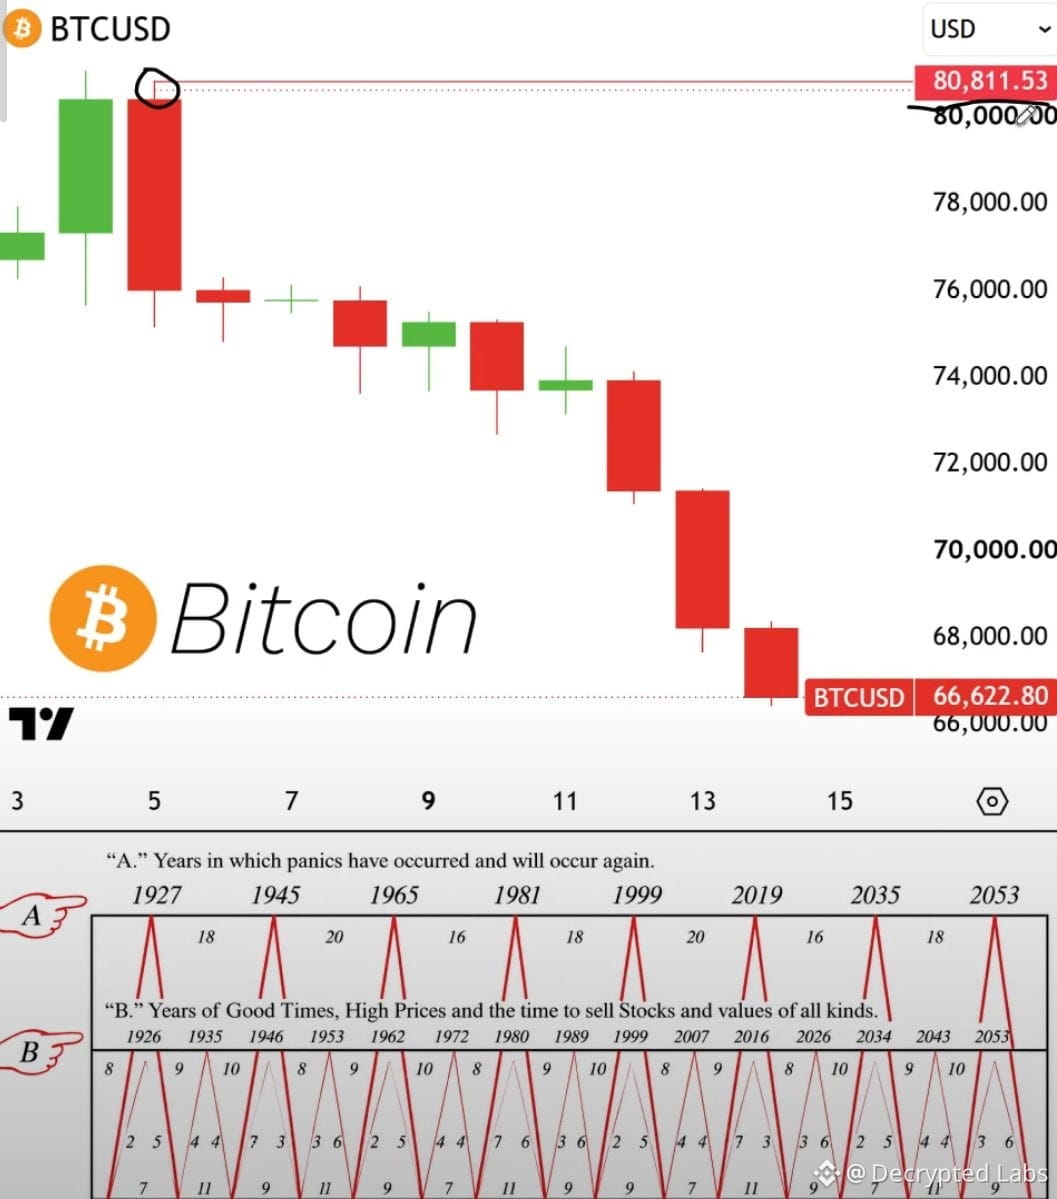
🚨HERE IS WHY $BTC CONTINUES DUMPING RIGHT NOW!
Not because AI bubble
Not because Jensen left as CEO
Not because crypto is dead
Bitcoin is just pricing almost confirmed future 3-5 rate hikes in the coming months
Here's what's actually happening:
The Fed is not done: the December hike is nearly locked and the dot plot already points to more into 2027
Inflation came in hot again, so they have every reason to stay hawkish and keep rates higher for longer
And the market never waits for the hikes to land:
hot inflation -> higher for longer -> risk assets reprice lower right now
That front-running is exactly what this dump is, nothing more
But here's what everyone forgets:
We watched this exact movie in 2023 right before the bull run
The Fed hiked four straight times that year, a full 100bps from February to July, and instead of crashing Bitcoin ran from 16K to over 42K
Because the hikes were already priced in, and price turned the moment fear peaked, not the moment the hikes stopped
Everyone is panicking out on these hikes right now exactly like they did back then, right before it ran
If this cycle holds its timing, these hikes are just the wall of worry before the next leg, the same one that ran it over 150% last time
This correction is that setup, the last dip before the expansion
I'll keep tracking every FED decision and rate signal to call the turn before it happens
So make sure to follow me and turn notifs on
$BTC
{spot}(BTCUSDT)
🚨HERE IS WHY $BTC CONTINUES DUMPING RIGHT NOW!
Not because AI bubble
Not because Jensen left as CEO
Not because crypto is dead
Bitcoin is just pricing almost confirmed future 3-5 rate hikes in the coming months
Here's what's actually happening:
The Fed is not done: the December hike is nearly locked and the dot plot already points to more into 2027
Inflation came in hot again, so they have every reason to stay hawkish and keep rates higher for longer
And the market never waits for the hikes to land:
hot inflation -> higher for longer -> risk assets reprice lower right now
That front-running is exactly what this dump is, nothing more
But here's what everyone forgets:
We watched this exact movie in 2023 right before the bull run
The Fed hiked four straight times that year, a full 100bps from February to July, and instead of crashing Bitcoin ran from 16K to over 42K
Because the hikes were already priced in, and price turned the moment fear peaked, not the moment the hikes stopped
Everyone is panicking out on these hikes right now exactly like they did back then, right before it ran
If this cycle holds its timing, these hikes are just the wall of worry before the next leg, the same one that ran it over 150% last time
This correction is that setup, the last dip before the expansion
I'll keep tracking every FED decision and rate signal to call the turn before it happens
So make sure to follow me and turn notifs on
$BTC
Not because AI bubble
Not because Jensen left as CEO
Not because crypto is dead
Bitcoin is just pricing almost confirmed future 3-5 rate hikes in the coming months
Here's what's actually happening:
The Fed is not done: the December hike is nearly locked and the dot plot already points to more into 2027
Inflation came in hot again, so they have every reason to stay hawkish and keep rates higher for longer
And the market never waits for the hikes to land:
hot inflation -> higher for longer -> risk assets reprice lower right now
That front-running is exactly what this dump is, nothing more
But here's what everyone forgets:
We watched this exact movie in 2023 right before the bull run
The Fed hiked four straight times that year, a full 100bps from February to July, and instead of crashing Bitcoin ran from 16K to over 42K
Because the hikes were already priced in, and price turned the moment fear peaked, not the moment the hikes stopped
Everyone is panicking out on these hikes right now exactly like they did back then, right before it ran
If this cycle holds its timing, these hikes are just the wall of worry before the next leg, the same one that ran it over 150% last time
This correction is that setup, the last dip before the expansion
I'll keep tracking every FED decision and rate signal to call the turn before it happens
So make sure to follow me and turn notifs on
$BTC
4
8
6.1k
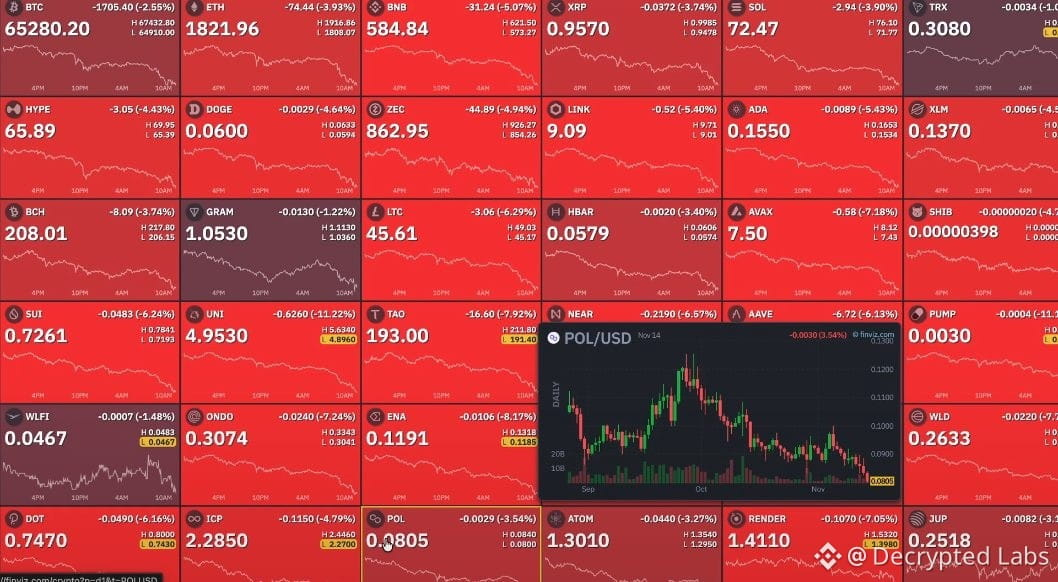
🩸 MASSIVE CRASH:
$100 BILLION wiped out from the crypto market in just 24 hours
$BTC fell below $65,000, $1,000,000,000 in positions were liquidated
THIS IS ABSOLUTELY INSANE…
🩸 MASSIVE CRASH:
$100 BILLION wiped out from the crypto market in just 24 hours
$BTC fell below $65,000, $1,000,000,000 in positions were liquidated
THIS IS ABSOLUTELY INSANE…
$100 BILLION wiped out from the crypto market in just 24 hours
$BTC fell below $65,000, $1,000,000,000 in positions were liquidated
THIS IS ABSOLUTELY INSANE…
1
2
1.2k
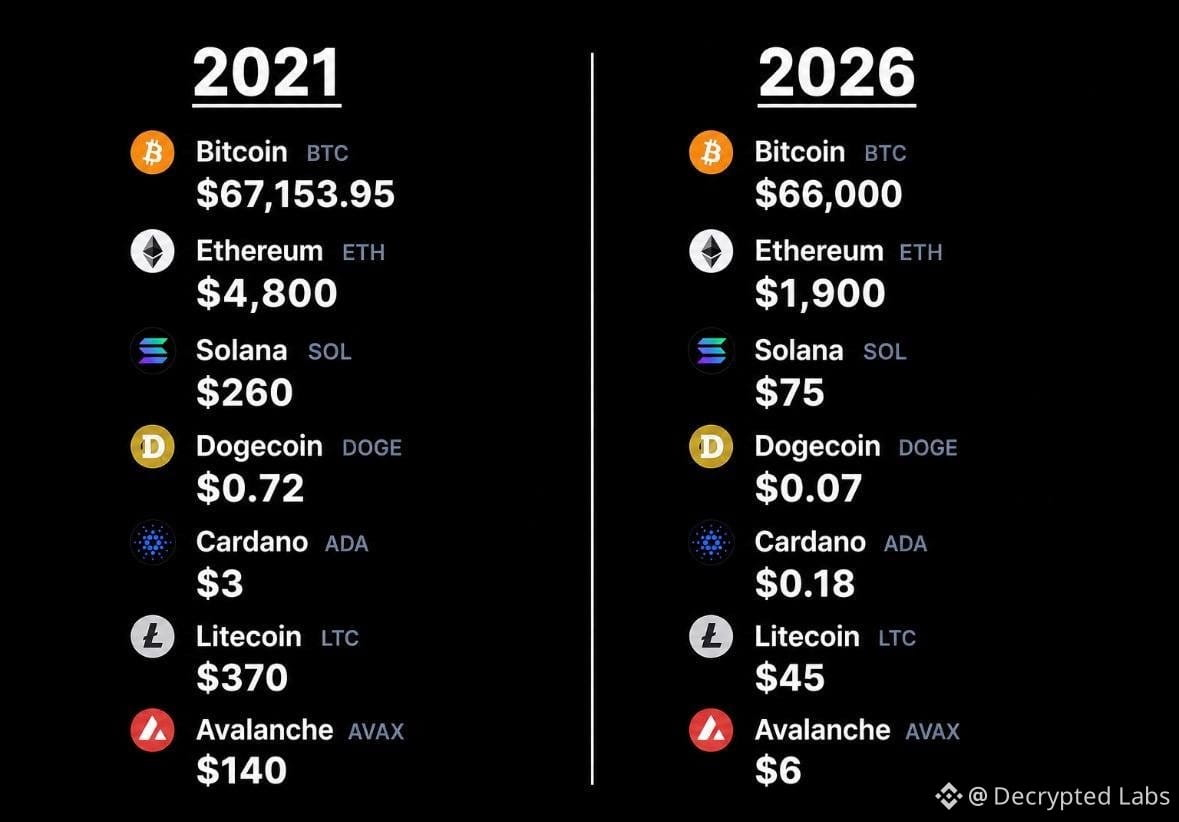
Crypto killed so many dreams in 5 years.
$BTC $ETH $SOL
Crypto killed so many dreams in 5 years.
$BTC $ETH $SOL
$BTC $ETH $SOL
2
144
ලිපිය
THIS IS WHY BITCOIN KEEPS CRASHING BELOW $67,000🚨 THIS IS WHY BITCOIN KEEPS CRASHING BELOW $67,000
If you still think Bitcoin trades like an asset whose price is determined purely by spot supply and demand, you need to read this carefully.
Because that market no longer exists.
What you’re watching right now is NOT normal price action.
This isn’t just an AI stock sell-off.
This isn’t just hotter inflation.
And this definitely isn’t retail suddenly deciding to dump Bitcoin at the exact same time.
Most people have no idea what is actually happening.
And by the time it becomes obvious, the damage is usually already done.
This didn’t start today.
It has been building underneath Bitcoin for YEARS.
And now it’s accelerating.
Here’s the truth:
Bitcoin still has a hard cap of 21 MILLION coins.
But Wall Street can create almost unlimited financial EXPOSURE around those coins.
That distinction changes everything.
Because once derivatives dominate short-term price discovery...
Bitcoin stops trading purely on who wants to own the actual coins.
It starts trading on:
1) LEVERAGE.
2) HEDGING.
3) MARGIN.
4) LIQUIDATIONS.
5) FORCED SELLING.
And that is exactly what is happening right now.
It’s the same mechanism that repeatedly drives violent moves in:
→ Gold
→ Silver
→ Oil
→ Stocks
Once derivatives become large enough, spot buyers are no longer the only force setting the price.
And this is the part almost nobody understands: Bitcoin’s scarcity didn’t disappear.
But scarcity alone no longer controls the SCREEN PRICE.
Wall Street built an entire financial layer on top of Bitcoin:
→ Cash-settled futures
→ Perpetual contracts
→ Options
→ ETFs
→ Broker lending
→ Swaps
→ Wrapped BTC
The 21 million cap controls the COINS.
It does NOT cap the amount of leveraged exposure that can be created around them.
And once that leverage starts unwinding...
The market doesn’t care what the long-term thesis is.
It SELLS.
Look at what just happened:
Over $1.9 BILLION in leveraged crypto positions wiped out in 24 hours.
More than $1.1 BILLION liquidated in Bitcoin alone.
Spot Bitcoin ETFs have already seen roughly $1.9 BILLION in outflows this month.
Once leveraged selling overwhelms real buyers, price stops responding only to long-term demand.
It starts responding to positions.
Hedging. Margin calls. And cascading liquidations.
Wall Street does not need to own millions of physical Bitcoin to push the market around.
It only needs enough derivatives exposure and enough leverage sitting in the wrong place.
The playbook is brutally simple:
1st: Build enormous leveraged exposur
2nd: Push price through obvious liquidity
3rd: Trigger stops and liquidations
4th: Forced selling pushes price even lower
5th: Buy back into the panic
6th: Repeat
THIS is why Bitcoin can lose thousands of dollars while the number of coins on-chain barely changes.
The coins didn’t suddenly disappear.
The PRICE DISCOVERY mechanism changed.
That’s what people are missing.
Bitcoin is still scarce.
But the financial claims built around Bitcoin are NOT.
And when leverage controls the marginal trade...
21 million coins can behave like a market with FAR more supply than 21 million coins.
That’s not the Bitcoin market retail thinks it is trading.
That’s a WALL STREET PRICING SYSTEM built on top of Bitcoin.
You can choose to ignore it.
But don’t pretend nobody warned you.
Bitcoin is now trading around $66,600, its lowest level since August and roughly 48% below the $126,200 high.
If $65k breaks, the next level I’m watching is $62k.
Reminder: I called the Bitcoin top at $126,000 and told you to start buying again around $60,000.
The next call will matter even more.
When I EXIT the markets completely, I’ll post it here publicly like I always do.
Turn notifications on.
If you’re not following yet, you’ll understand why that was a mistake later.
THIS IS WHY BITCOIN KEEPS CRASHING BELOW $67,000
🚨 THIS IS WHY BITCOIN KEEPS CRASHING BELOW $67,000
If you still think Bitcoin trades like an asset whose price is determined purely by spot supply and demand, you need to read this carefully.
Because that market no longer exists.
What you’re watching right now is NOT normal price action.
This isn’t just an AI stock sell-off.
This isn’t just hotter inflation.
And this definitely isn’t retail suddenly deciding to dump Bitcoin at the exact same time.
Most people have no idea what is actually happening.
And by the time it becomes obvious, the damage is usually already done.
This didn’t start today.
It has been building underneath Bitcoin for YEARS.
And now it’s accelerating.
Here’s the truth:
Bitcoin still has a hard cap of 21 MILLION coins.
But Wall Street can create almost unlimited financial EXPOSURE around those coins.
That distinction changes everything.
Because once derivatives dominate short-term price discovery...
Bitcoin stops trading purely on who wants to own the actual coins.
It starts trading on:
1) LEVERAGE.
2) HEDGING.
3) MARGIN.
4) LIQUIDATIONS.
5) FORCED SELLING.
And that is exactly what is happening right now.
It’s the same mechanism that repeatedly drives violent moves in:
→ Gold
→ Silver
→ Oil
→ Stocks
Once derivatives become large enough, spot buyers are no longer the only force setting the price.
And this is the part almost nobody understands: Bitcoin’s scarcity didn’t disappear.
But scarcity alone no longer controls the SCREEN PRICE.
Wall Street built an entire financial layer on top of Bitcoin:
→ Cash-settled futures
→ Perpetual contracts
→ Options
→ ETFs
→ Broker lending
→ Swaps
→ Wrapped BTC
The 21 million cap controls the COINS.
It does NOT cap the amount of leveraged exposure that can be created around them.
And once that leverage starts unwinding...
The market doesn’t care what the long-term thesis is.
It SELLS.
Look at what just happened:
Over $1.9 BILLION in leveraged crypto positions wiped out in 24 hours.
More than $1.1 BILLION liquidated in Bitcoin alone.
Spot Bitcoin ETFs have already seen roughly $1.9 BILLION in outflows this month.
Once leveraged selling overwhelms real buyers, price stops responding only to long-term demand.
It starts responding to positions.
Hedging. Margin calls. And cascading liquidations.
Wall Street does not need to own millions of physical Bitcoin to push the market around.
It only needs enough derivatives exposure and enough leverage sitting in the wrong place.
The playbook is brutally simple:
1st: Build enormous leveraged exposur
2nd: Push price through obvious liquidity
3rd: Trigger stops and liquidations
4th: Forced selling pushes price even lower
5th: Buy back into the panic
6th: Repeat
THIS is why Bitcoin can lose thousands of dollars while the number of coins on-chain barely changes.
The coins didn’t suddenly disappear.
The PRICE DISCOVERY mechanism changed.
That’s what people are missing.
Bitcoin is still scarce.
But the financial claims built around Bitcoin are NOT.
And when leverage controls the marginal trade...
21 million coins can behave like a market with FAR more supply than 21 million coins.
That’s not the Bitcoin market retail thinks it is trading.
That’s a WALL STREET PRICING SYSTEM built on top of Bitcoin.
You can choose to ignore it.
But don’t pretend nobody warned you.
Bitcoin is now trading around $66,600, its lowest level since August and roughly 48% below the $126,200 high.
If $65k breaks, the next level I’m watching is $62k.
Reminder: I called the Bitcoin top at $126,000 and told you to start buying again around $60,000.
The next call will matter even more.
When I EXIT the markets completely, I’ll post it here publicly like I always do.
Turn notifications on.
If you’re not following yet, you’ll understand why that was a mistake later.
If you still think Bitcoin trades like an asset whose price is determined purely by spot supply and demand, you need to read this carefully.
Because that market no longer exists.
What you’re watching right now is NOT normal price action.
This isn’t just an AI stock sell-off.
This isn’t just hotter inflation.
And this definitely isn’t retail suddenly deciding to dump Bitcoin at the exact same time.
Most people have no idea what is actually happening.
And by the time it becomes obvious, the damage is usually already done.
This didn’t start today.
It has been building underneath Bitcoin for YEARS.
And now it’s accelerating.
Here’s the truth:
Bitcoin still has a hard cap of 21 MILLION coins.
But Wall Street can create almost unlimited financial EXPOSURE around those coins.
That distinction changes everything.
Because once derivatives dominate short-term price discovery...
Bitcoin stops trading purely on who wants to own the actual coins.
It starts trading on:
1) LEVERAGE.
2) HEDGING.
3) MARGIN.
4) LIQUIDATIONS.
5) FORCED SELLING.
And that is exactly what is happening right now.
It’s the same mechanism that repeatedly drives violent moves in:
→ Gold
→ Silver
→ Oil
→ Stocks
Once derivatives become large enough, spot buyers are no longer the only force setting the price.
And this is the part almost nobody understands: Bitcoin’s scarcity didn’t disappear.
But scarcity alone no longer controls the SCREEN PRICE.
Wall Street built an entire financial layer on top of Bitcoin:
→ Cash-settled futures
→ Perpetual contracts
→ Options
→ ETFs
→ Broker lending
→ Swaps
→ Wrapped BTC
The 21 million cap controls the COINS.
It does NOT cap the amount of leveraged exposure that can be created around them.
And once that leverage starts unwinding...
The market doesn’t care what the long-term thesis is.
It SELLS.
Look at what just happened:
Over $1.9 BILLION in leveraged crypto positions wiped out in 24 hours.
More than $1.1 BILLION liquidated in Bitcoin alone.
Spot Bitcoin ETFs have already seen roughly $1.9 BILLION in outflows this month.
Once leveraged selling overwhelms real buyers, price stops responding only to long-term demand.
It starts responding to positions.
Hedging. Margin calls. And cascading liquidations.
Wall Street does not need to own millions of physical Bitcoin to push the market around.
It only needs enough derivatives exposure and enough leverage sitting in the wrong place.
The playbook is brutally simple:
1st: Build enormous leveraged exposur
2nd: Push price through obvious liquidity
3rd: Trigger stops and liquidations
4th: Forced selling pushes price even lower
5th: Buy back into the panic
6th: Repeat
THIS is why Bitcoin can lose thousands of dollars while the number of coins on-chain barely changes.
The coins didn’t suddenly disappear.
The PRICE DISCOVERY mechanism changed.
That’s what people are missing.
Bitcoin is still scarce.
But the financial claims built around Bitcoin are NOT.
And when leverage controls the marginal trade...
21 million coins can behave like a market with FAR more supply than 21 million coins.
That’s not the Bitcoin market retail thinks it is trading.
That’s a WALL STREET PRICING SYSTEM built on top of Bitcoin.
You can choose to ignore it.
But don’t pretend nobody warned you.
Bitcoin is now trading around $66,600, its lowest level since August and roughly 48% below the $126,200 high.
If $65k breaks, the next level I’m watching is $62k.
Reminder: I called the Bitcoin top at $126,000 and told you to start buying again around $60,000.
The next call will matter even more.
When I EXIT the markets completely, I’ll post it here publicly like I always do.
Turn notifications on.
If you’re not following yet, you’ll understand why that was a mistake later.
2
462
තවත් අන්තර්ගතයන් ගවේෂණය කිරීමට ඇතුල් වන්න
Binance චතුරශ්රය හි ගෝලීය ක්රිප්ටෝ පරිශීලකයින් හා එක්වන්න
⚡️ ක්රිප්ටෝ පිළිබඳ නවතම සහ ප්රයෝජනවත් තොරතුරු ලබා ගන්න.
💬 ලොව විශාලතම ක්රිප්ටෝ හුවමාරුව මගින් විශ්වාස කෙරේ.
👍 සත්යායනය කරන ලද නිර්මාණකරුවන්ගෙන් සැබෑ විදසුන් සොයා ගන්න.
විද්යුත් තැපෑල / දුරකථන අංකය
නැගී එන මාතෘකා
A Packed Week of Earnings and Data Tests Markets
61,874 නැරඹීම්
395 සාකච්ඡා කරමින්
Nvidia, Anthropic і ФРС. Три тести за один тиждень
Nick_Invest
·3 කැමත්ත දැක්වීම්
·1.3k නැරඹීම්
AnthropicIPOTestsInvestorAppetiteForAI
114,384 නැරඹීම්
1,349 සාකච්ඡා කරමින්
BitcoinExtendsLosingStreakToSixWeeks
88,170 නැරඹීම්
715 සාකච්ඡා කරමින්