

BOSSMD
533 පෝස්ටු

BOSSMD
වාර්තා කරන්න
පරිශීලක අවහිර කරන්න
විවෘත වෙළෙඳාම
ඉඳහිට වෙළෙන්දා
{වේලාව} වසර
6 හඹා යමින්
834 හඹා යන්නන්
1.4K+ කැමති විය
පෝස්ටු
ආයෝජන කළඹ
සියල්ල
උපුටා දැක්වීම්
අමුණා ඇත
·
--
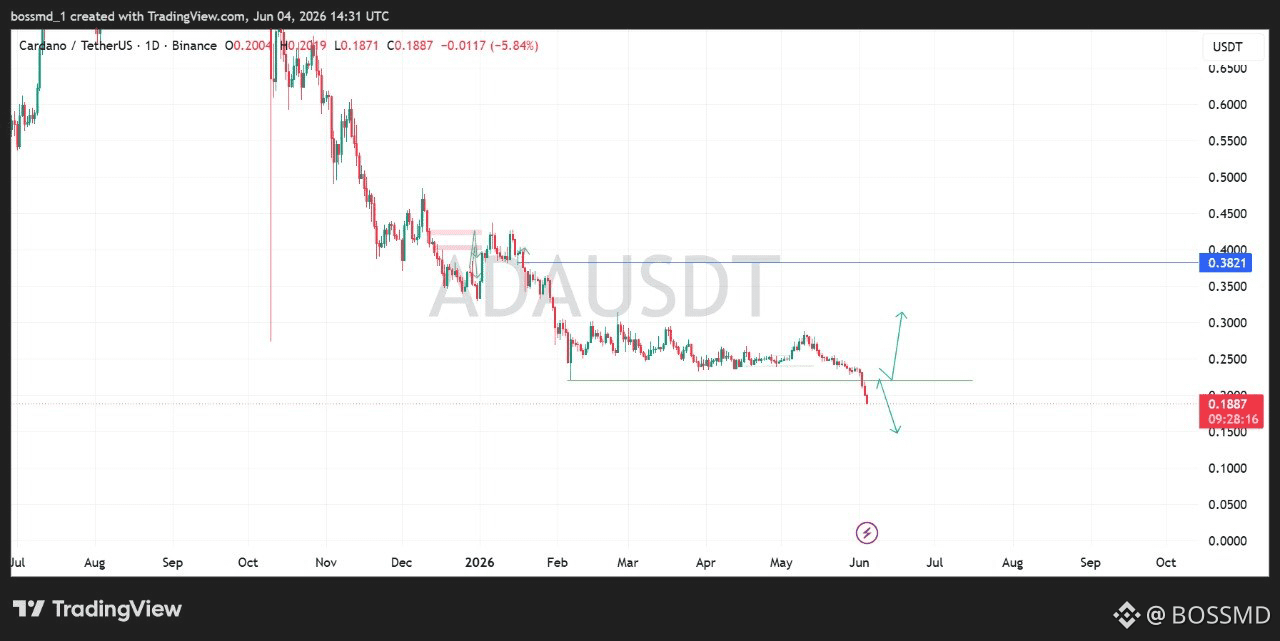
#Cardano is trading at a critical support level after months of sustained downside pressure.
The recent breakdown below the range support shows that sellers still have control, but this is also the type of area where strong reactions can emerge.
The chart suggests two scenarios: a deeper sweep into lower support followed by a recovery, or a quick reclaim of the broken level that traps late sellers and sparks a bounce toward the $0.30–0.38 region.
What catches my attention is that $ADA is approaching a zone where risk-to-reward becomes more attractive. The market often tests patience before a meaningful reversal takes shape.
For now, the key is watching how price reacts around current levels. If buyers step in and reclaim support, this could mark the beginning of a stronger recovery phase.
{future}(ADAUSDT)
#Cardano is trading at a critical support level after months of sustained downside pressure.
The recent breakdown below the range support shows that sellers still have control, but this is also the type of area where strong reactions can emerge.
The chart suggests two scenarios: a deeper sweep into lower support followed by a recovery, or a quick reclaim of the broken level that traps late sellers and sparks a bounce toward the $0.30–0.38 region.
What catches my attention is that $ADA is approaching a zone where risk-to-reward becomes more attractive. The market often tests patience before a meaningful reversal takes shape.
For now, the key is watching how price reacts around current levels. If buyers step in and reclaim support, this could mark the beginning of a stronger recovery phase.
The recent breakdown below the range support shows that sellers still have control, but this is also the type of area where strong reactions can emerge.
The chart suggests two scenarios: a deeper sweep into lower support followed by a recovery, or a quick reclaim of the broken level that traps late sellers and sparks a bounce toward the $0.30–0.38 region.
What catches my attention is that $ADA is approaching a zone where risk-to-reward becomes more attractive. The market often tests patience before a meaningful reversal takes shape.
For now, the key is watching how price reacts around current levels. If buyers step in and reclaim support, this could mark the beginning of a stronger recovery phase.
11
78
143.9k
·
--
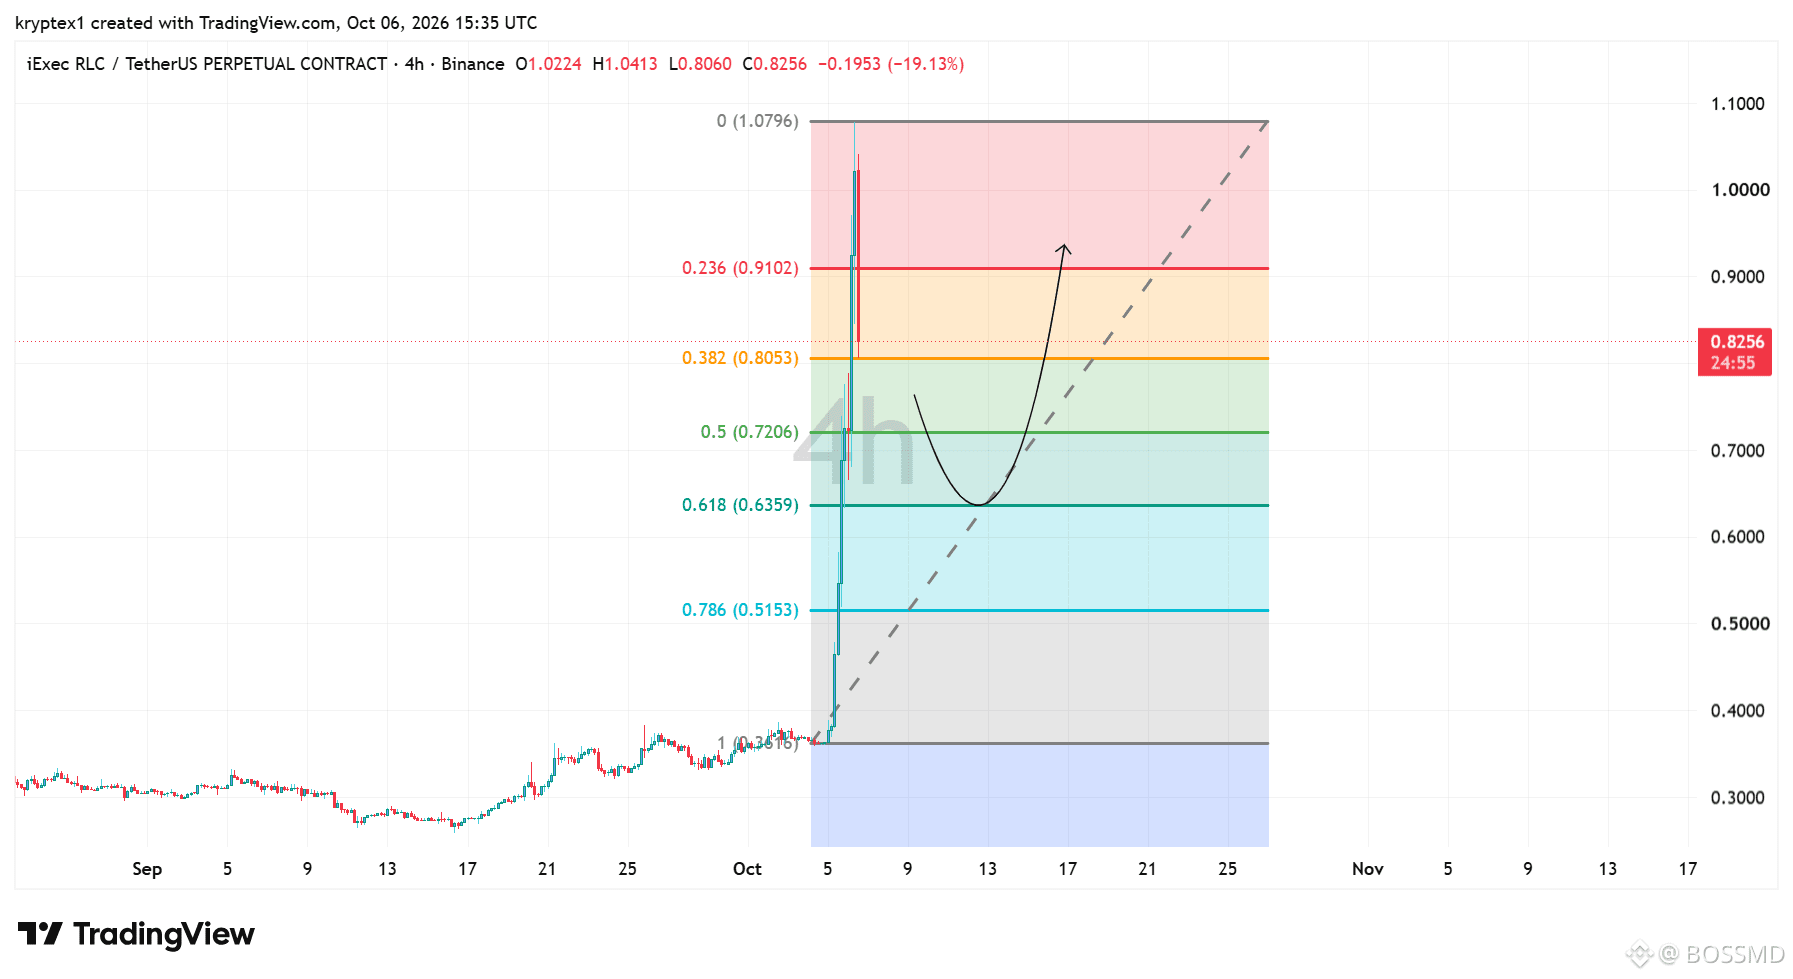
iExec RLC just made a massive move, but I’m more interested in what happens next.
$RLC pushed from around $0.36 to above $1.00 before starting to retrace. With price now around the $0.82 area, the Fibonacci levels become important.
The main level I’m watching is the 0.618 Fibonacci retracement at around $0.635,
If #RLC reaches this zone and buyers step in, it could provide the foundation for another move higher, with $0.91 as an important level to reclaim first.
The breakout was strong, but I wouldn’t chase it here. I want to see how price reacts around the 0.618 Golden Ratio. #bullish
iExec RLC just made a massive move, but I’m more interested in what happens next.
$RLC pushed from around $0.36 to above $1.00 before starting to retrace. With price now around the $0.82 area, the Fibonacci levels become important.
The main level I’m watching is the 0.618 Fibonacci retracement at around $0.635,
If #RLC reaches this zone and buyers step in, it could provide the foundation for another move higher, with $0.91 as an important level to reclaim first.
The breakout was strong, but I wouldn’t chase it here. I want to see how price reacts around the 0.618 Golden Ratio. #bullish
$RLC pushed from around $0.36 to above $1.00 before starting to retrace. With price now around the $0.82 area, the Fibonacci levels become important.
The main level I’m watching is the 0.618 Fibonacci retracement at around $0.635,
If #RLC reaches this zone and buyers step in, it could provide the foundation for another move higher, with $0.91 as an important level to reclaim first.
The breakout was strong, but I wouldn’t chase it here. I want to see how price reacts around the 0.618 Golden Ratio. #bullish
3
922
·
--
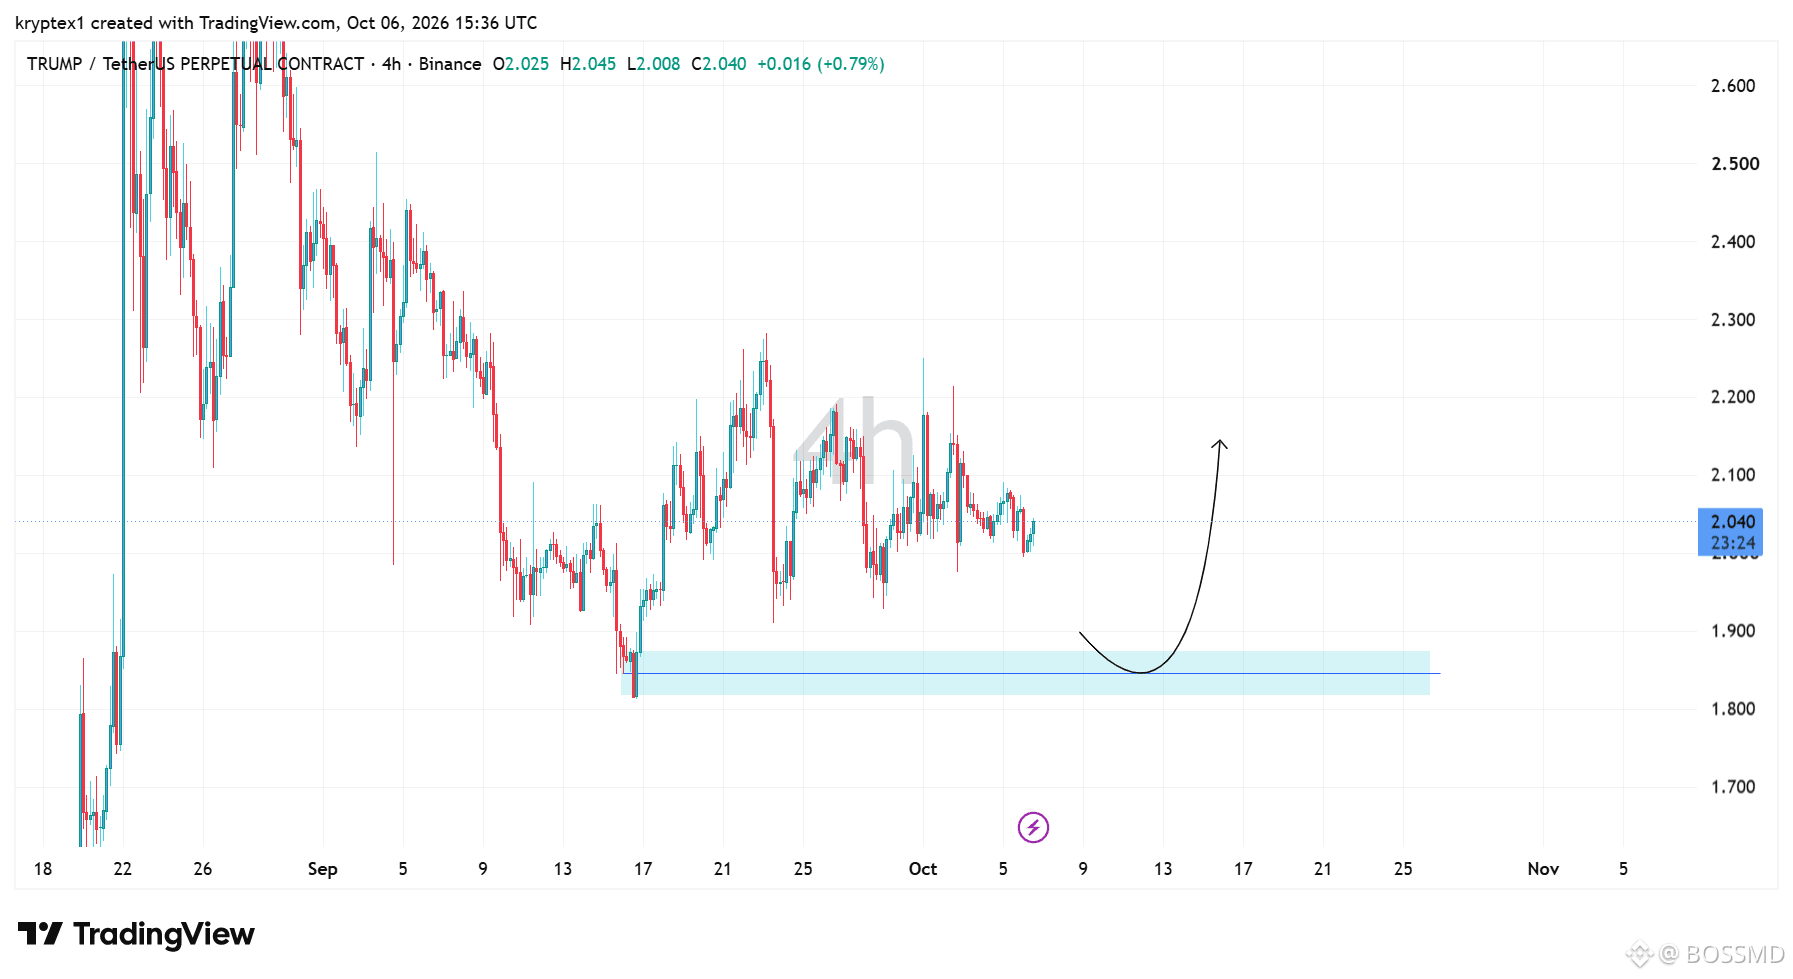
$TRUMP is sitting at an interesting spot.
Price is currently around $2.04, consolidating after several attempts to push higher. The chart shows a clear support zone around $1.82–$1.88, which is the area I’d watch if #TRUMP pulls back.
If that zone holds, the setup points toward a potential move back toward $2.10–$2.20. But if support fails, the bullish structure would need to be reassessed.
Watch the reaction at support before chasing the move.
$TRUMP is sitting at an interesting spot.
Price is currently around $2.04, consolidating after several attempts to push higher. The chart shows a clear support zone around $1.82–$1.88, which is the area I’d watch if #TRUMP pulls back.
If that zone holds, the setup points toward a potential move back toward $2.10–$2.20. But if support fails, the bullish structure would need to be reassessed.
Watch the reaction at support before chasing the move.
Price is currently around $2.04, consolidating after several attempts to push higher. The chart shows a clear support zone around $1.82–$1.88, which is the area I’d watch if #TRUMP pulls back.
If that zone holds, the setup points toward a potential move back toward $2.10–$2.20. But if support fails, the bullish structure would need to be reassessed.
Watch the reaction at support before chasing the move.
3
3.4k
·
--
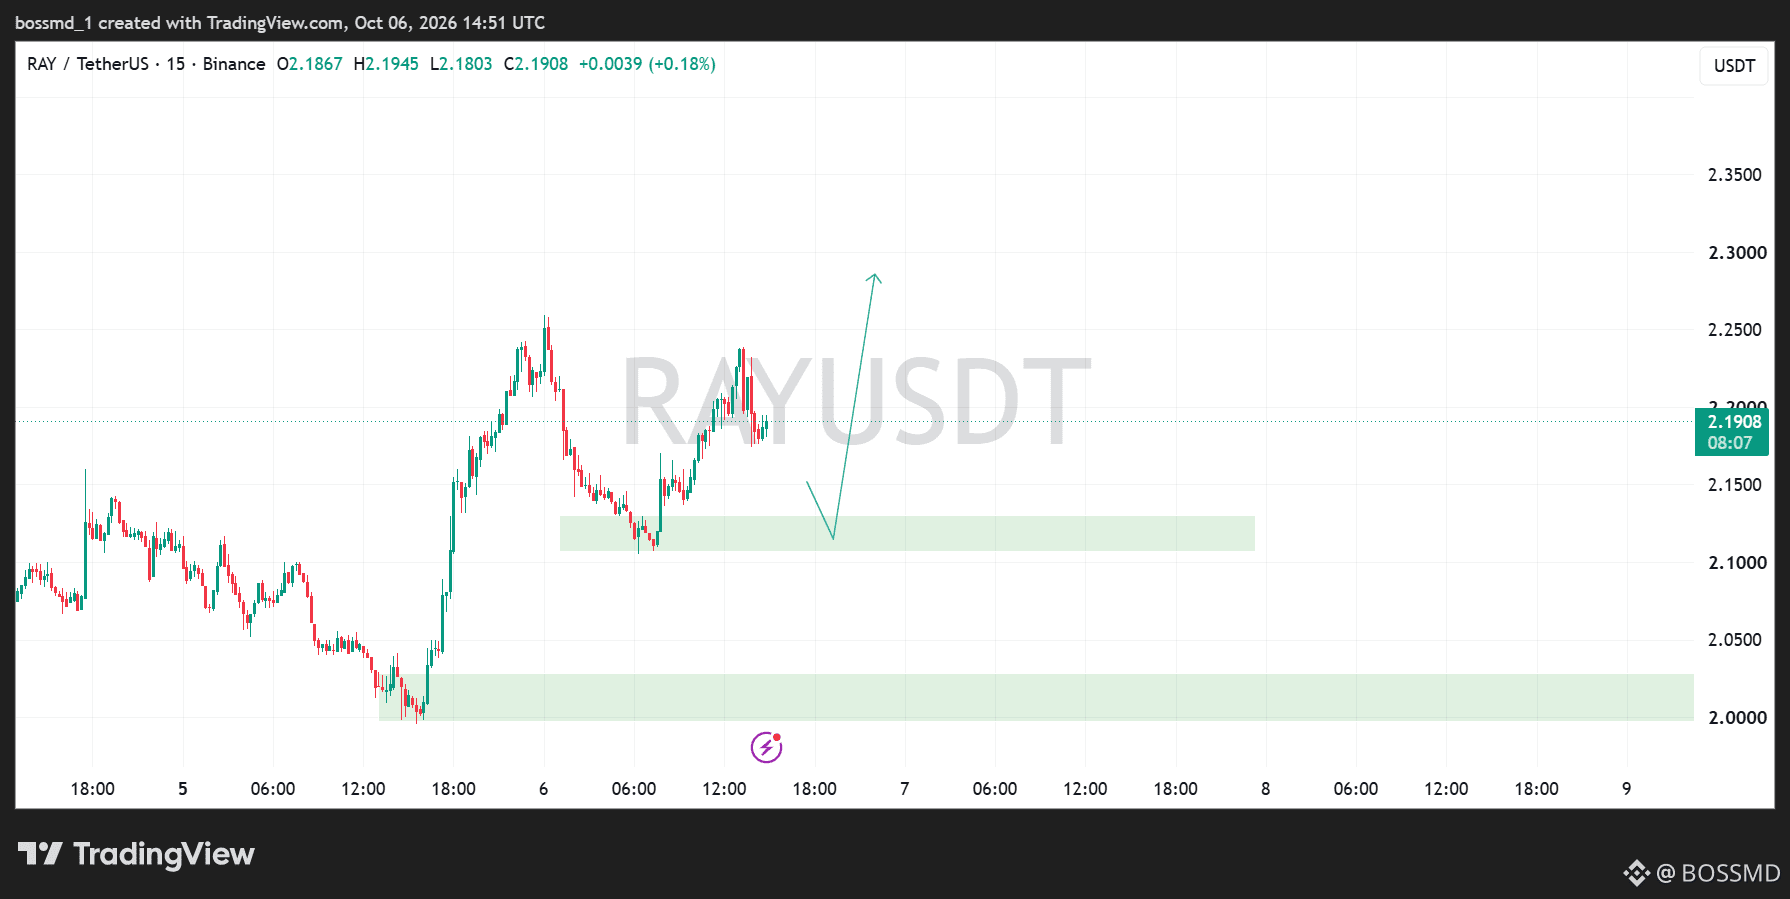
#Ray is setting up an interesting move.
$RAY is currently trading around $2.19 on the 15M chart after reclaiming the $2.10 area and pushing back toward the recent highs.
I’m watching the $2.10–$2.13 support zone closely. If price pulls back into this area and holds, the chart could set up for another move higher toward $2.25, with the next target around $2.30.
The important part is not to chase the current move. I’d rather see RAY revisit the marked zone, show a reaction, and then look for continuation.
As long as the $2.10 area holds, the short-term structure remains interesting. Lose that zone, and I’d reassess the setup.
#Ray is setting up an interesting move.
$RAY is currently trading around $2.19 on the 15M chart after reclaiming the $2.10 area and pushing back toward the recent highs.
I’m watching the $2.10–$2.13 support zone closely. If price pulls back into this area and holds, the chart could set up for another move higher toward $2.25, with the next target around $2.30.
The important part is not to chase the current move. I’d rather see RAY revisit the marked zone, show a reaction, and then look for continuation.
As long as the $2.10 area holds, the short-term structure remains interesting. Lose that zone, and I’d reassess the setup.
$RAY is currently trading around $2.19 on the 15M chart after reclaiming the $2.10 area and pushing back toward the recent highs.
I’m watching the $2.10–$2.13 support zone closely. If price pulls back into this area and holds, the chart could set up for another move higher toward $2.25, with the next target around $2.30.
The important part is not to chase the current move. I’d rather see RAY revisit the marked zone, show a reaction, and then look for continuation.
As long as the $2.10 area holds, the short-term structure remains interesting. Lose that zone, and I’d reassess the setup.
1
1.3k
·
--
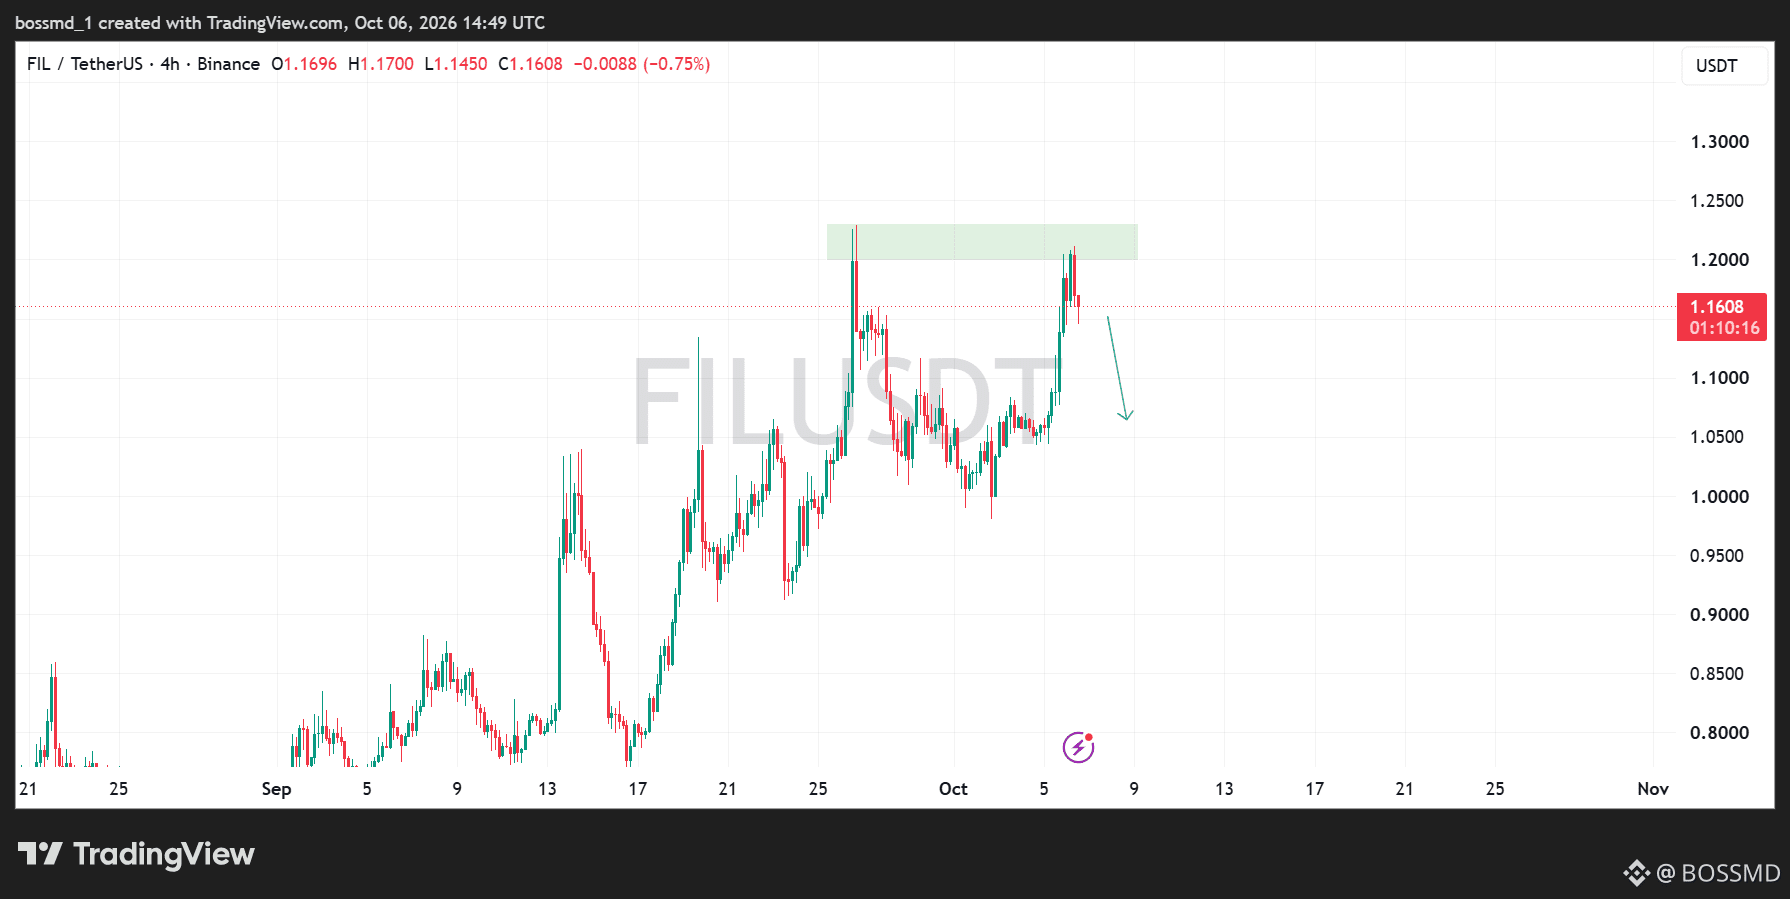
$FIL is approaching a key resistance zone.
On the 4H chart, FIL has made a strong recovery from the $1.00 area and is now trading around $1.16, but price is once again facing the $1.20–$1.23 resistance zone.
This area has already triggered a rejection before, so I’m watching the reaction carefully.
If #FIL/USDT gets rejected again, a pullback toward the $1.05–$1.08 area would make sense before another attempt higher.
The bullish scenario becomes more interesting if price can break above $1.23 and hold it as support. That would show that buyers are finally taking control of this resistance.
$FIL is approaching a key resistance zone.
On the 4H chart, FIL has made a strong recovery from the $1.00 area and is now trading around $1.16, but price is once again facing the $1.20–$1.23 resistance zone.
This area has already triggered a rejection before, so I’m watching the reaction carefully.
If #FIL/USDT gets rejected again, a pullback toward the $1.05–$1.08 area would make sense before another attempt higher.
The bullish scenario becomes more interesting if price can break above $1.23 and hold it as support. That would show that buyers are finally taking control of this resistance.
On the 4H chart, FIL has made a strong recovery from the $1.00 area and is now trading around $1.16, but price is once again facing the $1.20–$1.23 resistance zone.
This area has already triggered a rejection before, so I’m watching the reaction carefully.
If #FIL/USDT gets rejected again, a pullback toward the $1.05–$1.08 area would make sense before another attempt higher.
The bullish scenario becomes more interesting if price can break above $1.23 and hold it as support. That would show that buyers are finally taking control of this resistance.
2
899
·
--
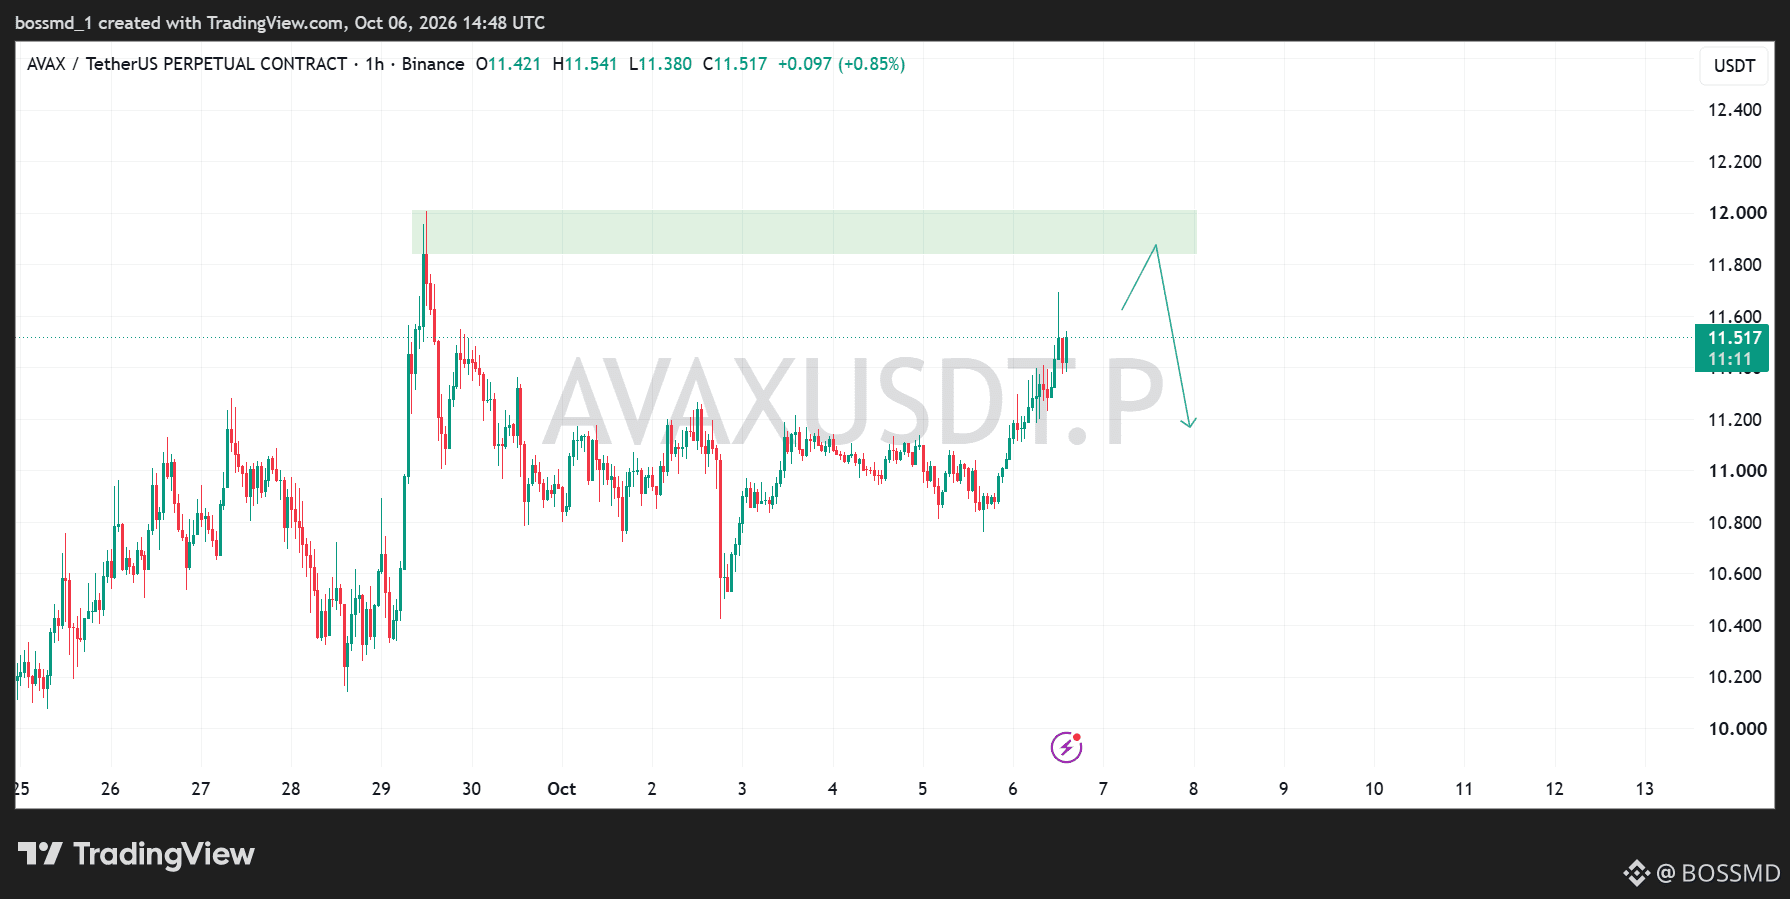
$AVAX is pushing higher on the 1H chart and is now trading around $11.52 after a strong move from the $11.00 area.
The key zone I’m watching is $11.85–$12.00. If price reaches this resistance and gets rejected, a pullback toward the $11.20 area could follow before the next move.
If #AVAX breaks and holds above $12.00, however, the structure could open the door for further upside.
No need to chase the move let price show the next confirmation.
$AVAX is pushing higher on the 1H chart and is now trading around $11.52 after a strong move from the $11.00 area.
The key zone I’m watching is $11.85–$12.00. If price reaches this resistance and gets rejected, a pullback toward the $11.20 area could follow before the next move.
If #AVAX breaks and holds above $12.00, however, the structure could open the door for further upside.
No need to chase the move let price show the next confirmation.
The key zone I’m watching is $11.85–$12.00. If price reaches this resistance and gets rejected, a pullback toward the $11.20 area could follow before the next move.
If #AVAX breaks and holds above $12.00, however, the structure could open the door for further upside.
No need to chase the move let price show the next confirmation.
2
2.5k
·
--
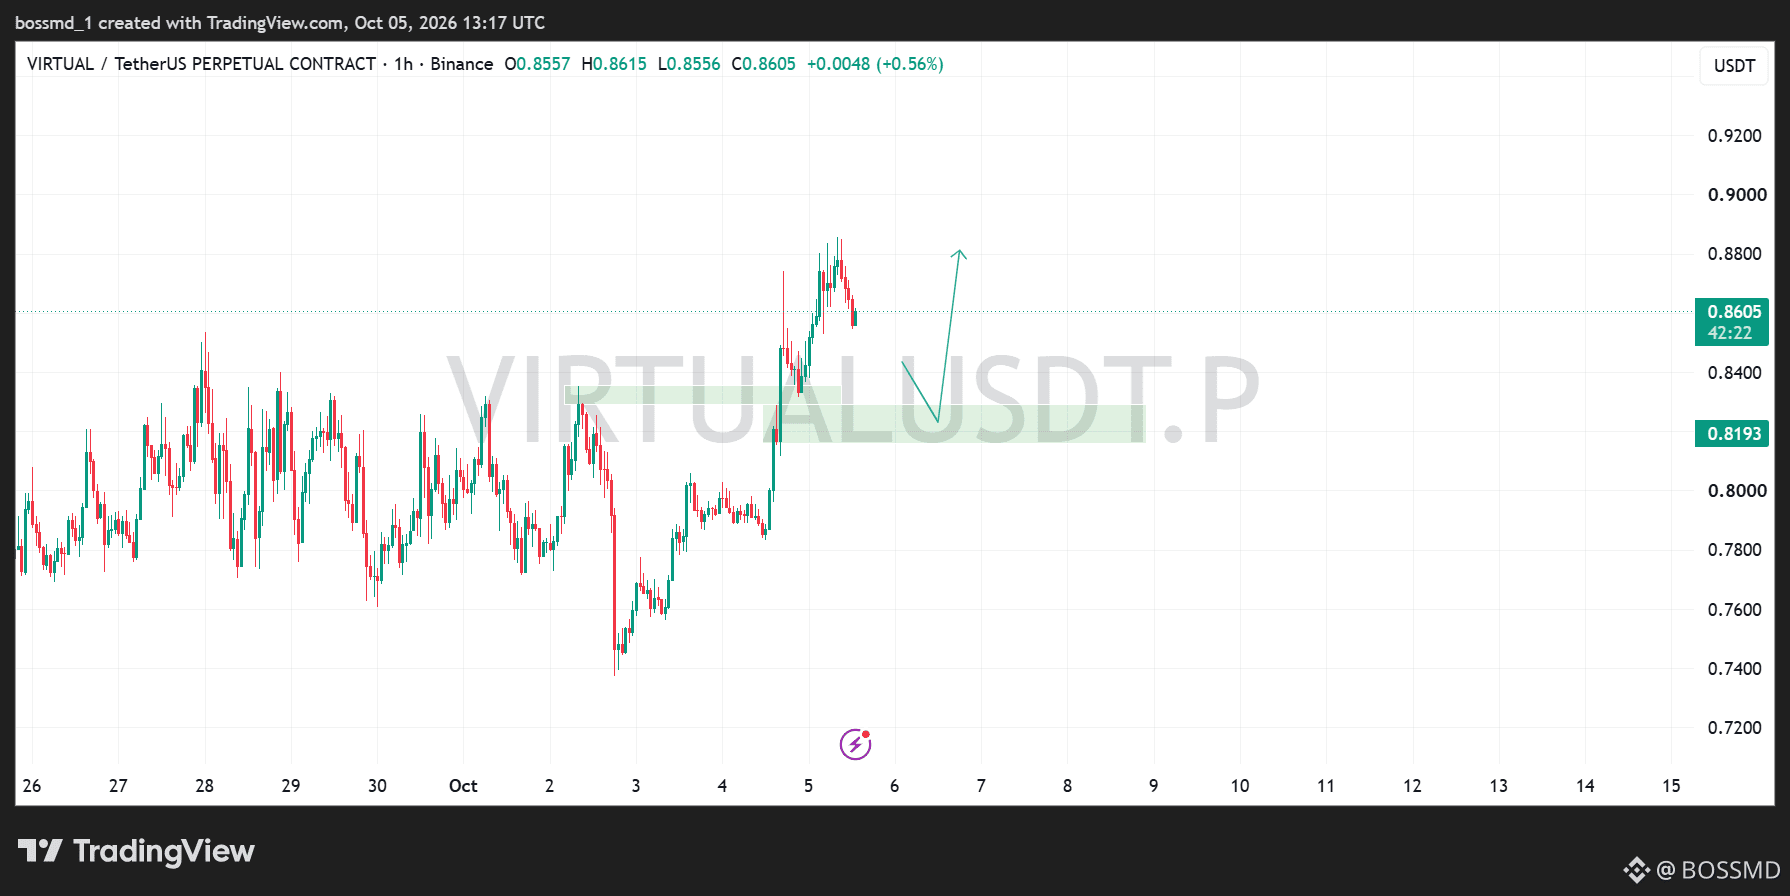
$VIRTUAL is showing a strong move on the 1H chart
Price is now cooling off after pushing into the $0.88 area.
I’m watching the $0.82–$0.84 zone as the key area. If #VIRTUAL pulls back into this zone and holds, it could give the bulls a solid base for another push toward $0.88 and potentially higher.
For now, I wouldn’t chase the move. Let price come to the support zone and watch how it reacts.
The structure remains interesting as long as that area holds.
$VIRTUAL is showing a strong move on the 1H chart
Price is now cooling off after pushing into the $0.88 area.
I’m watching the $0.82–$0.84 zone as the key area. If #VIRTUAL pulls back into this zone and holds, it could give the bulls a solid base for another push toward $0.88 and potentially higher.
For now, I wouldn’t chase the move. Let price come to the support zone and watch how it reacts.
The structure remains interesting as long as that area holds.
Price is now cooling off after pushing into the $0.88 area.
I’m watching the $0.82–$0.84 zone as the key area. If #VIRTUAL pulls back into this zone and holds, it could give the bulls a solid base for another push toward $0.88 and potentially higher.
For now, I wouldn’t chase the move. Let price come to the support zone and watch how it reacts.
The structure remains interesting as long as that area holds.
1
3
3.2k
·
--
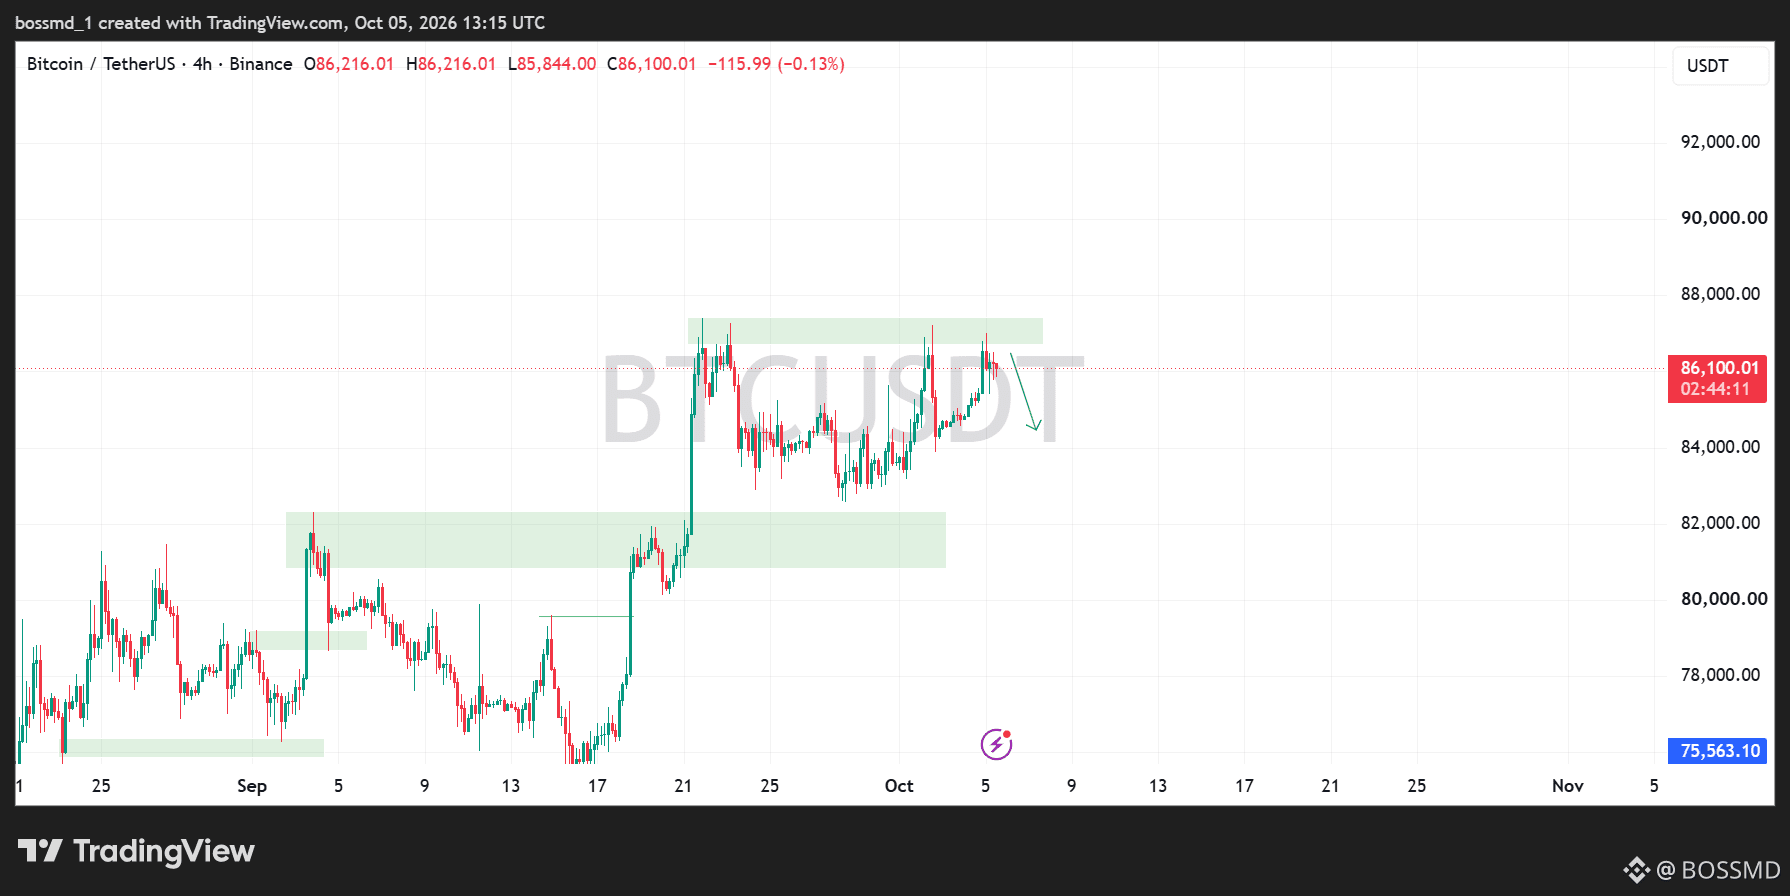
$BTC is still holding above the $82K support zone, but the 4H chart shows price struggling around the $86K–$87K resistance area.
A rejection from this zone could bring BTC back toward the $84K area first, while the bigger support remains around $82K. If buyers reclaim and hold above $87K, the structure could start looking stronger for another push higher.
I’m watching the reaction at resistance closely.
#Bitcoin needs to break this area cleanly before the next move becomes clearer.
$BTC is still holding above the $82K support zone, but the 4H chart shows price struggling around the $86K–$87K resistance area.
A rejection from this zone could bring BTC back toward the $84K area first, while the bigger support remains around $82K. If buyers reclaim and hold above $87K, the structure could start looking stronger for another push higher.
I’m watching the reaction at resistance closely.
#Bitcoin needs to break this area cleanly before the next move becomes clearer.
A rejection from this zone could bring BTC back toward the $84K area first, while the bigger support remains around $82K. If buyers reclaim and hold above $87K, the structure could start looking stronger for another push higher.
I’m watching the reaction at resistance closely.
#Bitcoin needs to break this area cleanly before the next move becomes clearer.
1
2k
·
--
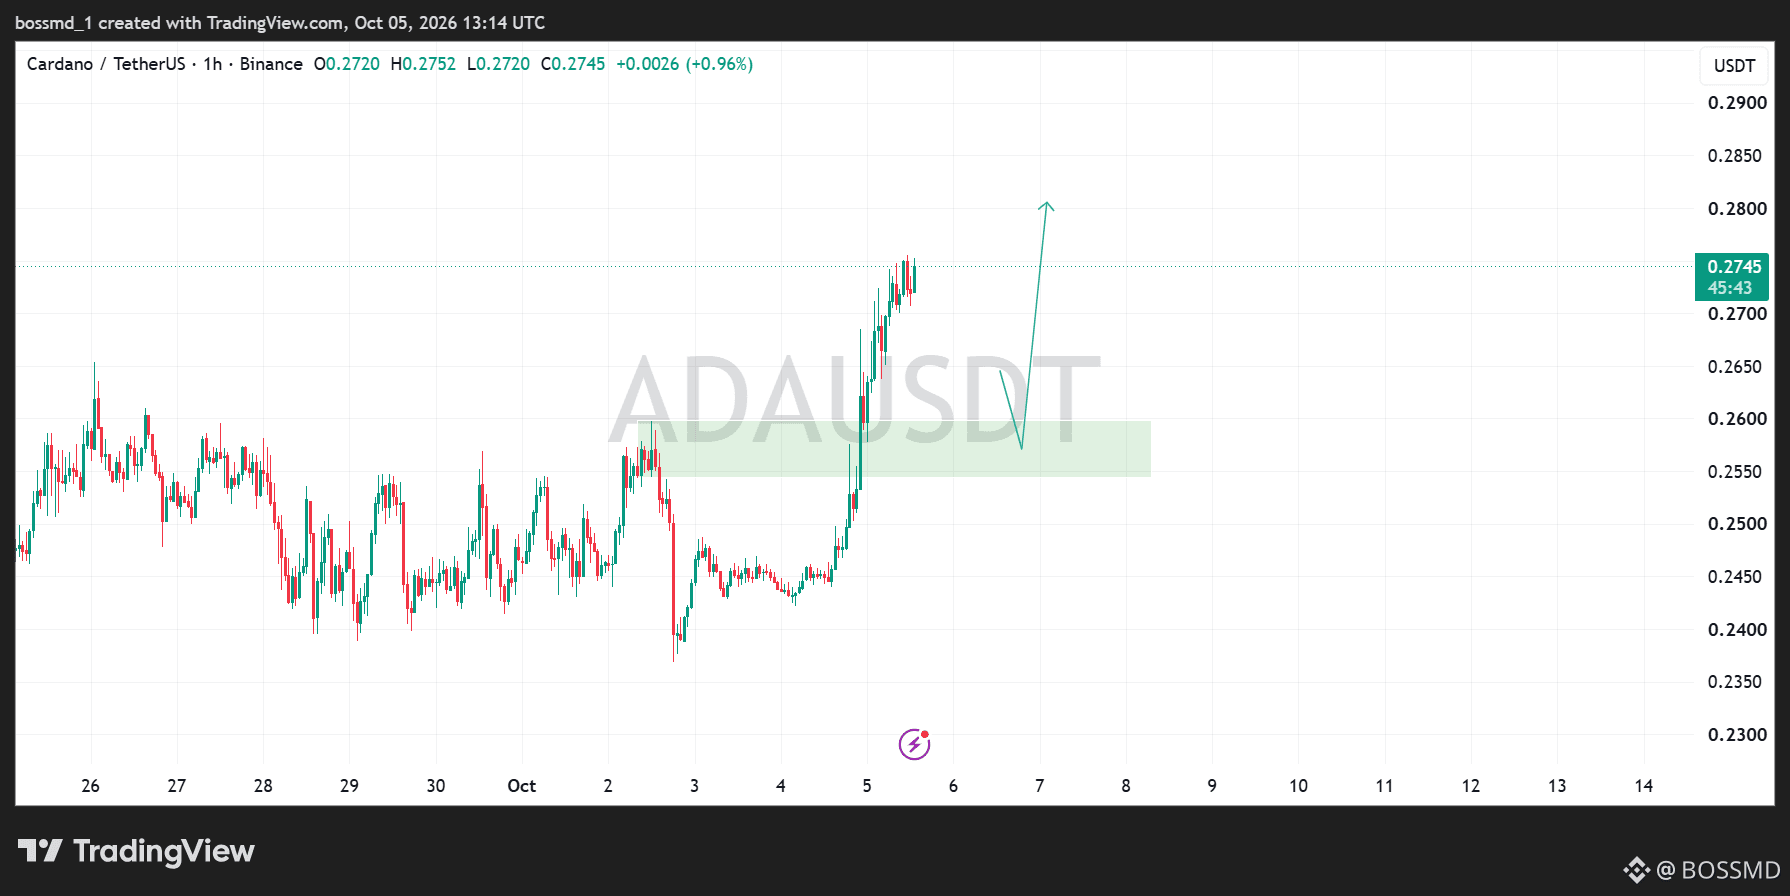
$ADA is showing strong momentum on the 1H chart, pushing up to around $0.274 after breaking out of its previous range.
The key area I’m watching now is $0.255–$0.260. If price pulls back into this zone and holds it as support, the current structure could set up for another move toward $0.280 and potentially higher.
For me, the main thing is simple: watch how #ADA reacts at the marked support zone.
A strong hold keeps the #bullish setup interesting.
$ADA is showing strong momentum on the 1H chart, pushing up to around $0.274 after breaking out of its previous range.
The key area I’m watching now is $0.255–$0.260. If price pulls back into this zone and holds it as support, the current structure could set up for another move toward $0.280 and potentially higher.
For me, the main thing is simple: watch how #ADA reacts at the marked support zone.
A strong hold keeps the #bullish setup interesting.
The key area I’m watching now is $0.255–$0.260. If price pulls back into this zone and holds it as support, the current structure could set up for another move toward $0.280 and potentially higher.
For me, the main thing is simple: watch how #ADA reacts at the marked support zone.
A strong hold keeps the #bullish setup interesting.
1
13
9.5k
·
--
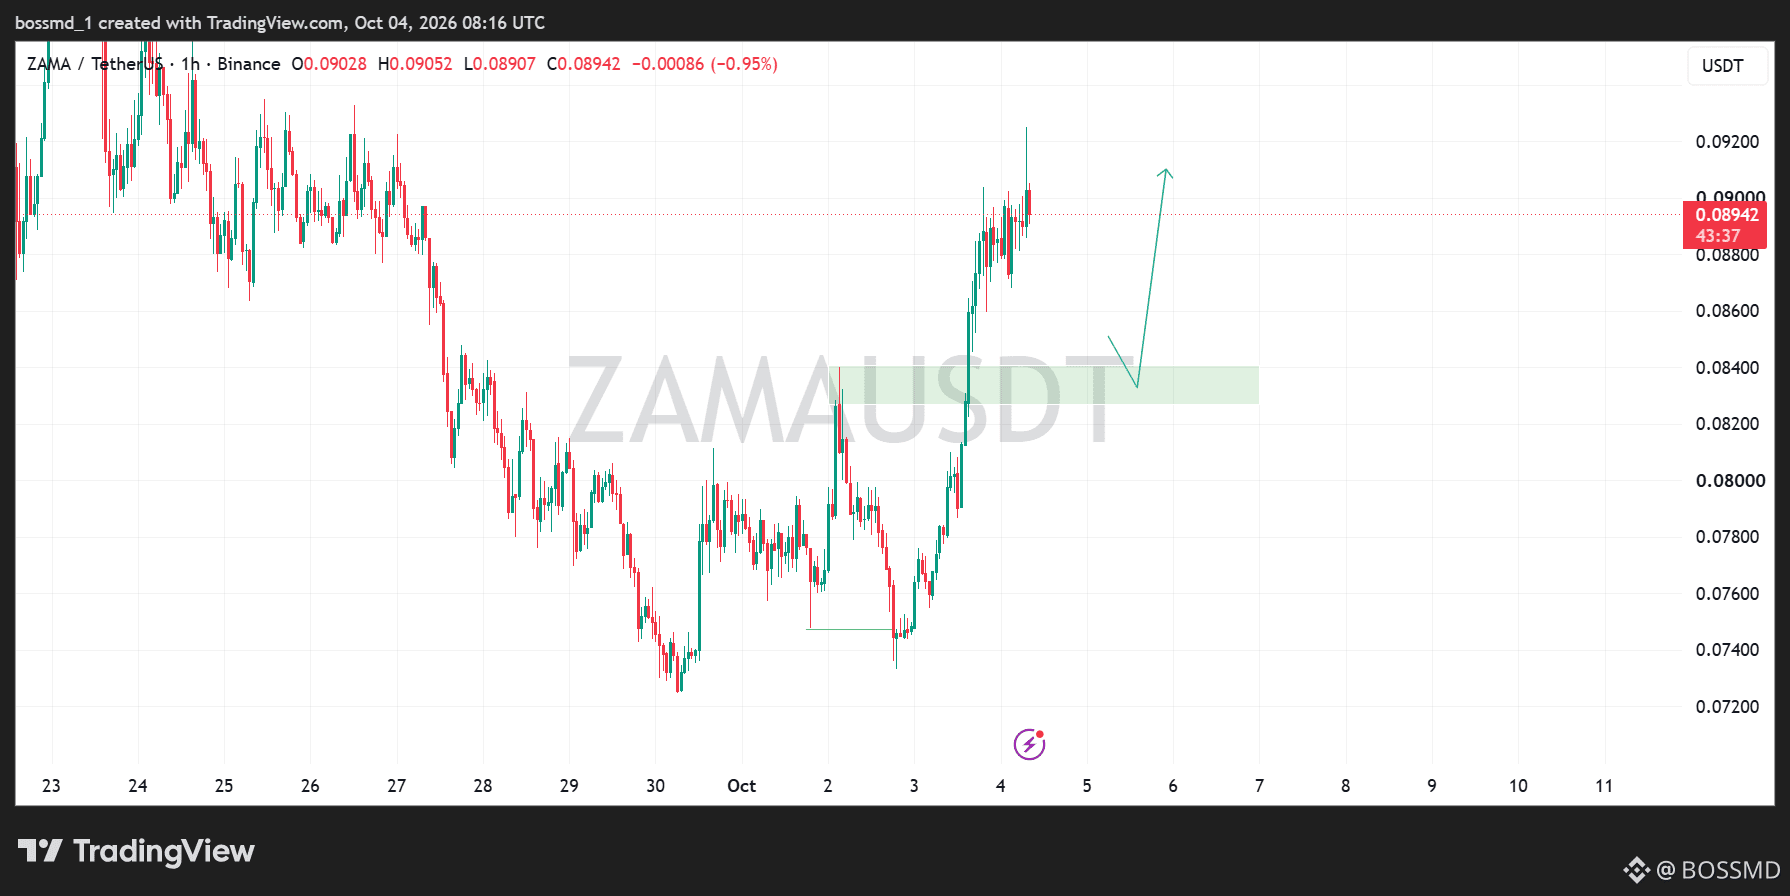
$ZAMA is showing a strong recovery on the 1H chart after bouncing from the $0.074–$0.076 area.
Price is now around $0.089, and the key zone I’m watching is $0.083–$0.084.
If #Zama pulls back into this area and holds as support, the chart could set up for another move higher toward $0.091–$0.092.
The momentum is looking good, but I’d want to see that support hold before expecting the next leg up.
$ZAMA is showing a strong recovery on the 1H chart after bouncing from the $0.074–$0.076 area.
Price is now around $0.089, and the key zone I’m watching is $0.083–$0.084.
If #Zama pulls back into this area and holds as support, the chart could set up for another move higher toward $0.091–$0.092.
The momentum is looking good, but I’d want to see that support hold before expecting the next leg up.
Price is now around $0.089, and the key zone I’m watching is $0.083–$0.084.
If #Zama pulls back into this area and holds as support, the chart could set up for another move higher toward $0.091–$0.092.
The momentum is looking good, but I’d want to see that support hold before expecting the next leg up.
1
6
3.7k
·
--
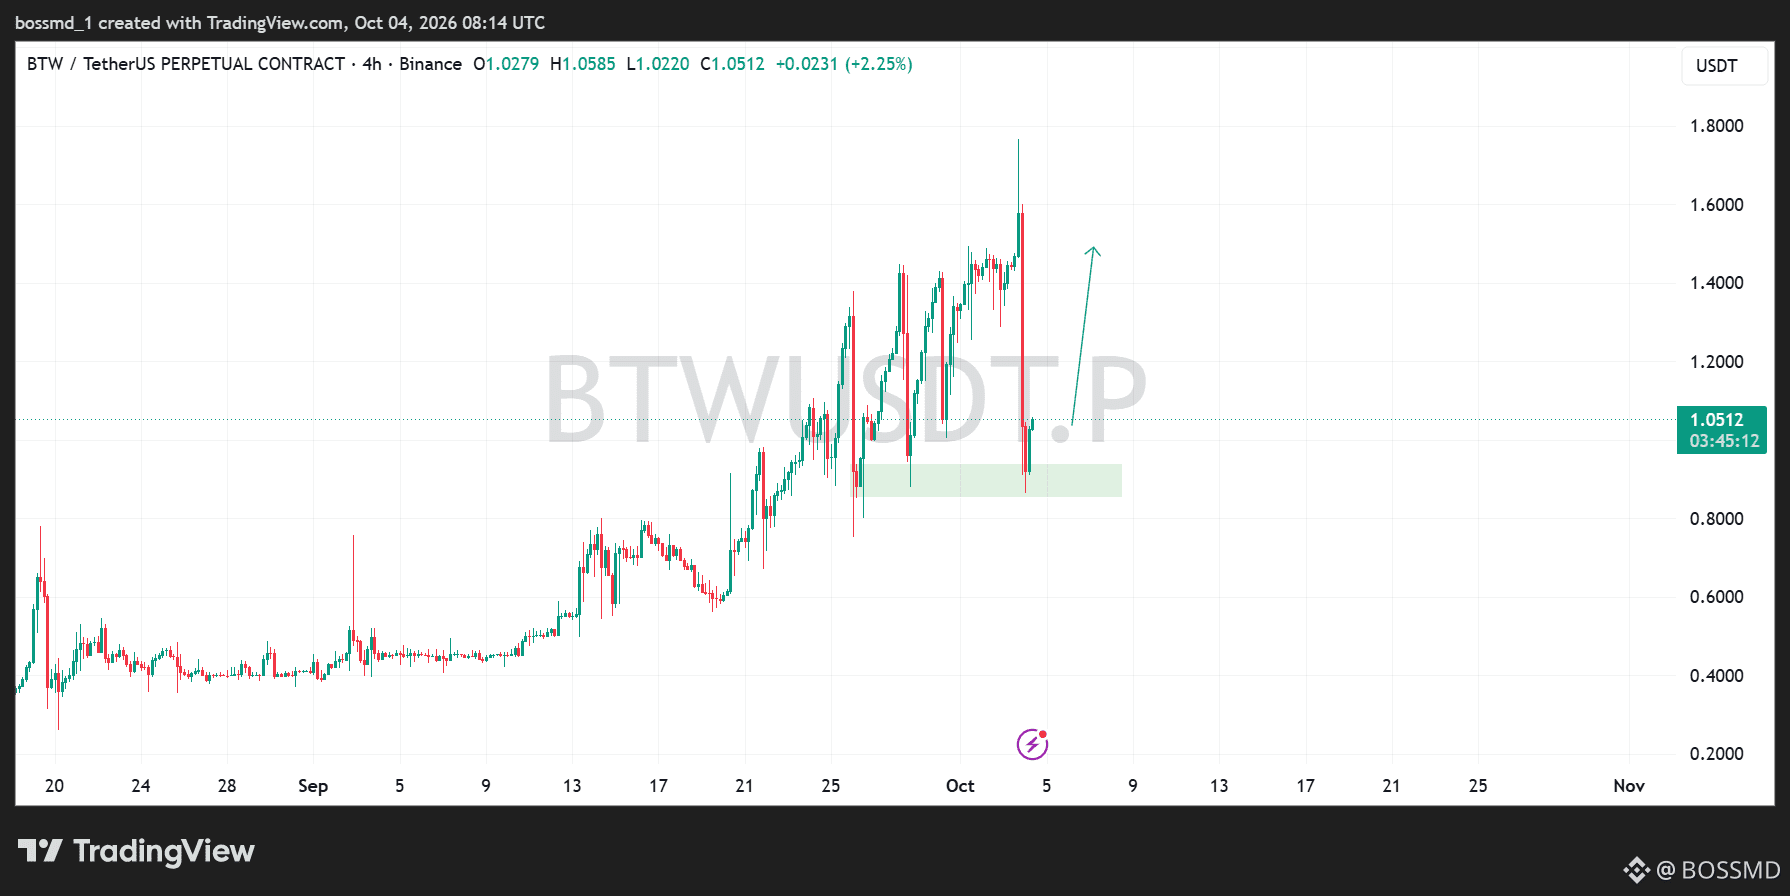
$BTW is showing strong momentum on the 4H chart after a sharp move higher.
Price is currently around $1.05 and has pulled back into the marked support zone around $0.90–$0.95.
If this area holds and buyers step back in, I’ll be watching for a move toward $1.40–$1.60 next. A clean loss of the support zone would weaken this setup, so that’s the key area to watch.
For now, #BTW looks interesting after the pullback.
$BTW is showing strong momentum on the 4H chart after a sharp move higher.
Price is currently around $1.05 and has pulled back into the marked support zone around $0.90–$0.95.
If this area holds and buyers step back in, I’ll be watching for a move toward $1.40–$1.60 next. A clean loss of the support zone would weaken this setup, so that’s the key area to watch.
For now, #BTW looks interesting after the pullback.
Price is currently around $1.05 and has pulled back into the marked support zone around $0.90–$0.95.
If this area holds and buyers step back in, I’ll be watching for a move toward $1.40–$1.60 next. A clean loss of the support zone would weaken this setup, so that’s the key area to watch.
For now, #BTW looks interesting after the pullback.
6
8
5.1k
·
--
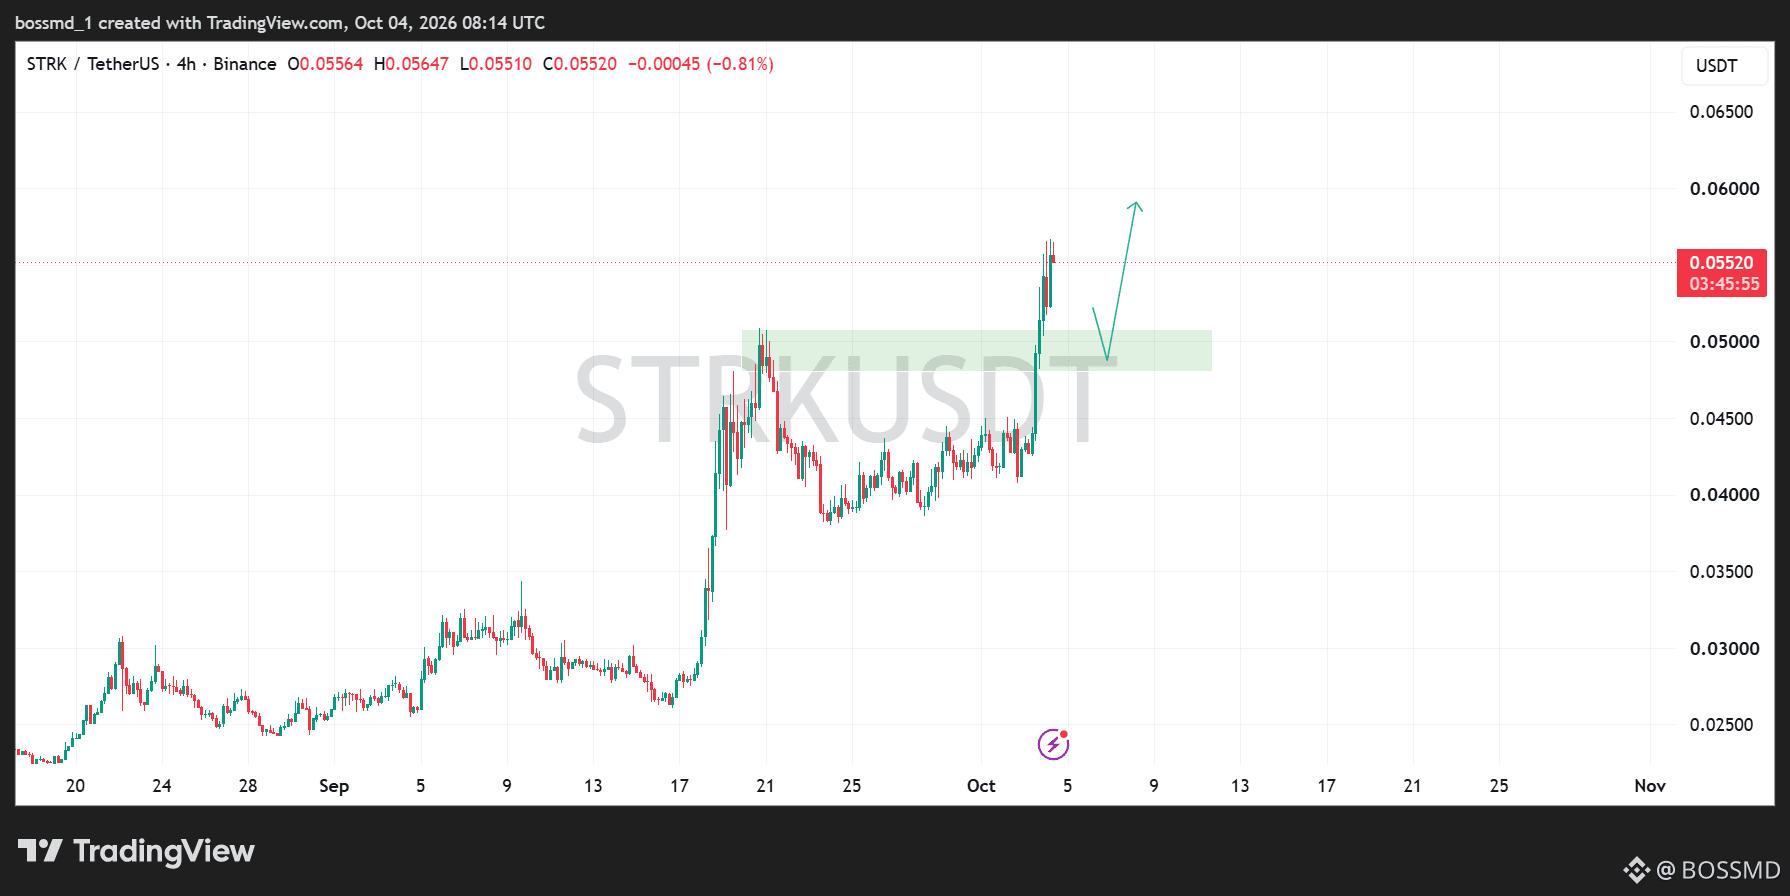
$STRK is showing a strong setup on the 4H chart.
Price has pushed strongly from the lower levels and is now trading around $0.0552, after breaking above the $0.048–$0.051 area. I’m watching this zone closely as potential support if price comes back to retest it.
If #strk holds this area and buyers remain in control, the next move could target around $0.059–$0.060. The key is not to chase the current move; I’d rather watch how price reacts around the marked zone.
A clean hold could keep the bullish structure intact, while losing it would weaken the setup.
$STRK is showing a strong setup on the 4H chart.
Price has pushed strongly from the lower levels and is now trading around $0.0552, after breaking above the $0.048–$0.051 area. I’m watching this zone closely as potential support if price comes back to retest it.
If #strk holds this area and buyers remain in control, the next move could target around $0.059–$0.060. The key is not to chase the current move; I’d rather watch how price reacts around the marked zone.
A clean hold could keep the bullish structure intact, while losing it would weaken the setup.
Price has pushed strongly from the lower levels and is now trading around $0.0552, after breaking above the $0.048–$0.051 area. I’m watching this zone closely as potential support if price comes back to retest it.
If #strk holds this area and buyers remain in control, the next move could target around $0.059–$0.060. The key is not to chase the current move; I’d rather watch how price reacts around the marked zone.
A clean hold could keep the bullish structure intact, while losing it would weaken the setup.
1
3
4.8k
·
--
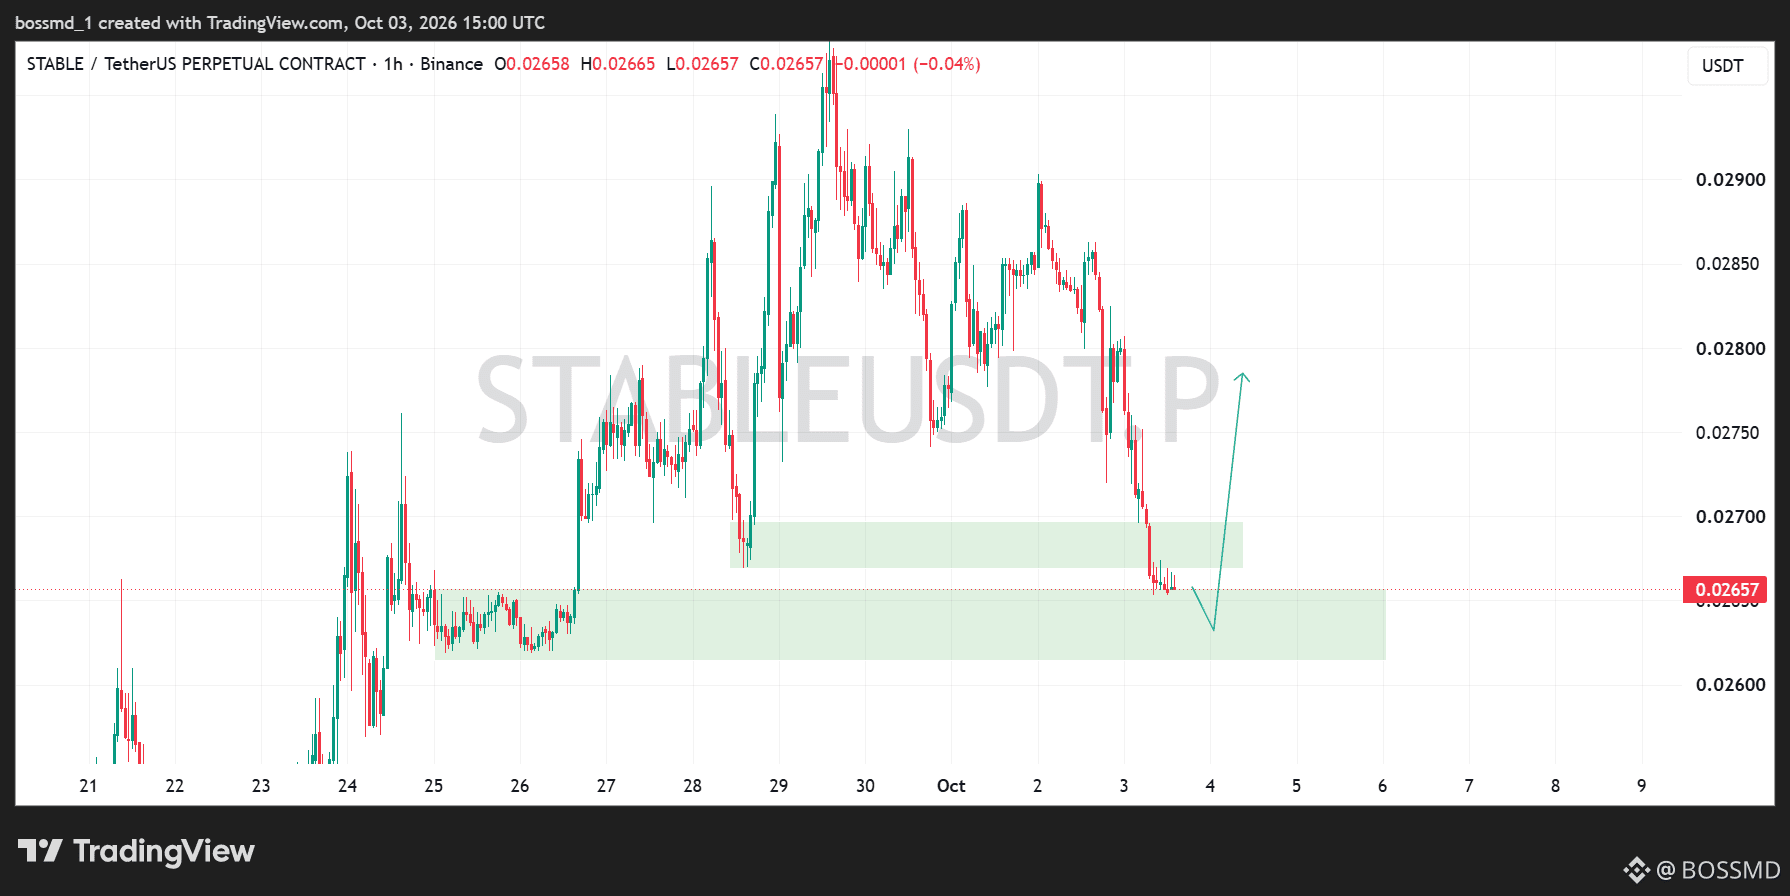
$STABLE is sitting in a key support zone around $0.0263–$0.0269 after the recent pullback.
If this zone holds, I’ll be watching for a bounce toward the $0.0278 area.
The reaction here is important, so I’d rather wait for confirmation than chase the move. #stable
$STABLE is sitting in a key support zone around $0.0263–$0.0269 after the recent pullback.
If this zone holds, I’ll be watching for a bounce toward the $0.0278 area.
The reaction here is important, so I’d rather wait for confirmation than chase the move. #stable
If this zone holds, I’ll be watching for a bounce toward the $0.0278 area.
The reaction here is important, so I’d rather wait for confirmation than chase the move. #stable
1
3
2.3k
·
--
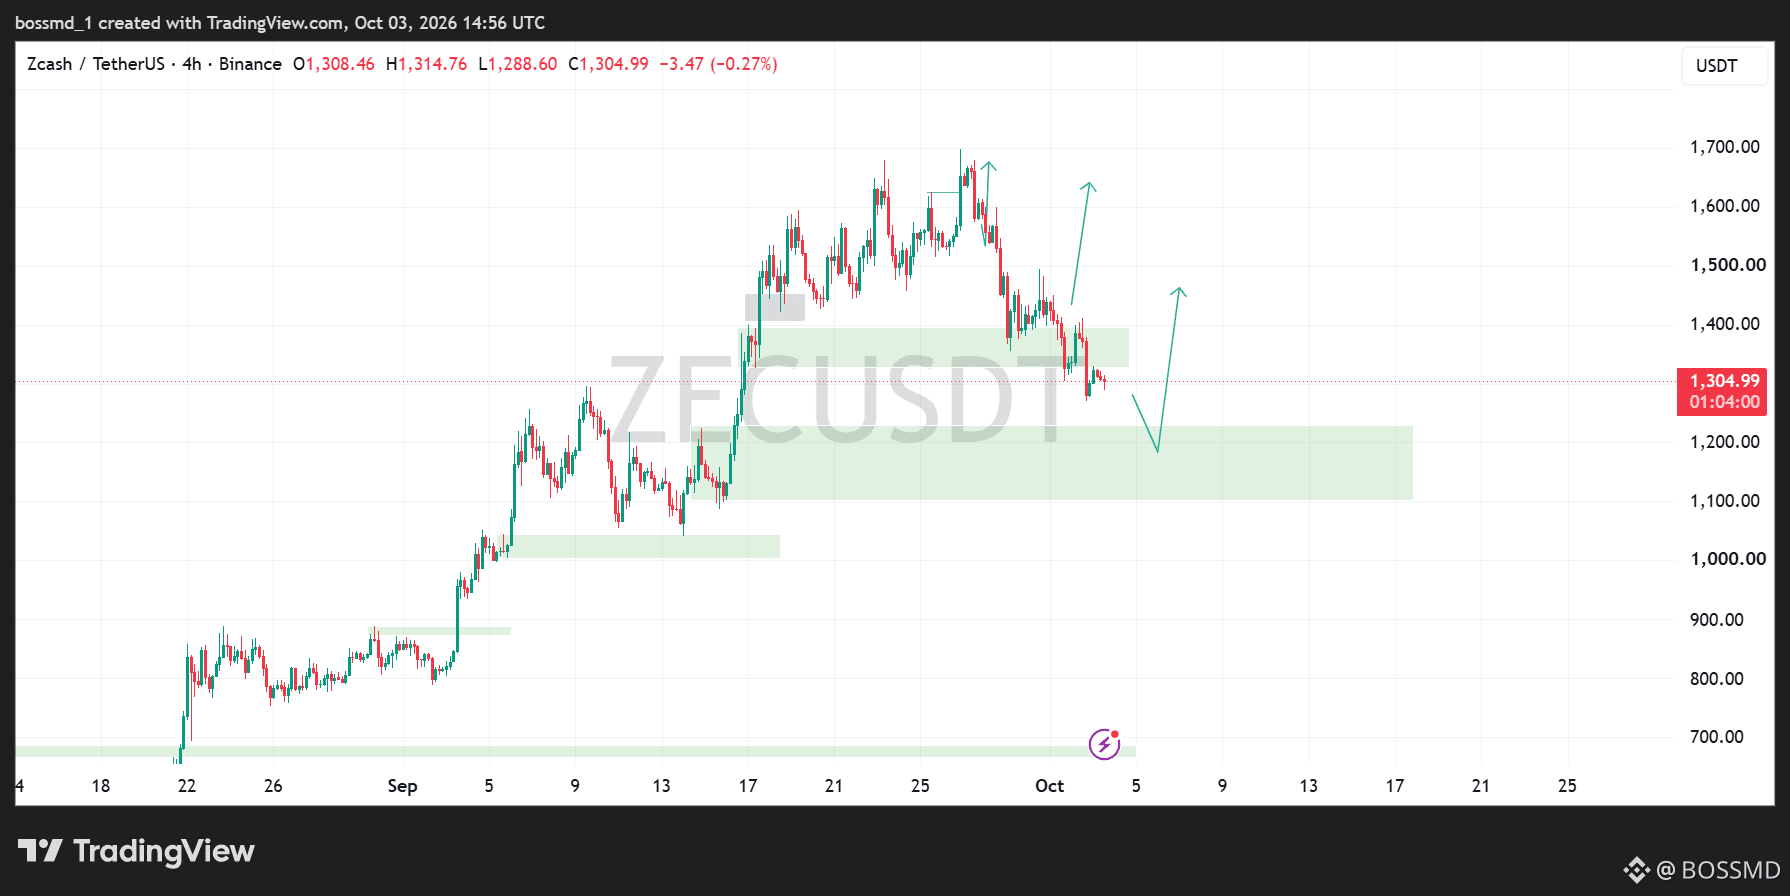
$ZEC is approaching an important support area.
After pushing toward the $1,700 region, price has been moving through a healthy correction and is now trading around $1,305. The first zone I’m watching is around $1,350–$1,400, but if that area fails to hold, the stronger support zone sits around $1,100–$1,250.
This is the area where I’d want to see buyers step back in and price build a solid reaction.
If that support holds, the chart still has room for another move toward $1,450, with the higher targets around $1,600+ coming into focus afterward. #zec
$ZEC is approaching an important support area.
After pushing toward the $1,700 region, price has been moving through a healthy correction and is now trading around $1,305. The first zone I’m watching is around $1,350–$1,400, but if that area fails to hold, the stronger support zone sits around $1,100–$1,250.
This is the area where I’d want to see buyers step back in and price build a solid reaction.
If that support holds, the chart still has room for another move toward $1,450, with the higher targets around $1,600+ coming into focus afterward. #zec
After pushing toward the $1,700 region, price has been moving through a healthy correction and is now trading around $1,305. The first zone I’m watching is around $1,350–$1,400, but if that area fails to hold, the stronger support zone sits around $1,100–$1,250.
This is the area where I’d want to see buyers step back in and price build a solid reaction.
If that support holds, the chart still has room for another move toward $1,450, with the higher targets around $1,600+ coming into focus afterward. #zec
5
1
12
7.5k
·
--
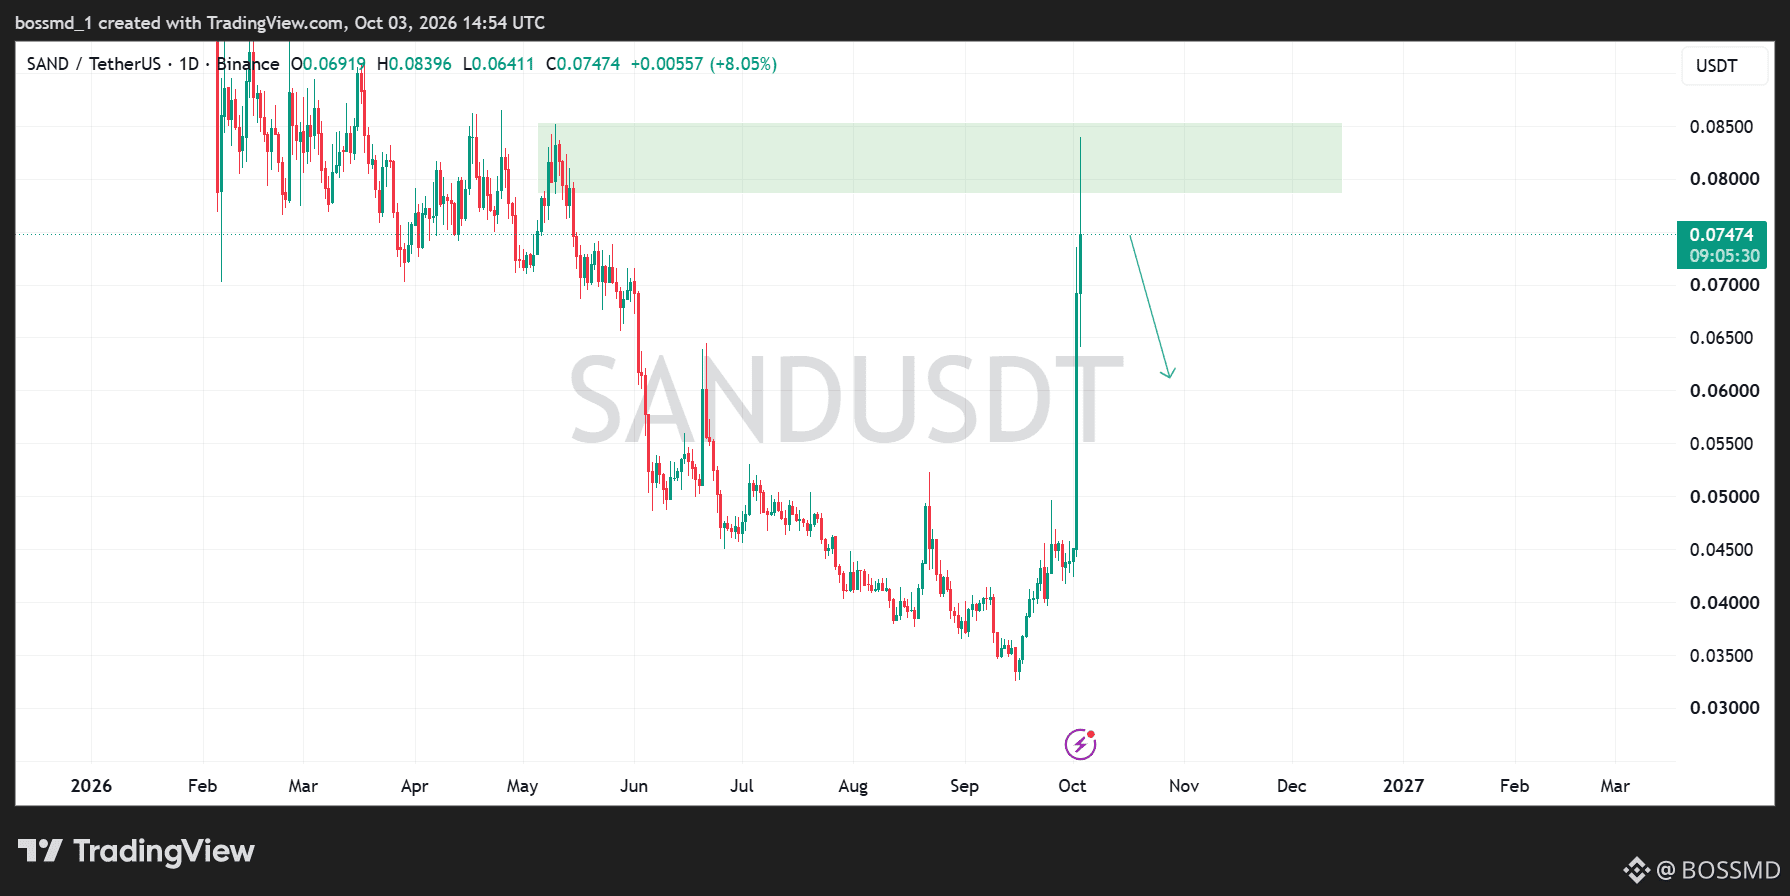
$SAND is moving fast, but this is exactly where I’d start paying more attention to the reaction around resistance.
On the 1D chart, price has made a strong move from the $0.035 area and is now trading around $0.0747 after a sharp breakout. The important zone above is around $0.079–$0.085, where previous price action shows strong resistance.
Price has now pushed into this zone, so a pullback would not be surprising. The area around $0.060–$0.065 is the key region I’m watching if the rejection continues. A healthy reaction there could give the structure room to build again. #bullish
$SAND is moving fast, but this is exactly where I’d start paying more attention to the reaction around resistance.
On the 1D chart, price has made a strong move from the $0.035 area and is now trading around $0.0747 after a sharp breakout. The important zone above is around $0.079–$0.085, where previous price action shows strong resistance.
Price has now pushed into this zone, so a pullback would not be surprising. The area around $0.060–$0.065 is the key region I’m watching if the rejection continues. A healthy reaction there could give the structure room to build again. #bullish
On the 1D chart, price has made a strong move from the $0.035 area and is now trading around $0.0747 after a sharp breakout. The important zone above is around $0.079–$0.085, where previous price action shows strong resistance.
Price has now pushed into this zone, so a pullback would not be surprising. The area around $0.060–$0.065 is the key region I’m watching if the rejection continues. A healthy reaction there could give the structure room to build again. #bullish
8
2
34
37.8k
·
--
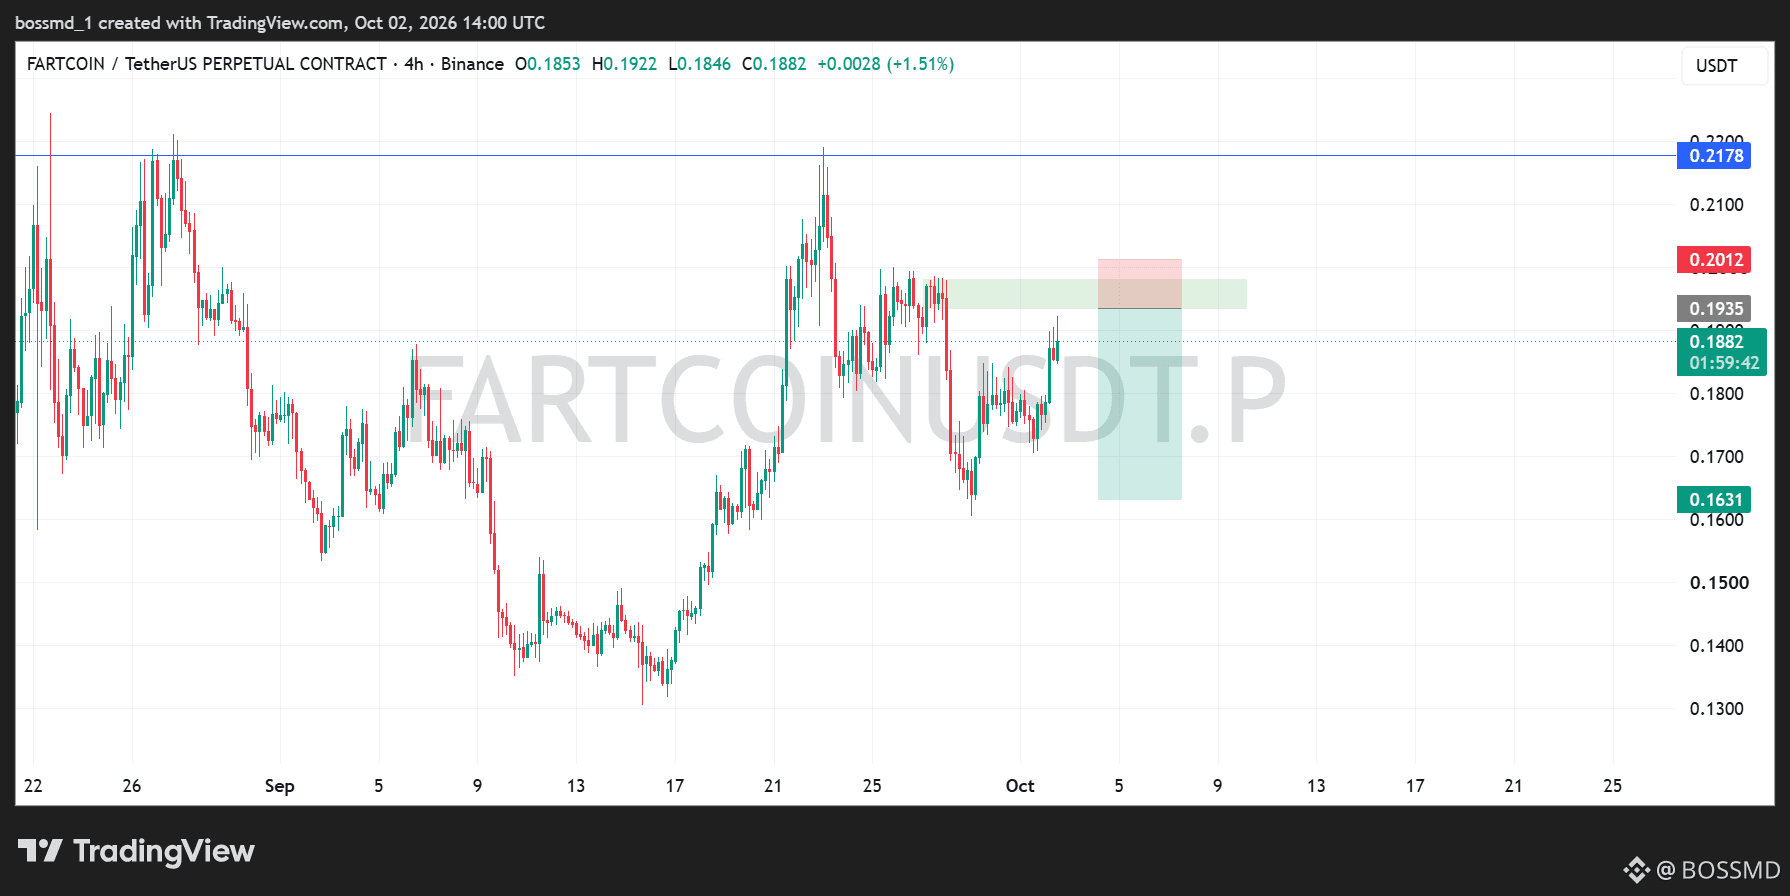
$FARTCOIN is approaching a key resistance zone, and the current structure is starting to look interesting.
After recovering from the $0.13 area and pushing toward $0.22, price has been moving within a broad range.
#Fartcoin is currently trading around $0.188, with resistance sitting around $0.193–$0.198.
The chart suggests a possible rejection from this supply zone, which could send price toward $0.163 if sellers take control. A sustained move above $0.20, however, could weaken the bearish setup and bring the $0.218 resistance back into focus.
I’m watching how price reacts around this supply zone. Will sellers defend the resistance, or will buyers finally push through?
$FARTCOIN is approaching a key resistance zone, and the current structure is starting to look interesting.
After recovering from the $0.13 area and pushing toward $0.22, price has been moving within a broad range.
#Fartcoin is currently trading around $0.188, with resistance sitting around $0.193–$0.198.
The chart suggests a possible rejection from this supply zone, which could send price toward $0.163 if sellers take control. A sustained move above $0.20, however, could weaken the bearish setup and bring the $0.218 resistance back into focus.
I’m watching how price reacts around this supply zone. Will sellers defend the resistance, or will buyers finally push through?
After recovering from the $0.13 area and pushing toward $0.22, price has been moving within a broad range.
#Fartcoin is currently trading around $0.188, with resistance sitting around $0.193–$0.198.
The chart suggests a possible rejection from this supply zone, which could send price toward $0.163 if sellers take control. A sustained move above $0.20, however, could weaken the bearish setup and bring the $0.218 resistance back into focus.
I’m watching how price reacts around this supply zone. Will sellers defend the resistance, or will buyers finally push through?
2
1.7k
·
--
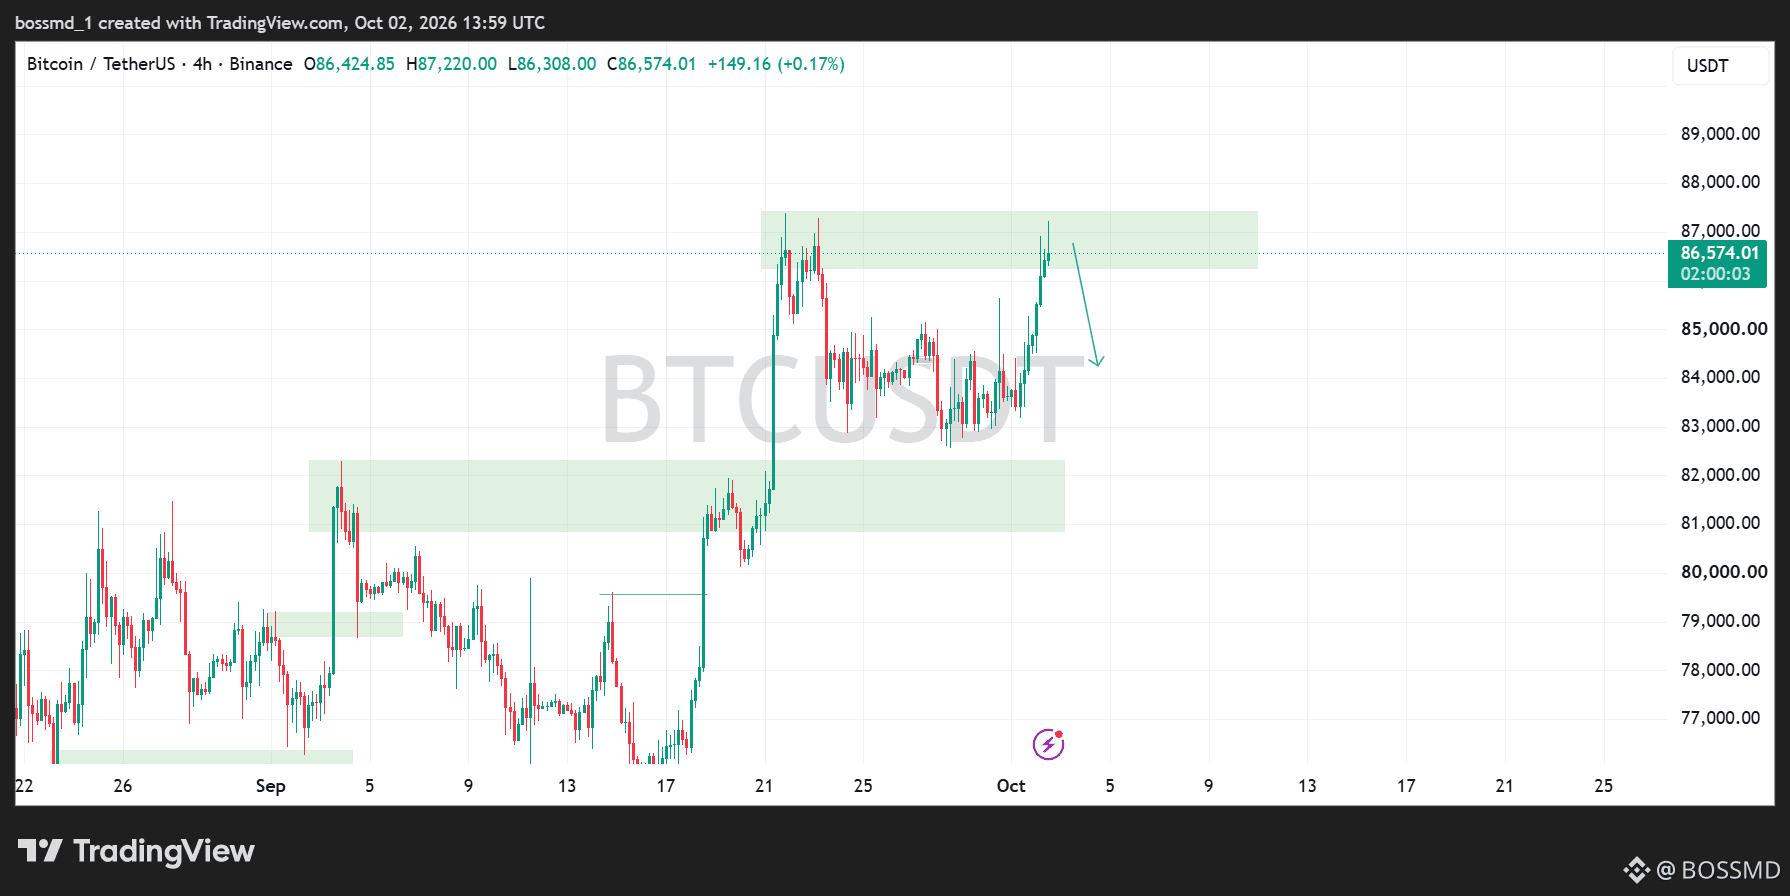
#bitcoin is approaching a major resistance zone again, and the next reaction could set the tone for the short-term trend.
$BTC is trading around $86,574, pushing back toward the $87,000–$87,500 resistance area after a strong recovery from the $83,000 region.
The chart suggests a possible rejection from this zone, with a pullback toward $84,000 before buyers attempt another move higher. The former breakout area around $81,000–$82,000 remains an important support zone if selling pressure increases.
The key is whether BTC can turn this resistance into support or needs another retest before its next move.
#bitcoin is approaching a major resistance zone again, and the next reaction could set the tone for the short-term trend.
$BTC is trading around $86,574, pushing back toward the $87,000–$87,500 resistance area after a strong recovery from the $83,000 region.
The chart suggests a possible rejection from this zone, with a pullback toward $84,000 before buyers attempt another move higher. The former breakout area around $81,000–$82,000 remains an important support zone if selling pressure increases.
The key is whether BTC can turn this resistance into support or needs another retest before its next move.
$BTC is trading around $86,574, pushing back toward the $87,000–$87,500 resistance area after a strong recovery from the $83,000 region.
The chart suggests a possible rejection from this zone, with a pullback toward $84,000 before buyers attempt another move higher. The former breakout area around $81,000–$82,000 remains an important support zone if selling pressure increases.
The key is whether BTC can turn this resistance into support or needs another retest before its next move.
1
2
3k
·
--
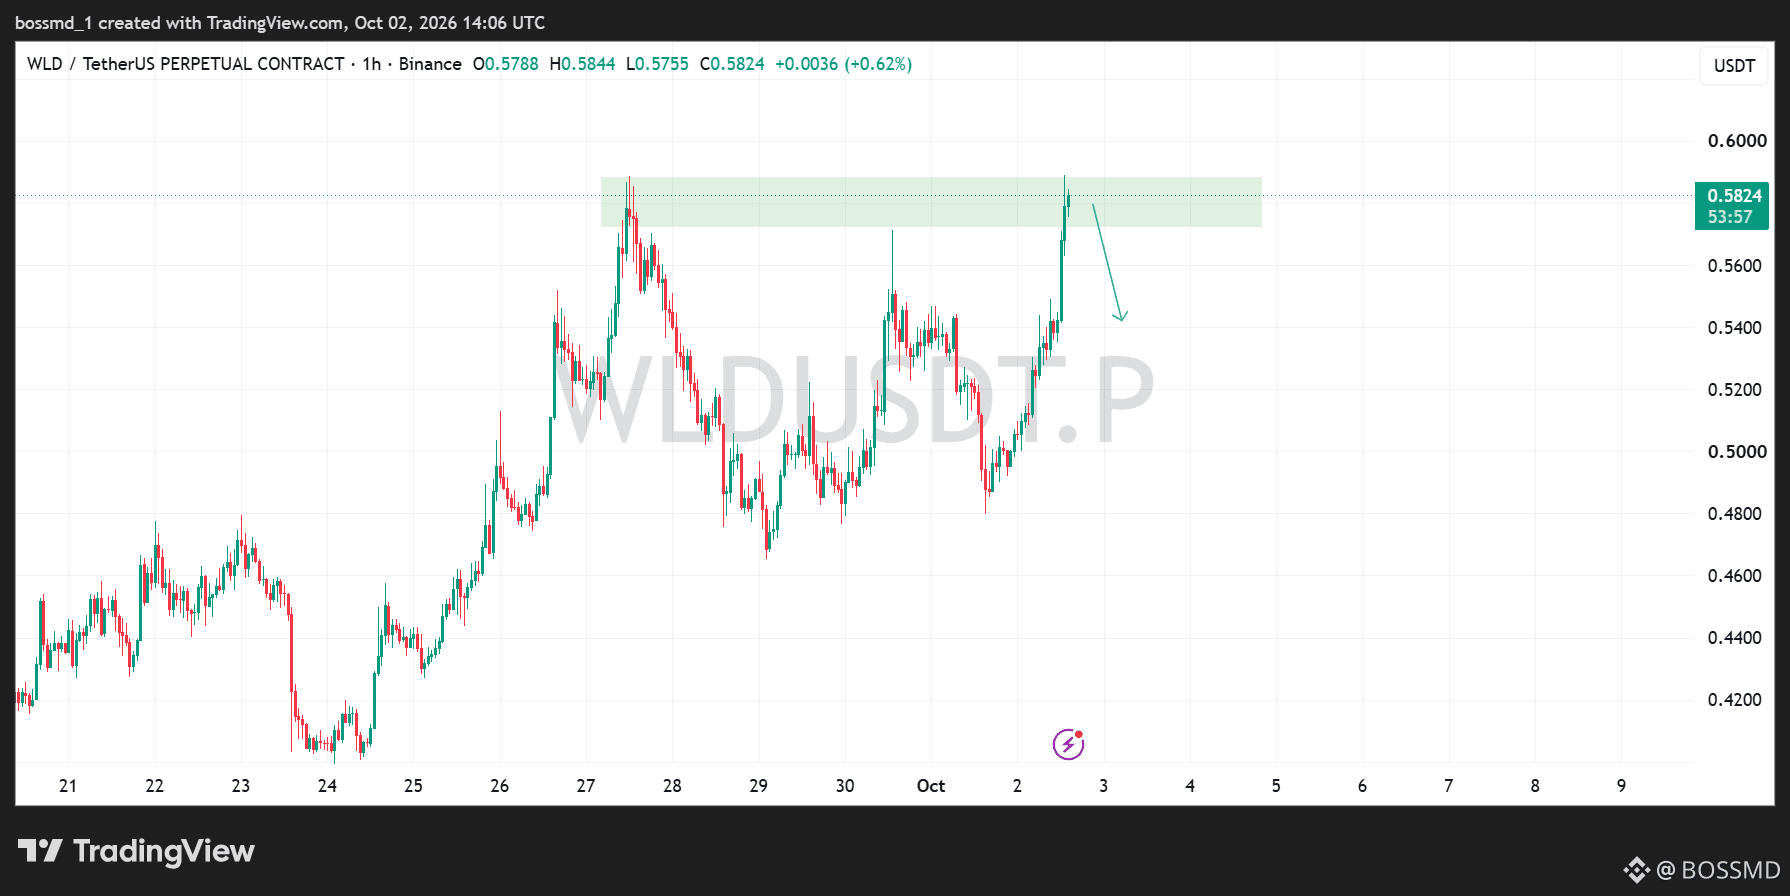
$WLD is approaching a key area on the 1H chart 👀
Price is currently around $0.582, pushing back into the resistance/supply zone around $0.57–$0.59. This is an important area because price previously reacted from here, so I’m watching how the market responds rather than chasing the move.
If #WLD gets rejected from this zone, the chart suggests a possible pullback toward the $0.54 area, where price could look for support before making another move.
$WLD is approaching a key area on the 1H chart 👀
Price is currently around $0.582, pushing back into the resistance/supply zone around $0.57–$0.59. This is an important area because price previously reacted from here, so I’m watching how the market responds rather than chasing the move.
If #WLD gets rejected from this zone, the chart suggests a possible pullback toward the $0.54 area, where price could look for support before making another move.
Price is currently around $0.582, pushing back into the resistance/supply zone around $0.57–$0.59. This is an important area because price previously reacted from here, so I’m watching how the market responds rather than chasing the move.
If #WLD gets rejected from this zone, the chart suggests a possible pullback toward the $0.54 area, where price could look for support before making another move.
4
29
41k
·
--
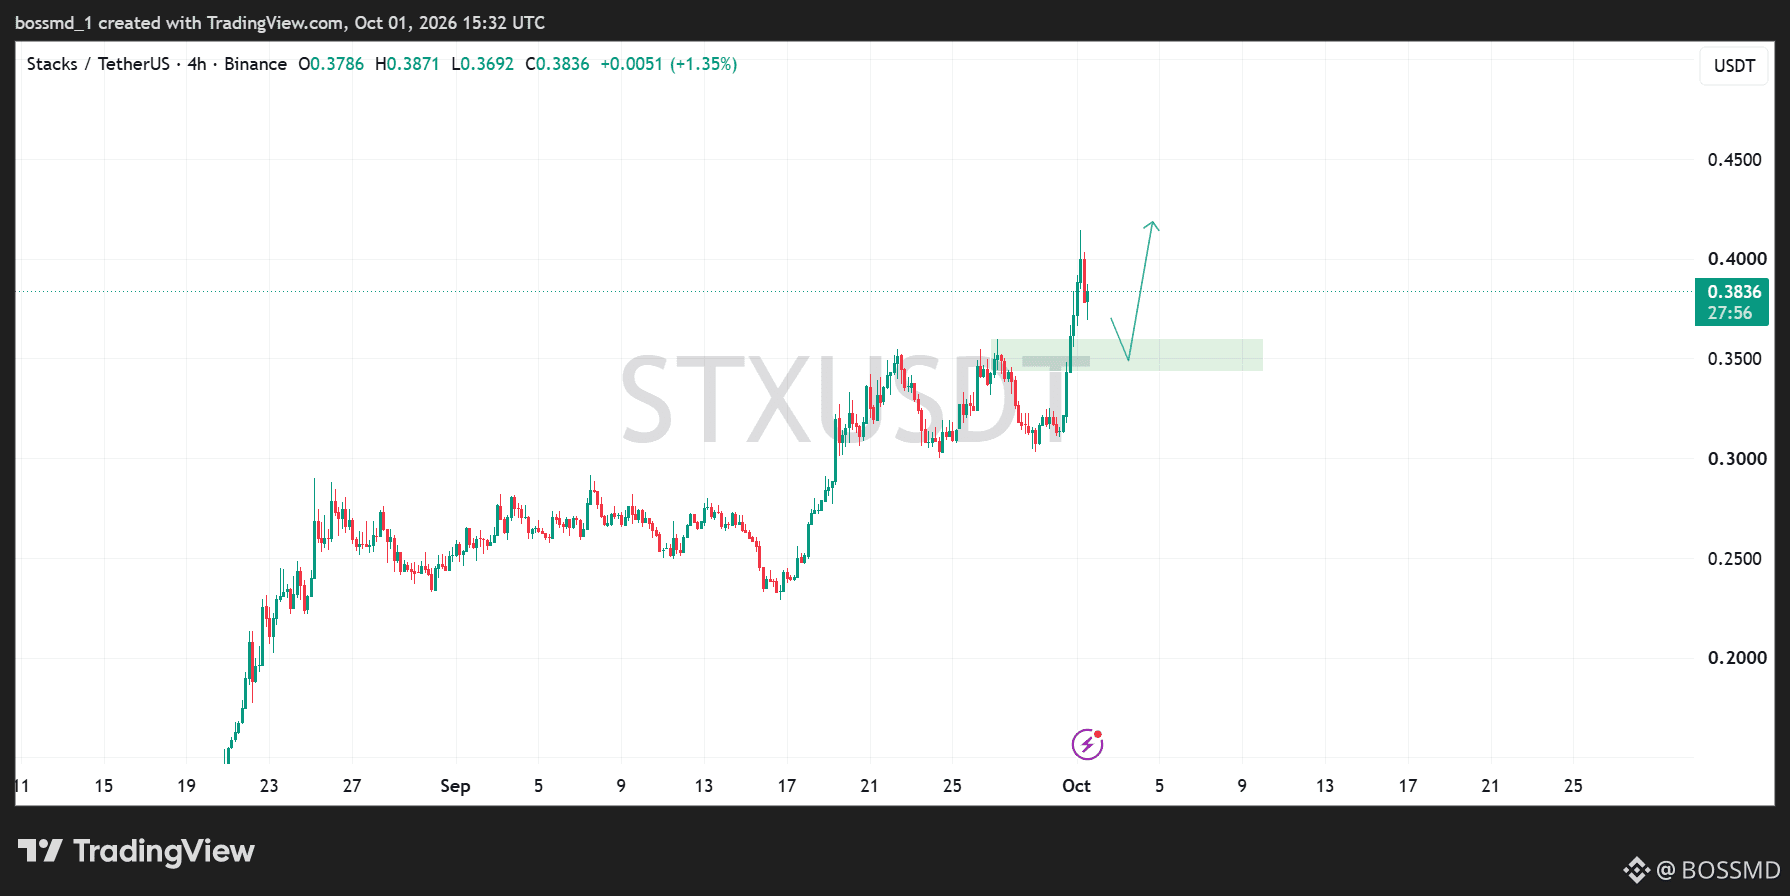
$STX is showing a strong breakout structure on the 4H chart.
Price is currently around $0.38 after breaking above the previous consolidation range. I’m watching the $0.34–$0.36 zone as the key area now.
If #STX pulls back into this zone and buyers defend it, the chart suggests a possible continuation toward $0.40–$0.42.
The main thing to watch now is whether the breakout holds as support.
No need to chase the move let the retest confirm the strength.
$STX is showing a strong breakout structure on the 4H chart.
Price is currently around $0.38 after breaking above the previous consolidation range. I’m watching the $0.34–$0.36 zone as the key area now.
If #STX pulls back into this zone and buyers defend it, the chart suggests a possible continuation toward $0.40–$0.42.
The main thing to watch now is whether the breakout holds as support.
No need to chase the move let the retest confirm the strength.
Price is currently around $0.38 after breaking above the previous consolidation range. I’m watching the $0.34–$0.36 zone as the key area now.
If #STX pulls back into this zone and buyers defend it, the chart suggests a possible continuation toward $0.40–$0.42.
The main thing to watch now is whether the breakout holds as support.
No need to chase the move let the retest confirm the strength.
3
5
2k
·
--
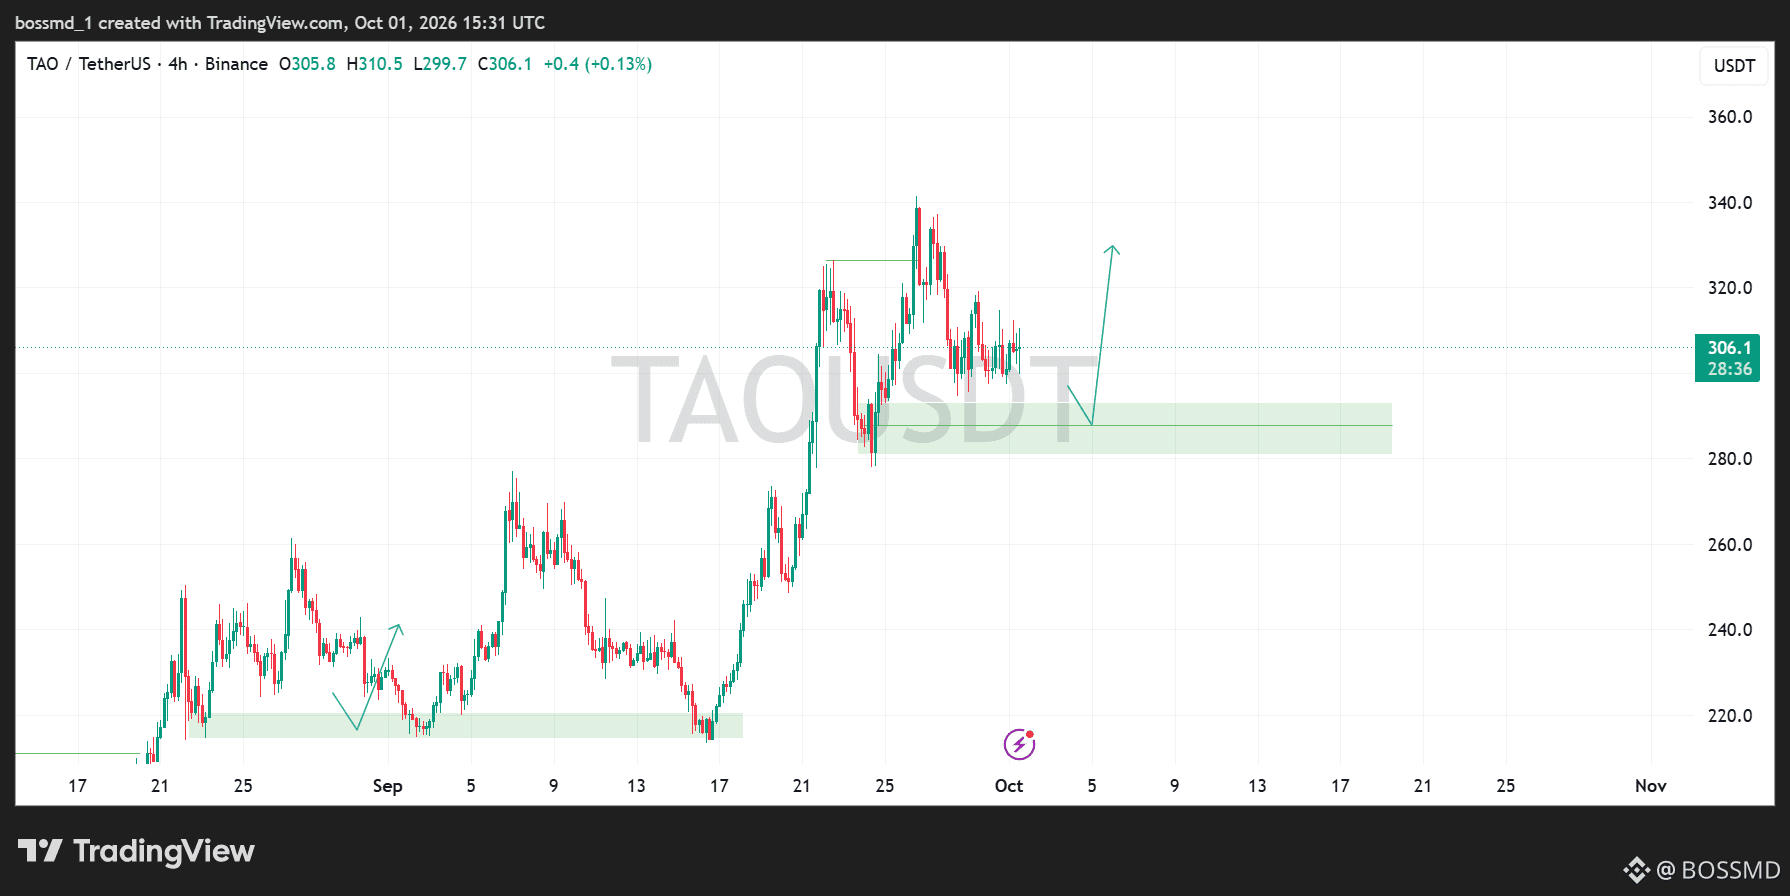
$TAO is consolidating after a strong move higher.
On the 4H chart, price is currently around $306, with the $280–$290 zone standing out as the key support area. A pullback into this zone could be important if buyers step in and defend it.
If support holds, the chart shows room for another move toward $320–$340.
I’m watching the reaction around $280–$290 closely. #defi
$TAO is consolidating after a strong move higher.
On the 4H chart, price is currently around $306, with the $280–$290 zone standing out as the key support area. A pullback into this zone could be important if buyers step in and defend it.
If support holds, the chart shows room for another move toward $320–$340.
I’m watching the reaction around $280–$290 closely. #defi
On the 4H chart, price is currently around $306, with the $280–$290 zone standing out as the key support area. A pullback into this zone could be important if buyers step in and defend it.
If support holds, the chart shows room for another move toward $320–$340.
I’m watching the reaction around $280–$290 closely. #defi
2
5
2.6k
තවත් අන්තර්ගතයන් ගවේෂණය කිරීමට ඇතුල් වන්න
Binance චතුරශ්රය හි ගෝලීය ක්රිප්ටෝ පරිශීලකයින් හා එක්වන්න
⚡️ ක්රිප්ටෝ පිළිබඳ නවතම සහ ප්රයෝජනවත් තොරතුරු ලබා ගන්න.
💬 ලොව විශාලතම ක්රිප්ටෝ හුවමාරුව මගින් විශ්වාස කෙරේ.
👍 සත්යායනය කරන ලද නිර්මාණකරුවන්ගෙන් සැබෑ විදසුන් සොයා ගන්න.
විද්යුත් තැපෑල / දුරකථන අංකය
නැගී එන මාතෘකා
BinanceLaunchesBinanceIntelligence
769,271 views
4,793 සාකච්ඡා කරමින්
🚨 BINANCE FAIT ENTRER L’IA PLUS PROFONDÉMENT DANS LA CRYPTO.
Binance a lancé Binance Intelligence — une nouvelle couche basée sur l’IA, conçue autour de la recherche de marché, des processus de trading et des données crypto.
Le plus intéressant ?
Ce n’est pas qu’un seul outil.
🧠 Binance AI → analyses personnalisées du marché, alertes et informations sur le portefeuille
⚡ Binance AI Pro → transforme des idées formulées en langage naturel en processus de trading
🤖 Agent OS → connecte les agents d’IA aux capacités du marché, des portefeuilles et de la blockchain
C’est un grand changement.
Les plateformes crypto ne se contentent plus de fournir aux traders des graphiques et des données.
Elles commencent à leur proposer des systèmes d’IA capables d’interpréter ces données.
La vraie question, c’est :
L’IA deviendra-t-elle aussi courante chez les traders que les indicateurs et les graphiques aujourd’hui ? 👀
$BTC
$GRIFFAIN
$NMR
#BinanceLaunchesBinanceIntelligence
Jacob trade
·0 කැමත්ත දැක්වීම්
·89 views
BTCFallsBelow$84K
37,317 views
128 සාකච්ඡා කරමින්
DubaiVARAIssuesReserveAssetAuditCircular
12,752 views
444 සාකච්ඡා කරමින්