

Aisha nooruddin
235 පෝස්ටු

Aisha nooruddin
වාර්තා කරන්න
පරිශීලක අවහිර කරන්න
Pro Crypto Analyst | Technical Analysis, Decision Zones & Market Setups | Empowering Traders with Data-Driven Alpha
විවෘත වෙළෙඳාම
නිතර වෙළෙන්දා
{වේලාව} මාස
42 හඹා යමින්
26 හඹා යන්නන්
186 කැමති විය
පෝස්ටු
ආයෝජන කළඹ
The $LLYB
{spot}(LLYBUSDT)
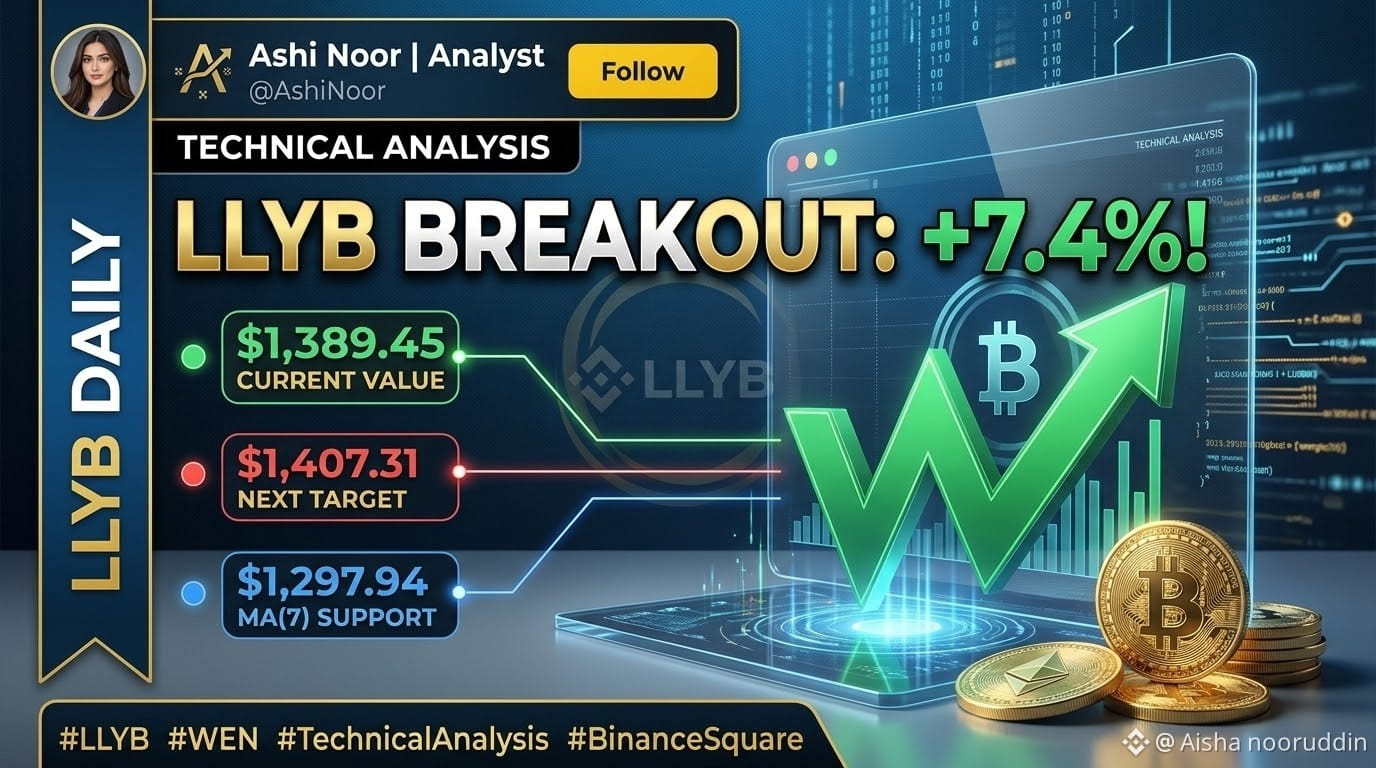
/USDT pair (Eli Lilly tokenized stock) on Binance is surging, climbing +7.42% to trade at $1,389.45 following strong daily momentum and heavy buying support!
📊 Key Technical Levels:
* Current Price: $1,389.45 (24h High: $1,407.31 | 24h Low: $1,279.63)
* Immediate Resistance / Breakout Target: $1,407.31
* Short-Term Support (MA7): $1,297.94
* Major Cycle Low / Support Floor: $1,133.43
💡 Trade Scenarios:
* Bullish Continuation: A high-volume daily close above the $1,407.31 high opens a clean technical path toward extended price discovery.
* Pullback / Re-test: If price faces short-term rejection near current highs, watch for a healthy correction to re-test the $1,300 – $1,297 (MA7) support zone.
⚠️ Manage your risk tightly and trade safely!
👇 Community Discussion:
Are you holding $LLYB for a push past $1,400, or waiting for a dip to accumulate? Let me know below! 👇
📌 Follow @Ashi Noor | Analyst for daily high-impact crypto and tokenized asset insights!
#Write2Earn #BinanceSquare #LLYB #EliLilly #TokenizedStocks #TechnicalAnalysis $[LLYB]
The $LLYB
/USDT pair (Eli Lilly tokenized stock) on Binance is surging, climbing +7.42% to trade at $1,389.45 following strong daily momentum and heavy buying support!
📊 Key Technical Levels:
* Current Price: $1,389.45 (24h High: $1,407.31 | 24h Low: $1,279.63)
* Immediate Resistance / Breakout Target: $1,407.31
* Short-Term Support (MA7): $1,297.94
* Major Cycle Low / Support Floor: $1,133.43
💡 Trade Scenarios:
* Bullish Continuation: A high-volume daily close above the $1,407.31 high opens a clean technical path toward extended price discovery.
* Pullback / Re-test: If price faces short-term rejection near current highs, watch for a healthy correction to re-test the $1,300 – $1,297 (MA7) support zone.
⚠️ Manage your risk tightly and trade safely!
👇 Community Discussion:
Are you holding $LLYB for a push past $1,400, or waiting for a dip to accumulate? Let me know below! 👇
📌 Follow @Ashi Noor | Analyst for daily high-impact crypto and tokenized asset insights!
#Write2Earn #BinanceSquare #LLYB #EliLilly #TokenizedStocks #TechnicalAnalysis $[LLYB]
3
·
--
උසබ තත්ත්වය
$HYPE
{spot}(HYPEUSDT)
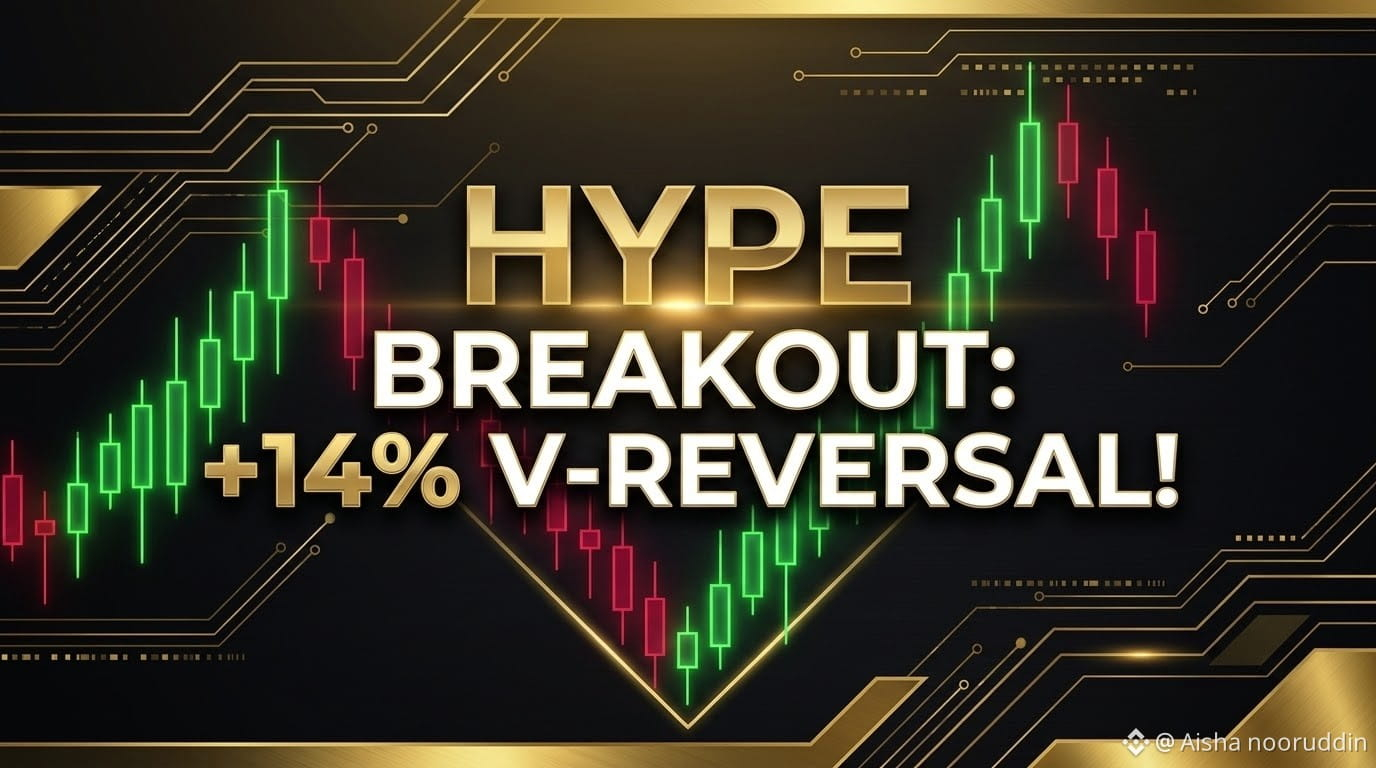
Pumps +14%! V-Reversal Testing Major Resistance! 🔥📈
$HYPE /USDT has executed a massive vertical rebound on strong volume, surging +14.21% to $91.21 after finding a strong bottom near $74.45.
📊 Key Technical Levels:
* Current Price: $91.21 (24h High: $92.15 | 24h Low: $78.19)
* Immediate Resistance Target: $95.25 (Recent Swing High)
* Key Dynamic Support (MA25): $82.31
* Short-Term Baseline (MA7): $80.26
* Major Support Floor: $74.45
💡 Trade Scenarios:
* Bullish Continuation: A daily close above $92.15 opens a clear path to retest the $95.25 peak and aim for higher resistance levels.
* Pullback/Correction: If price gets rejected near $92–$95, watch for a healthy pullback toward the $82.31 (MA25) support zone.
⚠️ Volatility is high during V-reversals — practice proper risk management!
👇 Community Discussion:
Are you holding $HYPE for a break past $95, or taking profits here? Drop your strategy below! 👇
📌 Follow @Ashi Noor | Analyst for daily high-probability technical setups!
#Write2Earn #BinanceSquare #HYPE #Hyperliquid #DeFi #TechnicalAnalysis $[HYPE]
$HYPE
Pumps +14%! V-Reversal Testing Major Resistance! 🔥📈
$HYPE /USDT has executed a massive vertical rebound on strong volume, surging +14.21% to $91.21 after finding a strong bottom near $74.45.
📊 Key Technical Levels:
* Current Price: $91.21 (24h High: $92.15 | 24h Low: $78.19)
* Immediate Resistance Target: $95.25 (Recent Swing High)
* Key Dynamic Support (MA25): $82.31
* Short-Term Baseline (MA7): $80.26
* Major Support Floor: $74.45
💡 Trade Scenarios:
* Bullish Continuation: A daily close above $92.15 opens a clear path to retest the $95.25 peak and aim for higher resistance levels.
* Pullback/Correction: If price gets rejected near $92–$95, watch for a healthy pullback toward the $82.31 (MA25) support zone.
⚠️ Volatility is high during V-reversals — practice proper risk management!
👇 Community Discussion:
Are you holding $HYPE for a break past $95, or taking profits here? Drop your strategy below! 👇
📌 Follow @Ashi Noor | Analyst for daily high-probability technical setups!
#Write2Earn #BinanceSquare #HYPE #Hyperliquid #DeFi #TechnicalAnalysis $[HYPE]
268
·
--
උසබ තත්ත්වය
$WENB
{spot}(WENBUSDT)
Pumps +15%! Breakout Continuation or Pullback Ahead?
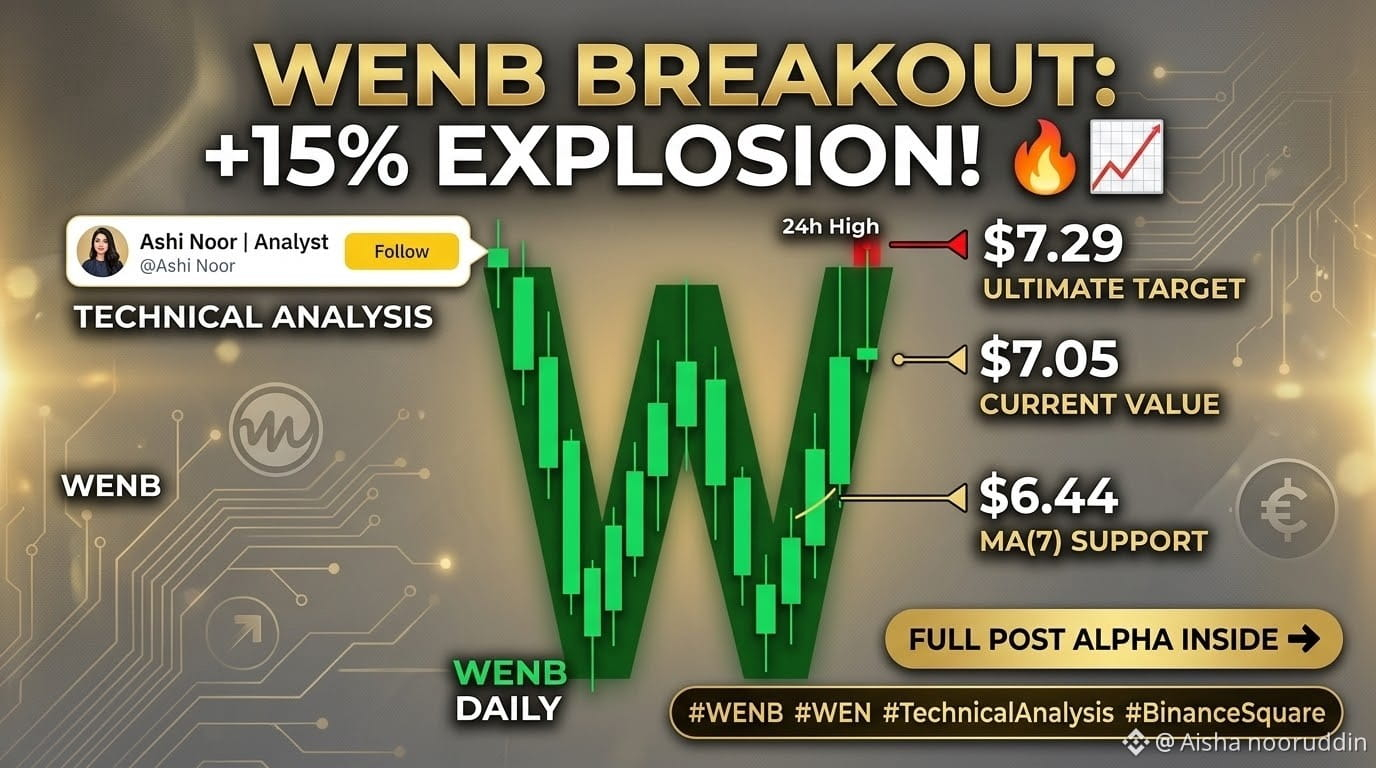
The $WENB /USDT pair surged +15.20% to $7.05, breaking above recent consolidation resistance on strong volume.
📊 Key Technical Levels:
* Current Price: $7.05 (24h High: $7.29 | 24h Low: $6.08)
* Immediate Support (MA7): $6.44
* Intermediate Support (MA25): $6.41
* Breakout Resistance: $7.29
💡 Trade Scenarios:
* Bullish Continuation: Defending the breakout zone opens a path toward retesting the $7.29 high and pushing higher.
* Pullback/Correction: A failure to hold short-term moving averages could trigger a retest of support near $6.41 - $6.44.
⚠️ High volatility asset — manage your risk tightly!
👇 Community Discussion:
Are you longing this breakout or waiting for a dip? Drop your thoughts below! 👇
📌 Follow @Ashi Noor | Analyst for daily technical insights!
#Write2Earn #BinanceSquare #WENB #WEN #TechnicalAnalysis $[WENB
$WENB
Pumps +15%! Breakout Continuation or Pullback Ahead?
The $WENB /USDT pair surged +15.20% to $7.05, breaking above recent consolidation resistance on strong volume.
📊 Key Technical Levels:
* Current Price: $7.05 (24h High: $7.29 | 24h Low: $6.08)
* Immediate Support (MA7): $6.44
* Intermediate Support (MA25): $6.41
* Breakout Resistance: $7.29
💡 Trade Scenarios:
* Bullish Continuation: Defending the breakout zone opens a path toward retesting the $7.29 high and pushing higher.
* Pullback/Correction: A failure to hold short-term moving averages could trigger a retest of support near $6.41 - $6.44.
⚠️ High volatility asset — manage your risk tightly!
👇 Community Discussion:
Are you longing this breakout or waiting for a dip? Drop your thoughts below! 👇
📌 Follow @Ashi Noor | Analyst for daily technical insights!
#Write2Earn #BinanceSquare #WENB #WEN #TechnicalAnalysis $[WENB
45
·
--
බෙයාරිෂ්
$MVLLB
{spot}(MVLLBUSDT)
Down -22%! Rebound at $23.12 or Further Crash?
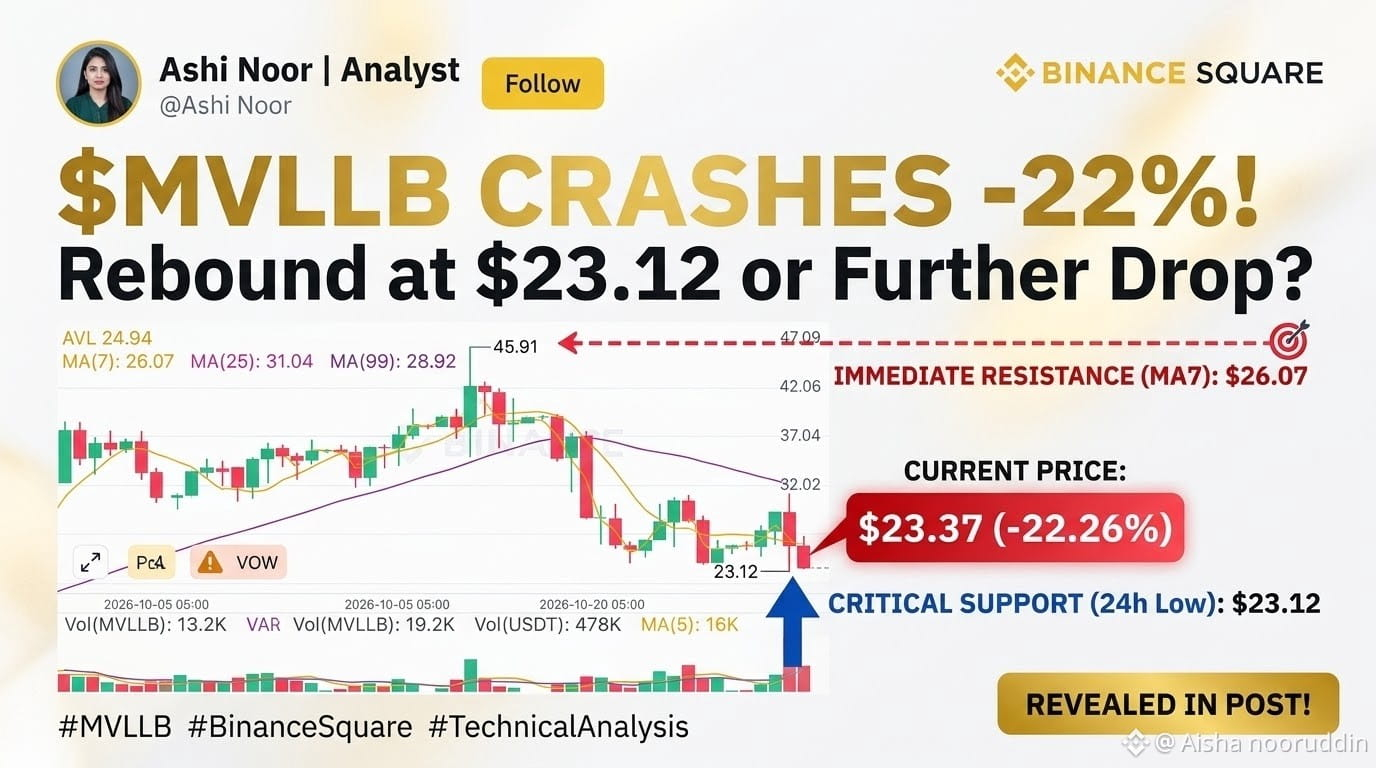
The $MVLLB /USDT daily chart printed a steep -22% red candle, rejecting hard from $31+ resistance down to $23.37 on massive volume.
📊 Key Technical Levels:
* Current Price: $23.37 (24h Low: $23.12 | 24h High: $31.41)
* Immediate Support Floor: $23.12 (Critical 24h Low)
* Overhead Resistance (MA7): $26.07
* Macro Baseline (MA99): $28.92
💡 Trade Scenarios:
* Bullish Relief Bounce: Holding the $23.12 support floor opens a path for a technical relief retest toward $26.07 (MA7).
* Bearish Breakdown: A close below $23.12 signals extended liquidation toward the $21.00 zone.
⚠️ Leveraged ETF asset — manage risk with strict stop-losses!
👇 Community Discussion:
Are you buying the dip near $23.12 or waiting for a deeper pull down? Comment below! 👇
📌 Follow @Ashi Noor | Analyst for daily high-impact technical updates!
#Write2Earn #BinanceSquare #MVLLB #MRVL #TechnicalAnalysis $[MVLLB]
$MVLLB
Down -22%! Rebound at $23.12 or Further Crash?
The $MVLLB /USDT daily chart printed a steep -22% red candle, rejecting hard from $31+ resistance down to $23.37 on massive volume.
📊 Key Technical Levels:
* Current Price: $23.37 (24h Low: $23.12 | 24h High: $31.41)
* Immediate Support Floor: $23.12 (Critical 24h Low)
* Overhead Resistance (MA7): $26.07
* Macro Baseline (MA99): $28.92
💡 Trade Scenarios:
* Bullish Relief Bounce: Holding the $23.12 support floor opens a path for a technical relief retest toward $26.07 (MA7).
* Bearish Breakdown: A close below $23.12 signals extended liquidation toward the $21.00 zone.
⚠️ Leveraged ETF asset — manage risk with strict stop-losses!
👇 Community Discussion:
Are you buying the dip near $23.12 or waiting for a deeper pull down? Comment below! 👇
📌 Follow @Ashi Noor | Analyst for daily high-impact technical updates!
#Write2Earn #BinanceSquare #MVLLB #MRVL #TechnicalAnalysis $[MVLLB]
108

ලිපිය
CanMicrosoftDeliverOnAI: Big Tech’s Multi-Billion Dollar Bet & Its Ripple Effects on Crypto Liquidit#CanMicrosoftDeliverOnAI 🤖 #
As trending topics hit Binance Square, the question #CanMicrosoftDeliverOnAI has taken center stage across tech and financial markets. Wall Street and crypto traders alike are scrutinizing whether Big Tech's massive CapEx spending on artificial intelligence infrastructure is translating into sustainable revenue.
Here is the breakdown of Microsoft’s AI engine, key market challenges, and why crypto traders should care.
📊 Potential for Innovation (The Bull Case):
* Enterprise Solutions & Azure Deployment:
Microsoft continues to lead enterprise software integration. Azure cloud performance remains a massive growth vector, with Copilot integration expanding rapidly across Microsoft 365, developer APIs, and business app suites.
* Ecosystem & Cloud Scaling:
By building multi-platform agent workflows, proprietary models, and gaming/cloud AI advancements, Microsoft is turning raw compute into tangible enterprise delivery engines.
⚠️ Challenges & Execution Risks (The Bear Case):
* Extreme Capital Expenditure (CapEx):
Microsoft's massive CapEx commitments (reaching $170B+ annually for advanced hardware and data centers) have raised concerns over squeezed margins if adoption lags.
* Hardware & Data Constraints:
Chip shortages, power limitations for data centers, data privacy/safety constraints, and market adoption hurdles present real operational bottlenecks.
💡 What This Means for Crypto & Market Liquidity:
Big Tech AI spending has become a major barometer for macro risk appetite:
* Risk-On Sentiment: Strong tech earnings and proven AI ROI drive global market confidence, boosting risk-on liquidity that spills directly into Bitcoin ($BTC) and altcoins.
* Macro Contagion: If Big Tech CapEx fails to show durable cash returns, tech equities face pullbacks. The resulting risk-off sentiment can trigger liquidity contractions across crypto markets.
👇 Community Discussion:
Is Microsoft leading the AI boom to new heights, or is tech CapEx expanding too fast? How are you positioning your portfolio ($BTC / AI Tokens)? Share your thoughts below! 👇
📌 Follow @Ashi Noor | Analyst for daily high-impact tech & crypto market breakdowns!
#Write2Earn #BinanceSquare #CanMicrosoftDeliverOnAI #Microsoft
{spot}(BTCUSDT)
#AI #CryptoTrading #TechNews $[BTC]
{spot}(SOLUSDT)
$[SOL]
CanMicrosoftDeliverOnAI: Big Tech’s Multi-Billion Dollar Bet & Its Ripple Effects on Crypto Liquidit
#CanMicrosoftDeliverOnAI 🤖 #
As trending topics hit Binance Square, the question #CanMicrosoftDeliverOnAI has taken center stage across tech and financial markets. Wall Street and crypto traders alike are scrutinizing whether Big Tech's massive CapEx spending on artificial intelligence infrastructure is translating into sustainable revenue.
Here is the breakdown of Microsoft’s AI engine, key market challenges, and why crypto traders should care.
📊 Potential for Innovation (The Bull Case):
* Enterprise Solutions & Azure Deployment:
Microsoft continues to lead enterprise software integration. Azure cloud performance remains a massive growth vector, with Copilot integration expanding rapidly across Microsoft 365, developer APIs, and business app suites.
* Ecosystem & Cloud Scaling:
By building multi-platform agent workflows, proprietary models, and gaming/cloud AI advancements, Microsoft is turning raw compute into tangible enterprise delivery engines.
⚠️ Challenges & Execution Risks (The Bear Case):
* Extreme Capital Expenditure (CapEx):
Microsoft's massive CapEx commitments (reaching $170B+ annually for advanced hardware and data centers) have raised concerns over squeezed margins if adoption lags.
* Hardware & Data Constraints:
Chip shortages, power limitations for data centers, data privacy/safety constraints, and market adoption hurdles present real operational bottlenecks.
💡 What This Means for Crypto & Market Liquidity:
Big Tech AI spending has become a major barometer for macro risk appetite:
* Risk-On Sentiment: Strong tech earnings and proven AI ROI drive global market confidence, boosting risk-on liquidity that spills directly into Bitcoin ($BTC) and altcoins.
* Macro Contagion: If Big Tech CapEx fails to show durable cash returns, tech equities face pullbacks. The resulting risk-off sentiment can trigger liquidity contractions across crypto markets.
👇 Community Discussion:
Is Microsoft leading the AI boom to new heights, or is tech CapEx expanding too fast? How are you positioning your portfolio ($BTC / AI Tokens)? Share your thoughts below! 👇
📌 Follow @Ashi Noor | Analyst for daily high-impact tech & crypto market breakdowns!
#Write2Earn #BinanceSquare #CanMicrosoftDeliverOnAI #Microsoft
#AI #CryptoTrading #TechNews $[BTC]
$[SOL]
73
ලිපිය
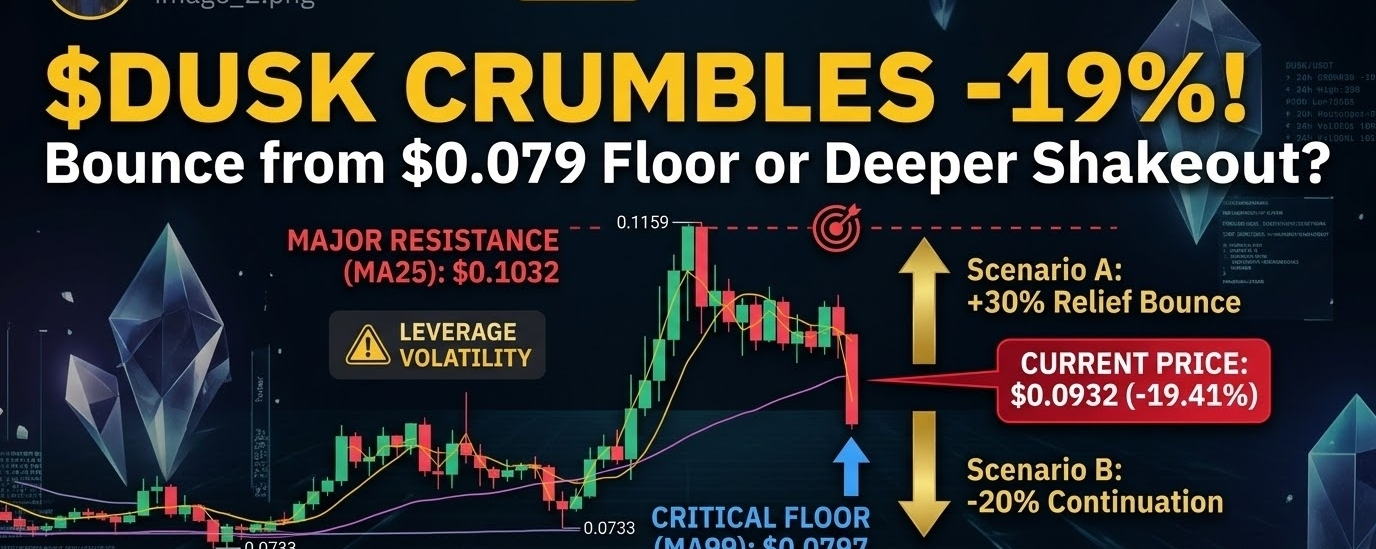
The DUSK/USDT has executed a rapid and dramatic rejection from local highs. After failing to breach psychological resistance near $0.116 (24h High: $0.1159),$DUSK is currently crumbling, down -19.41% at $0.0932.
📊 Technical Analysis & Indicator Deep Dive:
* Vertical Red Candle & Local Floor Breakdown: $DUSK painted a vertical bearish engulfing candle on significant volume, cleanly breaking through immediate horizontal support structures.
* Moving Average Positioning: The breakdown is now testing major dynamic levels. Note the steep divergence of the Moving Averages following the initial pump to $0.1331.
* Critical Floor (MA99): Price action is directly challenging the long-term 99-day Moving Average (purple line), currently sitting at $0.0797. This is the absolute dynamic baseline of broader structural value.
* Overhead Hurdle (MA25): The immediate intermediate-term moving average resistance is higher at $0.1032.
* 短期 (MA7): Trending much higher at $0.1099.
* Volume Analysis (Over Accumulation): The crash is occurring on localized volume expansion, invalidating the previous localized accumulation volume cluster from early October.
💡 Trade Setup & Key Scenarios:
* Bearish Continuation Scenario: If the daily candle closing body confirms a definitive break below the horizontal support cluster at $0.096 and the dynamic MA99 support floor at $0.0797, expect the dump to accelerate. The macro target for continuation downside is a full retest of the ultimate cycle low around $0.0733 (see July/August floor).
* Bullish Relief Scenario (Scenario B): Look for an accumulation bounce only if bulls decisively defend the MA99 baseline near $0.079. A reclaim of $0.103 (MA25) and a successful back-test as support flips short-term momentum to bullish relief toward a retest of $0.116.
⚠️ Risk Warning: Leverage is extremely high. Volatility is severe. Use sound risk management and avoid chasing vertical moves in either direction.
👇 Community Discussion:
Are you using this -19% crash to accumulate $DUSK near the MA99 dynamic floor, or do you expect a deeper shakeout toward $0.073? Share your trade plans and targets below! 👇
📌 Follow @Ashi Noor | Analyst for daily high-impact technical alpha and alpha setups!
#Write2Earn #BinanceSquare #DUSK #TechnicalAnalysis #CryptoTrading
{spot}(DUSKUSDT)
The DUSK/USDT has executed a rapid and dramatic rejection from local highs.
After failing to breach psychological resistance near $0.116 (24h High: $0.1159),$DUSK is currently crumbling, down -19.41% at $0.0932.
📊 Technical Analysis & Indicator Deep Dive:
* Vertical Red Candle & Local Floor Breakdown: $DUSK painted a vertical bearish engulfing candle on significant volume, cleanly breaking through immediate horizontal support structures.
* Moving Average Positioning: The breakdown is now testing major dynamic levels. Note the steep divergence of the Moving Averages following the initial pump to $0.1331.
* Critical Floor (MA99): Price action is directly challenging the long-term 99-day Moving Average (purple line), currently sitting at $0.0797. This is the absolute dynamic baseline of broader structural value.
* Overhead Hurdle (MA25): The immediate intermediate-term moving average resistance is higher at $0.1032.
* 短期 (MA7): Trending much higher at $0.1099.
* Volume Analysis (Over Accumulation): The crash is occurring on localized volume expansion, invalidating the previous localized accumulation volume cluster from early October.
💡 Trade Setup & Key Scenarios:
* Bearish Continuation Scenario: If the daily candle closing body confirms a definitive break below the horizontal support cluster at $0.096 and the dynamic MA99 support floor at $0.0797, expect the dump to accelerate. The macro target for continuation downside is a full retest of the ultimate cycle low around $0.0733 (see July/August floor).
* Bullish Relief Scenario (Scenario B): Look for an accumulation bounce only if bulls decisively defend the MA99 baseline near $0.079. A reclaim of $0.103 (MA25) and a successful back-test as support flips short-term momentum to bullish relief toward a retest of $0.116.
⚠️ Risk Warning: Leverage is extremely high. Volatility is severe. Use sound risk management and avoid chasing vertical moves in either direction.
👇 Community Discussion:
Are you using this -19% crash to accumulate $DUSK near the MA99 dynamic floor, or do you expect a deeper shakeout toward $0.073? Share your trade plans and targets below! 👇
📌 Follow @Ashi Noor | Analyst for daily high-impact technical alpha and alpha setups!
#Write2Earn #BinanceSquare #DUSK #TechnicalAnalysis #CryptoTrading
139
✨Bismillah-ir-Rahman-ir-Rahim (In the name of Allah, the Most Gracious, the Most Merciful)✨
🌅 Bitcoin Morning Watch: $BTC Testing Key $79.8K Level! Holding Demand or Further Dip? 📊
✨Good morning, Binance Square family! Starting the day with faith and clear focus, let’s dive into today’s morning technical breakdown for Bitcoin (BTC/USDT).
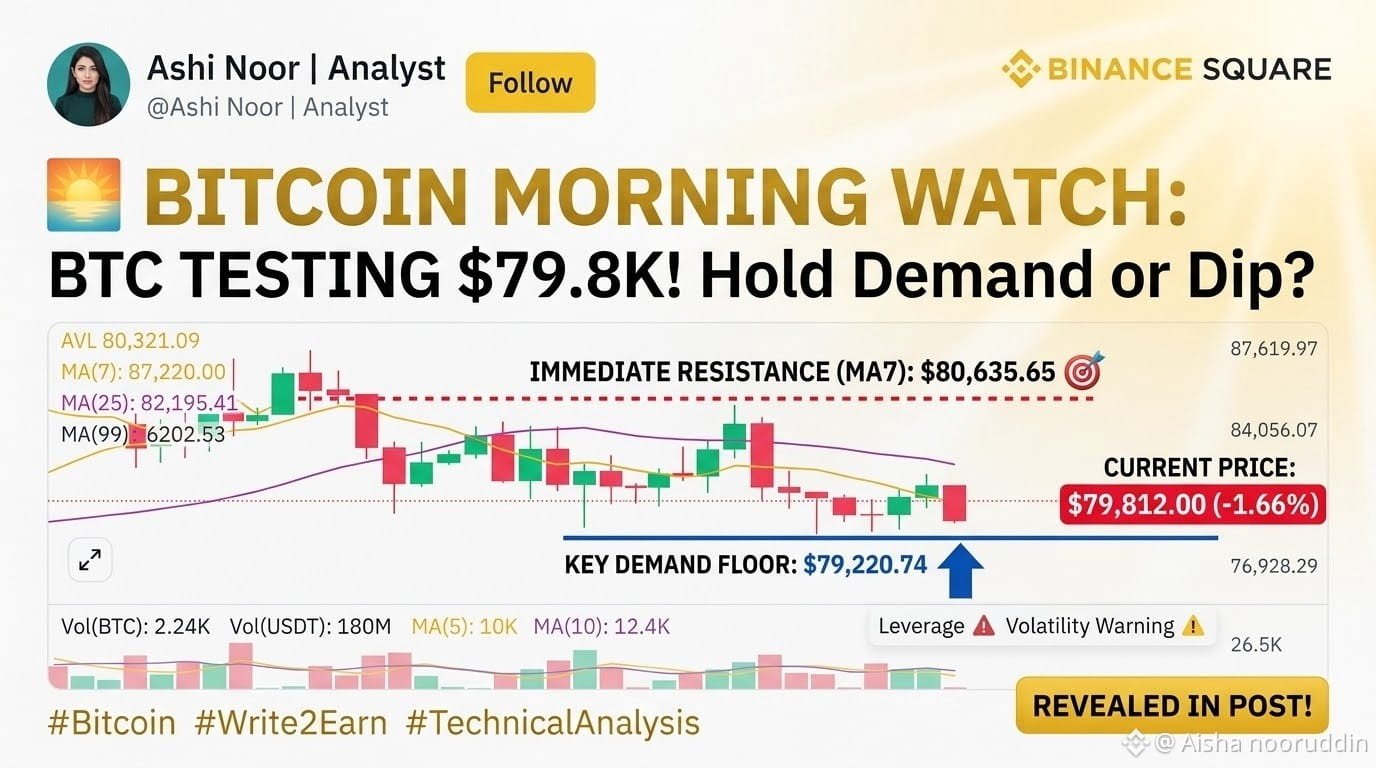
$BTC is currently trading at $79,812.00, down -1.66% over the last 24 hours as sellers push price action back below the psychological $80,000 threshold. After reaching an intraday high of $81,823.00, Bitcoin has retraced close to its local support floor at $79,220.74.
📊 Technical Analysis & Core Indicators:
* Price Action & 24h Range: BTC printed a 24-hour high of $81,823.00 before sliding down to a daily low of $79,710.00. Volume remains high with 13,621.64 BTC ($1.10B USDT) traded over the past 24 hours.
* Moving Average Structure:
* MA(7): Positioned at $80,635.65, acting as immediate overhead dynamic resistance on the daily chart.
* MA(25): Sits higher at $82,195.41, forming a major obstacle that bulls must clear to trigger a trend reversal.
* MA(99): Trending deeply below at $75,202.53, marking the long-term structural baseline.
💡 Trade Setup & Key Scenarios:
* Bullish Reclaim Scenario (Relief Bounce):
If bulls defend the immediate $79,220 – $79,710 demand zone, watch for a push back toward $80,635 (MA7). A daily close above $80.6K is necessary to signal short-term stabilization toward $82,195 (MA25).
* Bearish Breakdown Scenario (Support Test):
If the local demand floor at $79,220.74 fails to hold under selling pressure, expect an extended pullback toward secondary liquidity pockets around $76,928 and the macro MA(99) baseline at $75.2K.
👇 Community Discussion:
Is $BTC getting ready to bounce from the $79.2K demand floor, or are we sweeping lower before the weekend? Drop your trade setups below! 👇
📌 Follow @Ashi Noor | Analyst for daily high-impact market analysis and alpha setups!
#Write2Earn #BinanceSquare #Bitcoin #BTC #TechnicalAnalysis
{spot}(BTCUSDT)
✨Bismillah-ir-Rahman-ir-Rahim (In the name of Allah, the Most Gracious, the Most Merciful)✨
🌅 Bitcoin Morning Watch: $BTC Testing Key $79.8K Level! Holding Demand or Further Dip? 📊
✨Good morning, Binance Square family! Starting the day with faith and clear focus, let’s dive into today’s morning technical breakdown for Bitcoin (BTC/USDT).
$BTC is currently trading at $79,812.00, down -1.66% over the last 24 hours as sellers push price action back below the psychological $80,000 threshold. After reaching an intraday high of $81,823.00, Bitcoin has retraced close to its local support floor at $79,220.74.
📊 Technical Analysis & Core Indicators:
* Price Action & 24h Range: BTC printed a 24-hour high of $81,823.00 before sliding down to a daily low of $79,710.00. Volume remains high with 13,621.64 BTC ($1.10B USDT) traded over the past 24 hours.
* Moving Average Structure:
* MA(7): Positioned at $80,635.65, acting as immediate overhead dynamic resistance on the daily chart.
* MA(25): Sits higher at $82,195.41, forming a major obstacle that bulls must clear to trigger a trend reversal.
* MA(99): Trending deeply below at $75,202.53, marking the long-term structural baseline.
💡 Trade Setup & Key Scenarios:
* Bullish Reclaim Scenario (Relief Bounce):
If bulls defend the immediate $79,220 – $79,710 demand zone, watch for a push back toward $80,635 (MA7). A daily close above $80.6K is necessary to signal short-term stabilization toward $82,195 (MA25).
* Bearish Breakdown Scenario (Support Test):
If the local demand floor at $79,220.74 fails to hold under selling pressure, expect an extended pullback toward secondary liquidity pockets around $76,928 and the macro MA(99) baseline at $75.2K.
👇 Community Discussion:
Is $BTC getting ready to bounce from the $79.2K demand floor, or are we sweeping lower before the weekend? Drop your trade setups below! 👇
📌 Follow @Ashi Noor | Analyst for daily high-impact market analysis and alpha setups!
#Write2Earn #BinanceSquare #Bitcoin #BTC #TechnicalAnalysis
47
The $SOL
{spot}(SOLUSDT)
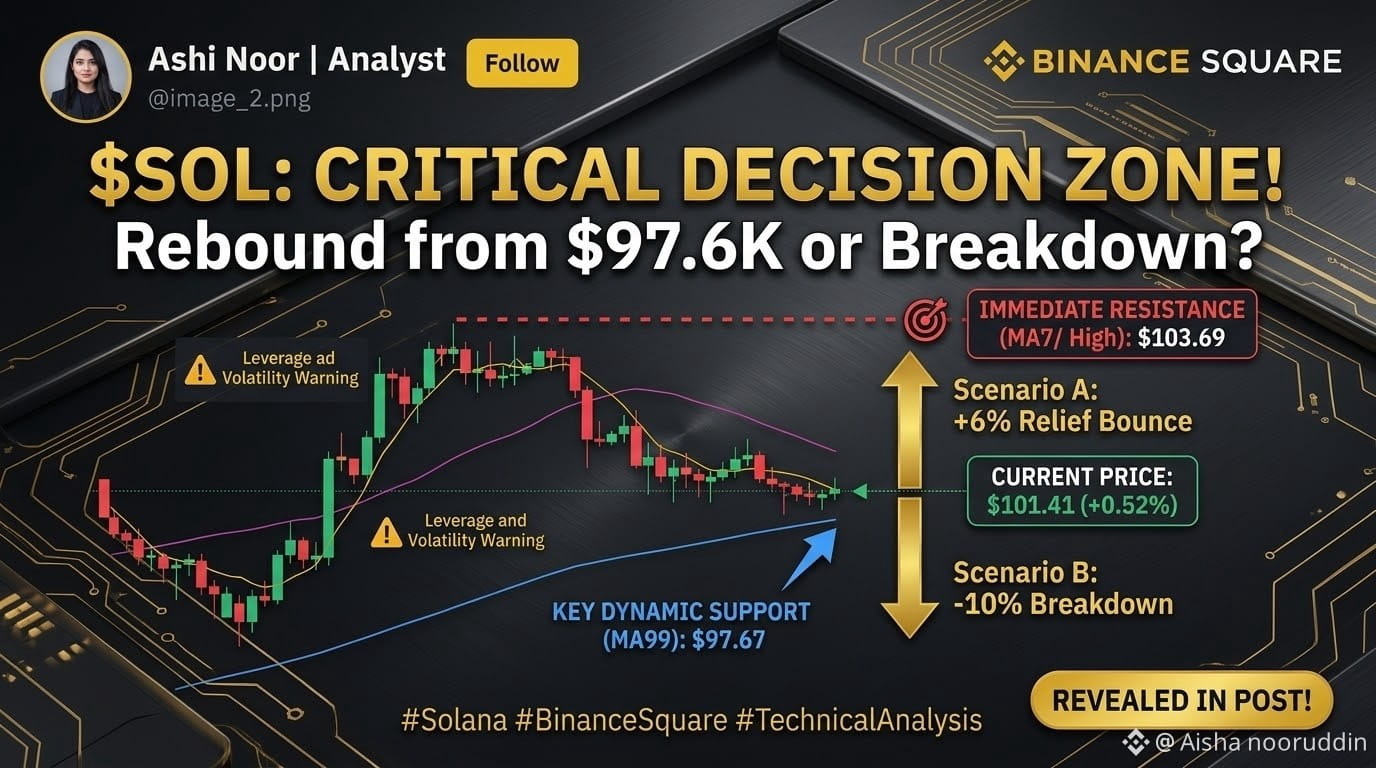
/USDT is the technical battleground today, currently trading at $101.41 (+0.52%) as price action consolidates just above crucial macro support. Solana is compressed between dynamic moving average clusters, setting up a major breakout or breakdown opportunity. Are we looking at a relief bounce or further downside?
📊 Technical Analysis & Core Indicators:
* Consolidation Pattern: Following the swift correction from $125+, $SOL has entered a tight consolidation range between $98 and $104. Look at that immediate price floor holding at $98.62 on the chart.
* Moving Average Clusteter:
* Overhead Resistance (MA7 & High): Immediate selling pressure is found near the intraday high of $103.69 and the short-term 7-day Moving Average (yellow line).
* Dynamic Floor (MA99): broader structural support is sitting right below current price action at $97.67 (purple MA line). A daily close below this line invalidates the immediate recovery thesis.
💡 Trade Setup & Key Scenarios:
Here are the potential scenarios for the next few sessions:
* Scenario A: Bullish Relief Bounce (+6%): Look for an accumulation bounce from the MA99 support floor. A daily candle close above immediate high resistance at $103.69 confirms bullish recovery momentum toward immediate mid-range targets near $110+.
* Scenario B: Bearish Breakdown (-10%): Failure to regain the MA(7) near $102 could trigger heavy selling pressure. If $SOL prints a decisive daily close below the dynamic baseline support at $97.67, expect a breakdown acceleration toward deeper demand zones near $90 and $85.
👇 Community Discussion:
Is Solana leading the Layer 1 bounce back to $110, or are you waiting for a deep retest of $90 first? Drop your trades and profit targets below! 👇
📌 Follow @Ashi Noor | Analyst for daily high-impact technical alpha!
#Write2Earn #BinanceSquare #Solana #SOL #TecnicalAnalysis #Layer1 #CryptoTrading $[SOL]
The $SOL
/USDT is the technical battleground today, currently trading at $101.41 (+0.52%) as price action consolidates just above crucial macro support. Solana is compressed between dynamic moving average clusters, setting up a major breakout or breakdown opportunity. Are we looking at a relief bounce or further downside?
📊 Technical Analysis & Core Indicators:
* Consolidation Pattern: Following the swift correction from $125+, $SOL has entered a tight consolidation range between $98 and $104. Look at that immediate price floor holding at $98.62 on the chart.
* Moving Average Clusteter:
* Overhead Resistance (MA7 & High): Immediate selling pressure is found near the intraday high of $103.69 and the short-term 7-day Moving Average (yellow line).
* Dynamic Floor (MA99): broader structural support is sitting right below current price action at $97.67 (purple MA line). A daily close below this line invalidates the immediate recovery thesis.
💡 Trade Setup & Key Scenarios:
Here are the potential scenarios for the next few sessions:
* Scenario A: Bullish Relief Bounce (+6%): Look for an accumulation bounce from the MA99 support floor. A daily candle close above immediate high resistance at $103.69 confirms bullish recovery momentum toward immediate mid-range targets near $110+.
* Scenario B: Bearish Breakdown (-10%): Failure to regain the MA(7) near $102 could trigger heavy selling pressure. If $SOL prints a decisive daily close below the dynamic baseline support at $97.67, expect a breakdown acceleration toward deeper demand zones near $90 and $85.
👇 Community Discussion:
Is Solana leading the Layer 1 bounce back to $110, or are you waiting for a deep retest of $90 first? Drop your trades and profit targets below! 👇
📌 Follow @Ashi Noor | Analyst for daily high-impact technical alpha!
#Write2Earn #BinanceSquare #Solana #SOL #TecnicalAnalysis #Layer1 #CryptoTrading $[SOL]
67
·
--
උසබ තත්ත්වය
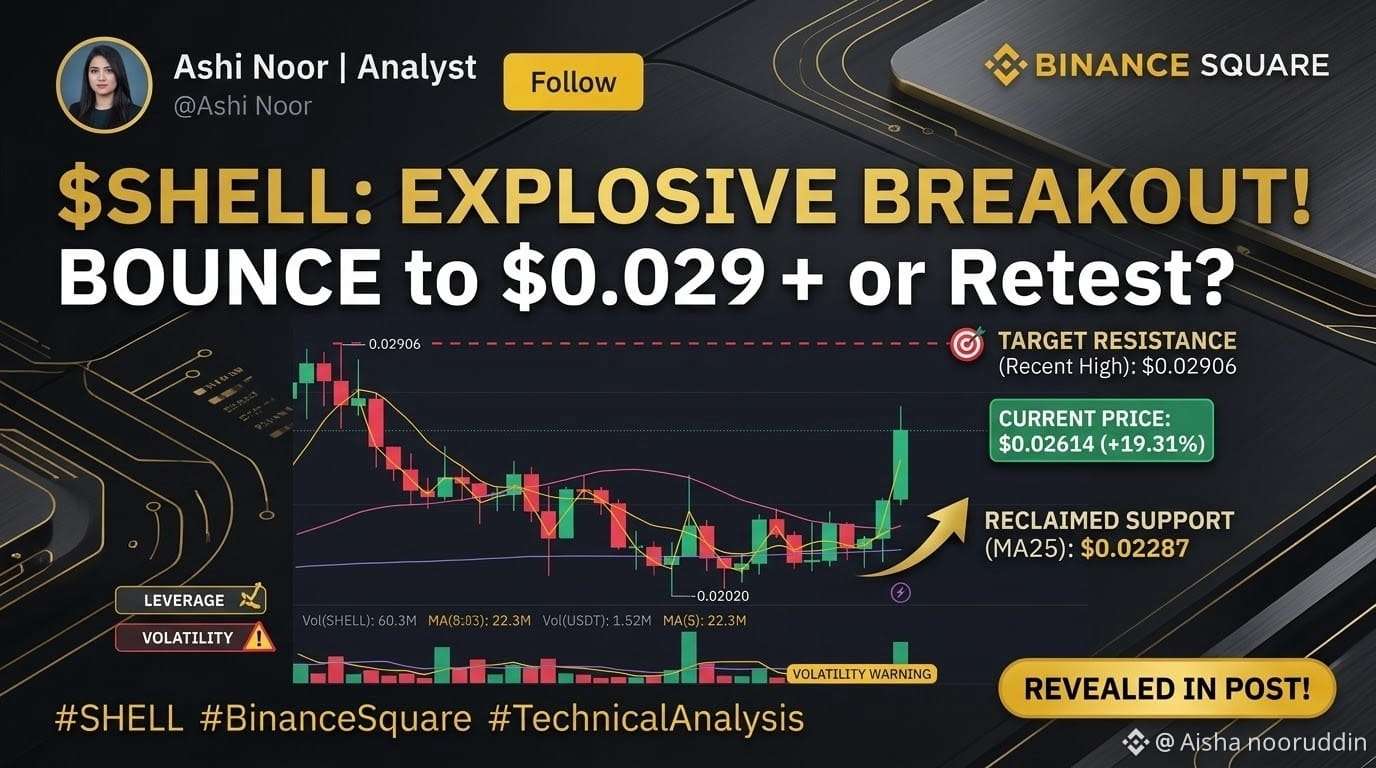
The $SHELL /USDT (MyShell) has ignited with a massive vertical gainer candle, executing an explosive trend reversal from local lows. Currently trading at $0.02614, $SHELL has locked in impressive 24-hour gains of +19.31%, leading the 'AI' category on the gainer board. Is a massive parabolic run beginning?
📊 Key Technical Levels to Watch:
* Current Price: $0.02614 (24h Low: $0.02155 | 24h High: $0.02694)
* Immediate Resistance Reclaimed (MA25): The massive vertical spike has aggressively cleared and closed above the immediate MA(25) resistance at $0.02287, which now flips into critical dynamic support.
* Macro Baseline (MA99): The long-term technical baseline sits just below at $0.02204, acting as a deeper support floor.
💡 Trade Setup & Scenarios:
* Bullish Scenario (Continuation): Securing daily closes above $0.026 confirms immediate bullish continuation momentum. Bulls are targeting a retest of the previous high at $0.02906 and a breakout toward $0.032+. The massive volume spike validates demand.
* Re-test Scenario (Shakeout): If the rally slows, look for a standard retest and successful validation of the newly reclaimed MA(25) at $0.02287 as support to form a higher local low.
⚠️ Volatility is extremely high as volume explodes. Manage risk, avoid high leverage, and use stop-losses.
👇 Community Discussion:
Are you chasing the breakout or waiting for a healthy retest of the MA(25) near $0.023? Share your trade plans and price targets below! 👇
📌 Follow @Ashi Noor | Analyst for daily high-impact technical updates!
#Write2Earn #BinanceSquare #SHELL #AI #TechnicalAnalysis #MyShell #CryptoTrading $[SHELL]
{spot}(SHELLUSDT)
The $SHELL /USDT (MyShell) has ignited with a massive vertical gainer candle, executing an explosive trend reversal from local lows. Currently trading at $0.02614, $SHELL has locked in impressive 24-hour gains of +19.31%, leading the 'AI' category on the gainer board. Is a massive parabolic run beginning?
📊 Key Technical Levels to Watch:
* Current Price: $0.02614 (24h Low: $0.02155 | 24h High: $0.02694)
* Immediate Resistance Reclaimed (MA25): The massive vertical spike has aggressively cleared and closed above the immediate MA(25) resistance at $0.02287, which now flips into critical dynamic support.
* Macro Baseline (MA99): The long-term technical baseline sits just below at $0.02204, acting as a deeper support floor.
💡 Trade Setup & Scenarios:
* Bullish Scenario (Continuation): Securing daily closes above $0.026 confirms immediate bullish continuation momentum. Bulls are targeting a retest of the previous high at $0.02906 and a breakout toward $0.032+. The massive volume spike validates demand.
* Re-test Scenario (Shakeout): If the rally slows, look for a standard retest and successful validation of the newly reclaimed MA(25) at $0.02287 as support to form a higher local low.
⚠️ Volatility is extremely high as volume explodes. Manage risk, avoid high leverage, and use stop-losses.
👇 Community Discussion:
Are you chasing the breakout or waiting for a healthy retest of the MA(25) near $0.023? Share your trade plans and price targets below! 👇
📌 Follow @Ashi Noor | Analyst for daily high-impact technical updates!
#Write2Earn #BinanceSquare #SHELL #AI #TechnicalAnalysis #MyShell #CryptoTrading $[SHELL]
1
141
$USARB
{spot}(USARBUSDT)
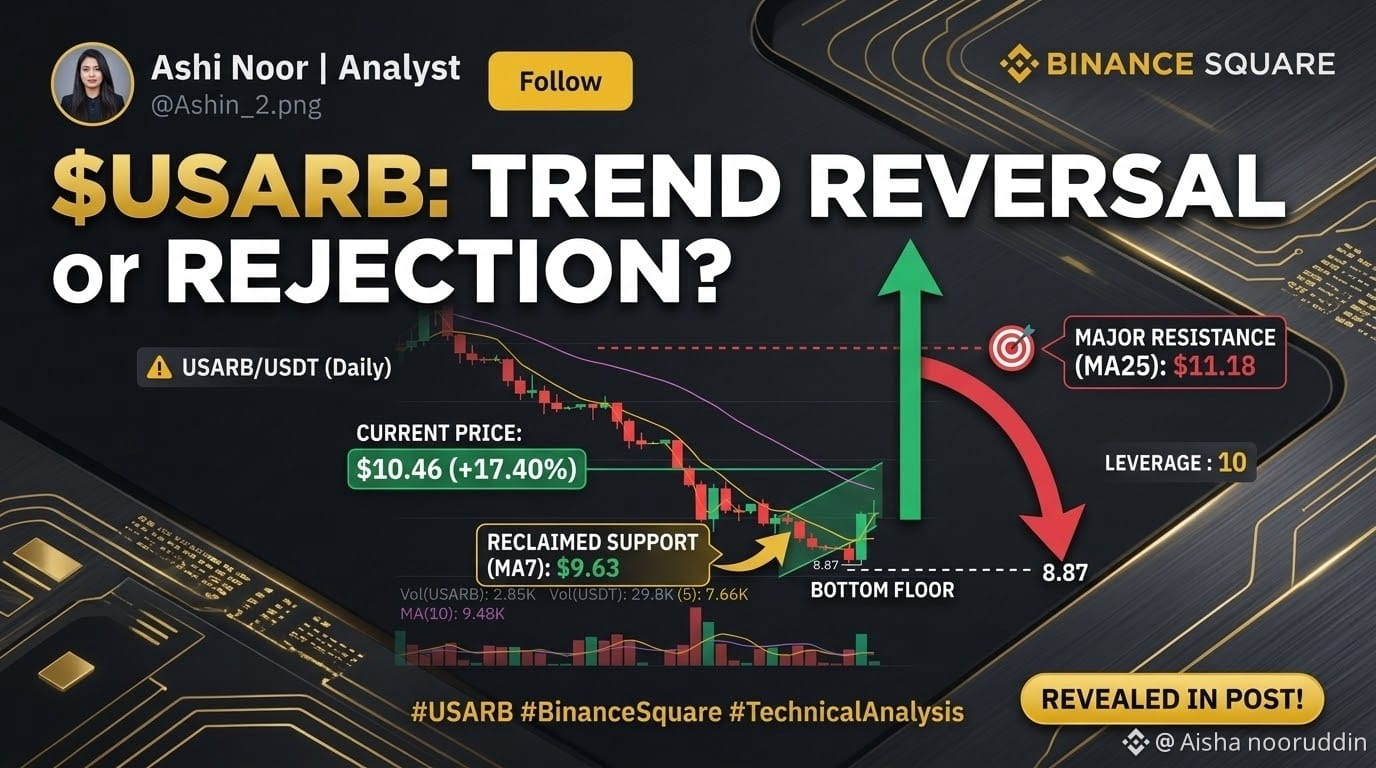
Bounce from Lows! Reclaim MA(25) at $11.18 or Face Rejection? ⚡
The $USARB /USDT (USA Rare Earth bStocks) daily chart is showing signs of life after a strong bullish bounce, currently up +17.40% at $10.46 as buyers step in off the $8.87 bottom floor.
📊 Key Technical Levels to Watch:
* Current Price: $10.46 (24h High: $10.49 | 24h Low: $8.87)
* Dynamic Support Reclaimed (MA7): Price has pushed back above the 7-day Moving Average at $9.63, signaling early dynamic recovery momentum.
* Overhead Resistance (MA25): The major hurdle sits higher at $11.18, which bulls must break to confirm a full trend reversal.
⚠️ Volume is picking up ($224K USDT 24h vol), but manage risk closely as macro trends remain sensitive.
👇 Community Discussion:
Is $USARB initiating a multi-week trend reversal back toward $12+, or is this just a short-lived relief bounce before testing $8.87 again? Drop your trades below! 👇
📌 Follow @Ashi Noor | Analyst for daily high-impact technical setups!
#Write2Earn #BinanceSquare #USARB #TechnicalAnalysis #bStocks #CryptoTrading $[USARB]
$USARB
Bounce from Lows! Reclaim MA(25) at $11.18 or Face Rejection? ⚡
The $USARB /USDT (USA Rare Earth bStocks) daily chart is showing signs of life after a strong bullish bounce, currently up +17.40% at $10.46 as buyers step in off the $8.87 bottom floor.
📊 Key Technical Levels to Watch:
* Current Price: $10.46 (24h High: $10.49 | 24h Low: $8.87)
* Dynamic Support Reclaimed (MA7): Price has pushed back above the 7-day Moving Average at $9.63, signaling early dynamic recovery momentum.
* Overhead Resistance (MA25): The major hurdle sits higher at $11.18, which bulls must break to confirm a full trend reversal.
⚠️ Volume is picking up ($224K USDT 24h vol), but manage risk closely as macro trends remain sensitive.
👇 Community Discussion:
Is $USARB initiating a multi-week trend reversal back toward $12+, or is this just a short-lived relief bounce before testing $8.87 again? Drop your trades below! 👇
📌 Follow @Ashi Noor | Analyst for daily high-impact technical setups!
#Write2Earn #BinanceSquare #USARB #TechnicalAnalysis #bStocks #CryptoTrading $[USARB]
78
,,✨Bismillah-ir-Rahman-ir-Rahim (In the name of Allah, the Most Gracious, the Most Merciful)✨
🌄Good morning, Binance Square family! Starting the day with faith and sharp focus, let’s dive into the morning technical update for Bitcoin ($BTC
{spot}(BTCUSDT)
/USDT).
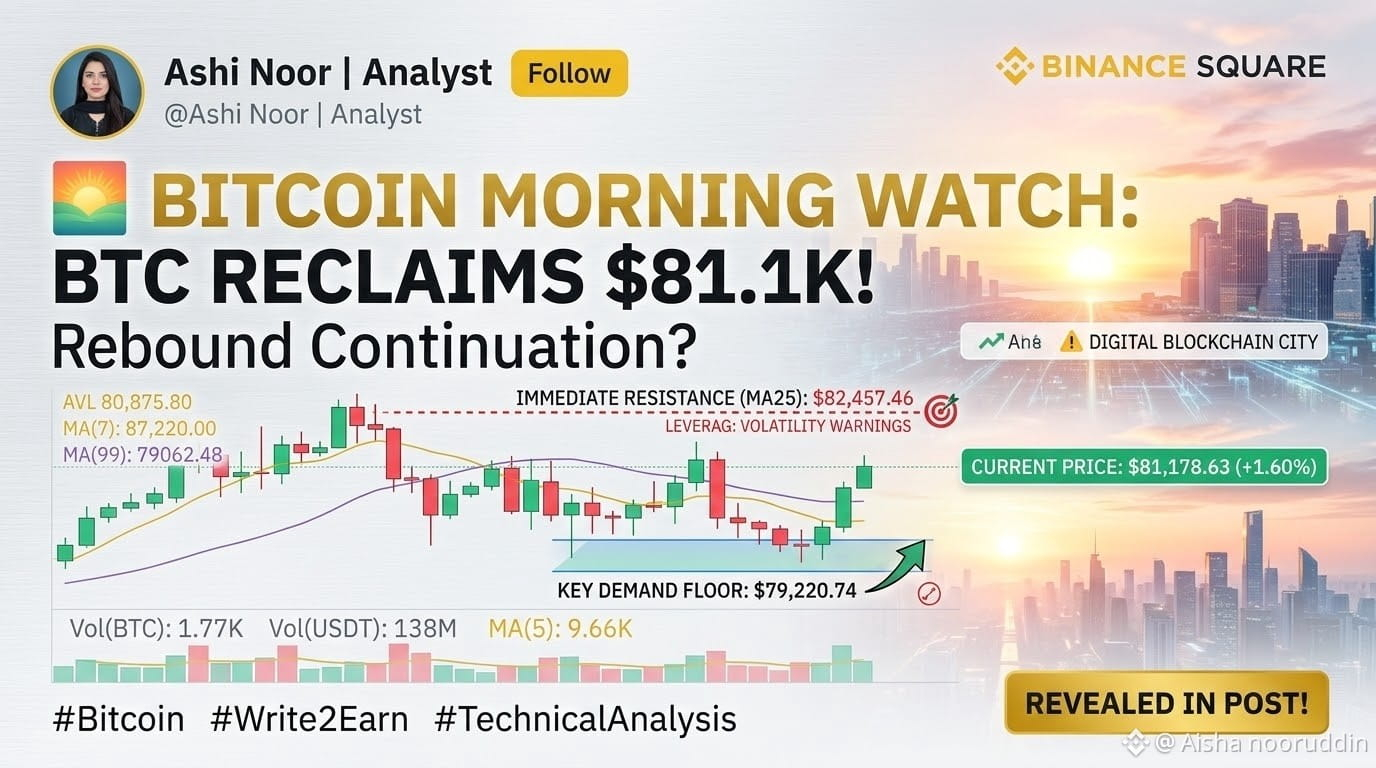
$BTC is currently trading at $81,178.63, showing a +1.60% green recovery in the last 24 hours as bulls step in to defend lower structural supports. After bouncing from the local demand floor at $79,220.74, Bitcoin is fighting its way back upward.
📊 Technical Analysis & Core Indicators:
* Price Action & 24h Range: BTC printed a 24-hour low of $79,506.00 before pushing upward to test an intraday peak of $81,300.00. Volume remains active with 12,703.27 BTC traded over the last day.
* Moving Average Cluster:
* MA(7): Positioned closely at $80,949.86, which price has successfully crossed back above, signaling a positive short-term momentum shift.
* MA(25): Sits at $82,457.46, serving as the primary overhead resistance target for the bulls.
* MA(99): Resting lower at $78,062.48, maintaining the broader structural baseline.
💡 Trade Setup & Key Scenarios:
* Bullish Reclaim Scenario (Continuation):
If bulls can sustain momentum and break firmly above the $81,500 – $82,457 (MA25) resistance cluster, expect an accelerated push toward mid-range targets.
* Pullback / Re-test Scenario:
If the morning rally encounters heavy selling pressure near the daily highs, watch for a healthy re-test of the $80,875 (AVL) to $80,949 (MA7) support zone to maintain bullish structure.
👇 Community Discussion:
With $BTC pushing back above $81.1K this morning, are we heading straight to retest the MA(25) at $82.4K, or will we see another sweep of the lows? Drop your morning trades below! 👇
📌 Follow @Ashi Noor | Analyst for daily high-impact technical analysis and market alpha!
#Write2Earn #BinanceSquare #Bitcoin #BTC #TechnicalAnalysis #CryptoTrading $[BTC]
,,✨Bismillah-ir-Rahman-ir-Rahim (In the name of Allah, the Most Gracious, the Most Merciful)✨
🌄Good morning, Binance Square family! Starting the day with faith and sharp focus, let’s dive into the morning technical update for Bitcoin ($BTC
/USDT).
$BTC is currently trading at $81,178.63, showing a +1.60% green recovery in the last 24 hours as bulls step in to defend lower structural supports. After bouncing from the local demand floor at $79,220.74, Bitcoin is fighting its way back upward.
📊 Technical Analysis & Core Indicators:
* Price Action & 24h Range: BTC printed a 24-hour low of $79,506.00 before pushing upward to test an intraday peak of $81,300.00. Volume remains active with 12,703.27 BTC traded over the last day.
* Moving Average Cluster:
* MA(7): Positioned closely at $80,949.86, which price has successfully crossed back above, signaling a positive short-term momentum shift.
* MA(25): Sits at $82,457.46, serving as the primary overhead resistance target for the bulls.
* MA(99): Resting lower at $78,062.48, maintaining the broader structural baseline.
💡 Trade Setup & Key Scenarios:
* Bullish Reclaim Scenario (Continuation):
If bulls can sustain momentum and break firmly above the $81,500 – $82,457 (MA25) resistance cluster, expect an accelerated push toward mid-range targets.
* Pullback / Re-test Scenario:
If the morning rally encounters heavy selling pressure near the daily highs, watch for a healthy re-test of the $80,875 (AVL) to $80,949 (MA7) support zone to maintain bullish structure.
👇 Community Discussion:
With $BTC pushing back above $81.1K this morning, are we heading straight to retest the MA(25) at $82.4K, or will we see another sweep of the lows? Drop your morning trades below! 👇
📌 Follow @Ashi Noor | Analyst for daily high-impact technical analysis and market alpha!
#Write2Earn #BinanceSquare #Bitcoin #BTC #TechnicalAnalysis #CryptoTrading $[BTC]
89
·
--
බෙයාරිෂ්
The $AAVE
{spot}(AAVEUSDT)
/USDT daily testing critical structural demand, currently trading at $132.54 (-1.50%) as selling pressure tests key moving average baselines.
📊 Key Technical Levels to Watch:
* Current Price: $132.54 (24h Range: $129.51 – $136.25)
* Dynamic Resistance (MA7): Positioned overhead at $141.24, acting as the immediate hurdle for bulls.
* Macro Baseline Support (MA99): Trending upward at $128.03, sitting right below the 24h low of $129.51, forming the ultimate macro defense line.
⚠️ Volatility is high as the asset hovers near major trend support.
👇 Community Discussion:
Are you accumulating $AAVE here at the MA(99) support zone for a relief bounce, or waiting for a deeper correction? Share your trade setups below! 👇
📌 Follow @Ashi Noor | Analyst for daily high-impact technical setups!
#Write2Earn #BinanceSquare #AAVE #TechnicalAnalysis #DeFi #CryptoTrading $[AAVE]
The $AAVE
/USDT daily testing critical structural demand, currently trading at $132.54 (-1.50%) as selling pressure tests key moving average baselines.
📊 Key Technical Levels to Watch:
* Current Price: $132.54 (24h Range: $129.51 – $136.25)
* Dynamic Resistance (MA7): Positioned overhead at $141.24, acting as the immediate hurdle for bulls.
* Macro Baseline Support (MA99): Trending upward at $128.03, sitting right below the 24h low of $129.51, forming the ultimate macro defense line.
⚠️ Volatility is high as the asset hovers near major trend support.
👇 Community Discussion:
Are you accumulating $AAVE here at the MA(99) support zone for a relief bounce, or waiting for a deeper correction? Share your trade setups below! 👇
📌 Follow @Ashi Noor | Analyst for daily high-impact technical setups!
#Write2Earn #BinanceSquare #AAVE #TechnicalAnalysis #DeFi #CryptoTrading $[AAVE]

34
The $HAEDAL
{spot}(HAEDALUSDT)
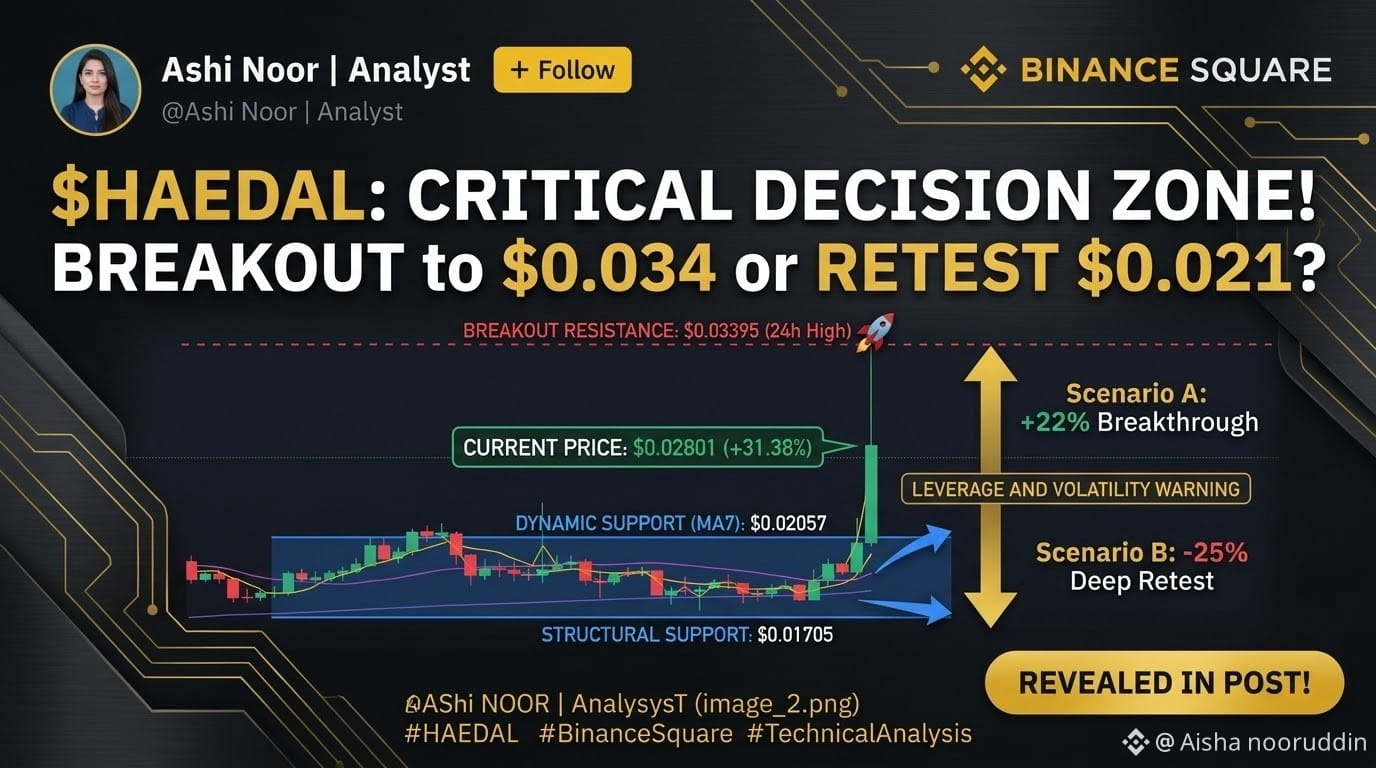
/USDT daily chart is experiencing major volatility, currently trading at $0.02801 (+31.38%) after a powerful surge. Price action has reached a crucial inflection point right inside the decision zone.
📊 Key Technical Levels to Watch:
* Current Price: $0.02801
* Scenario A (Bullish Breakout): A volume-backed push past breakout resistance at $0.03395 (24h High) opens up a +22% breakthrough toward $0.034+.
* Scenario B (Deep Retest): Failure to clear resistance risks a -25% deep correction back toward the dynamic MA(7) support at $0.02057 and structural floor at $0.01705.
👇 Community Discussion:
Are you looking for a breakout continuation above $0.034, or waiting for a dip to reload near $0.021? Drop your strategy below! 👇
📌 Follow @Ashi Noor | Analyst for daily high-impact technical setups!
#Write2Earn #BinanceSquare #HAEDAL #TechnicalAnalysis #DeFiGainer #CryptoTrading $[HAEDAL]
The $HAEDAL
/USDT daily chart is experiencing major volatility, currently trading at $0.02801 (+31.38%) after a powerful surge. Price action has reached a crucial inflection point right inside the decision zone.
📊 Key Technical Levels to Watch:
* Current Price: $0.02801
* Scenario A (Bullish Breakout): A volume-backed push past breakout resistance at $0.03395 (24h High) opens up a +22% breakthrough toward $0.034+.
* Scenario B (Deep Retest): Failure to clear resistance risks a -25% deep correction back toward the dynamic MA(7) support at $0.02057 and structural floor at $0.01705.
👇 Community Discussion:
Are you looking for a breakout continuation above $0.034, or waiting for a dip to reload near $0.021? Drop your strategy below! 👇
📌 Follow @Ashi Noor | Analyst for daily high-impact technical setups!
#Write2Earn #BinanceSquare #HAEDAL #TechnicalAnalysis #DeFiGainer #CryptoTrading $[HAEDAL]
61
ලිපිය
🏛️ #FOMCWatch: Federal Reserve Rate Decision Tomorrow | High Volatility Incoming for Bitcoin & Altcoins! 📊⚡
As the Federal Open Market Committee (FOMC) meets for its October interest rate decision, crypto markets are sitting on a critical technical edge. With interest rates currently targeted at 3.75% – 4.00%, market expectations strongly price in a pause/rate hold, but all eyes remain glued to the Fed's tone regarding future rate hikes before the end of the year.
Macro volatility always cascades directly into digital assets—here is how top crypto setups are positioning ahead of the statement.
🔍 Macro Breakdown & Market Scenarios:
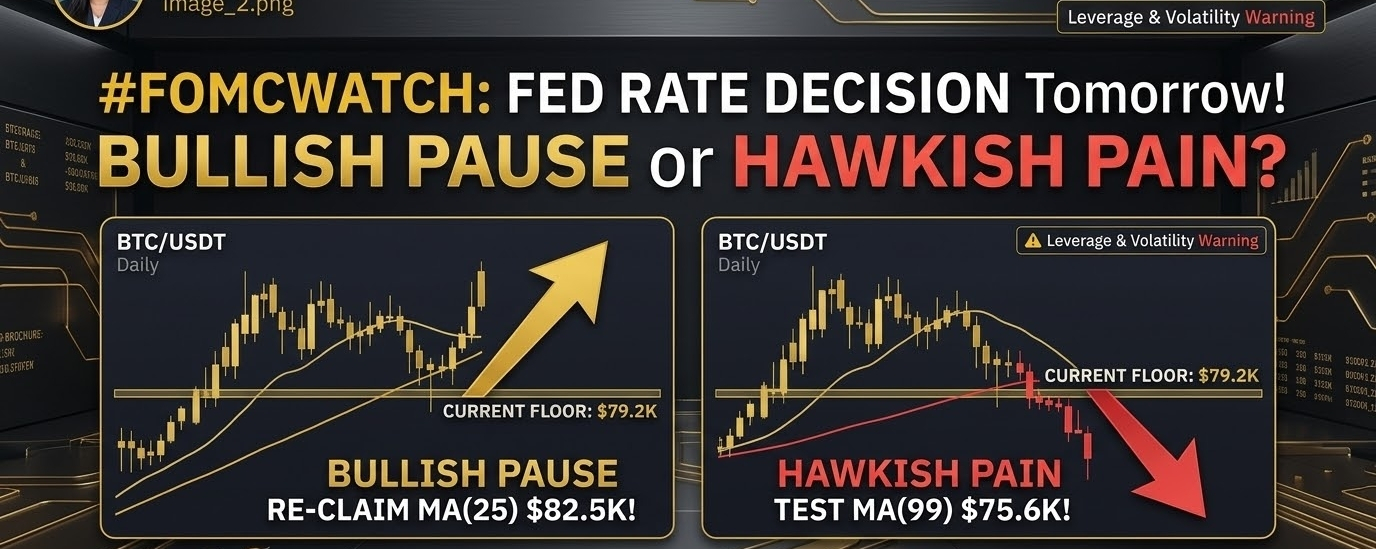
* Scenario 1: Dovish Hold / Pause (Bullish Catalyst 🚀)
If the Fed holds rates steady and signals a cautious stance on further tightening, expect short-squeeze rallies across major assets:
* $BTC : Looking to defend the $79.2K floor and push for an immediate re-claim of the $81.4K (MA7) to $82.5K (MA25) resistance cluster.
* Altcoins: High-beta DeFi gainers could extend breakout momentum toward key targets.
* Scenario 2: Hawkish Rate Guidance (Bearish Pressure 📉)
If the Fed maintains aggressive rhetoric or hints at a rate hike in December, risk-off sentiment could trigger liquidations:
* $BTC: Risk of breaking the $79,220 horizontal floor, bringing macro target tests at $77,050 and the $75,600 (MA99) baseline into focus.
💡 Strategy for Traders:
* Manage Risk: Avoid heavy leverage ahead of the FOMC statement release and Fed press conference.
* Wait for Confirmation: Let volatility settle and look for daily candle close confirmation around major support/resistance levels before opening long or short positions.
👇 Community Discussion:
What is your expectation for tomorrow's #FOMCWatch meeting—will Powell give the green light for a Bitcoin rally back above $82K, or are we testing lower support levels first? Drop your setup below! 👇
📌 Follow @Ashi Noor | Analyst for live chart updates, macro breakdown articles, and actionable technical setups!
#FOMCWatch #Write2Earn #BinanceSquare #Bitcoin #MacroEconomy #TechnicalAnalysis $[BTC]#FOMCWatch
🏛️ #FOMCWatch
: Federal Reserve Rate Decision Tomorrow | High Volatility Incoming for Bitcoin & Altcoins! 📊⚡
As the Federal Open Market Committee (FOMC) meets for its October interest rate decision, crypto markets are sitting on a critical technical edge. With interest rates currently targeted at 3.75% – 4.00%, market expectations strongly price in a pause/rate hold, but all eyes remain glued to the Fed's tone regarding future rate hikes before the end of the year.
Macro volatility always cascades directly into digital assets—here is how top crypto setups are positioning ahead of the statement.
🔍 Macro Breakdown & Market Scenarios:
* Scenario 1: Dovish Hold / Pause (Bullish Catalyst 🚀)
If the Fed holds rates steady and signals a cautious stance on further tightening, expect short-squeeze rallies across major assets:
* $BTC : Looking to defend the $79.2K floor and push for an immediate re-claim of the $81.4K (MA7) to $82.5K (MA25) resistance cluster.
* Altcoins: High-beta DeFi gainers could extend breakout momentum toward key targets.
* Scenario 2: Hawkish Rate Guidance (Bearish Pressure 📉)
If the Fed maintains aggressive rhetoric or hints at a rate hike in December, risk-off sentiment could trigger liquidations:
* $BTC : Risk of breaking the $79,220 horizontal floor, bringing macro target tests at $77,050 and the $75,600 (MA99) baseline into focus.
💡 Strategy for Traders:
* Manage Risk: Avoid heavy leverage ahead of the FOMC statement release and Fed press conference.
* Wait for Confirmation: Let volatility settle and look for daily candle close confirmation around major support/resistance levels before opening long or short positions.
👇 Community Discussion:
What is your expectation for tomorrow's #FOMCWatch meeting—will Powell give the green light for a Bitcoin rally back above $82K, or are we testing lower support levels first? Drop your setup below! 👇
📌 Follow @Ashi Noor | Analyst for live chart updates, macro breakdown articles, and actionable technical setups!
#FOMCWatch #Write2Earn #BinanceSquare #Bitcoin #MacroEconomy #TechnicalAnalysis $[BTC]#FOMCWatch
27
ලිපිය
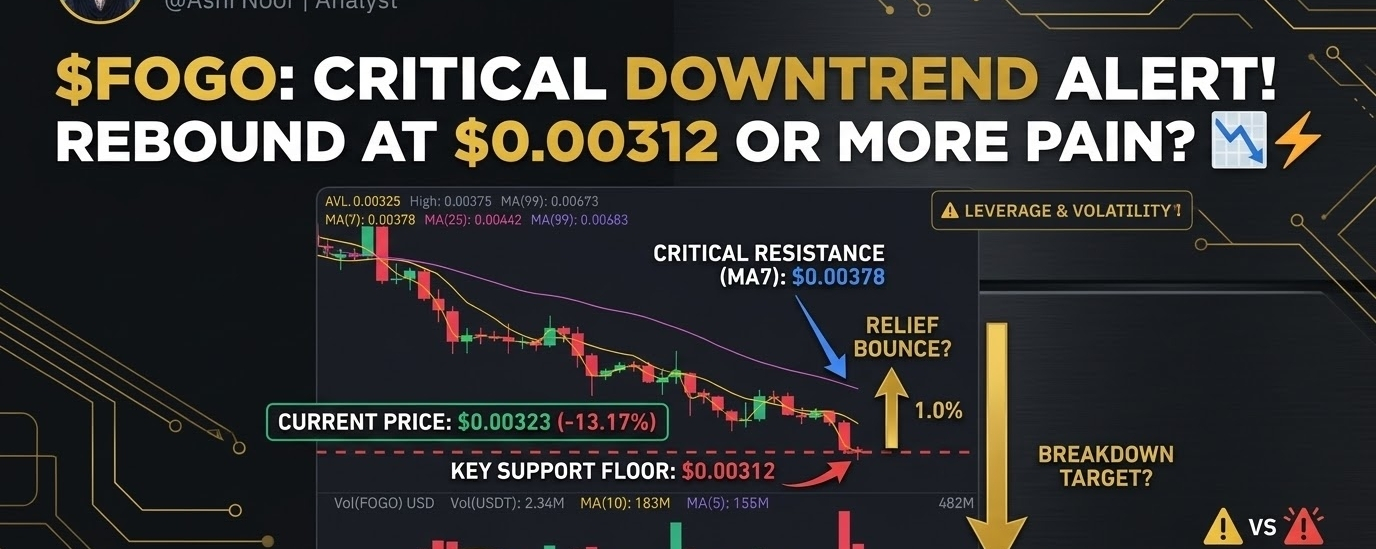
The FOGO/USDT is flashing significantwarning signs, with the infrastructure token currently locked in a prolonged, multi-month bearish downtrend. After a failed attempt to reverse the trend, $FOGO has accelerated its decline, pulling back over -13.17% in the last 24 hours to trade at $0.00323. The asset is now testing a critical horizontal support floor that determines the next major move.
📊 Technical Analysis & Core Indicators:
* Price Action Breakdown: FOGO has Printed consecutive red daily candles, clearly establishing a lower-high and lower-low sequence. It has completely cleared dynamic support levels. The 24-hour high is currently $0.00375, with the low testing the ultimate breakdown point at $0.00312.
* Extreme Moving Average Resistance Cluster:
* MA(7): Curved sharply downward to $0.00378 (the next critical resistance target).
* MA(25): The medium-term pivot resistance baseline is positioned much higher at $0.00442.
* MA(99): The long-term support floor baseline is positioned far higher at $0.00683, signaling that the macro trend is strictly bearish.
💡 Trade Setup & High-Potential Scenarios:
* Bullish Rebound Scenario (Relief Bounce)
Bulls must defend the critical horizontal support floor at $0.00312 (referencing visual floor in image_47.png). A successful retest here could trigger a dynamic short-squeeze relief rally. The first targets are reclaiming immediate resistance at $0.00378 (MA7) and structural supply at $0.00407. A return above $0.00442 (MA25 cluster) is required to invalidating the bearish bias and opening technical room toward $0.00524. (Leverage and volatility are extremely high as highlighted in visual).
* Bearish Breakdown & New Lows Scenario:
If $FOGO fails to secure a daily close above the crucial $0.00312 support floor, the downtrend accelerates. Technical targets for shorts lie at psychological support near $0.00250 and historical demand at $0.00195.
👇 Community Discussion:
Is $FOGO finding a local bottom here at the $0.0031 support floor for a morning relief watch? Or are you expecting a deep re-test and new weekly lows? 👇
📌 Follow @Ashi Noor | Analyst for daily technical breakdowns and high-impact chart setups across infrastructure gainers!
#Write2Earn #BinanceSquare #FOGO #TechnicalAnalysis
{spot}(FOGOUSDT)
#DeFiGainer #CryptoTrading $AMZNB
{spot}(AMZNBUSDT)
The FOGO/USDT is flashing significant
warning signs, with the infrastructure token currently locked in a prolonged, multi-month bearish downtrend. After a failed attempt to reverse the trend, $FOGO has accelerated its decline, pulling back over -13.17% in the last 24 hours to trade at $0.00323. The asset is now testing a critical horizontal support floor that determines the next major move.
📊 Technical Analysis & Core Indicators:
* Price Action Breakdown: FOGO has Printed consecutive red daily candles, clearly establishing a lower-high and lower-low sequence. It has completely cleared dynamic support levels. The 24-hour high is currently $0.00375, with the low testing the ultimate breakdown point at $0.00312.
* Extreme Moving Average Resistance Cluster:
* MA(7): Curved sharply downward to $0.00378 (the next critical resistance target).
* MA(25): The medium-term pivot resistance baseline is positioned much higher at $0.00442.
* MA(99): The long-term support floor baseline is positioned far higher at $0.00683, signaling that the macro trend is strictly bearish.
💡 Trade Setup & High-Potential Scenarios:
* Bullish Rebound Scenario (Relief Bounce)
Bulls must defend the critical horizontal support floor at $0.00312 (referencing visual floor in image_47.png). A successful retest here could trigger a dynamic short-squeeze relief rally. The first targets are reclaiming immediate resistance at $0.00378 (MA7) and structural supply at $0.00407. A return above $0.00442 (MA25 cluster) is required to invalidating the bearish bias and opening technical room toward $0.00524. (Leverage and volatility are extremely high as highlighted in visual).
* Bearish Breakdown & New Lows Scenario:
If $FOGO fails to secure a daily close above the crucial $0.00312 support floor, the downtrend accelerates. Technical targets for shorts lie at psychological support near $0.00250 and historical demand at $0.00195.
👇 Community Discussion:
Is $FOGO finding a local bottom here at the $0.0031 support floor for a morning relief watch? Or are you expecting a deep re-test and new weekly lows? 👇
📌 Follow @Ashi Noor | Analyst for daily technical breakdowns and high-impact chart setups across infrastructure gainers!
#Write2Earn #BinanceSquare #FOGO #TechnicalAnalysis
#DeFiGainer #CryptoTrading $AMZNB
5
820
The $HAEDAL
{spot}(HAEDALUSDT)
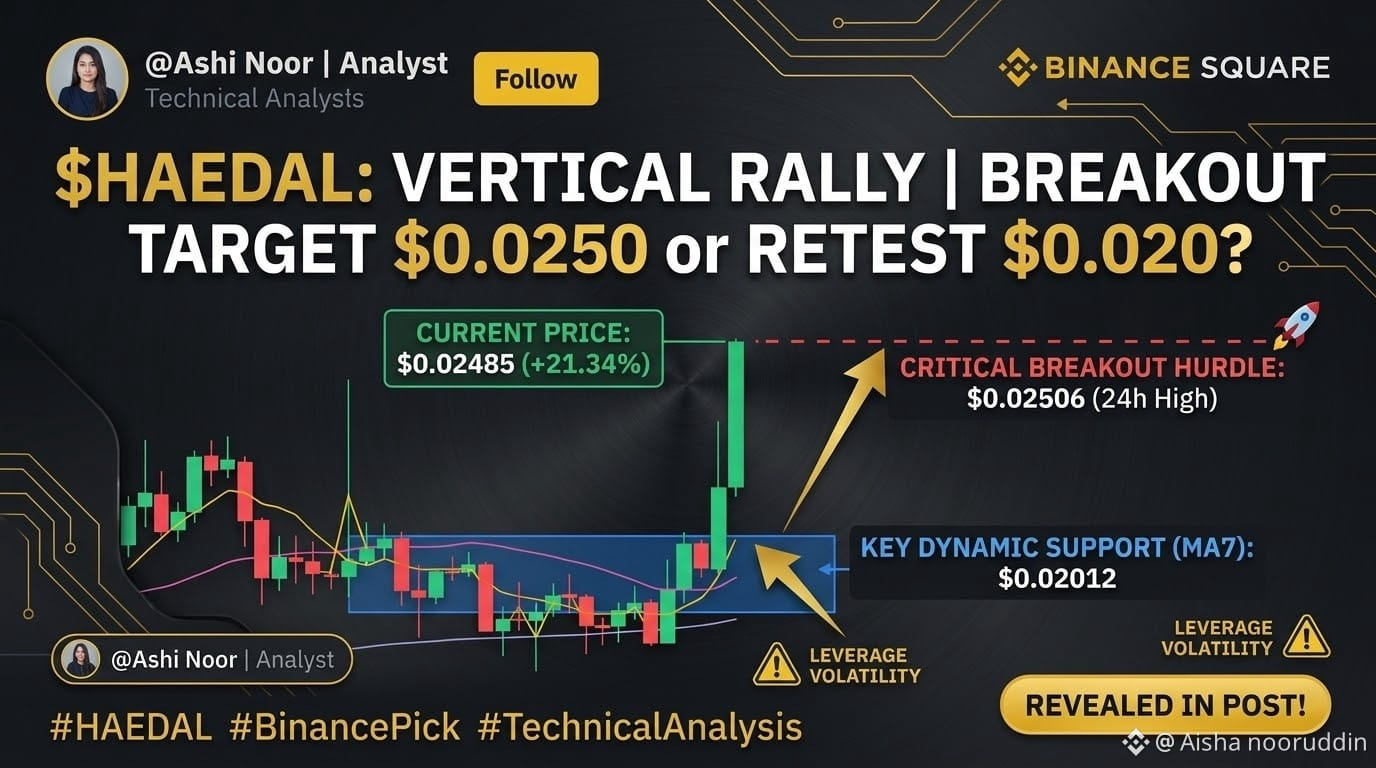
/USDT daily chart is executing a strong parabolic expansion, leading today's DeFi gainers with massive bullish momentum. Currently trading at $0.02485, Haedal has surged +21.34% in the last 24 hours, breaking out of a long-term accumulation base on a heavy volume spike.
📊 Technical Analysis & Core Indicators:
* Vertical Price Expansion: $HAEDAL has printed a massive green daily candle, sweeping past previous local swing highs and hitting a 24-hour peak of $0.02506.
* Moving Average Crossover:
* MA(7): Curved upward sharply to $0.02012, confirming strong short-term bullish control.
* MA(25): Sits at $0.01922, forming a solid dynamic support floor below.
* MA(99): Positioned lower at $0.01824, marking the macro baseline that bulls successfully reclaimed to trigger this rally.
* Volume Spike: High 24-hour trading volume of 118.30M HAEDAL ($2.67M USDT) confirms strong institutional and retail participation backing the move.
💡 Trade Setup & Key Scenarios:
* Bullish Breakout Continuation:
A daily close sustained above $0.0250 confirms a breakout from local resistance, opening targets toward the next structural resistance level at $0.0285 – $0.0320.
* Pullback Scenario (Re-test for Entry):
If momentum cools off, watch for a healthy retest near the $0.0201 (MA7) to $0.0204 (24h Low) demand zone for potential long re-entries.
👇 Community Discussion:
Is $HAEDAL continuing its vertical surge to $0.030, or are you waiting for a pullback to retest the $0.020 support? Share your trade plans below! 👇
📌 Follow @Ashi Noor | Analyst for daily high-impact chart setups and DeFi alpha!
#Write2Earn #BinanceSquare #HAEDAL #DeFiGainer #TechnicalAnalysis #CryptoTrading $[HAEDAL
The $HAEDAL
/USDT daily chart is executing a strong parabolic expansion, leading today's DeFi gainers with massive bullish momentum. Currently trading at $0.02485, Haedal has surged +21.34% in the last 24 hours, breaking out of a long-term accumulation base on a heavy volume spike.
📊 Technical Analysis & Core Indicators:
* Vertical Price Expansion: $HAEDAL has printed a massive green daily candle, sweeping past previous local swing highs and hitting a 24-hour peak of $0.02506.
* Moving Average Crossover:
* MA(7): Curved upward sharply to $0.02012, confirming strong short-term bullish control.
* MA(25): Sits at $0.01922, forming a solid dynamic support floor below.
* MA(99): Positioned lower at $0.01824, marking the macro baseline that bulls successfully reclaimed to trigger this rally.
* Volume Spike: High 24-hour trading volume of 118.30M HAEDAL ($2.67M USDT) confirms strong institutional and retail participation backing the move.
💡 Trade Setup & Key Scenarios:
* Bullish Breakout Continuation:
A daily close sustained above $0.0250 confirms a breakout from local resistance, opening targets toward the next structural resistance level at $0.0285 – $0.0320.
* Pullback Scenario (Re-test for Entry):
If momentum cools off, watch for a healthy retest near the $0.0201 (MA7) to $0.0204 (24h Low) demand zone for potential long re-entries.
👇 Community Discussion:
Is $HAEDAL continuing its vertical surge to $0.030, or are you waiting for a pullback to retest the $0.020 support? Share your trade plans below! 👇
📌 Follow @Ashi Noor | Analyst for daily high-impact chart setups and DeFi alpha!
#Write2Earn #BinanceSquare #HAEDAL #DeFiGainer #TechnicalAnalysis #CryptoTrading $[HAEDAL
140
The $OSMO
{spot}(OSMOUSDT)
/USDT is executing a textbook parabolic breakout, leading the DeFi gainers with explosive vertical momentum. Trading at $0.0628, Osmosis ($OSMO) has surged +20.08% in the last 24 hours, completely clearing the dynamic compression range on extreme relative volume.
📊 Technical Analysis & Core Indicators:
* Vertical Price Action: Following a multi-month accumulation phase, $OSMO has printed consecutive vertical green daily candles, entering into "price discovery" territory. The 24-hour high is $0.0640.
* Extreme Moving Average Divergence:
* MA(7): Has finished its bullish crossover above MA(25). It has now curved vertically to $0.0510. The current price is vastly overextended above this immediate dynamic floor, acting as the first key support.
* MA(99): Trending far below at $0.0357, marking the ultimate long-term structural baseline support.
* Parabolic Volume Spike: The vertical rally is supported by massive institutional-grade volume, with 2.48M USDT traded in 24 hours. (This volume spike is clearly highlighted on your chart).
💡 Trade Setup & Key Scenarios:
* Bullish Scenario (Breakout Extension):
Bulls are targeting a clean breakout above the previous local supply zone near $0.0649. A confirmed daily close above $0.0650 invalidates the overbought thesis and opens technical room toward previous macro highs.
* Pullback Scenario (Technical Re-Entry):
Given the extreme angle of attack, a healthy technical retest is a high-probability event. The primary entry target for dip buyers lies at the dynamic support of the MA(7) at $0.0510. Structural support at $0.0488 (the 24h low) must hold to preserve the parabolic structure.
👇 Community Discussion:
Are you placing buy orders for $OSMO at current price, or waiting for a pullback to retest the MA(7) near $0.05? Share your trade setups below! 👇
#BinanceSquare #Write2Earn #OSMO #Osmosis #TechnicalAnalysis #DeFiGainer #$[OSMO]
The $OSMO
/USDT is executing a textbook parabolic breakout, leading the DeFi gainers with explosive vertical momentum. Trading at $0.0628, Osmosis ($OSMO ) has surged +20.08% in the last 24 hours, completely clearing the dynamic compression range on extreme relative volume.
📊 Technical Analysis & Core Indicators:
* Vertical Price Action: Following a multi-month accumulation phase, $OSMO has printed consecutive vertical green daily candles, entering into "price discovery" territory. The 24-hour high is $0.0640.
* Extreme Moving Average Divergence:
* MA(7): Has finished its bullish crossover above MA(25). It has now curved vertically to $0.0510. The current price is vastly overextended above this immediate dynamic floor, acting as the first key support.
* MA(99): Trending far below at $0.0357, marking the ultimate long-term structural baseline support.
* Parabolic Volume Spike: The vertical rally is supported by massive institutional-grade volume, with 2.48M USDT traded in 24 hours. (This volume spike is clearly highlighted on your chart).
💡 Trade Setup & Key Scenarios:
* Bullish Scenario (Breakout Extension):
Bulls are targeting a clean breakout above the previous local supply zone near $0.0649. A confirmed daily close above $0.0650 invalidates the overbought thesis and opens technical room toward previous macro highs.
* Pullback Scenario (Technical Re-Entry):
Given the extreme angle of attack, a healthy technical retest is a high-probability event. The primary entry target for dip buyers lies at the dynamic support of the MA(7) at $0.0510. Structural support at $0.0488 (the 24h low) must hold to preserve the parabolic structure.
👇 Community Discussion:
Are you placing buy orders for $OSMO at current price, or waiting for a pullback to retest the MA(7) near $0.05? Share your trade setups below! 👇
#BinanceSquare #Write2Earn #OSMO #Osmosis #TechnicalAnalysis #DeFiGainer #$[OSMO]

98
$SYN /USDT: Bulls Are Back, But Can the Rally Continue? 📈
$SYN
{spot}(SYNUSDT)
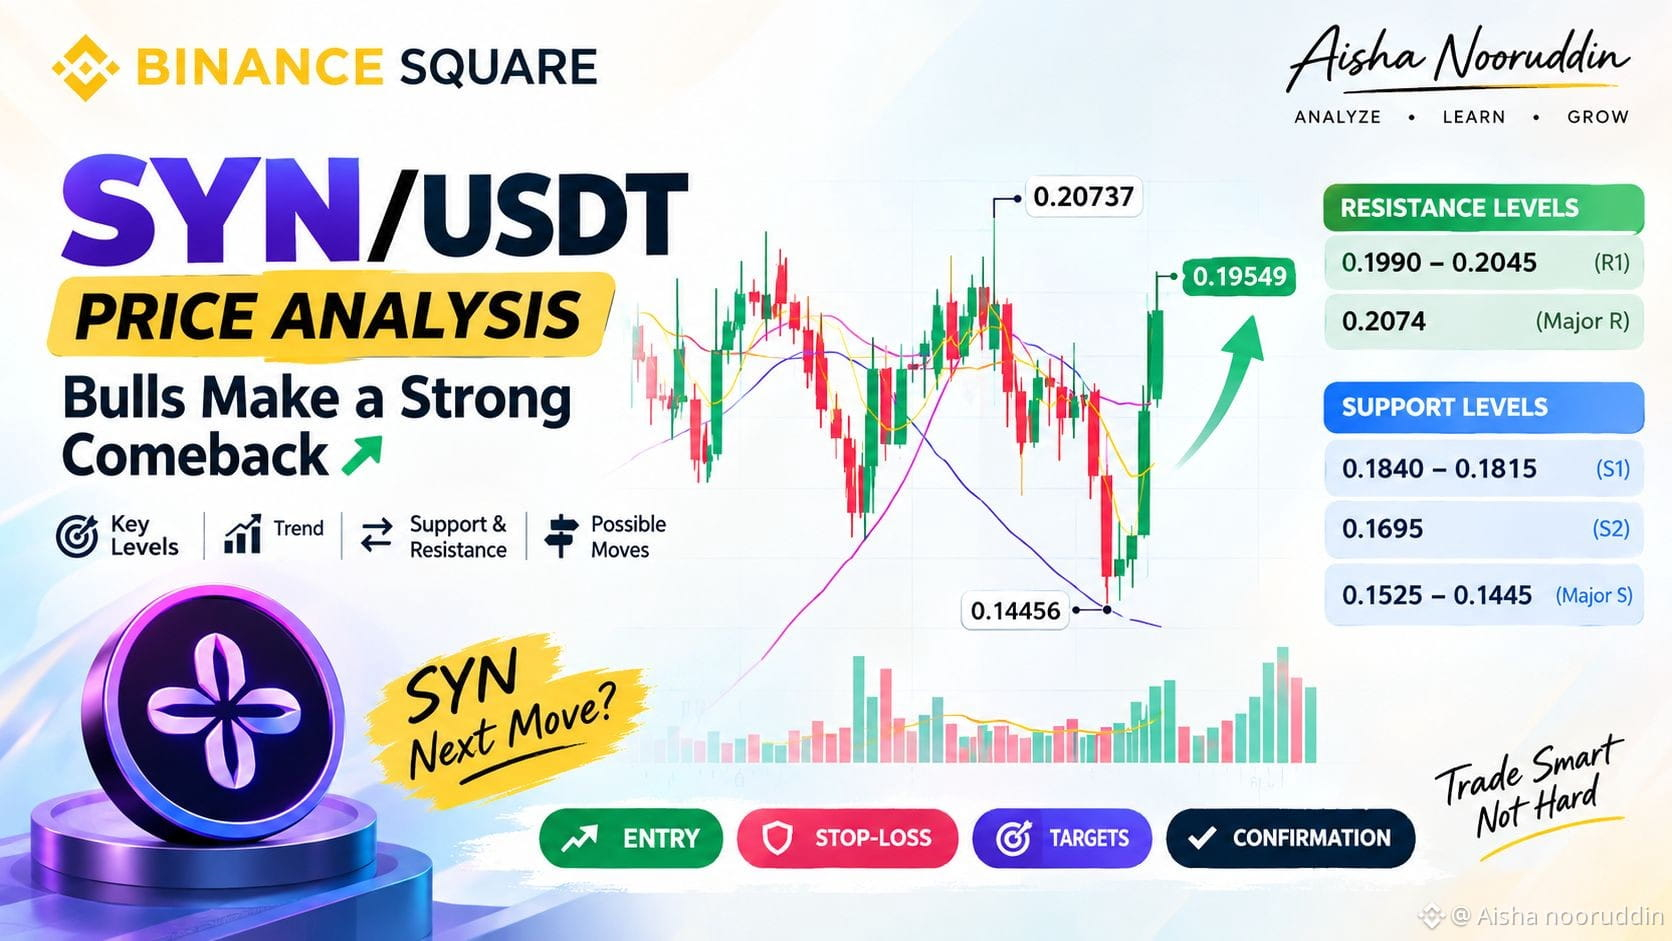
/USDT is showing a strong recovery after falling to around 0.14456 USDT. At the time of my chart screenshot, the price was near 0.19549 USDT, up approximately 24.39%.
Key Levels to Watch
• Resistance: 0.1990–0.2045 USDT
• Major resistance: 0.2074 USDT
• Support: 0.1840–0.1815 USDT
• Lower support: 0.1695 USDT
Bullish Scenario
If the price holds its recovery and buying volume remains strong, SYN could retest the 0.1990–0.2045 resistance zone. A confirmed breakout may support further upside.
Bearish Scenario
If buyers lose momentum, the price could pull back toward 0.1840–0.1815. A break below this zone may lead to further weakness.
My View
After such a sharp move, I would avoid chasing the price. I prefer to wait for a confirmed breakout or a pullback with a clear bullish reaction.
What do you think? Can SYN break through resistance, or will sellers take control?
Share your thoughts in the comments!
#SYN #Synapse #CryptoAnalysis #Altcoins #TechnicalAnalysis
$SYN /USDT: Bulls Are Back, But Can the Rally Continue? 📈
$SYN
/USDT is showing a strong recovery after falling to around 0.14456 USDT. At the time of my chart screenshot, the price was near 0.19549 USDT, up approximately 24.39%.
Key Levels to Watch
• Resistance: 0.1990–0.2045 USDT
• Major resistance: 0.2074 USDT
• Support: 0.1840–0.1815 USDT
• Lower support: 0.1695 USDT
Bullish Scenario
If the price holds its recovery and buying volume remains strong, SYN could retest the 0.1990–0.2045 resistance zone. A confirmed breakout may support further upside.
Bearish Scenario
If buyers lose momentum, the price could pull back toward 0.1840–0.1815. A break below this zone may lead to further weakness.
My View
After such a sharp move, I would avoid chasing the price. I prefer to wait for a confirmed breakout or a pullback with a clear bullish reaction.
What do you think? Can SYN break through resistance, or will sellers take control?
Share your thoughts in the comments!
#SYN #Synapse #CryptoAnalysis #Altcoins #TechnicalAnalysis
63
بِسْمِ اللهِ الرَّحْمٰنِ الرَّحِيْمِ
☀️ $BTC
{spot}(BTCUSDT)
Morning Watch:
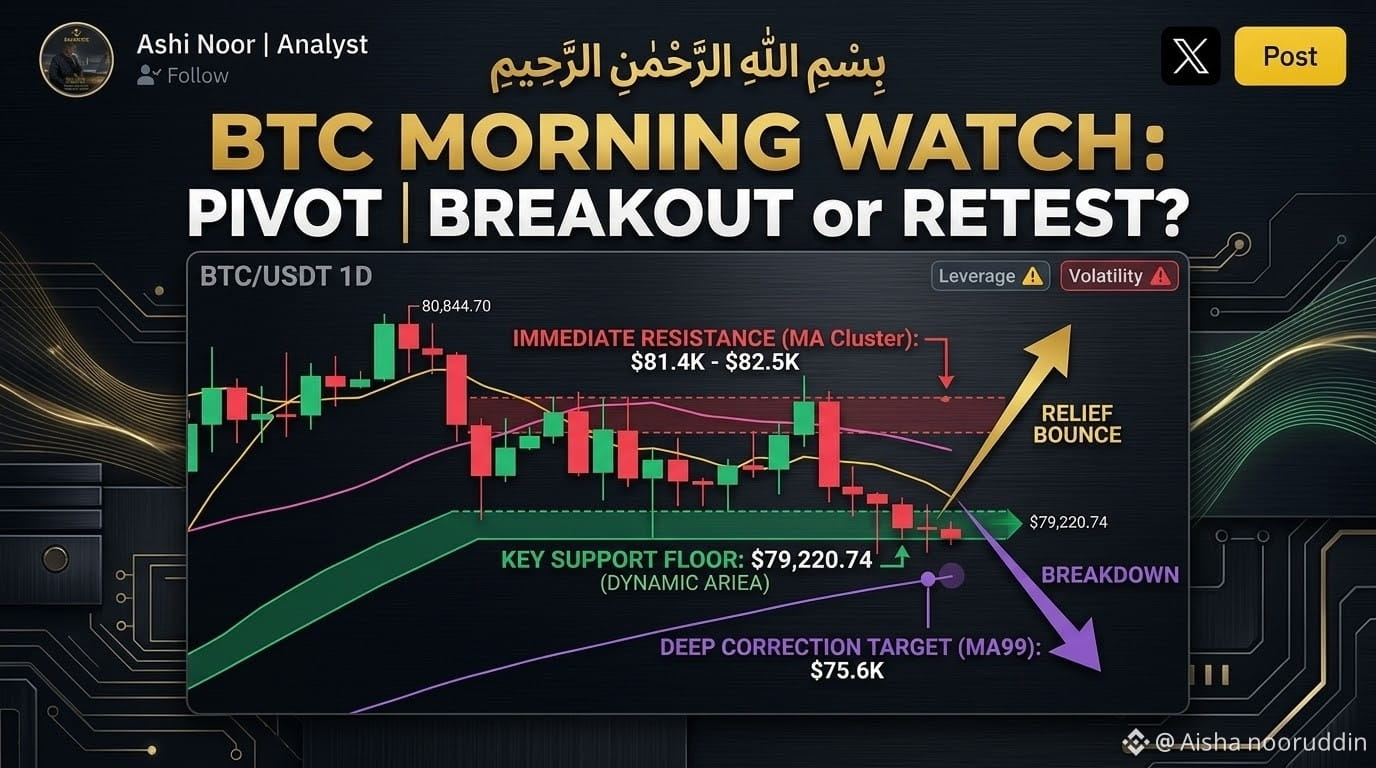
The BTC/USDT daily chart is opening today with high compression around the key $79,819.41 level (+0.25%). After sweeping down to a 24-hour low of $79,368.67, Bitcoin ($BTC) is attempting to hold its structural support zone, while bulls push for a daily close above the $80,000 threshold.
📊 Technical Analysis & Core Indicators:
* Price Action: $BTC is currently consolidating just below $80,000, with the 24-hour high resting at $80,844.70. The market is showing lower highs on the daily timeframe, placing heavy pressure on immediate support levels.
* Moving Average Resistance Cluster:
* MA(7): Positioned overhead at $81,431.50, serving as the immediate hurdle for any short-term relief move.
* MA(25): Sits higher at $82,556.84, defining the trend line bulls must reclaim to restore medium-term upside momentum.
* MA(99): Trending far below at $75,603.77, maintaining the primary macro baseline support.
* Volume Metrics: 24-hour trading volume stands at 15,225.54 BTC ($1.22B USDT). Volume remains steady, indicating that institutional direction is waiting for a clear break outside the $79.3K – $80.8K daily range.
💡 Trade Setup & Strategic Scenarios:
* Bullish Scenario (Relief Bounce):
If BTC holds above $79,368 and reclaims $80,573, look for a relief rally toward the MA(7) at $81,431. A sustained daily close above $82,556 (MA25) invalidates short-term bearish pressure and opens targets toward $84,096 – $87,220.
* Bearish Scenario (Breakdown):
A daily close below $79,220 signals further weakness. The next downside target rests at structural support around $77,050,
👇 Community Discussion:
Will $BTC defend the $79.3K floor for a morning rally, or are we visiting $77K before the next leg up? Share your trade setups below! 👇
📌 Follow @Ashi Noor | Analyst for daily chart breakdowns, high-impact alpha, and actionable market updates!
#BinanceSquare #Bitcoin #BTC #CryptoTrading
بِسْمِ اللهِ الرَّحْمٰنِ الرَّحِيْمِ
☀️ $BTC
Morning Watch:
The BTC/USDT daily chart is opening today with high compression around the key $79,819.41 level (+0.25%). After sweeping down to a 24-hour low of $79,368.67, Bitcoin ($BTC ) is attempting to hold its structural support zone, while bulls push for a daily close above the $80,000 threshold.
📊 Technical Analysis & Core Indicators:
* Price Action: $BTC is currently consolidating just below $80,000, with the 24-hour high resting at $80,844.70. The market is showing lower highs on the daily timeframe, placing heavy pressure on immediate support levels.
* Moving Average Resistance Cluster:
* MA(7): Positioned overhead at $81,431.50, serving as the immediate hurdle for any short-term relief move.
* MA(25): Sits higher at $82,556.84, defining the trend line bulls must reclaim to restore medium-term upside momentum.
* MA(99): Trending far below at $75,603.77, maintaining the primary macro baseline support.
* Volume Metrics: 24-hour trading volume stands at 15,225.54 BTC ($1.22B USDT). Volume remains steady, indicating that institutional direction is waiting for a clear break outside the $79.3K – $80.8K daily range.
💡 Trade Setup & Strategic Scenarios:
* Bullish Scenario (Relief Bounce):
If BTC holds above $79,368 and reclaims $80,573, look for a relief rally toward the MA(7) at $81,431. A sustained daily close above $82,556 (MA25) invalidates short-term bearish pressure and opens targets toward $84,096 – $87,220.
* Bearish Scenario (Breakdown):
A daily close below $79,220 signals further weakness. The next downside target rests at structural support around $77,050,
👇 Community Discussion:
Will $BTC defend the $79.3K floor for a morning rally, or are we visiting $77K before the next leg up? Share your trade setups below! 👇
📌 Follow @Ashi Noor | Analyst for daily chart breakdowns, high-impact alpha, and actionable market updates!
#BinanceSquare #Bitcoin #BTC #CryptoTrading
2
1
149
#BinancePick 🏆 Think Your Market Picks Never Miss? Prove It with Binance Pick! 💛 (1,000,000 $USDC
{spot}(USDCUSDT)
Pool Live)
If you have been following my technical breakdowns and chart setups, now is the time to put your prediction skills to the ultimate test! Binance has officially launched Binance Pick—a massive prediction competition with up to 1,000,000 $USDC in rewards!
Whether you analyze daily breakouts, moving average compression, or macro market trends, every prediction is a new opportunity to demonstrate your market edge and climb the leaderboard.
🔑 Quick Campaign Breakdown & Reward Pool Split:
* 🏆 Season Leaderboard (500,000 USDC Pool): Distributed among the top 20,000 ranked participants by the end of the campaign.
* ⚡ Weekly Leaderboards (400,000 USDC Total): 100,000 USDC allocated each week for top rankers with positive market predictions.
* 🎁 Participation Pool (100,000 USDC Pool): Simply complete at least 5 daily check-ins during the campaign period to earn up to 5 USDC, even if you don't land on the main leaderboards!
💡 My Winning Strategy for Binance Pick:
* Daily Consistency: Complete your daily check-in tasks to stack campaign Scores consistently.
* High-Probability Setups: Don't gamble blindly. Focus your predictions on high-conviction assets with clear technical structures (reclaiming key MAs, volume breakout confirmation).
* Task Multipliers: Complete trade and content tasks to maximize your Score accumulation.
👇 Community Discussion:
Are you competing in the Binance Pick Leaderboard this season? What's your top market prediction for this week—bullish continuation or a healthy retest? Drop your strategy below! 👇
📌 Follow @Ashi Noor | Analyst for daily chart setups, high-impact alpha, and market updates to power your predictions!
#BinancePick #BinanceSquare #CryptoRewards #TechnicalAnalysis #1MUSDC
#BinancePick 🏆 Think Your Market Picks Never Miss? Prove It with Binance Pick! 💛 (1,000,000 $USDC
Pool Live)
If you have been following my technical breakdowns and chart setups, now is the time to put your prediction skills to the ultimate test! Binance has officially launched Binance Pick—a massive prediction competition with up to 1,000,000 $USDC in rewards!
Whether you analyze daily breakouts, moving average compression, or macro market trends, every prediction is a new opportunity to demonstrate your market edge and climb the leaderboard.
🔑 Quick Campaign Breakdown & Reward Pool Split:
* 🏆 Season Leaderboard (500,000 USDC Pool): Distributed among the top 20,000 ranked participants by the end of the campaign.
* ⚡ Weekly Leaderboards (400,000 USDC Total): 100,000 USDC allocated each week for top rankers with positive market predictions.
* 🎁 Participation Pool (100,000 USDC Pool): Simply complete at least 5 daily check-ins during the campaign period to earn up to 5 USDC, even if you don't land on the main leaderboards!
💡 My Winning Strategy for Binance Pick:
* Daily Consistency: Complete your daily check-in tasks to stack campaign Scores consistently.
* High-Probability Setups: Don't gamble blindly. Focus your predictions on high-conviction assets with clear technical structures (reclaiming key MAs, volume breakout confirmation).
* Task Multipliers: Complete trade and content tasks to maximize your Score accumulation.
👇 Community Discussion:
Are you competing in the Binance Pick Leaderboard this season? What's your top market prediction for this week—bullish continuation or a healthy retest? Drop your strategy below! 👇
📌 Follow @Ashi Noor | Analyst for daily chart setups, high-impact alpha, and market updates to power your predictions!
#BinancePick #BinanceSquare #CryptoRewards #TechnicalAnalysis #1MUSDC

42
තවත් අන්තර්ගතයන් ගවේෂණය කිරීමට ඇතුල් වන්න
Binance චතුරශ්රය හි ගෝලීය ක්රිප්ටෝ පරිශීලකයින් හා එක්වන්න
⚡️ ක්රිප්ටෝ පිළිබඳ නවතම සහ ප්රයෝජනවත් තොරතුරු ලබා ගන්න.
💬 ලොව විශාලතම ක්රිප්ටෝ හුවමාරුව මගින් විශ්වාස කෙරේ.
👍 සත්යායනය කරන ලද නිර්මාණකරුවන්ගෙන් සැබෑ විදසුන් සොයා ගන්න.
විද්යුත් තැපෑල / දුරකථන අංකය