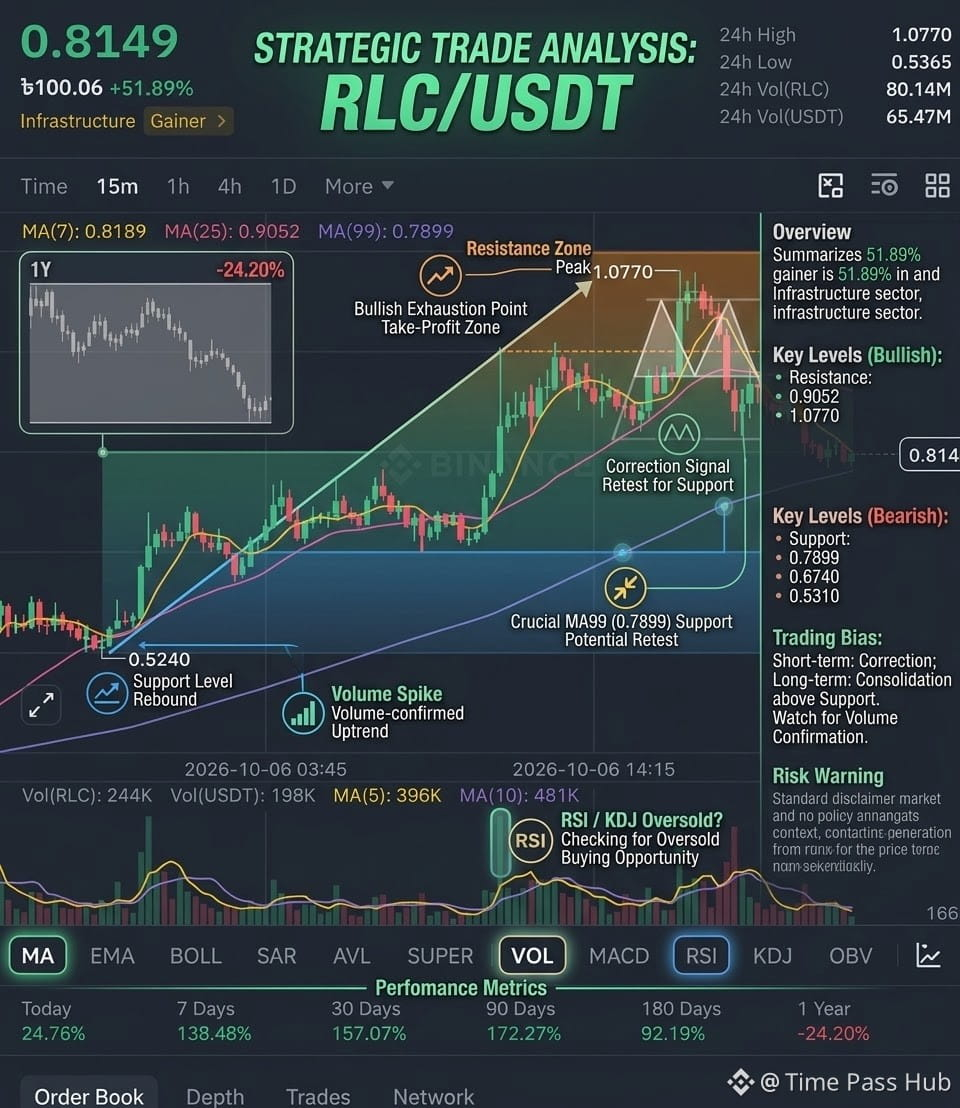
The $RLC /USDT chart shows a strong rally followed by a corrective pull-back toward major moving average support.
Here is a technical analysis breakdown of the current 15-minute chart:
* Price Action & Trend: The asset surged from a low of 0.5240 to a 24-hour high of 1.0770 (+51.89% overall gains) before entering a sharp retracement. It is currently trading around 0.8149.
* Moving Averages (MA):
* Short-Term Weakness: The price has fallen below the 7-period MA (0.8189) and 25-period MA (0.9052), signaling a loss of short-term bullish momentum.
* Major Support: The price is consolidating directly above the long-term 99-period MA (0.7899), which acts as critical dynamic support.
* Volume Analysis: Trading volume spiked heavily during the expansion phases up to the 1.0770 peak, but volume has dropped significantly during the current downward movement. Decreasing volume on a sell-off suggests diminishing selling pressure.
* Key Levels to Watch:
* Support: 0.7899 (MA 99) and 0.6740. A break below 0.7899 could signal a deeper correction.
* Resistance: 0.9052 (MA 25) and 1.0770 (24h High). A reclaim of 0.9052 would be necessary to re-ignite bullish momentum.
#Binance #analysis #MarketAnalysis #Write2Earn #TradingSignals $RLC
$NMR
Here is a technical analysis breakdown of the current 15-minute chart:
* Price Action & Trend: The asset surged from a low of 0.5240 to a 24-hour high of 1.0770 (+51.89% overall gains) before entering a sharp retracement. It is currently trading around 0.8149.
* Moving Averages (MA):
* Short-Term Weakness: The price has fallen below the 7-period MA (0.8189) and 25-period MA (0.9052), signaling a loss of short-term bullish momentum.
* Major Support: The price is consolidating directly above the long-term 99-period MA (0.7899), which acts as critical dynamic support.
* Volume Analysis: Trading volume spiked heavily during the expansion phases up to the 1.0770 peak, but volume has dropped significantly during the current downward movement. Decreasing volume on a sell-off suggests diminishing selling pressure.
* Key Levels to Watch:
* Support: 0.7899 (MA 99) and 0.6740. A break below 0.7899 could signal a deeper correction.
* Resistance: 0.9052 (MA 25) and 1.0770 (24h High). A reclaim of 0.9052 would be necessary to re-ignite bullish momentum.
#Binance #analysis #MarketAnalysis #Write2Earn #TradingSignals $RLC
$NMR