
bullet 0
10k පෝස්ටු

bullet 0
 චතුරශ්රය සත්යාපිත
වාර්තා කරන්න
පරිශීලක අවහිර කරන්න
විවෘත වෙළෙඳාම
නිතර වෙළෙන්දා
{වේලාව} වසර
728 හඹා යමින්
30.7K+ හඹා යන්නන්
20.4K+ කැමති විය
පෝස්ටු
ආයෝජන කළඹ
සියල්ල
උපුටා දැක්වීම්
වීඩියෝ
·
--
🚀 $ICNT — Momentum Building!
$ICNT is trading at $0.43419, up +29.33% over the last 24 hours. Buyers are showing strength, putting this coin on the market radar.
Can the momentum continue?
🚀 $ICNT — Momentum Building!
$ICNT is trading at $0.43419, up +29.33% over the last 24 hours. Buyers are showing strength, putting this coin on the market radar.
Can the momentum continue?
$ICNT is trading at $0.43419, up +29.33% over the last 24 hours. Buyers are showing strength, putting this coin on the market radar.
Can the momentum continue?
173
·
--
🚀 $EVAA — Strong Momentum!
$EVAA is gaining attention with a +37.54% daily surge, currently trading at $5.5615. Buyers are showing strength. Can bulls push it higher?
Keep an eye on $EVAA
{future}(EVAAUSDT)
🚀 $EVAA — Strong Momentum!
$EVAA is gaining attention with a +37.54% daily surge, currently trading at $5.5615. Buyers are showing strength. Can bulls push it higher?
Keep an eye on $EVAA
$EVAA is gaining attention with a +37.54% daily surge, currently trading at $5.5615. Buyers are showing strength. Can bulls push it higher?
Keep an eye on $EVAA
77
·
--
🔥 $VINE — Bulls Are Back!
$VINE is making a strong move, trading at $0.0103 with a +50.36% gain in 24 hours. Buying pressure is building, and traders are watching closely for the next move.
Let's watch $VINE
{alpha}(CT_5016AJcP7wuLwmRYLBNbi825wgguaPsWzPBEHcHndpRpump)
🔥 $VINE — Bulls Are Back!
$VINE is making a strong move, trading at $0.0103 with a +50.36% gain in 24 hours. Buying pressure is building, and traders are watching closely for the next move.
Let's watch $VINE
$VINE is making a strong move, trading at $0.0103 with a +50.36% gain in 24 hours. Buying pressure is building, and traders are watching closely for the next move.
Let's watch $VINE
245
·
--
උසබ තත්ත්වය
🚀 $ESIM — Massive Move!
$ESIM is leading the gainers with an impressive +65.68% surge in 24 hours, currently trading at $0.02825. Buyers are showing strong interest. Can this momentum continue?
Keep watching $ESIM
{alpha}(560x7765a659c5b0cfbfd9fbc2ef2298b75a598f2d2d)
🚀 $ESIM — Massive Move!
$ESIM is leading the gainers with an impressive +65.68% surge in 24 hours, currently trading at $0.02825. Buyers are showing strong interest. Can this momentum continue?
Keep watching $ESIM
$ESIM is leading the gainers with an impressive +65.68% surge in 24 hours, currently trading at $0.02825. Buyers are showing strong interest. Can this momentum continue?
Keep watching $ESIM
375
·
--
උසබ තත්ත්වය
$HYPE — I'm watching this recovery closely.
HYPE is trading around 68.786 (+0.09%) on the 4H chart after a prolonged downtrend from the 90.824 area. What caught my attention is the strong reaction from the 60.063 low. Buyers have stepped in, and price is now trying to build a recovery structure.
The immediate resistance is around 68.992. A clean breakout above this area could bring fresh buying pressure. On the downside, 65.081 is the key support to watch, while 60.063 remains the major low.
I'm not chasing every green candle here. I want to see buyers defend support and price establish strength above resistance before looking for a stronger move.
The recovery is encouraging, but confirmation still matters. Always use a stop loss and manage your risk.
Let's watch how $HYPE plays out. 📊
#BTCRemainsUnderPressureAfterHawkishFOMCMinutes
#NvidiaBoardReportedlySplitOverHuang’sReturn
#CanGTA6'sLaunchLiftTTWOShares?
#Solana2027RoadmapTargetsDoubleComputeCapacity
{spot}(HYPEUSDT)
$HYPE — I'm watching this recovery closely.
HYPE is trading around 68.786 (+0.09%) on the 4H chart after a prolonged downtrend from the 90.824 area. What caught my attention is the strong reaction from the 60.063 low. Buyers have stepped in, and price is now trying to build a recovery structure.
The immediate resistance is around 68.992. A clean breakout above this area could bring fresh buying pressure. On the downside, 65.081 is the key support to watch, while 60.063 remains the major low.
I'm not chasing every green candle here. I want to see buyers defend support and price establish strength above resistance before looking for a stronger move.
The recovery is encouraging, but confirmation still matters. Always use a stop loss and manage your risk.
Let's watch how $HYPE plays out. 📊
#BTCRemainsUnderPressureAfterHawkishFOMCMinutes
#NvidiaBoardReportedlySplitOverHuang’sReturn
#CanGTA6'sLaunchLiftTTWOShares?
#Solana2027RoadmapTargetsDoubleComputeCapacity
HYPE is trading around 68.786 (+0.09%) on the 4H chart after a prolonged downtrend from the 90.824 area. What caught my attention is the strong reaction from the 60.063 low. Buyers have stepped in, and price is now trying to build a recovery structure.
The immediate resistance is around 68.992. A clean breakout above this area could bring fresh buying pressure. On the downside, 65.081 is the key support to watch, while 60.063 remains the major low.
I'm not chasing every green candle here. I want to see buyers defend support and price establish strength above resistance before looking for a stronger move.
The recovery is encouraging, but confirmation still matters. Always use a stop loss and manage your risk.
Let's watch how $HYPE plays out. 📊
#BTCRemainsUnderPressureAfterHawkishFOMCMinutes
#NvidiaBoardReportedlySplitOverHuang’sReturn
#CanGTA6'sLaunchLiftTTWOShares?
#Solana2027RoadmapTargetsDoubleComputeCapacity

232
·
--
$BTC
I'm watching Bitcoin closely on the 4H chart. The bigger picture is still bearish, with BTC dropping from $81,195.7 to a recent low of $61,999.1. What caught my attention is the small recovery we're seeing around $63,876.8, but buyers still need to prove they can take control.
Support around $61,999.1 is the key level I'm watching. On the upside, $64,087.3 is the immediate resistance to overcome.
A clean breakout could open the door toward $66,798.2, but rejection here could bring selling pressure back.
I don't want to chase every green candle.
I'll be watching for stronger buying volume and a confirmed breakout before considering a bullish move. Until then, patience is important.
Always use a stop loss and manage your risk. Protecting capital comes first.
$BTC 📊
$BTC
I'm watching Bitcoin closely on the 4H chart. The bigger picture is still bearish, with BTC dropping from $81,195.7 to a recent low of $61,999.1. What caught my attention is the small recovery we're seeing around $63,876.8, but buyers still need to prove they can take control.
Support around $61,999.1 is the key level I'm watching. On the upside, $64,087.3 is the immediate resistance to overcome.
A clean breakout could open the door toward $66,798.2, but rejection here could bring selling pressure back.
I don't want to chase every green candle.
I'll be watching for stronger buying volume and a confirmed breakout before considering a bullish move. Until then, patience is important.
Always use a stop loss and manage your risk. Protecting capital comes first.
$BTC 📊
I'm watching Bitcoin closely on the 4H chart. The bigger picture is still bearish, with BTC dropping from $81,195.7 to a recent low of $61,999.1. What caught my attention is the small recovery we're seeing around $63,876.8, but buyers still need to prove they can take control.
Support around $61,999.1 is the key level I'm watching. On the upside, $64,087.3 is the immediate resistance to overcome.
A clean breakout could open the door toward $66,798.2, but rejection here could bring selling pressure back.
I don't want to chase every green candle.
I'll be watching for stronger buying volume and a confirmed breakout before considering a bullish move. Until then, patience is important.
Always use a stop loss and manage your risk. Protecting capital comes first.
$BTC 📊
96
·
--
උසබ තත්ත්වය
$NEAR — Buyers Are Back, But One Important Resistance Stands in Their Way
NEAR is starting to look interesting again. Price has climbed to around $3.254, gaining 1.97%, and the latest move shows buyers coming back with much stronger momentum.
What I like about this setup is the recovery from the lower price levels. NEAR spent quite some time moving sideways before sellers pushed it down toward the $3.12–$3.15 area. Instead of continuing lower, buyers stepped in and gradually took control. The latest candles show a much stronger push toward the $3.286 high.
For me, the next important level is $3.286. This is where I want to see how buyers react. A clean break above it, followed by a successful retest, would make the bullish picture more convincing. If that happens, NEAR could have room to continue its recovery.
I'm also keeping an eye on the downside. The $3.240 area is the first level to watch, while $3.194 is another important support. If price falls back below these areas, the current momentum could start losing strength.
I haven't confirmed any personal entry, so I'm watching this opportunity rather than claiming an active position. I also want to see the 4H and daily charts, along with EMA and MACD confirmation, before making a stronger prediction about the bigger trend.
Overall, I like the way NEAR is recovering, but I don't want to get carried away by a few strong green candles. The real test is whether buyers can break $3.286 and hold above it. That's what I'll be watching next. A confirmed breakout could make things much more interesting for NEAR.
#AnthropicIPOTestsInvestorAppetiteForAI
#WhatInvestmentSignalsDo13FFilingsReveal?
#OPTIMJACKAttackInfectsAtLeast186Websites
#BitcoinExtendsLosingStreakToSixWeeks
$NEAR — Buyers Are Back, But One Important Resistance Stands in Their Way
NEAR is starting to look interesting again. Price has climbed to around $3.254, gaining 1.97%, and the latest move shows buyers coming back with much stronger momentum.
What I like about this setup is the recovery from the lower price levels. NEAR spent quite some time moving sideways before sellers pushed it down toward the $3.12–$3.15 area. Instead of continuing lower, buyers stepped in and gradually took control. The latest candles show a much stronger push toward the $3.286 high.
For me, the next important level is $3.286. This is where I want to see how buyers react. A clean break above it, followed by a successful retest, would make the bullish picture more convincing. If that happens, NEAR could have room to continue its recovery.
I'm also keeping an eye on the downside. The $3.240 area is the first level to watch, while $3.194 is another important support. If price falls back below these areas, the current momentum could start losing strength.
I haven't confirmed any personal entry, so I'm watching this opportunity rather than claiming an active position. I also want to see the 4H and daily charts, along with EMA and MACD confirmation, before making a stronger prediction about the bigger trend.
Overall, I like the way NEAR is recovering, but I don't want to get carried away by a few strong green candles. The real test is whether buyers can break $3.286 and hold above it. That's what I'll be watching next. A confirmed breakout could make things much more interesting for NEAR.
#AnthropicIPOTestsInvestorAppetiteForAI
#WhatInvestmentSignalsDo13FFilingsReveal?
#OPTIMJACKAttackInfectsAtLeast186Websites
#BitcoinExtendsLosingStreakToSixWeeks
NEAR is starting to look interesting again. Price has climbed to around $3.254, gaining 1.97%, and the latest move shows buyers coming back with much stronger momentum.
What I like about this setup is the recovery from the lower price levels. NEAR spent quite some time moving sideways before sellers pushed it down toward the $3.12–$3.15 area. Instead of continuing lower, buyers stepped in and gradually took control. The latest candles show a much stronger push toward the $3.286 high.
For me, the next important level is $3.286. This is where I want to see how buyers react. A clean break above it, followed by a successful retest, would make the bullish picture more convincing. If that happens, NEAR could have room to continue its recovery.
I'm also keeping an eye on the downside. The $3.240 area is the first level to watch, while $3.194 is another important support. If price falls back below these areas, the current momentum could start losing strength.
I haven't confirmed any personal entry, so I'm watching this opportunity rather than claiming an active position. I also want to see the 4H and daily charts, along with EMA and MACD confirmation, before making a stronger prediction about the bigger trend.
Overall, I like the way NEAR is recovering, but I don't want to get carried away by a few strong green candles. The real test is whether buyers can break $3.286 and hold above it. That's what I'll be watching next. A confirmed breakout could make things much more interesting for NEAR.
#AnthropicIPOTestsInvestorAppetiteForAI
#WhatInvestmentSignalsDo13FFilingsReveal?
#OPTIMJACKAttackInfectsAtLeast186Websites
#BitcoinExtendsLosingStreakToSixWeeks
1
496
·
--
BTC, BNB & ETH are three major players to watch! 🚀
All eyes are on these giants as traders look for the next big move. A strong breakout could bring fresh bullish momentum, while key support levels remain crucial.
Stay alert, manage risk, and watch the charts closely. The next opportunity could be closer than you think! 🔥
Let's go $BTC $BNB $ETH 🚀
BTC, BNB & ETH are three major players to watch! 🚀
All eyes are on these giants as traders look for the next big move. A strong breakout could bring fresh bullish momentum, while key support levels remain crucial.
Stay alert, manage risk, and watch the charts closely. The next opportunity could be closer than you think! 🔥
Let's go $BTC $BNB $ETH 🚀
All eyes are on these giants as traders look for the next big move. A strong breakout could bring fresh bullish momentum, while key support levels remain crucial.
Stay alert, manage risk, and watch the charts closely. The next opportunity could be closer than you think! 🔥
Let's go $BTC $BNB $ETH 🚀
$BTC 🚀 Bulls, wake up!
37%
$BNB 🔥 Ready to fly!
5%
$ETH 📈 Next move loading!
58%
19 ඡන්ද • ඡන්දය අවසන්
450
·
--
$ETH — Ethereum Holds Its Recovery Structure as Buyers Defend the $1,809 Support Zone
Ethereum is trading around $1,818.50 after recovering from a sharp intraday decline toward $1,773.09. Despite remaining slightly negative by 0.12%, ETH is showing signs of stabilization following its rebound from the lower end of the visible 24-hour range. The important development is that buyers have managed to bring price back above the $1,809 area, although the market still needs stronger momentum to challenge higher resistance.
Looking at the available 15-minute chart, ETH initially experienced considerable selling pressure before attracting buyers near $1,773.09. That recovery pushed price toward the $1,845.30 session high, but sellers subsequently prevented a sustained breakout. Since then, ETH has been moving through a consolidation structure, with repeated attempts to establish direction around the $1,818–$1,827 region.
My immediate focus is the $1,809.19 support area. Maintaining this level could help buyers preserve the current recovery structure. Below it, $1,791.14 becomes an important downside reference, while losing the $1,773.09 low would significantly weaken the recovery thesis.
On the upside, $1,827.24 is the first important resistance visible on the chart. Buyers need to reclaim this region with a convincing 15-minute candle close and demonstrate follow-through through a successful retest. If that happens, ETH could challenge $1,845.30 again. A decisive breakout above the session high would provide a stronger bullish signal, although additional resistance must be established before projecting higher targets.
There is no confirmed executed entry or open position provided, so I am treating this strictly as a technical market setup rather than reporting trade performance. The screenshot also does not provide four-hour or daily candles, EMA7, EMA21, or MACD readings, so broader trend confirmation remains unverified.
#CryptoSelloffTriggersMultipleWhaleLiquidations
#WillFOMCMinutesReinforceRateHikeExpectations?
$ETH — Ethereum Holds Its Recovery Structure as Buyers Defend the $1,809 Support Zone
Ethereum is trading around $1,818.50 after recovering from a sharp intraday decline toward $1,773.09. Despite remaining slightly negative by 0.12%, ETH is showing signs of stabilization following its rebound from the lower end of the visible 24-hour range. The important development is that buyers have managed to bring price back above the $1,809 area, although the market still needs stronger momentum to challenge higher resistance.
Looking at the available 15-minute chart, ETH initially experienced considerable selling pressure before attracting buyers near $1,773.09. That recovery pushed price toward the $1,845.30 session high, but sellers subsequently prevented a sustained breakout. Since then, ETH has been moving through a consolidation structure, with repeated attempts to establish direction around the $1,818–$1,827 region.
My immediate focus is the $1,809.19 support area. Maintaining this level could help buyers preserve the current recovery structure. Below it, $1,791.14 becomes an important downside reference, while losing the $1,773.09 low would significantly weaken the recovery thesis.
On the upside, $1,827.24 is the first important resistance visible on the chart. Buyers need to reclaim this region with a convincing 15-minute candle close and demonstrate follow-through through a successful retest. If that happens, ETH could challenge $1,845.30 again. A decisive breakout above the session high would provide a stronger bullish signal, although additional resistance must be established before projecting higher targets.
There is no confirmed executed entry or open position provided, so I am treating this strictly as a technical market setup rather than reporting trade performance. The screenshot also does not provide four-hour or daily candles, EMA7, EMA21, or MACD readings, so broader trend confirmation remains unverified.
#CryptoSelloffTriggersMultipleWhaleLiquidations
#WillFOMCMinutesReinforceRateHikeExpectations?
Ethereum is trading around $1,818.50 after recovering from a sharp intraday decline toward $1,773.09. Despite remaining slightly negative by 0.12%, ETH is showing signs of stabilization following its rebound from the lower end of the visible 24-hour range. The important development is that buyers have managed to bring price back above the $1,809 area, although the market still needs stronger momentum to challenge higher resistance.
Looking at the available 15-minute chart, ETH initially experienced considerable selling pressure before attracting buyers near $1,773.09. That recovery pushed price toward the $1,845.30 session high, but sellers subsequently prevented a sustained breakout. Since then, ETH has been moving through a consolidation structure, with repeated attempts to establish direction around the $1,818–$1,827 region.
My immediate focus is the $1,809.19 support area. Maintaining this level could help buyers preserve the current recovery structure. Below it, $1,791.14 becomes an important downside reference, while losing the $1,773.09 low would significantly weaken the recovery thesis.
On the upside, $1,827.24 is the first important resistance visible on the chart. Buyers need to reclaim this region with a convincing 15-minute candle close and demonstrate follow-through through a successful retest. If that happens, ETH could challenge $1,845.30 again. A decisive breakout above the session high would provide a stronger bullish signal, although additional resistance must be established before projecting higher targets.
There is no confirmed executed entry or open position provided, so I am treating this strictly as a technical market setup rather than reporting trade performance. The screenshot also does not provide four-hour or daily candles, EMA7, EMA21, or MACD readings, so broader trend confirmation remains unverified.
#CryptoSelloffTriggersMultipleWhaleLiquidations
#WillFOMCMinutesReinforceRateHikeExpectations?
143
·
--
උසබ තත්ත්වය
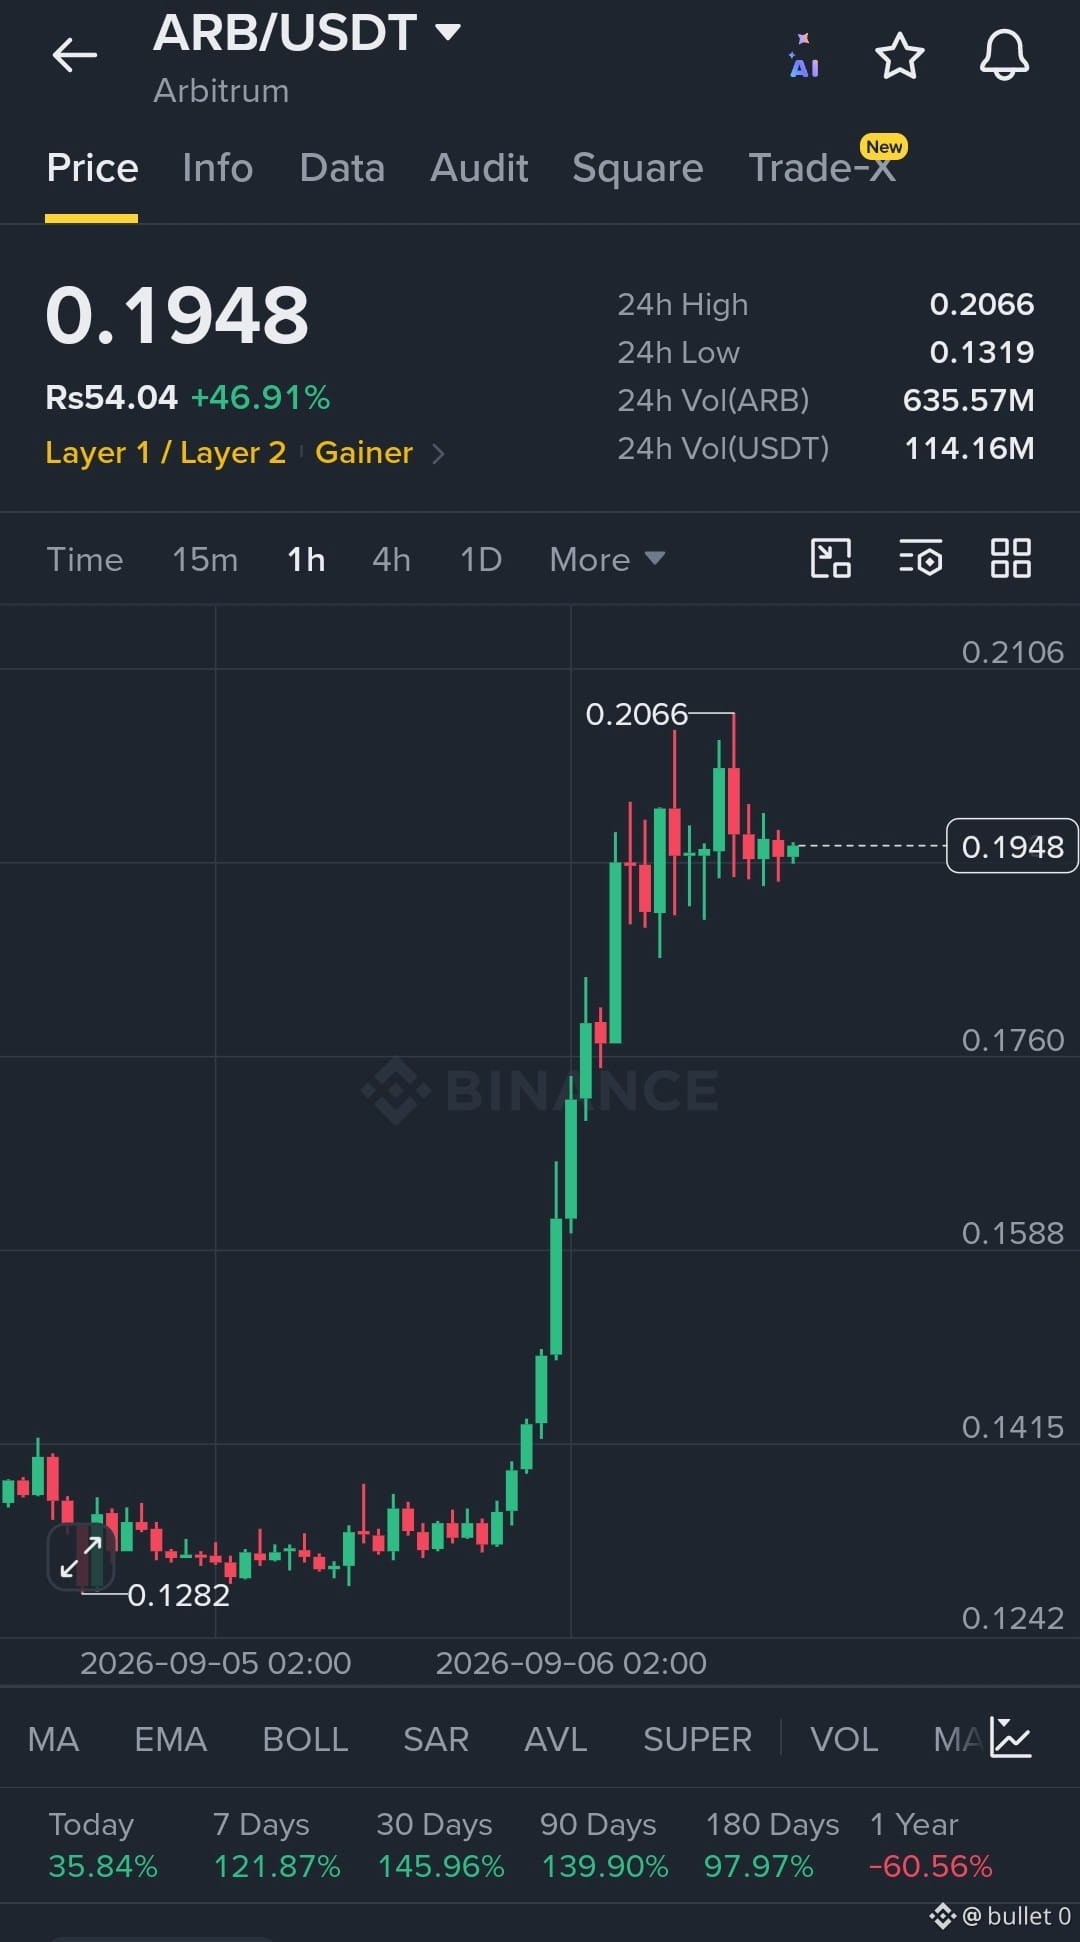
🚨 $ARB /USDT MARKET UPDATE 🚨
ARB is moving FAST — currently around $0.195, up nearly 47% in 24H. The chart shows a strong breakout, but price is now consolidating just below $0.2066 resistance.
🔥 Trade Setup EP: $0.190 – $0.195
🎯 TP1: $0.206
🎯 TP2: $0.220
🎯 TP3: $0.235
🛑 SL: $0.183
⚠️ If $0.2066 breaks with volume, ARB could accelerate higher. If it loses $0.183, bullish momentum weakens significantly.
**Not financial advice — manage risk.**
#RussiaUkraine72-hourCeasefire
#ZEC'sMarketCapSurpassedDOGE
#BitcoinETFsBiggestDailyInflowSinceJanuary
{spot}(ARBUSDT)
🚨 $ARB /USDT MARKET UPDATE 🚨
ARB is moving FAST — currently around $0.195, up nearly 47% in 24H. The chart shows a strong breakout, but price is now consolidating just below $0.2066 resistance.
🔥 Trade Setup EP: $0.190 – $0.195
🎯 TP1: $0.206
🎯 TP2: $0.220
🎯 TP3: $0.235
🛑 SL: $0.183
⚠️ If $0.2066 breaks with volume, ARB could accelerate higher. If it loses $0.183, bullish momentum weakens significantly.
**Not financial advice — manage risk.**
#RussiaUkraine72-hourCeasefire
#ZEC'sMarketCapSurpassedDOGE
#BitcoinETFsBiggestDailyInflowSinceJanuary
ARB is moving FAST — currently around $0.195, up nearly 47% in 24H. The chart shows a strong breakout, but price is now consolidating just below $0.2066 resistance.
🔥 Trade Setup EP: $0.190 – $0.195
🎯 TP1: $0.206
🎯 TP2: $0.220
🎯 TP3: $0.235
🛑 SL: $0.183
⚠️ If $0.2066 breaks with volume, ARB could accelerate higher. If it loses $0.183, bullish momentum weakens significantly.
**Not financial advice — manage risk.**
#RussiaUkraine72-hourCeasefire
#ZEC'sMarketCapSurpassedDOGE
#BitcoinETFsBiggestDailyInflowSinceJanuary
1
148
·
--
උසබ තත්ත්වය
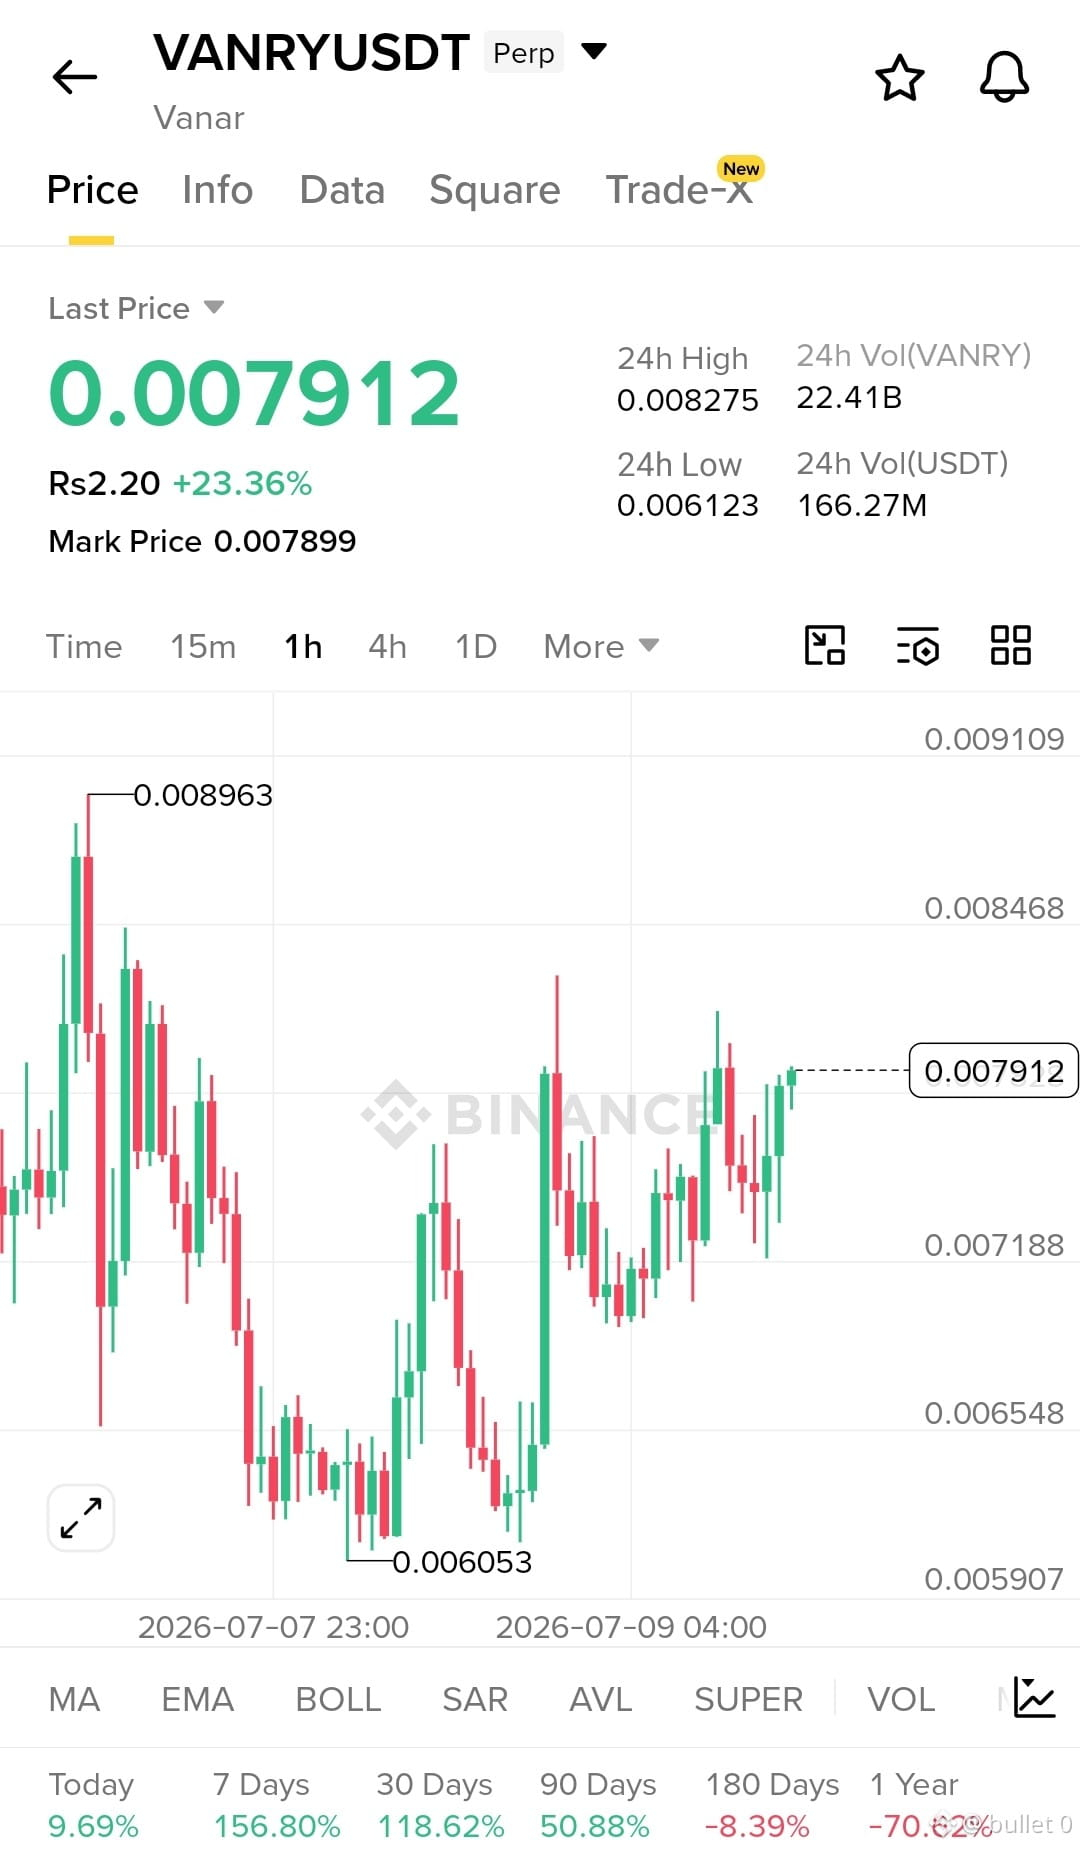
$VANRY /USDT 🚀
Momentum is turning bullish with buyers defending higher lows. A break above nearby resistance could fuel the next move up.
📍 EP: 0.00780–0.00795
🎯 TP1: 0.00820
🎯 TP2: 0.00850
🎯 TP3: 0.00890
🛑 SL: 0.00740
{spot}(VANRYUSDT)
#SKHynixUSIPOSevenTimesOversubscribed
#USIranConflictDay2OilDrops
$VANRY /USDT 🚀
Momentum is turning bullish with buyers defending higher lows. A break above nearby resistance could fuel the next move up.
📍 EP: 0.00780–0.00795
🎯 TP1: 0.00820
🎯 TP2: 0.00850
🎯 TP3: 0.00890
🛑 SL: 0.00740
#SKHynixUSIPOSevenTimesOversubscribed
#USIranConflictDay2OilDrops
Momentum is turning bullish with buyers defending higher lows. A break above nearby resistance could fuel the next move up.
📍 EP: 0.00780–0.00795
🎯 TP1: 0.00820
🎯 TP2: 0.00850
🎯 TP3: 0.00890
🛑 SL: 0.00740
#SKHynixUSIPOSevenTimesOversubscribed
#USIranConflictDay2OilDrops
1
171
·
--
උසබ තත්ත්වය
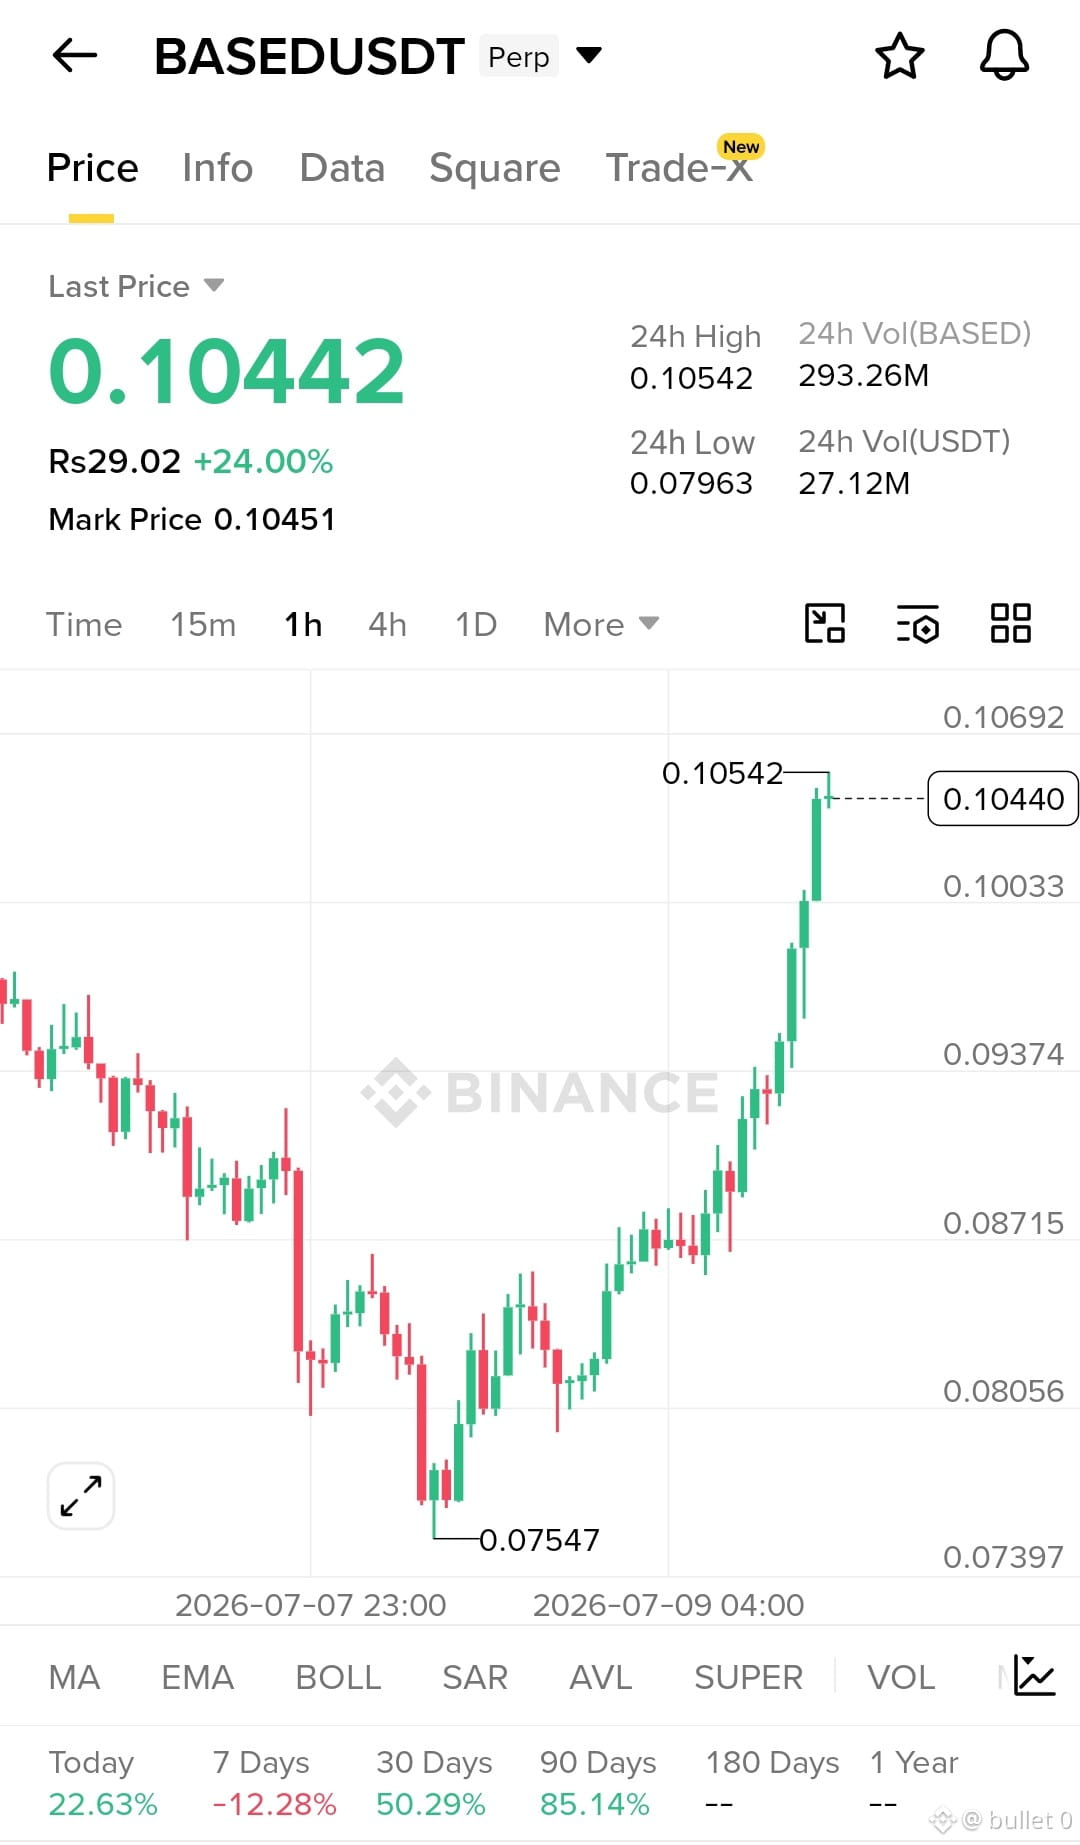
$BASED /USDT 🚀
Strong bullish breakout with buyers firmly in control. Momentum remains positive, and holding above the breakout zone could drive another leg higher.
📍 EP: 0.10350–0.10480
🎯 TP1: 0.10800
🎯 TP2: 0.11200
🎯 TP3: 0.11700
🛑 SL: 0.09900
{future}(BASEDUSDT)
CXMTToOpen$4.3BIPOSubscriptions
#SKHynixUSListingOversubscribed7x
#SonyGetsOCCApprovalForStablecoinTrust
$BASED /USDT 🚀
Strong bullish breakout with buyers firmly in control. Momentum remains positive, and holding above the breakout zone could drive another leg higher.
📍 EP: 0.10350–0.10480
🎯 TP1: 0.10800
🎯 TP2: 0.11200
🎯 TP3: 0.11700
🛑 SL: 0.09900
CXMTToOpen$4.3BIPOSubscriptions
#SKHynixUSListingOversubscribed7x
#SonyGetsOCCApprovalForStablecoinTrust
Strong bullish breakout with buyers firmly in control. Momentum remains positive, and holding above the breakout zone could drive another leg higher.
📍 EP: 0.10350–0.10480
🎯 TP1: 0.10800
🎯 TP2: 0.11200
🎯 TP3: 0.11700
🛑 SL: 0.09900
CXMTToOpen$4.3BIPOSubscriptions
#SKHynixUSListingOversubscribed7x
#SonyGetsOCCApprovalForStablecoinTrust
114
·
--
උසබ තත්ත්වය
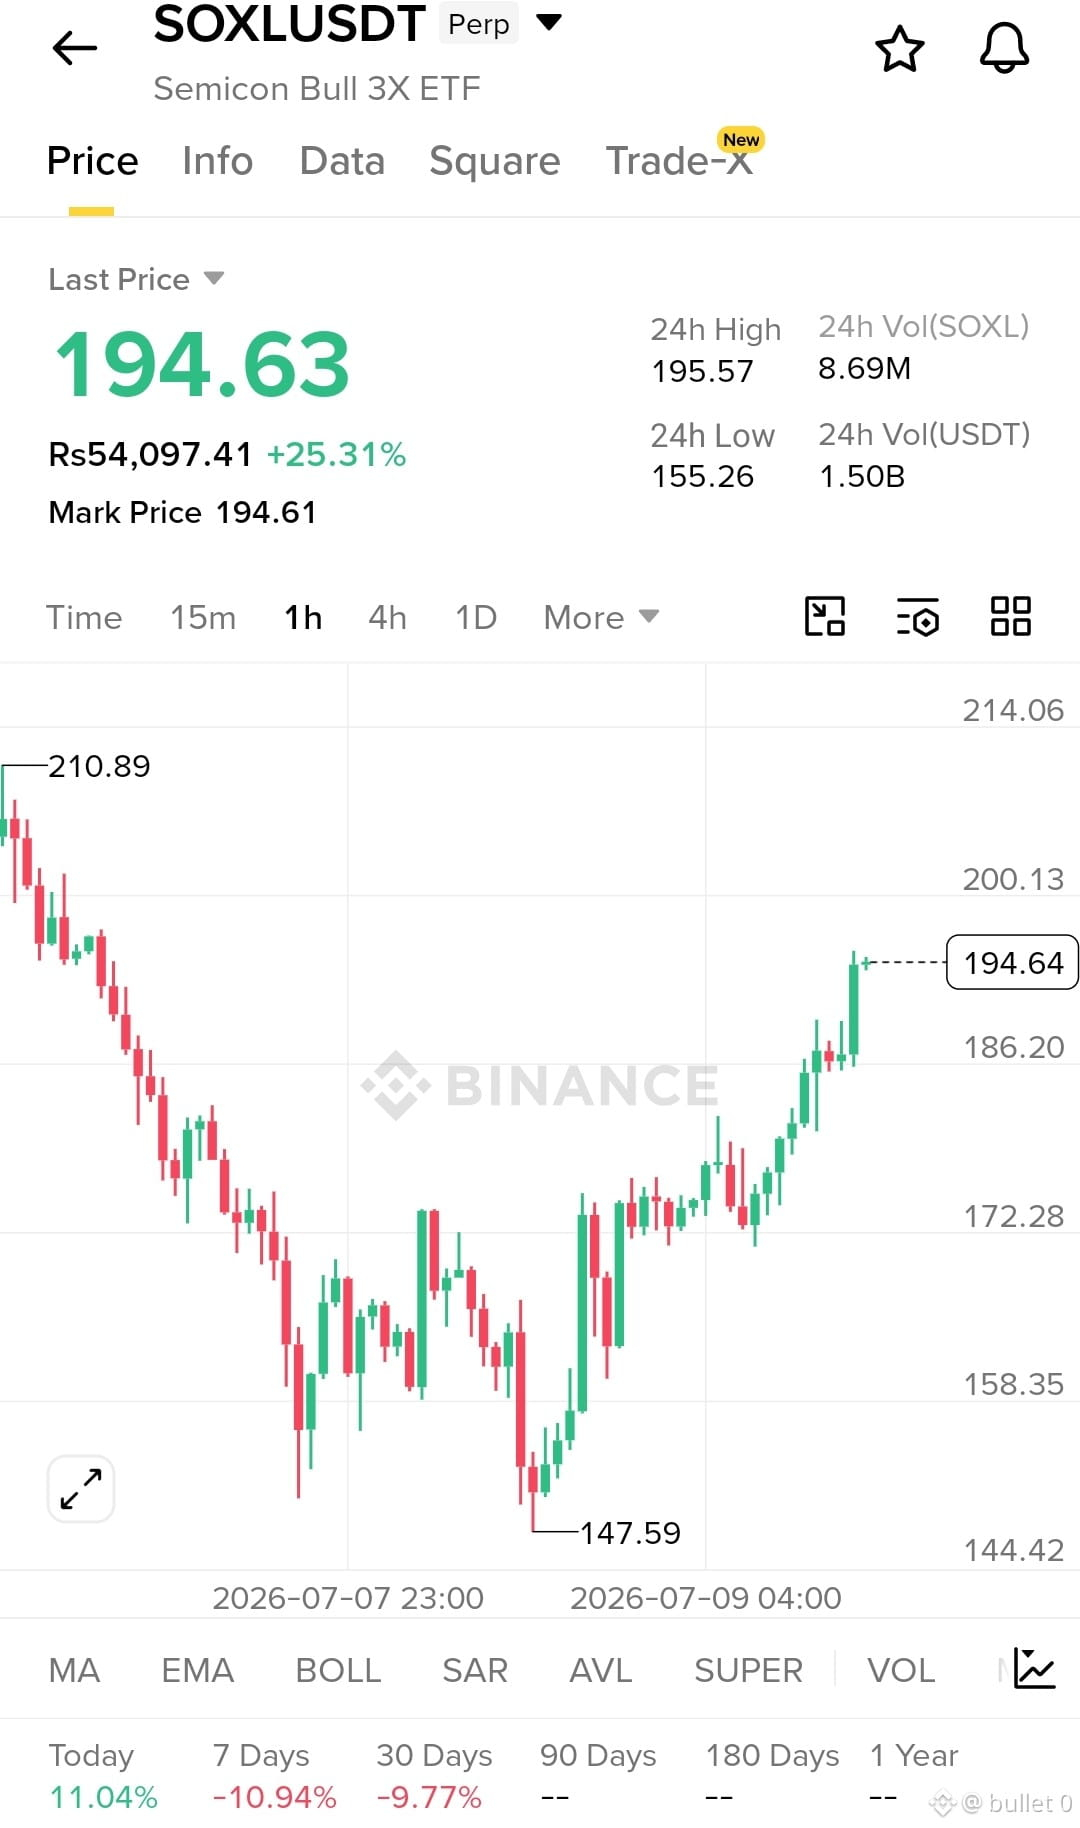
$SOXL /USDT 🚀
Bullish trend remains intact with strong buying momentum and higher highs. Holding above support could extend the rally.
📍 EP: 192.50–195.00
🎯 TP1: 198.00
🎯 TP2: 202.00
🎯 TP3: 208.00
🛑 SL: 186.00
#USIranConflictDay2OilDrops
#SKHynixUSIPOSevenTimesOversubscribed
$SOXL /USDT 🚀
Bullish trend remains intact with strong buying momentum and higher highs. Holding above support could extend the rally.
📍 EP: 192.50–195.00
🎯 TP1: 198.00
🎯 TP2: 202.00
🎯 TP3: 208.00
🛑 SL: 186.00
#USIranConflictDay2OilDrops
#SKHynixUSIPOSevenTimesOversubscribed
Bullish trend remains intact with strong buying momentum and higher highs. Holding above support could extend the rally.
📍 EP: 192.50–195.00
🎯 TP1: 198.00
🎯 TP2: 202.00
🎯 TP3: 208.00
🛑 SL: 186.00
#USIranConflictDay2OilDrops
#SKHynixUSIPOSevenTimesOversubscribed
155
·
--
උසබ තත්ත්වය
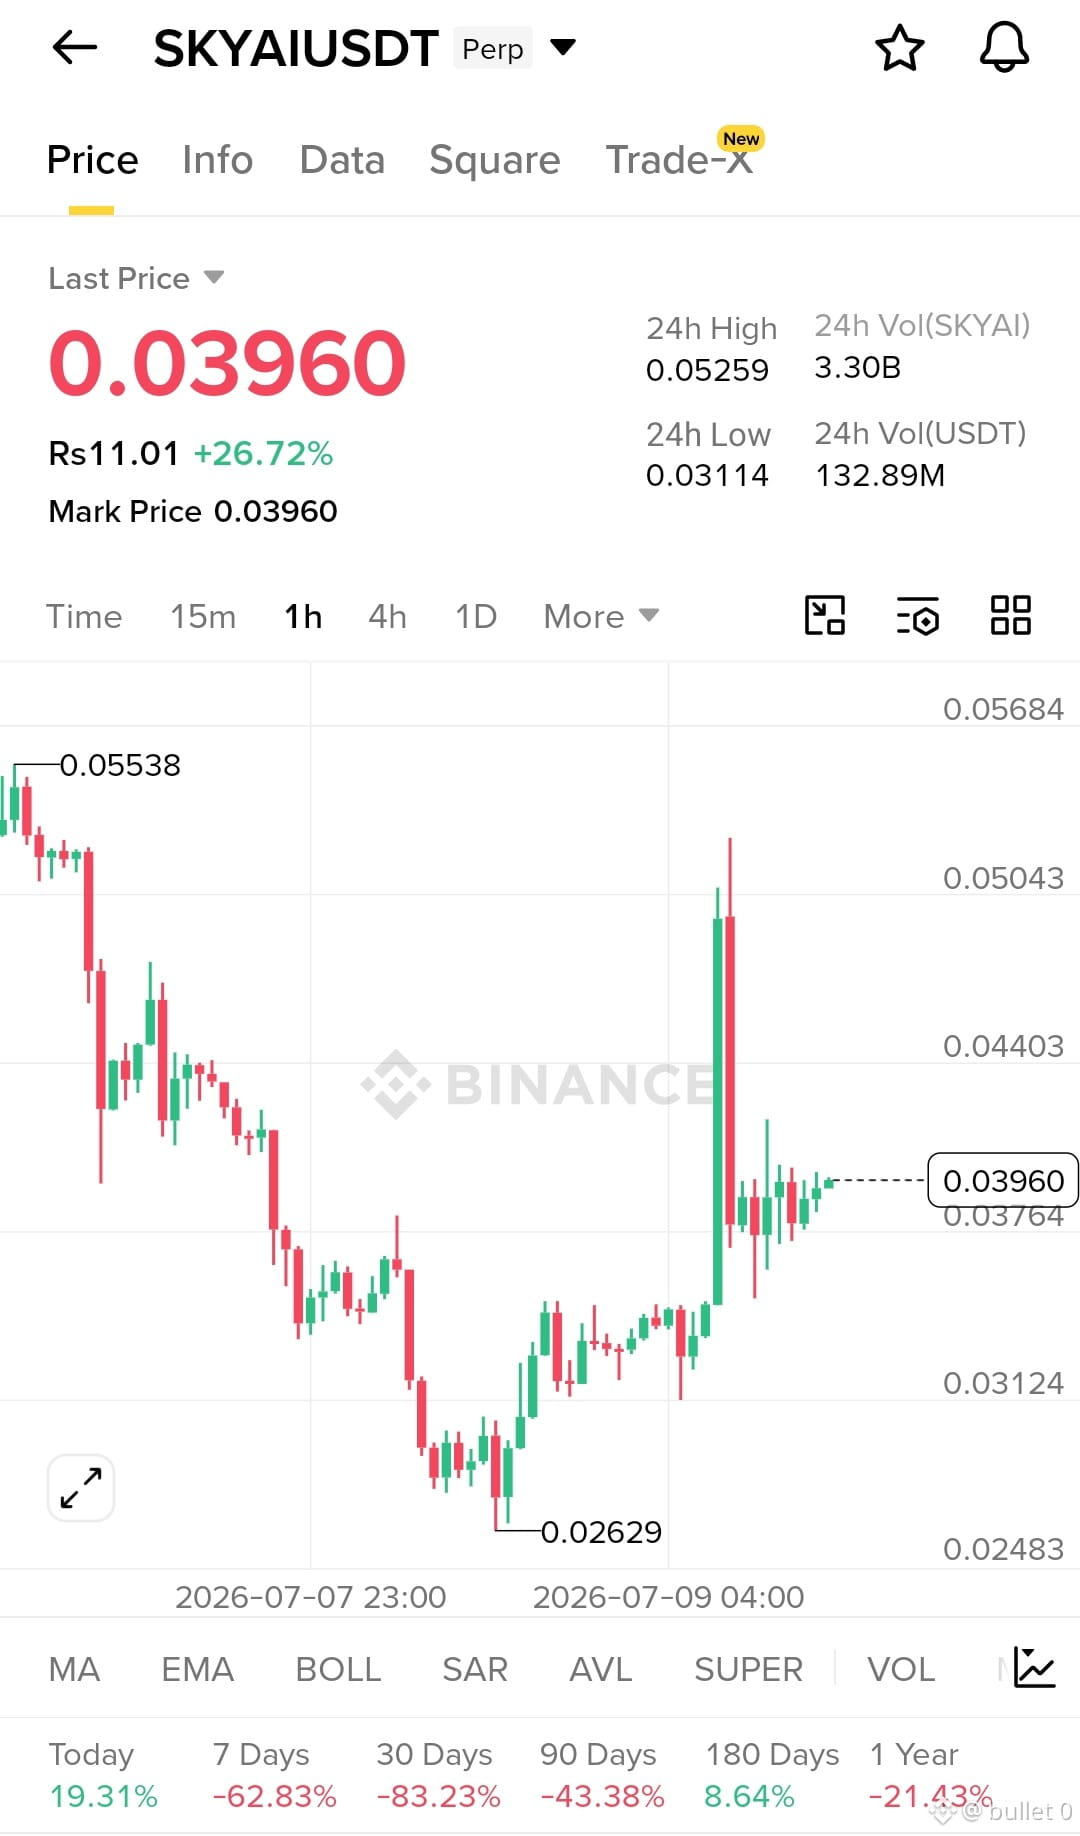
$SKYAI /USDT 🚀
Momentum remains bullish after a strong breakout and healthy consolidation. Holding above support could trigger another push higher.
📍 EP: 0.03900–0.04020
🎯 TP1: 0.04250
🎯 TP2: 0.04550
🎯 TP3: 0.04900
🛑 SL: 0.03680
{future}(SKYAIUSDT)
CXMTToOpen$4.3BIPOSubscriptions
#FedMinutesShowSplitOnRateHikes
#SKHynixUSIPOSevenTimesOversubscribed
#SonyGetsOCCApprovalForStablecoinTrust
$SKYAI /USDT 🚀
Momentum remains bullish after a strong breakout and healthy consolidation. Holding above support could trigger another push higher.
📍 EP: 0.03900–0.04020
🎯 TP1: 0.04250
🎯 TP2: 0.04550
🎯 TP3: 0.04900
🛑 SL: 0.03680
CXMTToOpen$4.3BIPOSubscriptions
#FedMinutesShowSplitOnRateHikes
#SKHynixUSIPOSevenTimesOversubscribed
#SonyGetsOCCApprovalForStablecoinTrust
Momentum remains bullish after a strong breakout and healthy consolidation. Holding above support could trigger another push higher.
📍 EP: 0.03900–0.04020
🎯 TP1: 0.04250
🎯 TP2: 0.04550
🎯 TP3: 0.04900
🛑 SL: 0.03680
CXMTToOpen$4.3BIPOSubscriptions
#FedMinutesShowSplitOnRateHikes
#SKHynixUSIPOSevenTimesOversubscribed
#SonyGetsOCCApprovalForStablecoinTrust
198
·
--
උසබ තත්ත්වය
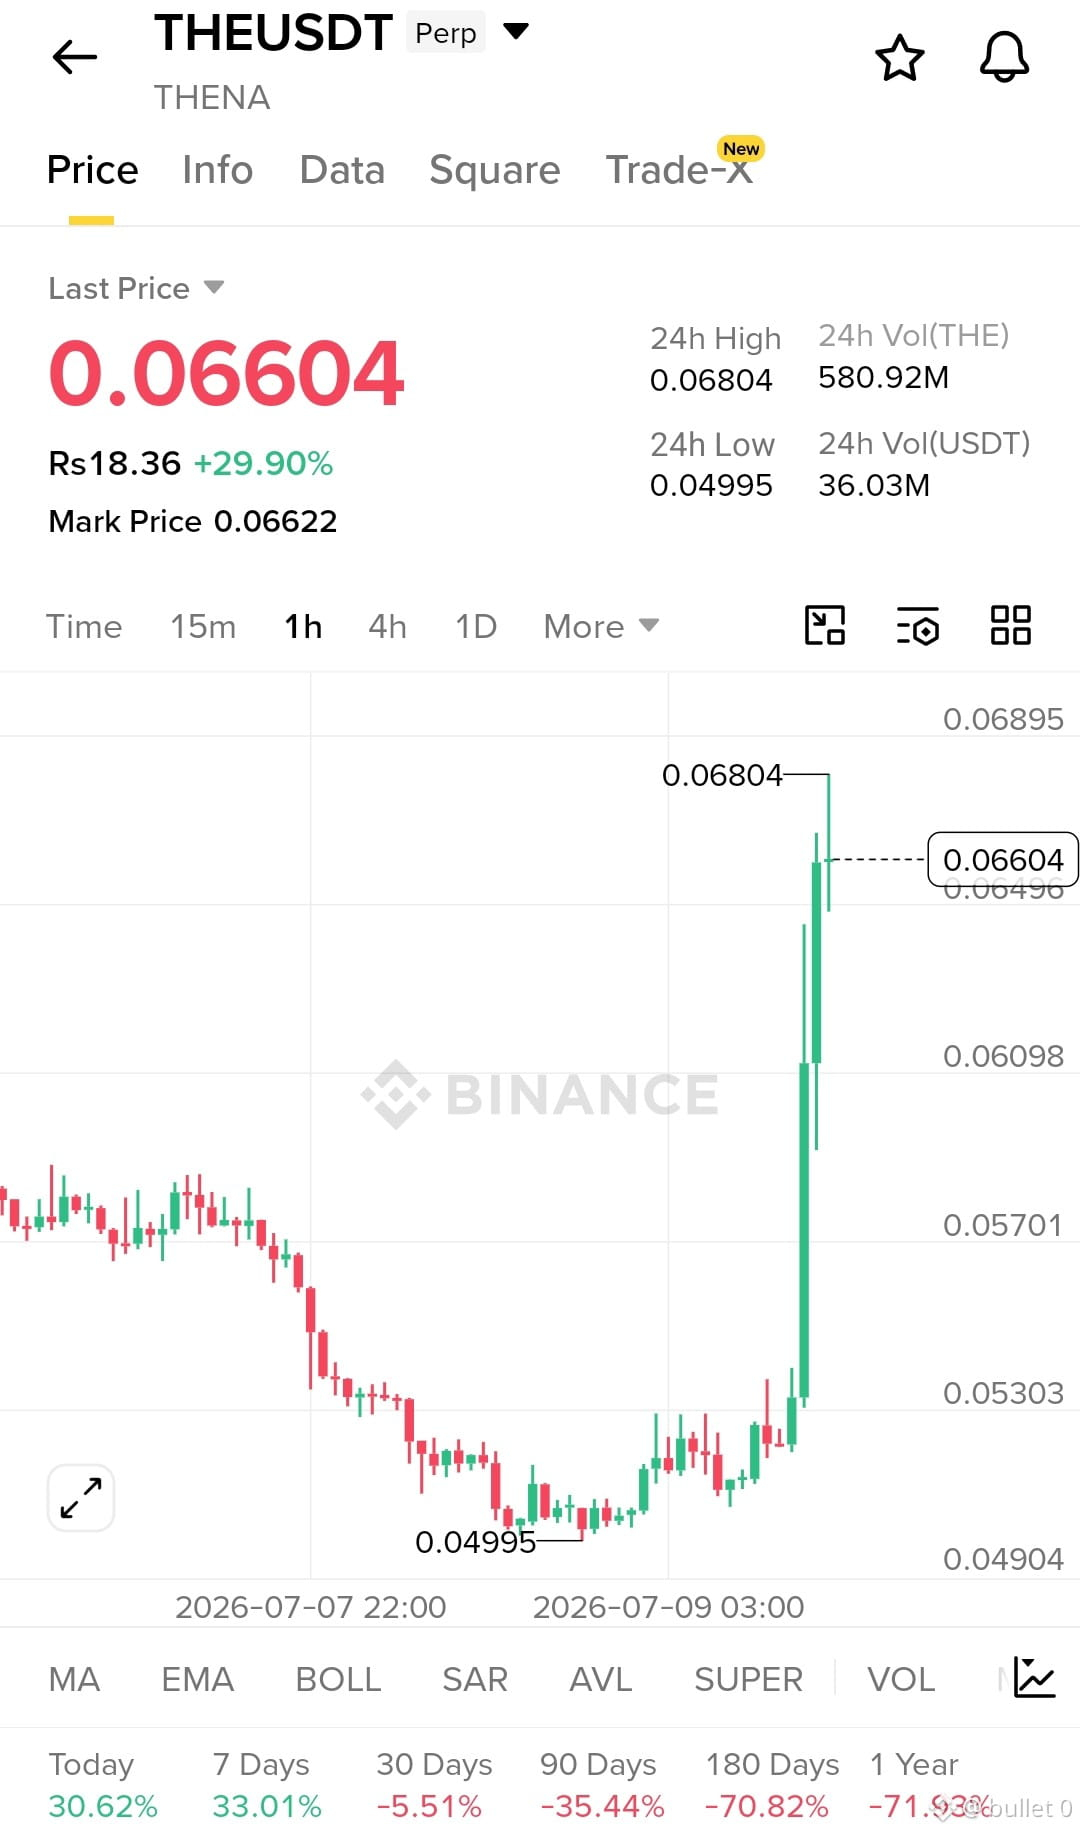
$THE /USDT 🚀
Bullish momentum remains strong after a clean breakout above resistance. Buyers are in control, and holding the breakout zone could fuel the next leg higher.
📍 EP: 0.06480–0.06620
🎯 TP1: 0.06850
🎯 TP2: 0.07100
🎯 TP3: 0.07450
🛑 SL: 0.06180
{spot}(THEUSDT)
#SKHynixUSIPOSevenTimesOversubscribed
#FedMinutesShowSplitOnRateHikes
#FedMinutesShowSplitOnRateHikes
$THE /USDT 🚀
Bullish momentum remains strong after a clean breakout above resistance. Buyers are in control, and holding the breakout zone could fuel the next leg higher.
📍 EP: 0.06480–0.06620
🎯 TP1: 0.06850
🎯 TP2: 0.07100
🎯 TP3: 0.07450
🛑 SL: 0.06180
#SKHynixUSIPOSevenTimesOversubscribed
#FedMinutesShowSplitOnRateHikes
#FedMinutesShowSplitOnRateHikes
Bullish momentum remains strong after a clean breakout above resistance. Buyers are in control, and holding the breakout zone could fuel the next leg higher.
📍 EP: 0.06480–0.06620
🎯 TP1: 0.06850
🎯 TP2: 0.07100
🎯 TP3: 0.07450
🛑 SL: 0.06180
#SKHynixUSIPOSevenTimesOversubscribed
#FedMinutesShowSplitOnRateHikes
#FedMinutesShowSplitOnRateHikes
215
·
--
අර්ධ වශයෙන් සත්යයි
I've been spending more time exploring Polymarket lately, and it's easy to see why so many people are paying attention. Instead of reacting to the news after it happens, the platform lets people trade on what they believe will happen next. It's a different way of looking at information, and that's what makes it so interesting.
The growth has been impressive too. With more than 500K monthly active traders, around 17M monthly website visits, and a projected $18B in trading volume for 2025, it's clear that prediction markets are finding a real place in the Web3 ecosystem.
One thing I've been noticing recently is the growing discussion around $POLY. There still isn't a complete picture, but the excitement is building, and many people are choosing to follow the project early to see where it goes. We've watched communities rally behind tokens like $HYPE , $PENGU , and $DOOD , so it's not surprising that some believe $POLY could become another major story if the momentum keeps growing.
Of course, nothing in crypto is guaranteed, but I've learned that the best opportunities often show up before everyone is talking about them. That's why I'm keeping a close eye on Polymarket and looking forward to seeing how the $POLY ecosystem develops over time.
#Polymarket #POLY #Crypto #Web3 #PredictionMarkets
I've been spending more time exploring Polymarket lately, and it's easy to see why so many people are paying attention. Instead of reacting to the news after it happens, the platform lets people trade on what they believe will happen next. It's a different way of looking at information, and that's what makes it so interesting.
The growth has been impressive too. With more than 500K monthly active traders, around 17M monthly website visits, and a projected $18B in trading volume for 2025, it's clear that prediction markets are finding a real place in the Web3 ecosystem.
One thing I've been noticing recently is the growing discussion around $POLY. There still isn't a complete picture, but the excitement is building, and many people are choosing to follow the project early to see where it goes. We've watched communities rally behind tokens like $HYPE , $PENGU , and $DOOD , so it's not surprising that some believe $POLY could become another major story if the momentum keeps growing.
Of course, nothing in crypto is guaranteed, but I've learned that the best opportunities often show up before everyone is talking about them. That's why I'm keeping a close eye on Polymarket and looking forward to seeing how the $POLY ecosystem develops over time.
#Polymarket #POLY #Crypto #Web3 #PredictionMarkets
The growth has been impressive too. With more than 500K monthly active traders, around 17M monthly website visits, and a projected $18B in trading volume for 2025, it's clear that prediction markets are finding a real place in the Web3 ecosystem.
One thing I've been noticing recently is the growing discussion around $POLY. There still isn't a complete picture, but the excitement is building, and many people are choosing to follow the project early to see where it goes. We've watched communities rally behind tokens like $HYPE , $PENGU , and $DOOD , so it's not surprising that some believe $POLY could become another major story if the momentum keeps growing.
Of course, nothing in crypto is guaranteed, but I've learned that the best opportunities often show up before everyone is talking about them. That's why I'm keeping a close eye on Polymarket and looking forward to seeing how the $POLY ecosystem develops over time.
#Polymarket #POLY #Crypto #Web3 #PredictionMarkets

10
16
965
·
--
$龙虾 followed with a solid +35.94% gain, reaching 0.012812 (≈ Rs3.56282). Strong buying pressure continues to push this token higher.
$RAVE kept the bullish momentum alive, climbing +31.91% to 0.40066 (≈ Rs111.41). Consistent strength is keeping it on traders' radar.
Green candles are dominating the market today. Stay alert, manage your risk, and never chase pumps without a plan. 🚀📈
{future}(RAVEUSDT)
$龙虾 followed with a solid +35.94% gain, reaching 0.012812 (≈ Rs3.56282). Strong buying pressure continues to push this token higher.
$RAVE kept the bullish momentum alive, climbing +31.91% to 0.40066 (≈ Rs111.41). Consistent strength is keeping it on traders' radar.
Green candles are dominating the market today. Stay alert, manage your risk, and never chase pumps without a plan. 🚀📈
$RAVE kept the bullish momentum alive, climbing +31.91% to 0.40066 (≈ Rs111.41). Consistent strength is keeping it on traders' radar.
Green candles are dominating the market today. Stay alert, manage your risk, and never chase pumps without a plan. 🚀📈
give
100%
post
0%
2 ඡන්ද • ඡන්දය අවසන්
1
2
425
·
--
$TAC stole the spotlight with a massive +149.94% rally, now trading at 0.053522 (≈ Rs14.88). Momentum is exploding, and traders are watching closely for the next move.
$龙虾 followed with a solid +35.94% gain, reaching 0.012812 (≈ Rs3.56282). Strong buying pressure continues to push this token higher.
$RAVE kept the bullish momentum alive, climbing +31.91% to 0.40066 (≈ Rs111.41). Consistent strength is keeping it on traders' radar.
Green candles are dominating the market today. Stay alert, manage your risk, and never chase pumps without a plan. 🚀📈
BitcoinSpotETFsPost$1.79BOutflows
#KoreaKOSDAQRulesRiskCryptoTreasuryFirmDelisting
#USFuturesRise
#SaylorHintsStrategyBitcoinBuy #USIranAgreeToHaltAttacks
$TAC stole the spotlight with a massive +149.94% rally, now trading at 0.053522 (≈ Rs14.88). Momentum is exploding, and traders are watching closely for the next move.
$龙虾 followed with a solid +35.94% gain, reaching 0.012812 (≈ Rs3.56282). Strong buying pressure continues to push this token higher.
$RAVE kept the bullish momentum alive, climbing +31.91% to 0.40066 (≈ Rs111.41). Consistent strength is keeping it on traders' radar.
Green candles are dominating the market today. Stay alert, manage your risk, and never chase pumps without a plan. 🚀📈
BitcoinSpotETFsPost$1.79BOutflows
#KoreaKOSDAQRulesRiskCryptoTreasuryFirmDelisting
#USFuturesRise
#SaylorHintsStrategyBitcoinBuy #USIranAgreeToHaltAttacks
$龙虾 followed with a solid +35.94% gain, reaching 0.012812 (≈ Rs3.56282). Strong buying pressure continues to push this token higher.
$RAVE kept the bullish momentum alive, climbing +31.91% to 0.40066 (≈ Rs111.41). Consistent strength is keeping it on traders' radar.
Green candles are dominating the market today. Stay alert, manage your risk, and never chase pumps without a plan. 🚀📈
BitcoinSpotETFsPost$1.79BOutflows
#KoreaKOSDAQRulesRiskCryptoTreasuryFirmDelisting
#USFuturesRise
#SaylorHintsStrategyBitcoinBuy #USIranAgreeToHaltAttacks
long ✅
54%
time 🌟
46%
13 ඡන්ද • ඡන්දය අවසන්
2
882
·
--
උසබ තත්ත්වය
$SKYAI leads the liquidation tape with a $8.3795K short liquidation at $0.14963 on BINANCE.
$VELVET followed with $7.8846K at $1.84176, while $AEVO saw $5.0088K liquidated at $0.02019.
Over $21.27K in shorts wiped out. The squeeze is on. 🔥📈
$SKYAI leads the liquidation tape with a $8.3795K short liquidation at $0.14963 on BINANCE.
$VELVET followed with $7.8846K at $1.84176, while $AEVO saw $5.0088K liquidated at $0.02019.
Over $21.27K in shorts wiped out. The squeeze is on. 🔥📈
$VELVET followed with $7.8846K at $1.84176, while $AEVO saw $5.0088K liquidated at $0.02019.
Over $21.27K in shorts wiped out. The squeeze is on. 🔥📈
🤩$SKYAI 🤗
56%
💚$VELVET ✅
27%
😱$AEVO 🤔
17%
55 ඡන්ද • ඡන්දය අවසන්
1
2
2.3k
·
--
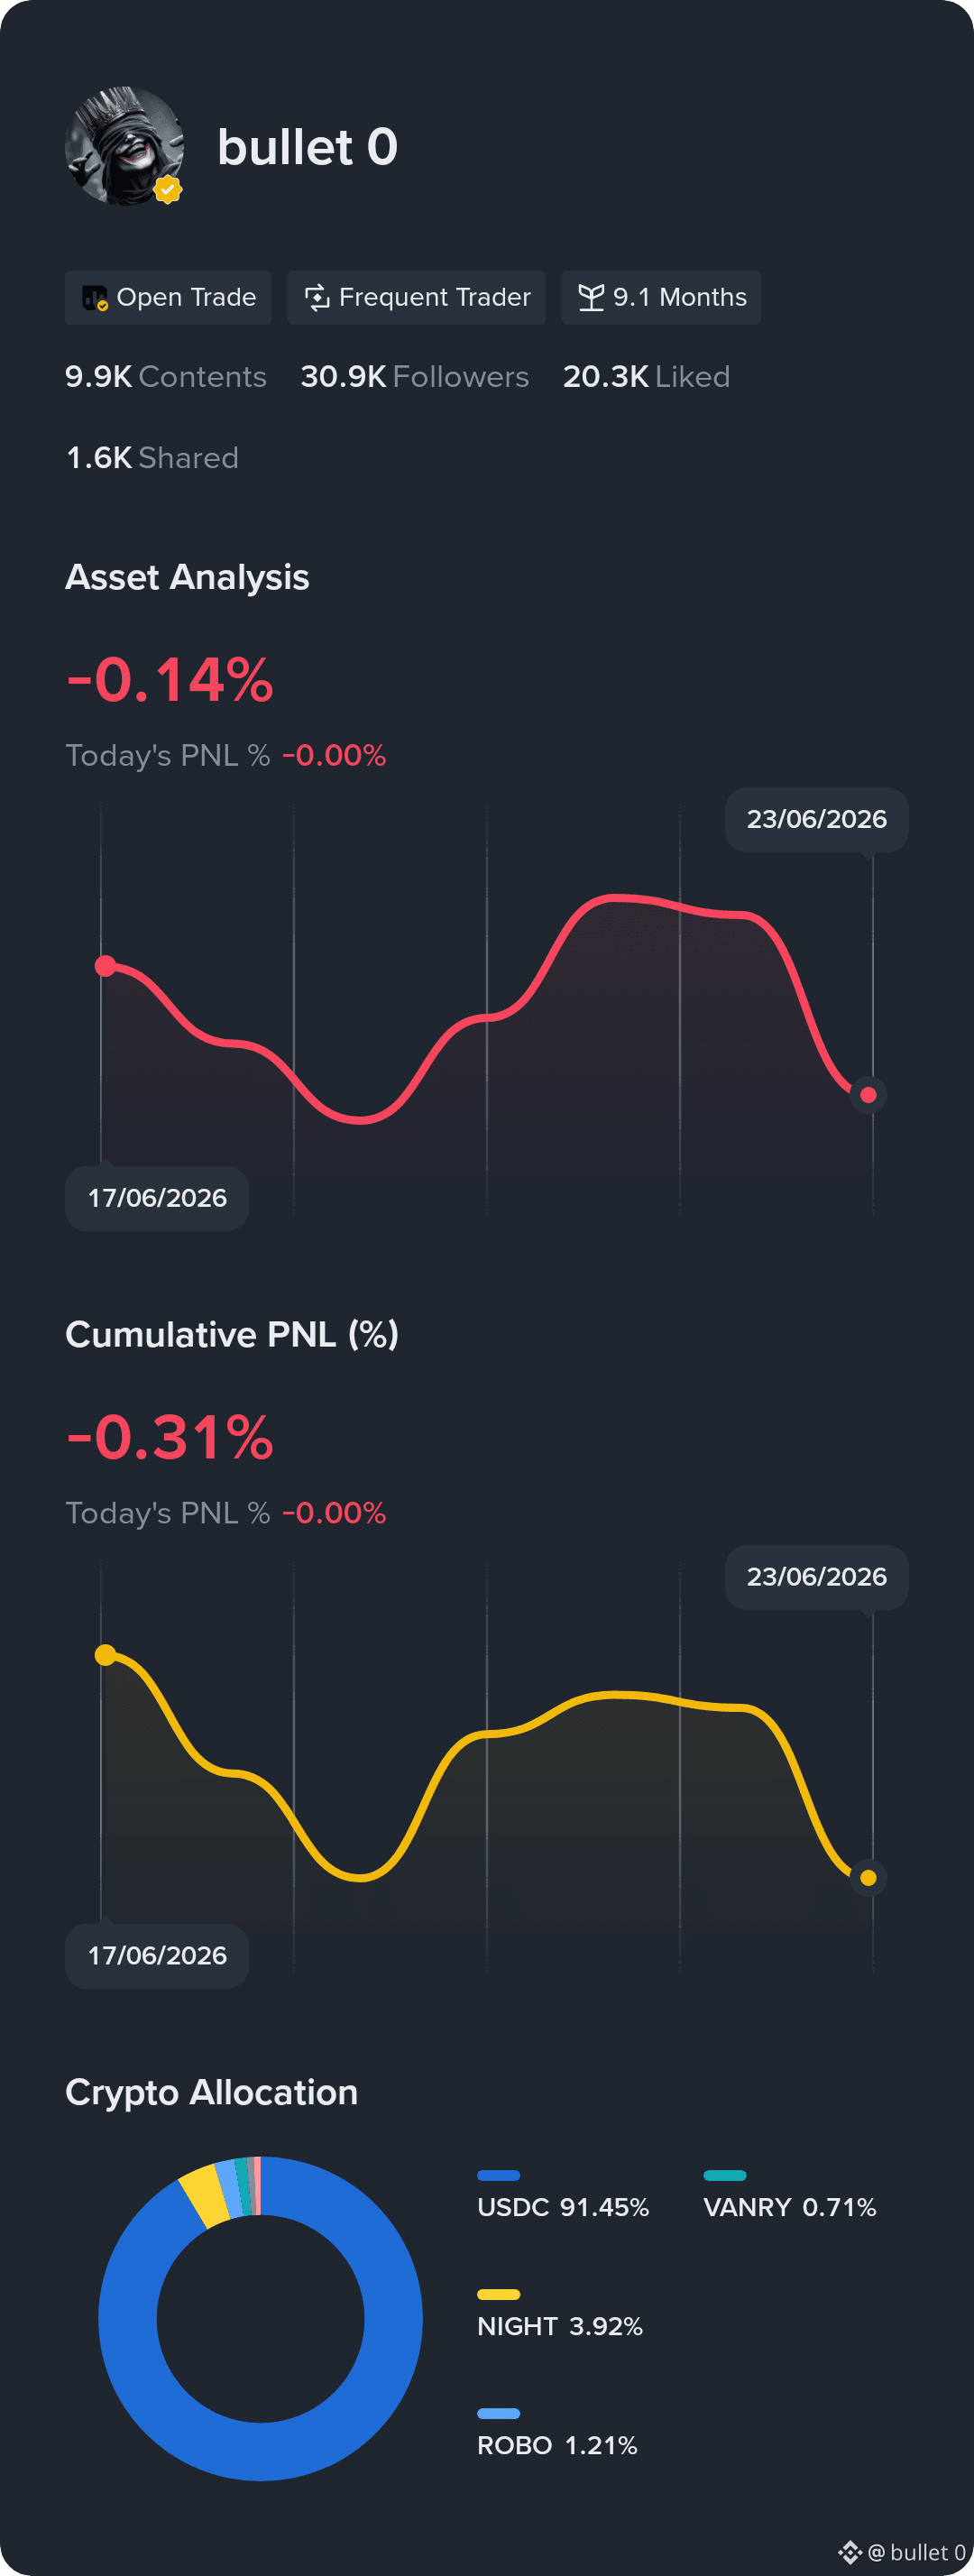
See my returns and portfolio breakdown. Follow for investment tips
See my returns and portfolio breakdown. Follow for investment tips
4
72
තවත් අන්තර්ගතයන් ගවේෂණය කිරීමට ඇතුල් වන්න
Binance චතුරශ්රය හි ගෝලීය ක්රිප්ටෝ පරිශීලකයින් හා එක්වන්න
⚡️ ක්රිප්ටෝ පිළිබඳ නවතම සහ ප්රයෝජනවත් තොරතුරු ලබා ගන්න.
💬 ලොව විශාලතම ක්රිප්ටෝ හුවමාරුව මගින් විශ්වාස කෙරේ.
👍 සත්යායනය කරන ලද නිර්මාණකරුවන්ගෙන් සැබෑ විදසුන් සොයා ගන්න.
විද්යුත් තැපෑල / දුරකථන අංකය
නැගී එන මාතෘකා
BTCReboundsAbove$60KAmidWhaleDipBuying
15,359 නැරඹීම්
121 සාකච්ඡා කරමින්
Abraxas Capital, Other Whales Buy the BTC Dip as Bitcoin Briefly Reclaims $60,000
Binance News
·19 කැමත්ත දැක්වීම්
·27.7k නැරඹීම්
SolanaSets2027RoadmapToDoubleComputeCapacity
2,143 නැරඹීම්
115 සාකච්ඡා කරමින්
CaliforniaNvidiaProbeExaminesPotentialCriminalViolations
1,797 නැරඹීම්
34 සාකච්ඡා කරමින්