
#cryptocomparison
cryptocomparison
87,995 නැරඹීම්
298 සාකච්ඡා කරමින්
උණුසුම්
නවතම

⚔️ المقارنة النارية: صراع الجبابرة في الويكند.. هل تسحق سيولة $BTC أحلام العملات البديلة؟
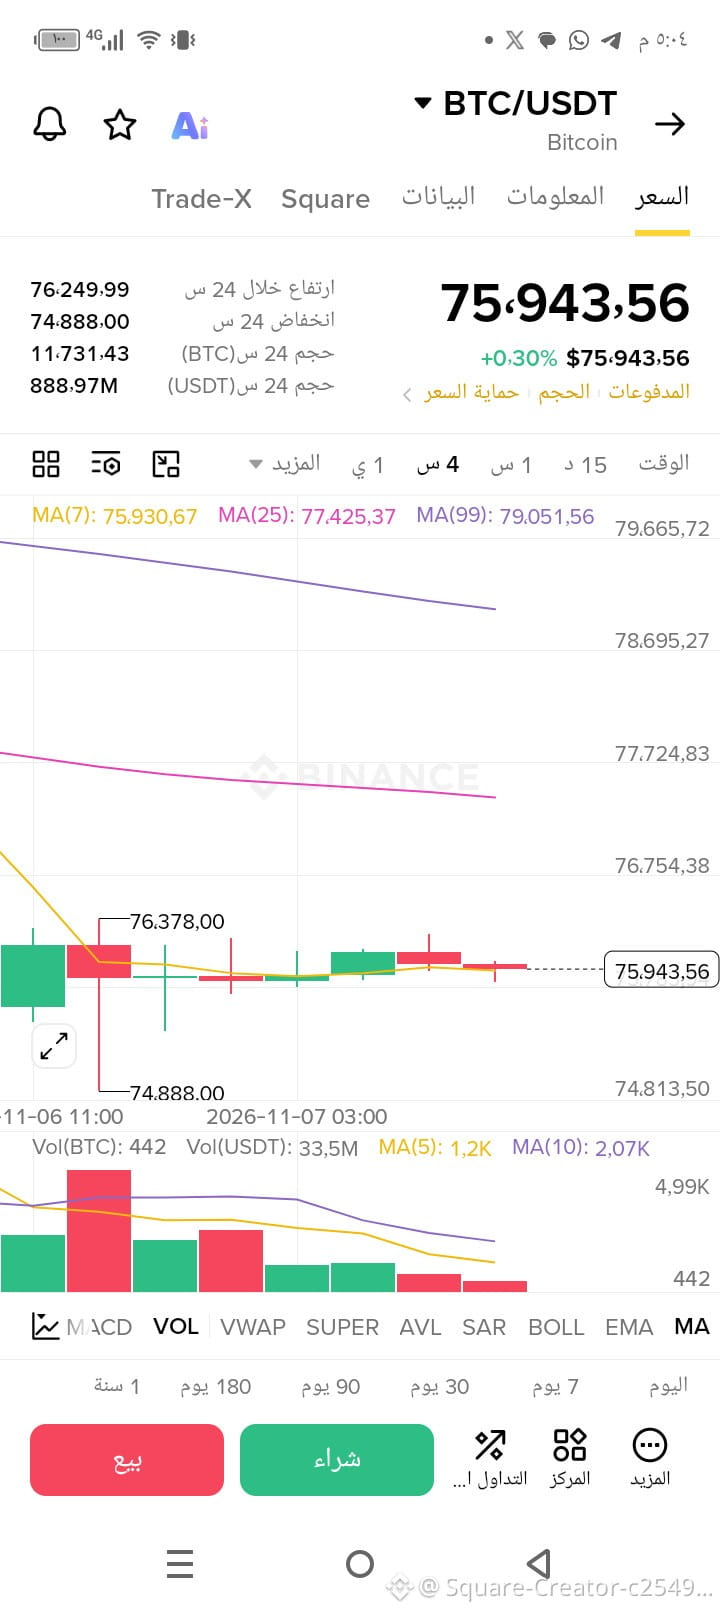
بينما يستقر شارت BTCفي مناطق تذبذب ضيقة لجمع الزخم بعد سحوبات الحيتان الأخيرة، بدأت تظهر معركة شرسة وخفية على جبهة الاستحواذ (Dominance).
المقارنة الفنية الحية تبين فجوة دايفرجنس (Divergence) واضحة في أحجام التداول (Volume)؛ فبينما تحافظ العملات القيادية مثل $ETH و $SOL على مستويات دعم حرجة، يقوم صناع السوق بتدوير السيولة بذكاء شديد لمنع انفجار العملات البديلة قبل اختراق البيتكوين الحاسم. التاريخ يعيد نفسه في عطلات نهاية الأسبوع: السيولة تتجمع في قنوات ضيقة، والعملة التي تمتلك جدار طلبات أقوى هي التي ستقود حركة الارتداد الصاعقة وتترك البقية في الخلف.
📊 الفارق الفني وعمق التجميع:
هناك اختلاف واضح في سلوك مؤشر الـ RSI وحجم التداول بين القيادي وبقية السوق لا يظهر على الشاشات العادية الثابتة.
👇 اضغط الآن على أداة الشارت الحي (Widget) بالأسفل، وقارن وتيرة تدفق السيولة الحالية لعملة BTCمع بقية العملات في محفظتك؛ واكتشف بنفسك المستويات الحرجة التي تفصلنا عن الانفجار السعري القادم!
{spot}(BTCUSDT)
{spot}(ETHUSDT)
{spot}(SOLUSDT)
#Binance #CryptoComparison #Bitcoin #TradingSignals
⚔️ المقارنة النارية: صراع الجبابرة في الويكند.. هل تسحق سيولة $BTC أحلام العملات البديلة؟
بينما يستقر شارت BTCفي مناطق تذبذب ضيقة لجمع الزخم بعد سحوبات الحيتان الأخيرة، بدأت تظهر معركة شرسة وخفية على جبهة الاستحواذ (Dominance).
المقارنة الفنية الحية تبين فجوة دايفرجنس (Divergence) واضحة في أحجام التداول (Volume)؛ فبينما تحافظ العملات القيادية مثل $ETH و $SOL على مستويات دعم حرجة، يقوم صناع السوق بتدوير السيولة بذكاء شديد لمنع انفجار العملات البديلة قبل اختراق البيتكوين الحاسم. التاريخ يعيد نفسه في عطلات نهاية الأسبوع: السيولة تتجمع في قنوات ضيقة، والعملة التي تمتلك جدار طلبات أقوى هي التي ستقود حركة الارتداد الصاعقة وتترك البقية في الخلف.
📊 الفارق الفني وعمق التجميع:
هناك اختلاف واضح في سلوك مؤشر الـ RSI وحجم التداول بين القيادي وبقية السوق لا يظهر على الشاشات العادية الثابتة.
👇 اضغط الآن على أداة الشارت الحي (Widget) بالأسفل، وقارن وتيرة تدفق السيولة الحالية لعملة BTCمع بقية العملات في محفظتك؛ واكتشف بنفسك المستويات الحرجة التي تفصلنا عن الانفجار السعري القادم!
#Binance #CryptoComparison #Bitcoin #TradingSignals
بينما يستقر شارت BTCفي مناطق تذبذب ضيقة لجمع الزخم بعد سحوبات الحيتان الأخيرة، بدأت تظهر معركة شرسة وخفية على جبهة الاستحواذ (Dominance).
المقارنة الفنية الحية تبين فجوة دايفرجنس (Divergence) واضحة في أحجام التداول (Volume)؛ فبينما تحافظ العملات القيادية مثل $ETH و $SOL على مستويات دعم حرجة، يقوم صناع السوق بتدوير السيولة بذكاء شديد لمنع انفجار العملات البديلة قبل اختراق البيتكوين الحاسم. التاريخ يعيد نفسه في عطلات نهاية الأسبوع: السيولة تتجمع في قنوات ضيقة، والعملة التي تمتلك جدار طلبات أقوى هي التي ستقود حركة الارتداد الصاعقة وتترك البقية في الخلف.
📊 الفارق الفني وعمق التجميع:
هناك اختلاف واضح في سلوك مؤشر الـ RSI وحجم التداول بين القيادي وبقية السوق لا يظهر على الشاشات العادية الثابتة.
👇 اضغط الآن على أداة الشارت الحي (Widget) بالأسفل، وقارن وتيرة تدفق السيولة الحالية لعملة BTCمع بقية العملات في محفظتك؛ واكتشف بنفسك المستويات الحرجة التي تفصلنا عن الانفجار السعري القادم!
#Binance #CryptoComparison #Bitcoin #TradingSignals
1
1
104
⚔️ المقارنة النارية: صراع الاستحواذ.. هل يبتلع الحوت الأكبر سيولة العملات البديلة؟
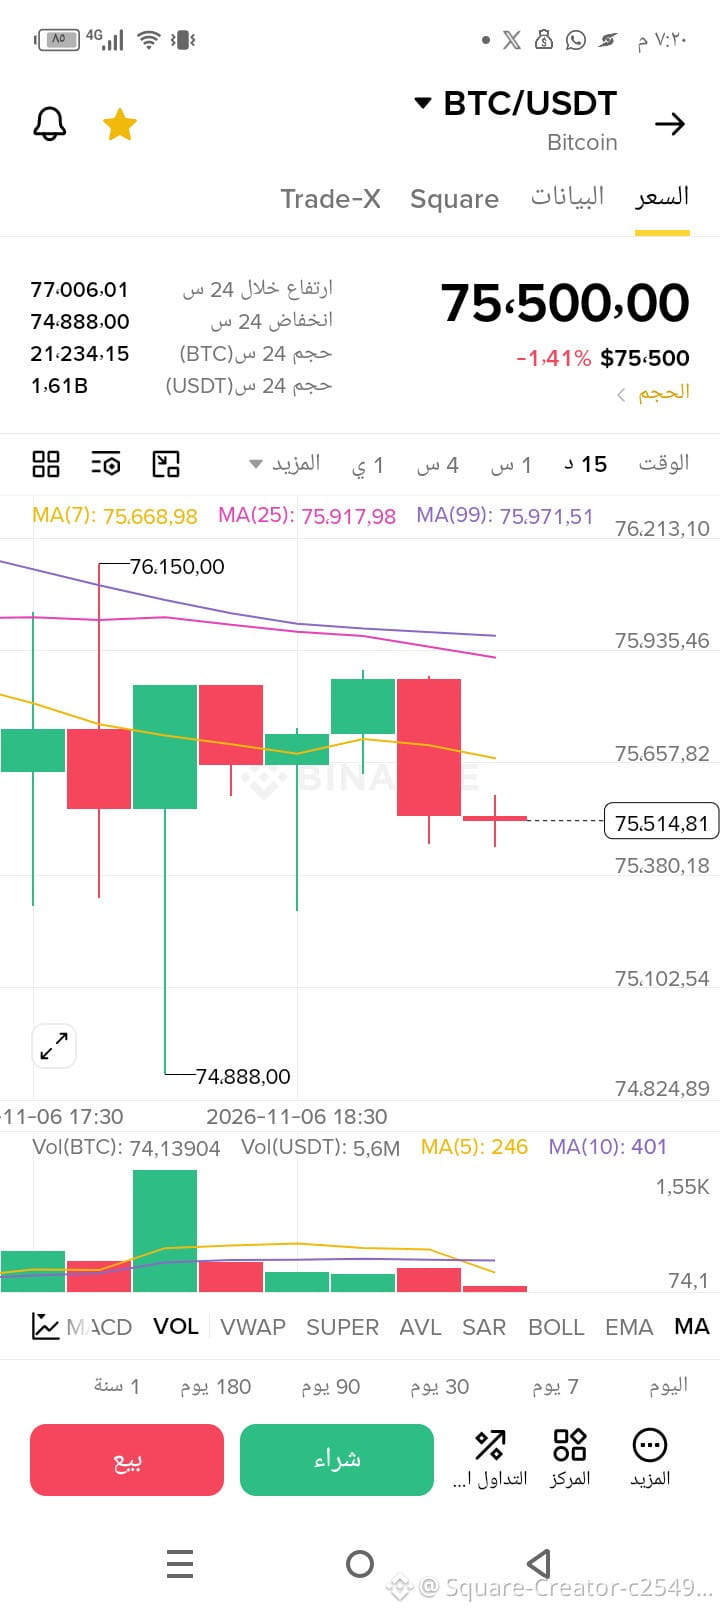
بينما يراقب الجميع شارت $BTC وهو يتحرك في مناطق حاسمة بعد سحوبات الحيتان الأخيرة، بدأت تظهر فجوة مرعبة في أحجام التداول (Volume) بين القيادي وبقية السوق.
المقارنة التاريخية تؤكد أن صناع السوق يتبعون الآن نفس السلوك السيكولوجي المعتاد: ضغط سيولة العملات البديلة وتجميعها عند مستويات متدنية جداً، ليتم ضخ الأرباح إليها فور استقرار الشارت الرئيسي. الذعر الحالي في العملات البديلة ليس انهياراً، بل هو فجوة دايفرجنس (Divergence) واضحة للمحترفين الذين يتقنون اقتناص الفرص قبل الارتداد.
📊 الفارق الفني على أرض الواقع:
أحجام التداول على شارت الاستحواذ تعطي إشارة دخول قوية بدأت تتشكل خلف الكواليس، ولا تظهر على الشاشات العادية.
👇 اضغط الآن على أداة الشارت الحي (Widget) بالأسفل، وقارن وتيرة السيولة الحالية لعملة $BTC مع حركة عملاتك البديلة؛ واكتشف بنفسك المستويات الحرجة التي تفصلنا عن الانفجار السعري القادم!
{spot}(BTCUSDT)
#Binance #CryptoComparison #Bitcoin #Altcoins
⚔️ المقارنة النارية: صراع الاستحواذ.. هل يبتلع الحوت الأكبر سيولة العملات البديلة؟
بينما يراقب الجميع شارت $BTC وهو يتحرك في مناطق حاسمة بعد سحوبات الحيتان الأخيرة، بدأت تظهر فجوة مرعبة في أحجام التداول (Volume) بين القيادي وبقية السوق.
المقارنة التاريخية تؤكد أن صناع السوق يتبعون الآن نفس السلوك السيكولوجي المعتاد: ضغط سيولة العملات البديلة وتجميعها عند مستويات متدنية جداً، ليتم ضخ الأرباح إليها فور استقرار الشارت الرئيسي. الذعر الحالي في العملات البديلة ليس انهياراً، بل هو فجوة دايفرجنس (Divergence) واضحة للمحترفين الذين يتقنون اقتناص الفرص قبل الارتداد.
📊 الفارق الفني على أرض الواقع:
أحجام التداول على شارت الاستحواذ تعطي إشارة دخول قوية بدأت تتشكل خلف الكواليس، ولا تظهر على الشاشات العادية.
👇 اضغط الآن على أداة الشارت الحي (Widget) بالأسفل، وقارن وتيرة السيولة الحالية لعملة $BTC مع حركة عملاتك البديلة؛ واكتشف بنفسك المستويات الحرجة التي تفصلنا عن الانفجار السعري القادم!
#Binance #CryptoComparison #Bitcoin #Altcoins
بينما يراقب الجميع شارت $BTC وهو يتحرك في مناطق حاسمة بعد سحوبات الحيتان الأخيرة، بدأت تظهر فجوة مرعبة في أحجام التداول (Volume) بين القيادي وبقية السوق.
المقارنة التاريخية تؤكد أن صناع السوق يتبعون الآن نفس السلوك السيكولوجي المعتاد: ضغط سيولة العملات البديلة وتجميعها عند مستويات متدنية جداً، ليتم ضخ الأرباح إليها فور استقرار الشارت الرئيسي. الذعر الحالي في العملات البديلة ليس انهياراً، بل هو فجوة دايفرجنس (Divergence) واضحة للمحترفين الذين يتقنون اقتناص الفرص قبل الارتداد.
📊 الفارق الفني على أرض الواقع:
أحجام التداول على شارت الاستحواذ تعطي إشارة دخول قوية بدأت تتشكل خلف الكواليس، ولا تظهر على الشاشات العادية.
👇 اضغط الآن على أداة الشارت الحي (Widget) بالأسفل، وقارن وتيرة السيولة الحالية لعملة $BTC مع حركة عملاتك البديلة؛ واكتشف بنفسك المستويات الحرجة التي تفصلنا عن الانفجار السعري القادم!
#Binance #CryptoComparison #Bitcoin #Altcoins
622
⚔️ المقارنة النارية: صراع الاستحواذ.. هل يبتلع الحوت الأكبر سيولة العملات البديلة؟
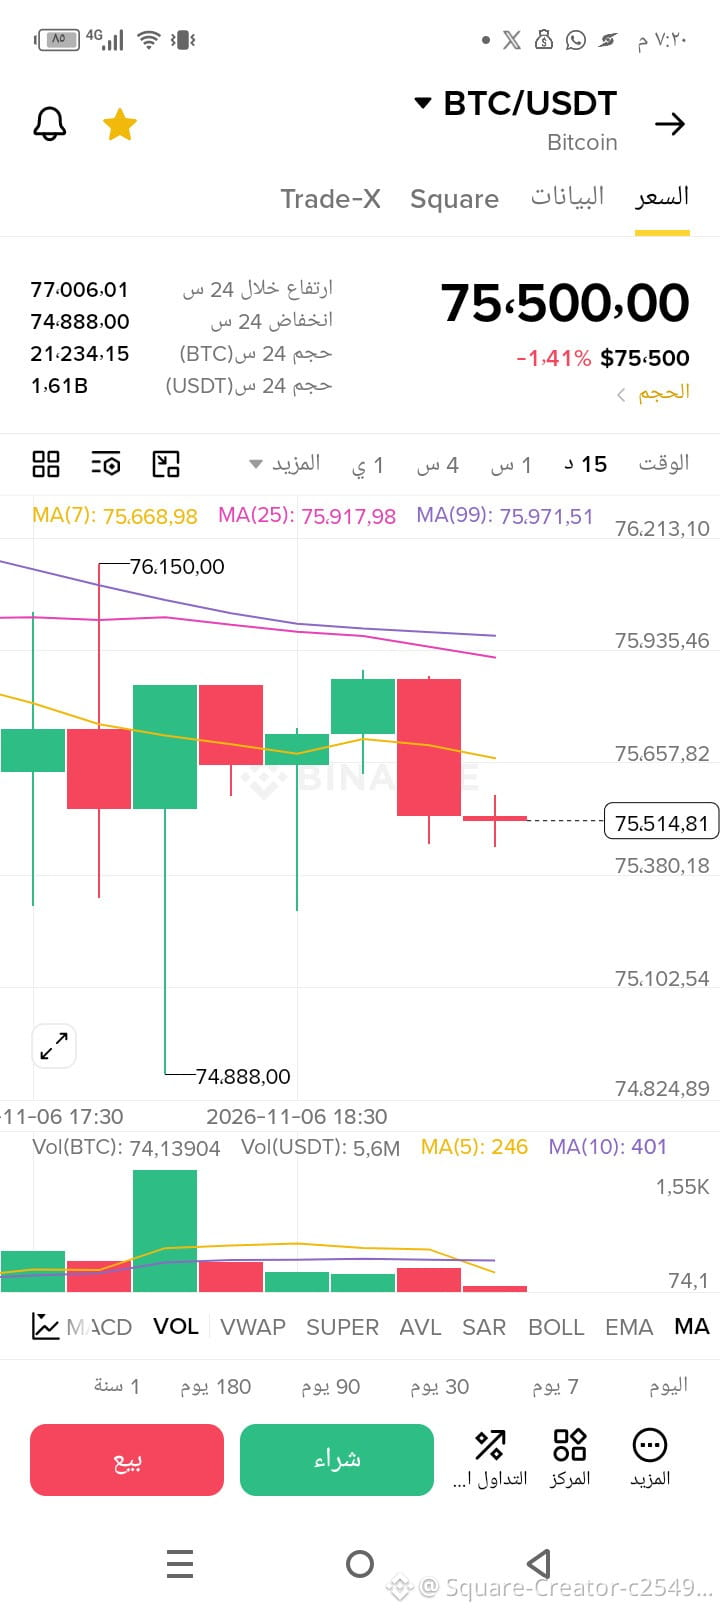
بينما يراقب الجميع شارت $BTC وهو يتحرك في مناطق حاسمة بعد سحوبات الحيتان الأخيرة، بدأت تظهر فجوة مرعبة في أحجام التداول (Volume) بين القيادي وبقية السوق.
المقارنة التاريخية تؤكد أن صناع السوق يتبعون الآن نفس السلوك السيكولوجي المعتاد: ضغط سيولة العملات البديلة وتجميعها عند مستويات متدنية جداً، ليتم ضخ الأرباح إليها فور استقرار الشارت الرئيسي. الذعر الحالي في العملات البديلة ليس انهياراً، بل هو فجوة دايفرجنس (Divergence) واضحة للمحترفين الذين يتقنون اقتناص الفرص قبل الارتداد.
📊 الفارق الفني على أرض الواقع:
أحجام التداول على شارت الاستحواذ تعطي إشارة دخول قوية بدأت تتشكل خلف الكواليس، ولا تظهر على الشاشات العادية.
👇 اضغط الآن على أداة الشارت الحي (Widget) بالأسفل، وقارن وتيرة السيولة الحالية لعملة $BTC مع حركة عملاتك البديلة؛ واكتشف بنفسك المستويات الحرجة التي تفصلنا عن الانفجار السعري القادم!
{spot}(BTCUSDT)
#Binance #CryptoComparison #Bitcoin #Altcoins
⚔️ المقارنة النارية: صراع الاستحواذ.. هل يبتلع الحوت الأكبر سيولة العملات البديلة؟
بينما يراقب الجميع شارت $BTC وهو يتحرك في مناطق حاسمة بعد سحوبات الحيتان الأخيرة، بدأت تظهر فجوة مرعبة في أحجام التداول (Volume) بين القيادي وبقية السوق.
المقارنة التاريخية تؤكد أن صناع السوق يتبعون الآن نفس السلوك السيكولوجي المعتاد: ضغط سيولة العملات البديلة وتجميعها عند مستويات متدنية جداً، ليتم ضخ الأرباح إليها فور استقرار الشارت الرئيسي. الذعر الحالي في العملات البديلة ليس انهياراً، بل هو فجوة دايفرجنس (Divergence) واضحة للمحترفين الذين يتقنون اقتناص الفرص قبل الارتداد.
📊 الفارق الفني على أرض الواقع:
أحجام التداول على شارت الاستحواذ تعطي إشارة دخول قوية بدأت تتشكل خلف الكواليس، ولا تظهر على الشاشات العادية.
👇 اضغط الآن على أداة الشارت الحي (Widget) بالأسفل، وقارن وتيرة السيولة الحالية لعملة $BTC مع حركة عملاتك البديلة؛ واكتشف بنفسك المستويات الحرجة التي تفصلنا عن الانفجار السعري القادم!
#Binance #CryptoComparison #Bitcoin #Altcoins
بينما يراقب الجميع شارت $BTC وهو يتحرك في مناطق حاسمة بعد سحوبات الحيتان الأخيرة، بدأت تظهر فجوة مرعبة في أحجام التداول (Volume) بين القيادي وبقية السوق.
المقارنة التاريخية تؤكد أن صناع السوق يتبعون الآن نفس السلوك السيكولوجي المعتاد: ضغط سيولة العملات البديلة وتجميعها عند مستويات متدنية جداً، ليتم ضخ الأرباح إليها فور استقرار الشارت الرئيسي. الذعر الحالي في العملات البديلة ليس انهياراً، بل هو فجوة دايفرجنس (Divergence) واضحة للمحترفين الذين يتقنون اقتناص الفرص قبل الارتداد.
📊 الفارق الفني على أرض الواقع:
أحجام التداول على شارت الاستحواذ تعطي إشارة دخول قوية بدأت تتشكل خلف الكواليس، ولا تظهر على الشاشات العادية.
👇 اضغط الآن على أداة الشارت الحي (Widget) بالأسفل، وقارن وتيرة السيولة الحالية لعملة $BTC مع حركة عملاتك البديلة؛ واكتشف بنفسك المستويات الحرجة التي تفصلنا عن الانفجار السعري القادم!
#Binance #CryptoComparison #Bitcoin #Altcoins
1
1
128
⚔️ المقارنة النارية: صراع عملات الميم السياسية.. هل يبتلع تنين $TRUMP سيولة السوق؟
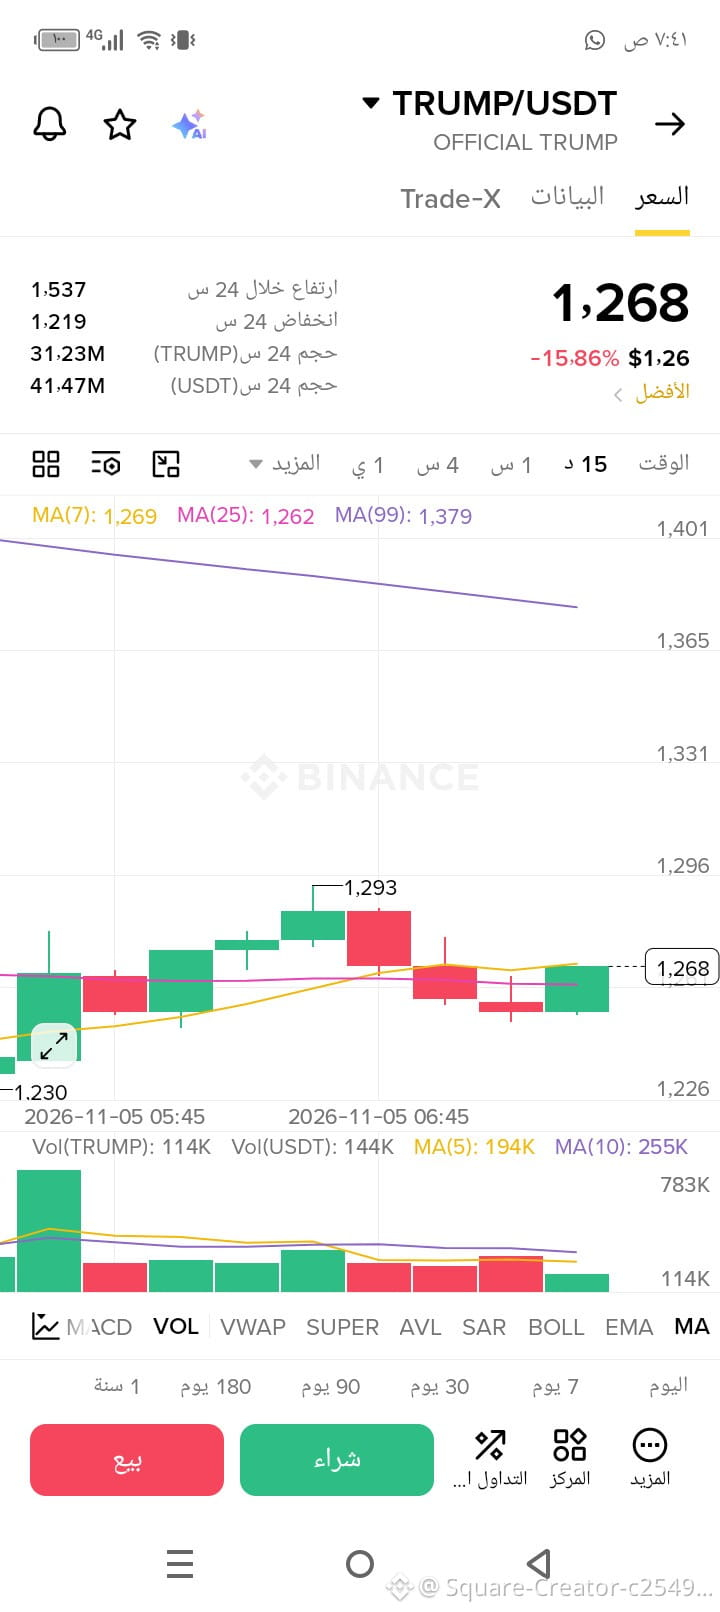
عندما تنخفض $TRUMP بنسبة 15% وتصل لمناطق 1.268$، يبدأ الخوف في قلوب الهواة، لكن المحترفين يفتحون دفاتر المقارنة التاريخية.
إذا قارنا الأداء الفني الحالي وسرعة ارتداد السيولة بين العملات السياسية القيادية وعملات الميم الكلاسيكية عند مناطق الدعم الحرجة، سنجد فارقاً بصرّياً مرعباً في أحجام التداول (Volume). التاريخ يعيد نفسه: العملة التي تمتلك قاعدة جماهيرية شرسة وسنداً سياسياً وإعلامياً هي دائماً من تقود موجة الارتداد الصاعق، بينما العملات العادية تظل تنزف في القاع.
📊 الفارق الفني على أرض الواقع:
هناك فجوة سعرية وإشارة دايفرجنس (Divergence) إيجابية بدأت تظهر فقط لمن يتقن قراءة حركة الشموع الحية ومقارنة خطوط الـ MA.
👇 اضغط الآن على أداة الشارت الحي (Widget) بالأسفل، وقارن وتيرة صعود الشمعة الحالية لـ $TRUMP مع بقية السوق؛ اكتشف بنفسك الخط السعري الحاسم الذي يثبت تفوق سيولة التجميع الآن!
{future}(TRUMPUSDT)
#Binance #CryptoComparison #MemeCoins #Altcoins
⚔️ المقارنة النارية: صراع عملات الميم السياسية.. هل يبتلع تنين $TRUMP سيولة السوق؟
عندما تنخفض $TRUMP بنسبة 15% وتصل لمناطق 1.268$، يبدأ الخوف في قلوب الهواة، لكن المحترفين يفتحون دفاتر المقارنة التاريخية.
إذا قارنا الأداء الفني الحالي وسرعة ارتداد السيولة بين العملات السياسية القيادية وعملات الميم الكلاسيكية عند مناطق الدعم الحرجة، سنجد فارقاً بصرّياً مرعباً في أحجام التداول (Volume). التاريخ يعيد نفسه: العملة التي تمتلك قاعدة جماهيرية شرسة وسنداً سياسياً وإعلامياً هي دائماً من تقود موجة الارتداد الصاعق، بينما العملات العادية تظل تنزف في القاع.
📊 الفارق الفني على أرض الواقع:
هناك فجوة سعرية وإشارة دايفرجنس (Divergence) إيجابية بدأت تظهر فقط لمن يتقن قراءة حركة الشموع الحية ومقارنة خطوط الـ MA.
👇 اضغط الآن على أداة الشارت الحي (Widget) بالأسفل، وقارن وتيرة صعود الشمعة الحالية لـ $TRUMP مع بقية السوق؛ اكتشف بنفسك الخط السعري الحاسم الذي يثبت تفوق سيولة التجميع الآن!
#Binance #CryptoComparison #MemeCoins #Altcoins
عندما تنخفض $TRUMP بنسبة 15% وتصل لمناطق 1.268$، يبدأ الخوف في قلوب الهواة، لكن المحترفين يفتحون دفاتر المقارنة التاريخية.
إذا قارنا الأداء الفني الحالي وسرعة ارتداد السيولة بين العملات السياسية القيادية وعملات الميم الكلاسيكية عند مناطق الدعم الحرجة، سنجد فارقاً بصرّياً مرعباً في أحجام التداول (Volume). التاريخ يعيد نفسه: العملة التي تمتلك قاعدة جماهيرية شرسة وسنداً سياسياً وإعلامياً هي دائماً من تقود موجة الارتداد الصاعق، بينما العملات العادية تظل تنزف في القاع.
📊 الفارق الفني على أرض الواقع:
هناك فجوة سعرية وإشارة دايفرجنس (Divergence) إيجابية بدأت تظهر فقط لمن يتقن قراءة حركة الشموع الحية ومقارنة خطوط الـ MA.
👇 اضغط الآن على أداة الشارت الحي (Widget) بالأسفل، وقارن وتيرة صعود الشمعة الحالية لـ $TRUMP مع بقية السوق؛ اكتشف بنفسك الخط السعري الحاسم الذي يثبت تفوق سيولة التجميع الآن!
#Binance #CryptoComparison #MemeCoins #Altcoins
1
1
1k

·
--
Binance Square Gem Hunt: TUT vs. HAEDAL!
TUTUSDT (0.02017) is up 14.41% in 24h. Its RSI at 59.54 suggests healthy buying, with price above 1h SMAs. Volume is decent at 5.5M USDT, showing sustained, moderate bullish momentum.
HAEDALUSDT (0.02928) surged 19.90% in 24h. Despite its RSI at 46.38 indicating potential consolidation, it commands massive 26.9M USDT volume and higher volatility, reflecting much greater market interest after a big move.
TUT offers steady bullish signs; HAEDAL delivered a larger gain with huge volume but higher volatility. Which coin catches your eye for its next move? 👇
#CryptoComparison #BinanceSquare #TUT #HAEDAL #MarketAnalysis
Not financial advice. DYOR.
Binance Square Gem Hunt: TUT vs. HAEDAL!
TUTUSDT (0.02017) is up 14.41% in 24h. Its RSI at 59.54 suggests healthy buying, with price above 1h SMAs. Volume is decent at 5.5M USDT, showing sustained, moderate bullish momentum.
HAEDALUSDT (0.02928) surged 19.90% in 24h. Despite its RSI at 46.38 indicating potential consolidation, it commands massive 26.9M USDT volume and higher volatility, reflecting much greater market interest after a big move.
TUT offers steady bullish signs; HAEDAL delivered a larger gain with huge volume but higher volatility. Which coin catches your eye for its next move? 👇
#CryptoComparison #BinanceSquare #TUT #HAEDAL #MarketAnalysis
Not financial advice. DYOR.
TUTUSDT (0.02017) is up 14.41% in 24h. Its RSI at 59.54 suggests healthy buying, with price above 1h SMAs. Volume is decent at 5.5M USDT, showing sustained, moderate bullish momentum.
HAEDALUSDT (0.02928) surged 19.90% in 24h. Despite its RSI at 46.38 indicating potential consolidation, it commands massive 26.9M USDT volume and higher volatility, reflecting much greater market interest after a big move.
TUT offers steady bullish signs; HAEDAL delivered a larger gain with huge volume but higher volatility. Which coin catches your eye for its next move? 👇
#CryptoComparison #BinanceSquare #TUT #HAEDAL #MarketAnalysis
Not financial advice. DYOR.
1
53
·
--
Quick crypto comparison on Binance Square! STEEMUSDT is up 4.13% at 0.05167. Its 24hr range (0.048-0.069) shows high volatility. With 1hr RSI at 53.5 and price above 20/50 SMAs, short-term momentum is positive. Volume: 5.04M USDT.
TONUSDT is up 0.95% at 1.6. Its lower volatility (range 1.58-1.64) and higher volume (7.71M USDT) indicate strong interest. However, 1hr RSI at 49 and price below 20 SMA suggest a more neutral short-term outlook.
STEEM offers stronger momentum and volatility, while TON shows higher liquidity and calmer action. Which one are you watching? #CryptoComparison #STEEM #TON #MarketAnalysis #BinanceSquare
Not financial advice. DYOR.
Quick crypto comparison on Binance Square! STEEMUSDT is up 4.13% at 0.05167. Its 24hr range (0.048-0.069) shows high volatility. With 1hr RSI at 53.5 and price above 20/50 SMAs, short-term momentum is positive. Volume: 5.04M USDT.
TONUSDT is up 0.95% at 1.6. Its lower volatility (range 1.58-1.64) and higher volume (7.71M USDT) indicate strong interest. However, 1hr RSI at 49 and price below 20 SMA suggest a more neutral short-term outlook.
STEEM offers stronger momentum and volatility, while TON shows higher liquidity and calmer action. Which one are you watching? #CryptoComparison #STEEM #TON #MarketAnalysis #BinanceSquare
Not financial advice. DYOR.
TONUSDT is up 0.95% at 1.6. Its lower volatility (range 1.58-1.64) and higher volume (7.71M USDT) indicate strong interest. However, 1hr RSI at 49 and price below 20 SMA suggest a more neutral short-term outlook.
STEEM offers stronger momentum and volatility, while TON shows higher liquidity and calmer action. Which one are you watching? #CryptoComparison #STEEM #TON #MarketAnalysis #BinanceSquare
Not financial advice. DYOR.
7
·
--
Comparing BEB and ZEC today! BEB is up 7.52% at 240.61 with moderate volume (7.5M) and a 1h RSI of 66.51, showing strong momentum without being extremely overbought. Its price is well above SMAs, indicating a clear uptrend. ZEC, however, is soaring 10.95% at 1353.66 on massive volume (228.7M). While its price is also strong above SMAs, its 1h RSI is 86.29, signaling significant overbought conditions. ZEC exhibits higher volume and volatility, suggesting broader interest but also a higher risk of pullback. BEB shows more sustained momentum. Both are strong, but ZEC's extreme RSI might warrant caution, while BEB appears less extended. Which offers better risk/reward? #CryptoComparison #BEB #ZEC #MarketAnalysis #BinanceSquare
Not financial advice. DYOR.
Comparing BEB and ZEC today! BEB is up 7.52% at 240.61 with moderate volume (7.5M) and a 1h RSI of 66.51, showing strong momentum without being extremely overbought. Its price is well above SMAs, indicating a clear uptrend. ZEC, however, is soaring 10.95% at 1353.66 on massive volume (228.7M). While its price is also strong above SMAs, its 1h RSI is 86.29, signaling significant overbought conditions. ZEC exhibits higher volume and volatility, suggesting broader interest but also a higher risk of pullback. BEB shows more sustained momentum. Both are strong, but ZEC's extreme RSI might warrant caution, while BEB appears less extended. Which offers better risk/reward? #CryptoComparison #BEB #ZEC #MarketAnalysis #BinanceSquare
Not financial advice. DYOR.
Not financial advice. DYOR.
241
·
--
Crypto traders, let's compare NVDAB and OSMO! 📊
NVDABUSDT: At 218.43, up 2.94% in 24h. Low volatility, range 211.3-219.78. Volume ~6.99M USDT. Technicals (1h) show steady momentum: RSI 54.29, price > SMA 20 (217.22) & SMA 50 (214.88), indicating a stable, slightly bullish trend. 🟢
OSMOUSDT: An explosive mover! 🚀 At 0.0583, surged 34.64% in 24h. High volatility, wide range 0.0423-0.0649. Volume ~6.78M USDT, intense activity for its price. 1h RSI 77.78 (overbought), immense buying pressure. Price well above SMA 20 (0.0506) & SMA 50 (0.0460). 🔥
Summary: NVDAB offers steady, lower volatility growth. OSMO is a high-momentum, high-volatility play with strong bullish signals, but watch for potential pullbacks from overbought conditions. Both have strong volumes.
Which coin's action catches your eye? Tell us below! 👇
#CryptoComparison #NVDAB #OSMO #MarketAnalysis #Volatility
Not financial advice. DYOR.
Crypto traders, let's compare NVDAB and OSMO! 📊
NVDABUSDT: At 218.43, up 2.94% in 24h. Low volatility, range 211.3-219.78. Volume ~6.99M USDT. Technicals (1h) show steady momentum: RSI 54.29, price > SMA 20 (217.22) & SMA 50 (214.88), indicating a stable, slightly bullish trend. 🟢
OSMOUSDT: An explosive mover! 🚀 At 0.0583, surged 34.64% in 24h. High volatility, wide range 0.0423-0.0649. Volume ~6.78M USDT, intense activity for its price. 1h RSI 77.78 (overbought), immense buying pressure. Price well above SMA 20 (0.0506) & SMA 50 (0.0460). 🔥
Summary: NVDAB offers steady, lower volatility growth. OSMO is a high-momentum, high-volatility play with strong bullish signals, but watch for potential pullbacks from overbought conditions. Both have strong volumes.
Which coin's action catches your eye? Tell us below! 👇
#CryptoComparison #NVDAB #OSMO #MarketAnalysis #Volatility
Not financial advice. DYOR.
NVDABUSDT: At 218.43, up 2.94% in 24h. Low volatility, range 211.3-219.78. Volume ~6.99M USDT. Technicals (1h) show steady momentum: RSI 54.29, price > SMA 20 (217.22) & SMA 50 (214.88), indicating a stable, slightly bullish trend. 🟢
OSMOUSDT: An explosive mover! 🚀 At 0.0583, surged 34.64% in 24h. High volatility, wide range 0.0423-0.0649. Volume ~6.78M USDT, intense activity for its price. 1h RSI 77.78 (overbought), immense buying pressure. Price well above SMA 20 (0.0506) & SMA 50 (0.0460). 🔥
Summary: NVDAB offers steady, lower volatility growth. OSMO is a high-momentum, high-volatility play with strong bullish signals, but watch for potential pullbacks from overbought conditions. Both have strong volumes.
Which coin's action catches your eye? Tell us below! 👇
#CryptoComparison #NVDAB #OSMO #MarketAnalysis #Volatility
Not financial advice. DYOR.
9
·
--
Crypto Battleground on Binance Square! JASMYUSDT vs PUMPUSDT!
JASMY is up 7.56% ($0.00512) with $5.59M 24h volume. Its 1h RSI at 70.97 suggests overbought conditions, but less extreme. Price is above 1h SMA 20/50, indicating a short-term bullish trend.
PUMP rockets 10.34% ($0.004889) with massive $29.96M 24h volume, showing stronger momentum and liquidity. However, its 1h RSI at 88.12 signals extremely overbought territory, suggesting potential cooling-off. PUMP also maintains a bullish structure above its 1h SMAs.
In summary, PUMP leads in momentum and volume but has higher short-term pullback risk due to its extreme RSI. JASMY shows decent volatility and a less extreme overbought RSI. Which do you favor for potential or current setup? Share your thoughts!
#CryptoComparison #JASMY #PUMP #BinanceSquare #Altcoins
Not financial advice. DYOR.
Crypto Battleground on Binance Square! JASMYUSDT vs PUMPUSDT!
JASMY is up 7.56% ($0.00512) with $5.59M 24h volume. Its 1h RSI at 70.97 suggests overbought conditions, but less extreme. Price is above 1h SMA 20/50, indicating a short-term bullish trend.
PUMP rockets 10.34% ($0.004889) with massive $29.96M 24h volume, showing stronger momentum and liquidity. However, its 1h RSI at 88.12 signals extremely overbought territory, suggesting potential cooling-off. PUMP also maintains a bullish structure above its 1h SMAs.
In summary, PUMP leads in momentum and volume but has higher short-term pullback risk due to its extreme RSI. JASMY shows decent volatility and a less extreme overbought RSI. Which do you favor for potential or current setup? Share your thoughts!
#CryptoComparison #JASMY #PUMP #BinanceSquare #Altcoins
Not financial advice. DYOR.
JASMY is up 7.56% ($0.00512) with $5.59M 24h volume. Its 1h RSI at 70.97 suggests overbought conditions, but less extreme. Price is above 1h SMA 20/50, indicating a short-term bullish trend.
PUMP rockets 10.34% ($0.004889) with massive $29.96M 24h volume, showing stronger momentum and liquidity. However, its 1h RSI at 88.12 signals extremely overbought territory, suggesting potential cooling-off. PUMP also maintains a bullish structure above its 1h SMAs.
In summary, PUMP leads in momentum and volume but has higher short-term pullback risk due to its extreme RSI. JASMY shows decent volatility and a less extreme overbought RSI. Which do you favor for potential or current setup? Share your thoughts!
#CryptoComparison #JASMY #PUMP #BinanceSquare #Altcoins
Not financial advice. DYOR.
43

·
--
$SOL VS $ETH$SOL vs $ETH: 3 Key Differences On-Chain Traders Should Know
Both Solana and Ethereum are top L1s, but their on-chain behavior is very different. Here’s 3 key differences based on public data:
**1. Transaction Speed & Fees**
$ETH: Averages 12-15 TPS on L1. Gas fees vary with network congestion. L2s like Arbitrum/Base handle most daily volume now.
$SOL: Averages 2,000-3,000 TPS. Fees usually stay under $0.01 even during high activity.
Difference: ETH prioritizes decentralization/security. SOL prioritizes speed/throughput. Different design choices.
**2. Network Activity Pattern**
$ETH: Activity spikes with DeFi, NFT mints, L2 usage. Daily active addresses often 400K-500K.
$SOL: Activity spikes with meme coins, NFTs, and high-frequency trading. Daily active addresses often 1M+.
Difference: ETH sees “fewer, higher-value” txs. SOL sees “more, lower-value” txs.
**3. Validator/Decentralization Model**
$ETH: ~1M+ validators. Low hardware requirements. PoS since 2022 merge.
$SOL: ~1,200-1,500 validators. Higher hardware requirements. PoS + PoH consensus.
Difference: ETH optimizes for validator count. SOL optimizes for performance per validator.
**Important context:**
1. Both networks have outages/congestion at different times. No blockchain is perfect.
2. “Better” depends on use case. DeFi protocols vs gaming/NFT mints need different things.
3. On-chain data shows usage, not investment advice.
This is an educational comparison only. Both $ETH and $SOL are volatile assets. Do your own research and manage risk before trading.
Which chain do you use more for daily crypto stuff? ETH for DeFi or SOL for speed? Comment below 👇
$SOL #CryptoComparison #SKHynixADRListing #Ethereum #solana #dyor
{future}(SOLUSDT)
{future}(ETHUSDT)
$SOL VS $ETH
$SOL vs $ETH: 3 Key Differences On-Chain Traders Should Know
Both Solana and Ethereum are top L1s, but their on-chain behavior is very different. Here’s 3 key differences based on public data:
**1. Transaction Speed & Fees**
$ETH: Averages 12-15 TPS on L1. Gas fees vary with network congestion. L2s like Arbitrum/Base handle most daily volume now.
$SOL : Averages 2,000-3,000 TPS. Fees usually stay under $0.01 even during high activity.
Difference: ETH prioritizes decentralization/security. SOL prioritizes speed/throughput. Different design choices.
**2. Network Activity Pattern**
$ETH: Activity spikes with DeFi, NFT mints, L2 usage. Daily active addresses often 400K-500K.
$SOL : Activity spikes with meme coins, NFTs, and high-frequency trading. Daily active addresses often 1M+.
Difference: ETH sees “fewer, higher-value” txs. SOL sees “more, lower-value” txs.
**3. Validator/Decentralization Model**
$ETH: ~1M+ validators. Low hardware requirements. PoS since 2022 merge.
$SOL : ~1,200-1,500 validators. Higher hardware requirements. PoS + PoH consensus.
Difference: ETH optimizes for validator count. SOL optimizes for performance per validator.
**Important context:**
1. Both networks have outages/congestion at different times. No blockchain is perfect.
2. “Better” depends on use case. DeFi protocols vs gaming/NFT mints need different things.
3. On-chain data shows usage, not investment advice.
This is an educational comparison only. Both $ETH and $SOL are volatile assets. Do your own research and manage risk before trading.
Which chain do you use more for daily crypto stuff? ETH for DeFi or SOL for speed? Comment below 👇
$SOL #CryptoComparison #SKHynixADRListing #Ethereum #solana #dyor
Both Solana and Ethereum are top L1s, but their on-chain behavior is very different. Here’s 3 key differences based on public data:
**1. Transaction Speed & Fees**
$ETH: Averages 12-15 TPS on L1. Gas fees vary with network congestion. L2s like Arbitrum/Base handle most daily volume now.
$SOL : Averages 2,000-3,000 TPS. Fees usually stay under $0.01 even during high activity.
Difference: ETH prioritizes decentralization/security. SOL prioritizes speed/throughput. Different design choices.
**2. Network Activity Pattern**
$ETH: Activity spikes with DeFi, NFT mints, L2 usage. Daily active addresses often 400K-500K.
$SOL : Activity spikes with meme coins, NFTs, and high-frequency trading. Daily active addresses often 1M+.
Difference: ETH sees “fewer, higher-value” txs. SOL sees “more, lower-value” txs.
**3. Validator/Decentralization Model**
$ETH: ~1M+ validators. Low hardware requirements. PoS since 2022 merge.
$SOL : ~1,200-1,500 validators. Higher hardware requirements. PoS + PoH consensus.
Difference: ETH optimizes for validator count. SOL optimizes for performance per validator.
**Important context:**
1. Both networks have outages/congestion at different times. No blockchain is perfect.
2. “Better” depends on use case. DeFi protocols vs gaming/NFT mints need different things.
3. On-chain data shows usage, not investment advice.
This is an educational comparison only. Both $ETH and $SOL are volatile assets. Do your own research and manage risk before trading.
Which chain do you use more for daily crypto stuff? ETH for DeFi or SOL for speed? Comment below 👇
$SOL #CryptoComparison #SKHynixADRListing #Ethereum #solana #dyor
1
150

$ETH OUTPERFORMED BTC BY 3.4X OVER THE LAST DECADE 💥
A $10,000 bet on Bitcoin turned into $640K. Same capital in Ethereum? $2.17 million. That's not just a win — that's a 3.4x difference against the king.
The numbers are public. The FUD around Ethereum has been loud for years, but the data doesn't lie. We're talking about a decade-long track record that puts most altcoin narratives to shame.
What's your take — is ETH still the better long-term hold, or has BTC finally closed the gap?
Not financial advice. Always manage your risk.
#ETH #Bitcoin #CryptoComparison #LongTermHolding
🔥
$ETH OUTPERFORMED BTC BY 3.4X OVER THE LAST DECADE 💥
A $10,000 bet on Bitcoin turned into $640K. Same capital in Ethereum? $2.17 million. That's not just a win — that's a 3.4x difference against the king.
The numbers are public. The FUD around Ethereum has been loud for years, but the data doesn't lie. We're talking about a decade-long track record that puts most altcoin narratives to shame.
What's your take — is ETH still the better long-term hold, or has BTC finally closed the gap?
Not financial advice. Always manage your risk.
#ETH #Bitcoin #CryptoComparison #LongTermHolding
🔥
A $10,000 bet on Bitcoin turned into $640K. Same capital in Ethereum? $2.17 million. That's not just a win — that's a 3.4x difference against the king.
The numbers are public. The FUD around Ethereum has been loud for years, but the data doesn't lie. We're talking about a decade-long track record that puts most altcoin narratives to shame.
What's your take — is ETH still the better long-term hold, or has BTC finally closed the gap?
Not financial advice. Always manage your risk.
#ETH #Bitcoin #CryptoComparison #LongTermHolding
🔥
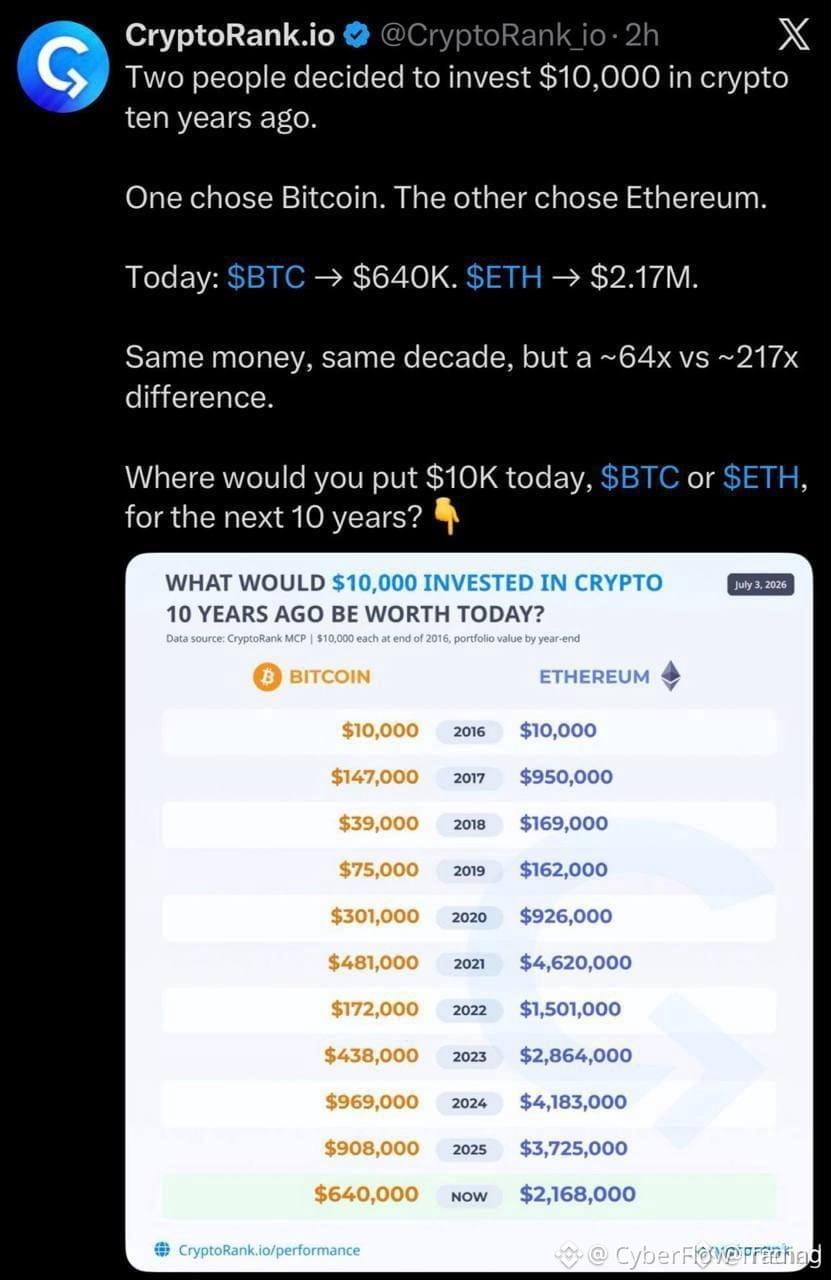
48
·
--
Coin Clash: ONE vs OPN! 🚀 Let's dive into these two movers.
ONEUSDT is on an absolute tear today, surging 36.84% 📈 with its RSI at a fiery 81.54! 🔥 This indicates intense upward momentum, but also suggests it's deeply overbought. Its 24h high to low range of 0.00111-0.0019 shows significant volatility. Volume sits at 5.7M USDT.
OPNUSDT, while not as explosive, is showing solid gains of 8.15% 🟢. Its RSI at 70.18 signals strong bullish momentum without being as extreme as ONE. Crucially, OPN boasts a massive trading volume of 110.9M USDT 💎, indicating much higher market liquidity and interest. Volatility is comparatively lower with a tighter 24h range. Both coins show bullish short-term trends with SMA20 above SMA50.
So, do you prefer the high-octane volatility and momentum of ONE ⚡ or the stronger liquidity and steady climb of OPN? 🎯 What's your pick? Drop a comment below!
#CryptoComparison #ONEUSDT #OPNUSDT #MarketAnalysis #TradeSmart
Not financial advice. DYOR.
Coin Clash: ONE vs OPN! 🚀 Let's dive into these two movers.
ONEUSDT is on an absolute tear today, surging 36.84% 📈 with its RSI at a fiery 81.54! 🔥 This indicates intense upward momentum, but also suggests it's deeply overbought. Its 24h high to low range of 0.00111-0.0019 shows significant volatility. Volume sits at 5.7M USDT.
OPNUSDT, while not as explosive, is showing solid gains of 8.15% 🟢. Its RSI at 70.18 signals strong bullish momentum without being as extreme as ONE. Crucially, OPN boasts a massive trading volume of 110.9M USDT 💎, indicating much higher market liquidity and interest. Volatility is comparatively lower with a tighter 24h range. Both coins show bullish short-term trends with SMA20 above SMA50.
So, do you prefer the high-octane volatility and momentum of ONE ⚡ or the stronger liquidity and steady climb of OPN? 🎯 What's your pick? Drop a comment below!
#CryptoComparison #ONEUSDT #OPNUSDT #MarketAnalysis #TradeSmart
Not financial advice. DYOR.
ONEUSDT is on an absolute tear today, surging 36.84% 📈 with its RSI at a fiery 81.54! 🔥 This indicates intense upward momentum, but also suggests it's deeply overbought. Its 24h high to low range of 0.00111-0.0019 shows significant volatility. Volume sits at 5.7M USDT.
OPNUSDT, while not as explosive, is showing solid gains of 8.15% 🟢. Its RSI at 70.18 signals strong bullish momentum without being as extreme as ONE. Crucially, OPN boasts a massive trading volume of 110.9M USDT 💎, indicating much higher market liquidity and interest. Volatility is comparatively lower with a tighter 24h range. Both coins show bullish short-term trends with SMA20 above SMA50.
So, do you prefer the high-octane volatility and momentum of ONE ⚡ or the stronger liquidity and steady climb of OPN? 🎯 What's your pick? Drop a comment below!
#CryptoComparison #ONEUSDT #OPNUSDT #MarketAnalysis #TradeSmart
Not financial advice. DYOR.
1
150
·
--
Comparing USUAL and TRUMP on Binance Square! USUALUSDT is up 19.06% at 0.01212, with 6.1M USDT volume and moderate volatility. Technicals show momentum building but not overheated (RSI neutral, near SMA 20, above SMA 50).
TRUMPUSDT surged a massive 64.55% to 2.845, with enormous 196.7M USDT volume and extreme volatility. Its RSI is 77.10 (overbought) and price is well above SMAs, indicating very strong, possibly overheated bullish momentum.
In summary, TRUMP leads significantly in momentum and volume, exhibiting higher volatility and a strong breakout. USUAL shows more contained, gradual growth and neutral technicals. Which is on your watchlist?
#CryptoComparison #BinanceSquare #Altcoins #TradingInsights #MarketWatch
Not financial advice. DYOR.
Comparing USUAL and TRUMP on Binance Square! USUALUSDT is up 19.06% at 0.01212, with 6.1M USDT volume and moderate volatility. Technicals show momentum building but not overheated (RSI neutral, near SMA 20, above SMA 50).
TRUMPUSDT surged a massive 64.55% to 2.845, with enormous 196.7M USDT volume and extreme volatility. Its RSI is 77.10 (overbought) and price is well above SMAs, indicating very strong, possibly overheated bullish momentum.
In summary, TRUMP leads significantly in momentum and volume, exhibiting higher volatility and a strong breakout. USUAL shows more contained, gradual growth and neutral technicals. Which is on your watchlist?
#CryptoComparison #BinanceSquare #Altcoins #TradingInsights #MarketWatch
Not financial advice. DYOR.
TRUMPUSDT surged a massive 64.55% to 2.845, with enormous 196.7M USDT volume and extreme volatility. Its RSI is 77.10 (overbought) and price is well above SMAs, indicating very strong, possibly overheated bullish momentum.
In summary, TRUMP leads significantly in momentum and volume, exhibiting higher volatility and a strong breakout. USUAL shows more contained, gradual growth and neutral technicals. Which is on your watchlist?
#CryptoComparison #BinanceSquare #Altcoins #TradingInsights #MarketWatch
Not financial advice. DYOR.
234
·
--
MIRA vs THE: A quick 24h comparison!
MIRAUSDT is up 17.27% to 0.0489 (5.02M Vol). Its 1h RSI at 76.03 suggests overbought, indicating strong momentum but potential pullback. Bullish SMA setup.
THEUSDT surged 35.32% to 0.0636 (11.04M Vol), nearly double MIRA's, showing higher market interest. Its 1h RSI of 65.81 indicates strong buying, less overbought than MIRA. Higher volatility & wider range. Also a bullish SMA setup.
THE leads in percentage gain & volume. MIRA has strong individual momentum but is hitting higher RSI. Both display bullish SMA setups.
Which one are you watching closer? Share below! 👇
#CryptoComparison #MIRA #THE #BinanceSquare #MarketAnalysis
Not financial advice. DYOR.
MIRA vs THE: A quick 24h comparison!
MIRAUSDT is up 17.27% to 0.0489 (5.02M Vol). Its 1h RSI at 76.03 suggests overbought, indicating strong momentum but potential pullback. Bullish SMA setup.
THEUSDT surged 35.32% to 0.0636 (11.04M Vol), nearly double MIRA's, showing higher market interest. Its 1h RSI of 65.81 indicates strong buying, less overbought than MIRA. Higher volatility & wider range. Also a bullish SMA setup.
THE leads in percentage gain & volume. MIRA has strong individual momentum but is hitting higher RSI. Both display bullish SMA setups.
Which one are you watching closer? Share below! 👇
#CryptoComparison #MIRA #THE #BinanceSquare #MarketAnalysis
Not financial advice. DYOR.
MIRAUSDT is up 17.27% to 0.0489 (5.02M Vol). Its 1h RSI at 76.03 suggests overbought, indicating strong momentum but potential pullback. Bullish SMA setup.
THEUSDT surged 35.32% to 0.0636 (11.04M Vol), nearly double MIRA's, showing higher market interest. Its 1h RSI of 65.81 indicates strong buying, less overbought than MIRA. Higher volatility & wider range. Also a bullish SMA setup.
THE leads in percentage gain & volume. MIRA has strong individual momentum but is hitting higher RSI. Both display bullish SMA setups.
Which one are you watching closer? Share below! 👇
#CryptoComparison #MIRA #THE #BinanceSquare #MarketAnalysis
Not financial advice. DYOR.
200

🚀 Let's compare two trending coins: $PONS vs. $RAY!
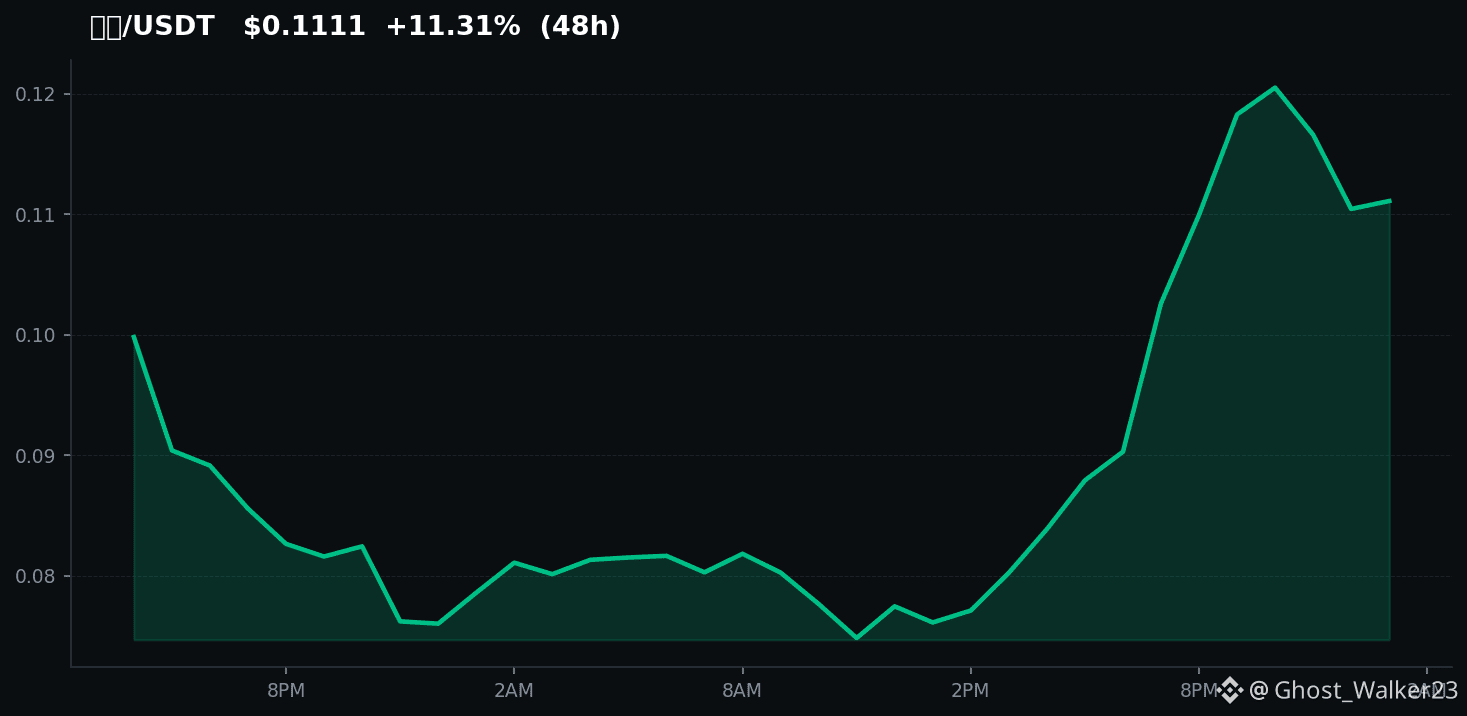
$PONS is currently down -10.1%, mientras que $RAY has surged +17.9%! As you can see below in the chart, $RAY exhibits stronger momentum. Pero, ¿tiene $PONS la capacidad de recuperarse?
What do you think? 💭 #USAugustPPIRisesLessThanExpected #CryptoComparison
📈 Follow for more real-time market breakdowns!
🚀 Let's compare two trending coins: $PONS vs. $RAY !
$PONS is currently down -10.1%, mientras que $RAY has surged +17.9%! As you can see below in the chart, $RAY exhibits stronger momentum. Pero, ¿tiene $PONS la capacidad de recuperarse?
What do you think? 💭 #USAugustPPIRisesLessThanExpected #CryptoComparison
📈 Follow for more real-time market breakdowns!
$PONS is currently down -10.1%, mientras que $RAY has surged +17.9%! As you can see below in the chart, $RAY exhibits stronger momentum. Pero, ¿tiene $PONS la capacidad de recuperarse?
What do you think? 💭 #USAugustPPIRisesLessThanExpected #CryptoComparison
📈 Follow for more real-time market breakdowns!
288

Спот чи Binance Earn: що обрати для вашого капіталу?
Управління активами вимагає чіткого розуміння інструментів. Порівняємо два популярні підходи на Binance:
1. Спотова торгівля (Spot Trading):
Плюси: Повний контроль над купівлею/продажем, можливість отримати високий прибуток під час росту ринку.
Особливості: Вимагає постійного аналізу графіків, часу та стійкості до волатильності.
2. Binance Earn (Simple Earn):
Плюси: Пасивний дохід без необхідності щодня стежити за ринком, низький поріг входження, вибір між гнучкими та фіксованими термінами.
Особливості: Дохідність зазвичай нижча, ніж при вдалій торгівлі, але ризики суттєво менші.
Висновок: Для активного капіталу підходить Спот, а для резерву та довгострокових збережень — Binance Earn. Ідеальна стратегія — комбінувати обидва!
#BinanceEarn #SpotTradding #CryptoComparison #BinanceSquare
Спот чи Binance Earn: що обрати для вашого капіталу?
Управління активами вимагає чіткого розуміння інструментів. Порівняємо два популярні підходи на Binance:
1. Спотова торгівля (Spot Trading):
Плюси: Повний контроль над купівлею/продажем, можливість отримати високий прибуток під час росту ринку.
Особливості: Вимагає постійного аналізу графіків, часу та стійкості до волатильності.
2. Binance Earn (Simple Earn):
Плюси: Пасивний дохід без необхідності щодня стежити за ринком, низький поріг входження, вибір між гнучкими та фіксованими термінами.
Особливості: Дохідність зазвичай нижча, ніж при вдалій торгівлі, але ризики суттєво менші.
Висновок: Для активного капіталу підходить Спот, а для резерву та довгострокових збережень — Binance Earn. Ідеальна стратегія — комбінувати обидва!
#BinanceEarn #SpotTradding #CryptoComparison #BinanceSquare
Управління активами вимагає чіткого розуміння інструментів. Порівняємо два популярні підходи на Binance:
1. Спотова торгівля (Spot Trading):
Плюси: Повний контроль над купівлею/продажем, можливість отримати високий прибуток під час росту ринку.
Особливості: Вимагає постійного аналізу графіків, часу та стійкості до волатильності.
2. Binance Earn (Simple Earn):
Плюси: Пасивний дохід без необхідності щодня стежити за ринком, низький поріг входження, вибір між гнучкими та фіксованими термінами.
Особливості: Дохідність зазвичай нижча, ніж при вдалій торгівлі, але ризики суттєво менші.
Висновок: Для активного капіталу підходить Спот, а для резерву та довгострокових збережень — Binance Earn. Ідеальна стратегія — комбінувати обидва!
#BinanceEarn #SpotTradding #CryptoComparison #BinanceSquare
1
90
·
--
Binance Square Movers! EPIC (EPICUSDT) surged 39.27% to 0.688 USDT, showing strong bullish momentum above SMAs. However, 1h RSI at 73.65 signals overbought (Vol 5.69M). UTK (UTKUSDT) is up 16.23% at 0.00795 USDT, with high volume (10.2M) but extreme volatility, dropping from 0.0244 high to near 0.00677 low. It's now below its SMA20 with a neutral 1h RSI (51.40). EPIC shows sustained surge, while UTK saw a huge pullback after an even bigger rally. Which mover are you watching? Drop a comment! #CryptoComparison #EPIC #UTK #BinanceSquare
Not financial advice. DYOR.
Binance Square Movers! EPIC (EPICUSDT) surged 39.27% to 0.688 USDT, showing strong bullish momentum above SMAs. However, 1h RSI at 73.65 signals overbought (Vol 5.69M). UTK (UTKUSDT) is up 16.23% at 0.00795 USDT, with high volume (10.2M) but extreme volatility, dropping from 0.0244 high to near 0.00677 low. It's now below its SMA20 with a neutral 1h RSI (51.40). EPIC shows sustained surge, while UTK saw a huge pullback after an even bigger rally. Which mover are you watching? Drop a comment! #CryptoComparison #EPIC #UTK #BinanceSquare
Not financial advice. DYOR.
Not financial advice. DYOR.
54
·
--
Crypto Watch: OPN vs BARD! OPN (0.0653) is down -6.85% in 24h with 27.48M volume. Its 1h RSI at 21.84 suggests oversold conditions, potentially hinting at a bounce, but it trades below short-term SMAs, showing bearish pressure. BARD (0.131) is up +4.47% with 6.42M volume. Its 1h RSI is 34.39 and price is consolidating above its 1h SMA 50, indicating a bullish trend. Both showed notable volatility. OPN is high volume & oversold in a downtrend, while BARD has positive momentum in an uptrend. Which looks more interesting? Share your thoughts! #CryptoComparison #Altcoins #MarketAnalysis #OPN #BARD
Not financial advice. DYOR.
Crypto Watch: OPN vs BARD! OPN (0.0653) is down -6.85% in 24h with 27.48M volume. Its 1h RSI at 21.84 suggests oversold conditions, potentially hinting at a bounce, but it trades below short-term SMAs, showing bearish pressure. BARD (0.131) is up +4.47% with 6.42M volume. Its 1h RSI is 34.39 and price is consolidating above its 1h SMA 50, indicating a bullish trend. Both showed notable volatility. OPN is high volume & oversold in a downtrend, while BARD has positive momentum in an uptrend. Which looks more interesting? Share your thoughts! #CryptoComparison #Altcoins #MarketAnalysis #OPN #BARD
Not financial advice. DYOR.
Not financial advice. DYOR.
203
·
--
Comparing ZEN and FF, both showing strong 24h gains: ZEN +7.00% ($7.685), FF +6.24% ($0.15093). Both maintain bullish short-term trends above their SMAs. ZEN's 1-hour RSI is high at 72.02, suggesting it might be overbought. In contrast, FF's RSI at 61.53 looks healthier with room to grow. FF also leads in 24h volume (11.8M USDT vs ZEN's 8.6M USDT), indicating greater market interest. Both exhibited significant daily volatility. While ZEN appears stretched, FF shows robust volume and healthier momentum. Which are you watching? #CryptoComparison #ZEN #FF #TechnicalAnalysis #MarketUpdate
Not financial advice. DYOR.
Comparing ZEN and FF, both showing strong 24h gains: ZEN +7.00% ($7.685), FF +6.24% ($0.15093). Both maintain bullish short-term trends above their SMAs. ZEN's 1-hour RSI is high at 72.02, suggesting it might be overbought. In contrast, FF's RSI at 61.53 looks healthier with room to grow. FF also leads in 24h volume (11.8M USDT vs ZEN's 8.6M USDT), indicating greater market interest. Both exhibited significant daily volatility. While ZEN appears stretched, FF shows robust volume and healthier momentum. Which are you watching? #CryptoComparison #ZEN #FF #TechnicalAnalysis #MarketUpdate
Not financial advice. DYOR.
Not financial advice. DYOR.
141
·
--
Let's compare REUSDT vs BELUSDT! 🚀
RE (0.8147) has plunged -18.00% in 24h, hitting 0.7961. Its RSI at 20.92 signals deeply oversold conditions. 📉 Price is well below 1h SMA20 (0.891) and SMA50 (0.954), showing strong bearish momentum. A massive 24h volume of 66.3M USDT indicates high interest amidst this volatility. 🔴
Conversely, BEL (0.1705) is soaring 17.26% in 24h, peaking at 0.1938. Its RSI at 60.24 suggests healthy bullish momentum, not yet overbought. 📈 BEL trades above 1h SMA20 (0.165) and SMA50 (0.159), confirming its positive trend. Volume for BEL is 7.4M USDT, showing sustained buying interest. 🟢
Summary: RE shows high downside volatility and volume, potentially eyeing a bounce from oversold levels. BEL exhibits strong bullish momentum with solid volume. Two very different market narratives! 🔥
Which trend do you find more compelling? Drop a comment! 🎯
#CryptoComparison #REUSDT #BELUSDT #MarketAnalysis #CryptoTrading
Not financial advice. DYOR.
Let's compare REUSDT vs BELUSDT! 🚀
RE (0.8147) has plunged -18.00% in 24h, hitting 0.7961. Its RSI at 20.92 signals deeply oversold conditions. 📉 Price is well below 1h SMA20 (0.891) and SMA50 (0.954), showing strong bearish momentum. A massive 24h volume of 66.3M USDT indicates high interest amidst this volatility. 🔴
Conversely, BEL (0.1705) is soaring 17.26% in 24h, peaking at 0.1938. Its RSI at 60.24 suggests healthy bullish momentum, not yet overbought. 📈 BEL trades above 1h SMA20 (0.165) and SMA50 (0.159), confirming its positive trend. Volume for BEL is 7.4M USDT, showing sustained buying interest. 🟢
Summary: RE shows high downside volatility and volume, potentially eyeing a bounce from oversold levels. BEL exhibits strong bullish momentum with solid volume. Two very different market narratives! 🔥
Which trend do you find more compelling? Drop a comment! 🎯
#CryptoComparison #REUSDT #BELUSDT #MarketAnalysis #CryptoTrading
Not financial advice. DYOR.
RE (0.8147) has plunged -18.00% in 24h, hitting 0.7961. Its RSI at 20.92 signals deeply oversold conditions. 📉 Price is well below 1h SMA20 (0.891) and SMA50 (0.954), showing strong bearish momentum. A massive 24h volume of 66.3M USDT indicates high interest amidst this volatility. 🔴
Conversely, BEL (0.1705) is soaring 17.26% in 24h, peaking at 0.1938. Its RSI at 60.24 suggests healthy bullish momentum, not yet overbought. 📈 BEL trades above 1h SMA20 (0.165) and SMA50 (0.159), confirming its positive trend. Volume for BEL is 7.4M USDT, showing sustained buying interest. 🟢
Summary: RE shows high downside volatility and volume, potentially eyeing a bounce from oversold levels. BEL exhibits strong bullish momentum with solid volume. Two very different market narratives! 🔥
Which trend do you find more compelling? Drop a comment! 🎯
#CryptoComparison #REUSDT #BELUSDT #MarketAnalysis #CryptoTrading
Not financial advice. DYOR.
200
තවත් අන්තර්ගතයන් ගවේෂණය කිරීමට ඇතුල් වන්න
Binance චතුරශ්රය හි ගෝලීය ක්රිප්ටෝ පරිශීලකයින් හා එක්වන්න
⚡️ ක්රිප්ටෝ පිළිබඳ නවතම සහ ප්රයෝජනවත් තොරතුරු ලබා ගන්න.
💬 ලොව විශාලතම ක්රිප්ටෝ හුවමාරුව මගින් විශ්වාස කෙරේ.
👍 සත්යායනය කරන ලද නිර්මාණකරුවන්ගෙන් සැබෑ විදසුන් සොයා ගන්න.
විද්යුත් තැපෑල / දුරකථන අංකය
නැගී එන මාතෘකා
1
#JobsReportRaisesHikeOdds
340,201 නැරඹීම්
2,579 සාකච්ඡා කරමින්
2
#CPITestsDecemberRateOutlook
61,593 නැරඹීම්
668 සාකච්ඡා කරමින්
3
#BitcoinRebounds$75KAsChipsLead
28,350 නැරඹීම්
261 සාකච්ඡා කරමින්
4
#US Data Center Rules May Constrain AI Expansion
51,029 නැරඹීම්
189 සාකච්ඡා කරමින්
5
#ARKPlans14ThematicETFsCoveringAIAndTokenizedMarkets
914 නැරඹීම්
33 සාකච්ඡා කරමින්
6
#WillAnthropicListOnTime
90,864 නැරඹීම්
1,032 සාකච්ඡා කරමින්
7
#WillUS-IranTensionsBoostSafe-HavenDemand?
28,575 නැරඹීම්
289 සාකච්ඡා කරමින්
8
#BitcoinETFsSee$412MNetOutflows
7,210 නැරඹීම්
49 සාකච්ඡා කරමින්
9
#HKSFCPlansToRestrictCryptoAndExchangeTerms
26,105 නැරඹීම්
369 සාකච්ඡා කරමින්
10
#TradFiForBeginners
56,039 නැරඹීම්
797 සාකච්ඡා කරමින්