
The Trader Lady
29.6k Публикации

The Trader Lady
Отправить жалобу
Заблокировать пользователя
Crypto strategist | Market signals daily | Trade smart, not emotional. Follow for real-time setups & profit-driven insights
Открытая сделка
8 мес.
12 подписок(и/а)
584 подписчиков(а)
4.8K+ понравилось
Посты
Портфель
Все
Цитирования
PINNED
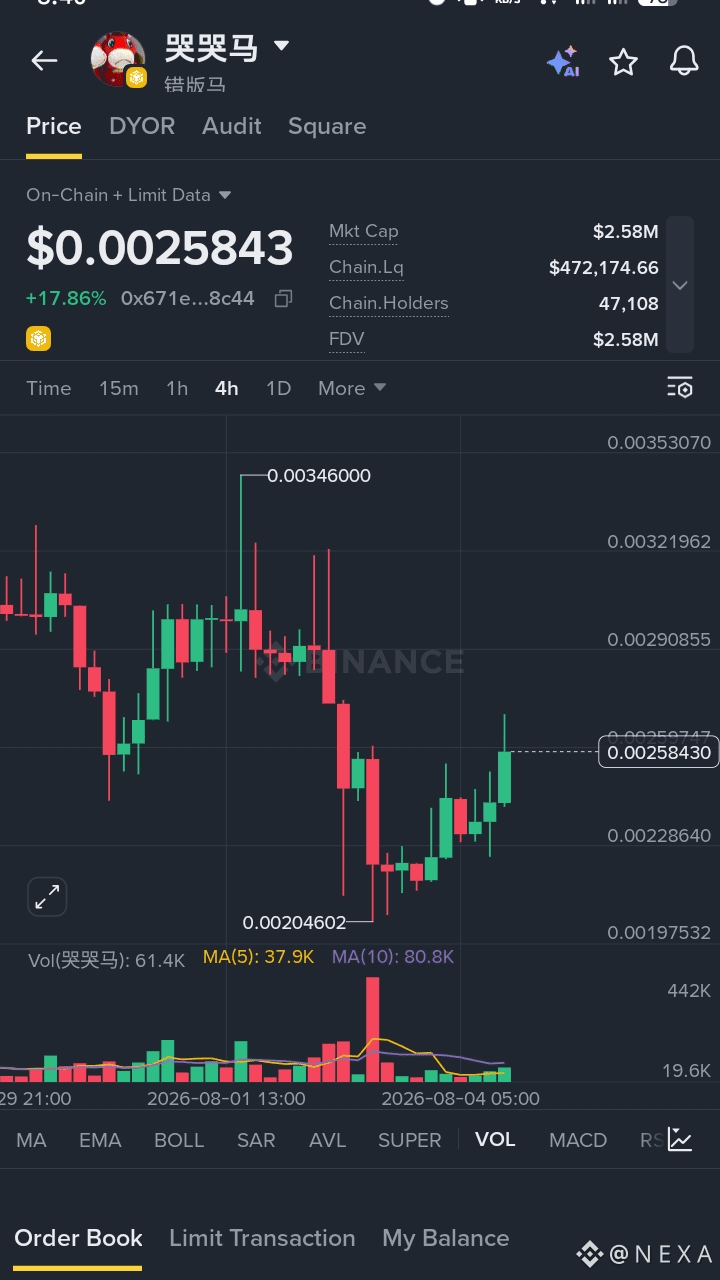
$哭哭马 马 ИДЕТ ВЫШЕ по этой монете +17.9% на сильном импульсе и объёмах, поддерживающих движение. 🔥📈
НАБОР ДЛЯ ДЛИННОЙ СДЕЛКИ 🟢
🔹 Зона входа: 0.00258 – 0.00259
🔹 Бычий уровень выше: 0.00257
🔹 TP1: 0.00265
🔹 TP2: 0.00273
🔹 TP3: 0.00284
🔹 Стоп-лосс: 0.00255
⚡ Импульс выглядит сильным, пока цена удерживается выше бычьего уровня. Держите риск под контролем и отслеживайте цели по шагам.
Смотрим на следующий пробой — пусть импульс работает 👇
$VIC $SIREN
$哭哭马 马 ИДЕТ ВЫШЕ по этой монете +17.9% на сильном импульсе и объёмах, поддерживающих движение. 🔥📈
НАБОР ДЛЯ ДЛИННОЙ СДЕЛКИ 🟢
🔹 Зона входа: 0.00258 – 0.00259
🔹 Бычий уровень выше: 0.00257
🔹 TP1: 0.00265
🔹 TP2: 0.00273
🔹 TP3: 0.00284
🔹 Стоп-лосс: 0.00255
⚡ Импульс выглядит сильным, пока цена удерживается выше бычьего уровня. Держите риск под контролем и отслеживайте цели по шагам.
Смотрим на следующий пробой — пусть импульс работает 👇
$VIC $SIREN
НАБОР ДЛЯ ДЛИННОЙ СДЕЛКИ 🟢
🔹 Зона входа: 0.00258 – 0.00259
🔹 Бычий уровень выше: 0.00257
🔹 TP1: 0.00265
🔹 TP2: 0.00273
🔹 TP3: 0.00284
🔹 Стоп-лосс: 0.00255
⚡ Импульс выглядит сильным, пока цена удерживается выше бычьего уровня. Держите риск под контролем и отслеживайте цели по шагам.
Смотрим на следующий пробой — пусть импульс работает 👇
$VIC $SIREN
1
1
10
6.2k
·
--
Рост
См. перевод
$ADBEB Success rarely happens all at once; it builds until positive momentum is firmly established and undeniable. Positioning yourself wisely at this juncture allows you to honor your past efforts while capturing the maximum upside of future opportunities. Life rewards those who recognize when the tide has turned and have the courage to set sail immediately.
Strong recovery bounce, testing local resistance.
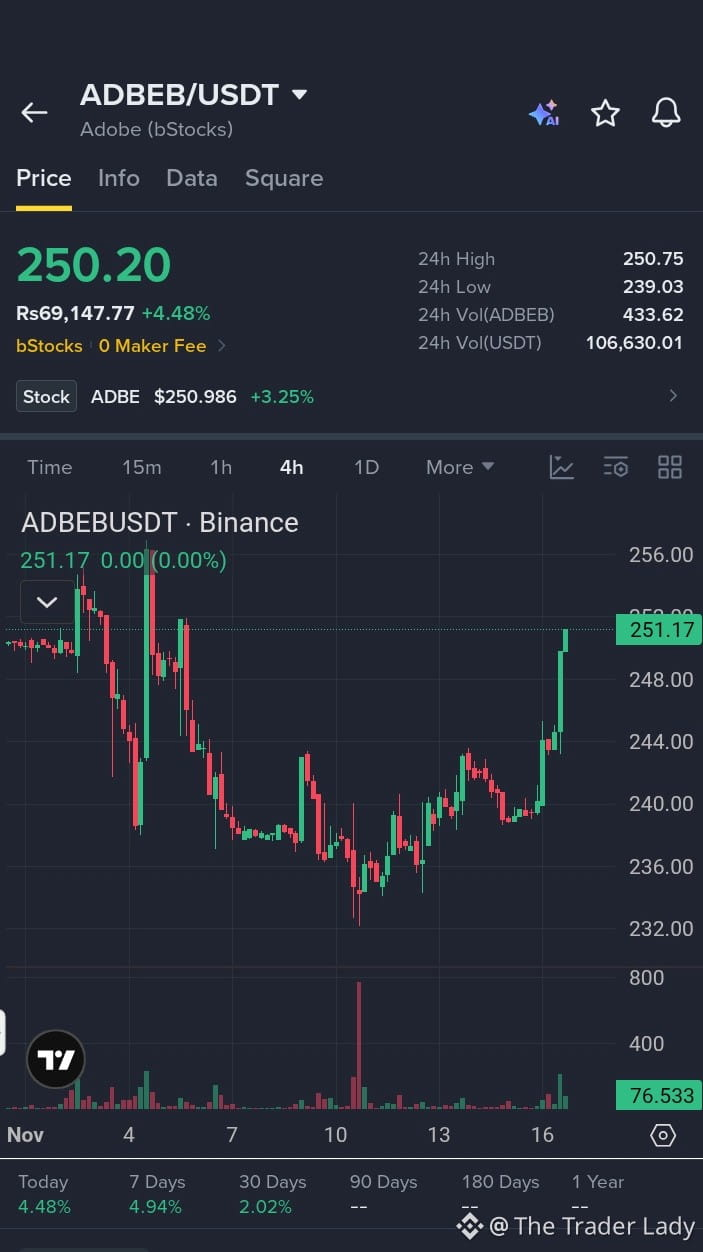
This is a tokenized stock tracking Adobe. After a volatile drop to the $232 support, the price has recovered steadily, currently at $250 (+4.5%). The 4H chart shows a solid series of higher lows, but it is approaching immediate overhead resistance.
Trade Plan:
EP: $248 – $252
Targets:
🎯 TP1: $256
🎯 TP2: $265
🎯 TP3: $275
Note: 💡 Context: This tracks traditional equity markets. The bounce is steady, but it needs a push in volume to clear the $252-$256 resistance zone. If it rejects here, expect a retest of the $244 support. Trail stops to protect gains. DYOR.
#ADBEB #Stocks #Trading #Long
{spot}(ADBEBUSDT)
$EVAA
{alpha}(560xaa036928c9c0df07d525b55ea8ee690bb5a628c1)
$VINE
{alpha}(CT_5016AJcP7wuLwmRYLBNbi825wgguaPsWzPBEHcHndpRpump)
$ADBEB Success rarely happens all at once; it builds until positive momentum is firmly established and undeniable. Positioning yourself wisely at this juncture allows you to honor your past efforts while capturing the maximum upside of future opportunities. Life rewards those who recognize when the tide has turned and have the courage to set sail immediately.
Strong recovery bounce, testing local resistance.
This is a tokenized stock tracking Adobe. After a volatile drop to the $232 support, the price has recovered steadily, currently at $250 (+4.5%). The 4H chart shows a solid series of higher lows, but it is approaching immediate overhead resistance.
Trade Plan:
EP: $248 – $252
Targets:
🎯 TP1: $256
🎯 TP2: $265
🎯 TP3: $275
Note: 💡 Context: This tracks traditional equity markets. The bounce is steady, but it needs a push in volume to clear the $252-$256 resistance zone. If it rejects here, expect a retest of the $244 support. Trail stops to protect gains. DYOR.
#ADBEB #Stocks #Trading #Long
$EVAA
$VINE
Strong recovery bounce, testing local resistance.
This is a tokenized stock tracking Adobe. After a volatile drop to the $232 support, the price has recovered steadily, currently at $250 (+4.5%). The 4H chart shows a solid series of higher lows, but it is approaching immediate overhead resistance.
Trade Plan:
EP: $248 – $252
Targets:
🎯 TP1: $256
🎯 TP2: $265
🎯 TP3: $275
Note: 💡 Context: This tracks traditional equity markets. The bounce is steady, but it needs a push in volume to clear the $252-$256 resistance zone. If it rejects here, expect a retest of the $244 support. Trail stops to protect gains. DYOR.
#ADBEB #Stocks #Trading #Long
$EVAA
$VINE
15
·
--
Рост
См. перевод
$BOTB Rising conversion rates and repeat orders confirm that positive momentum is firmly established in our storefront. Positioning our inventory and ad spend at this juncture captures the maximum upside of this surging consumer demand. Scaling up right now ensures we meet every buyer with what they want while profit margins are at their strongest
Flatlining, extremely low liquidity.
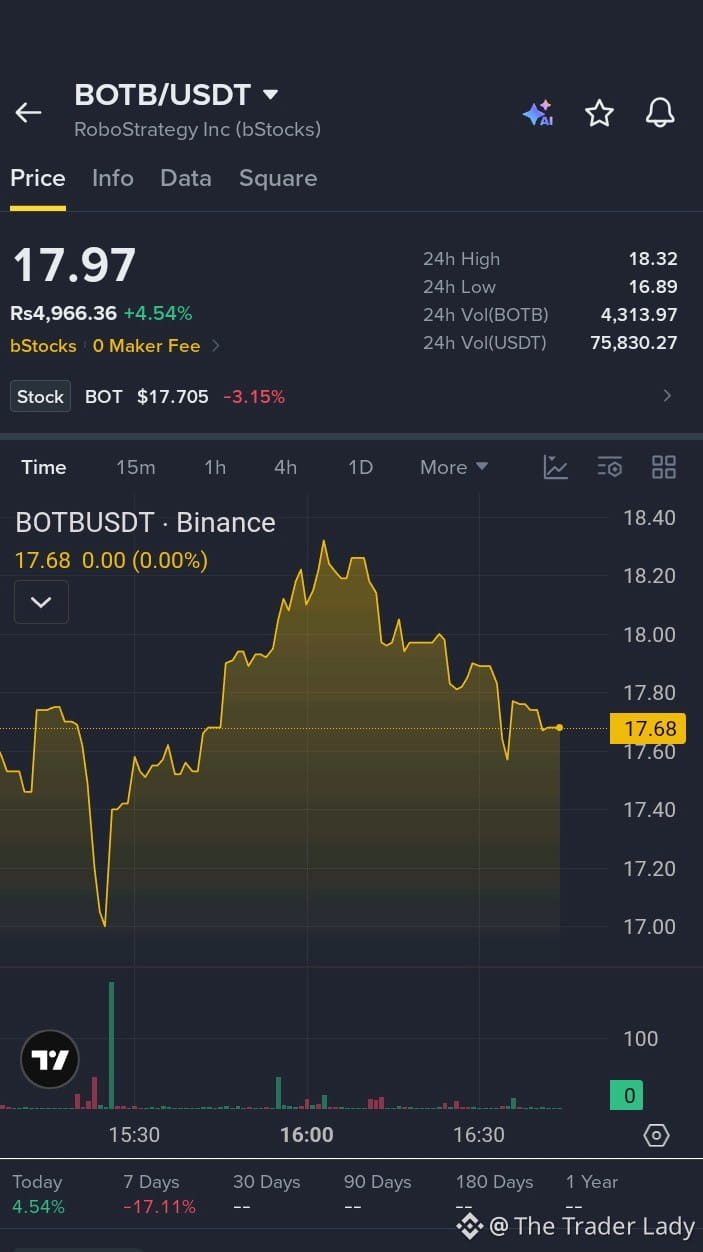
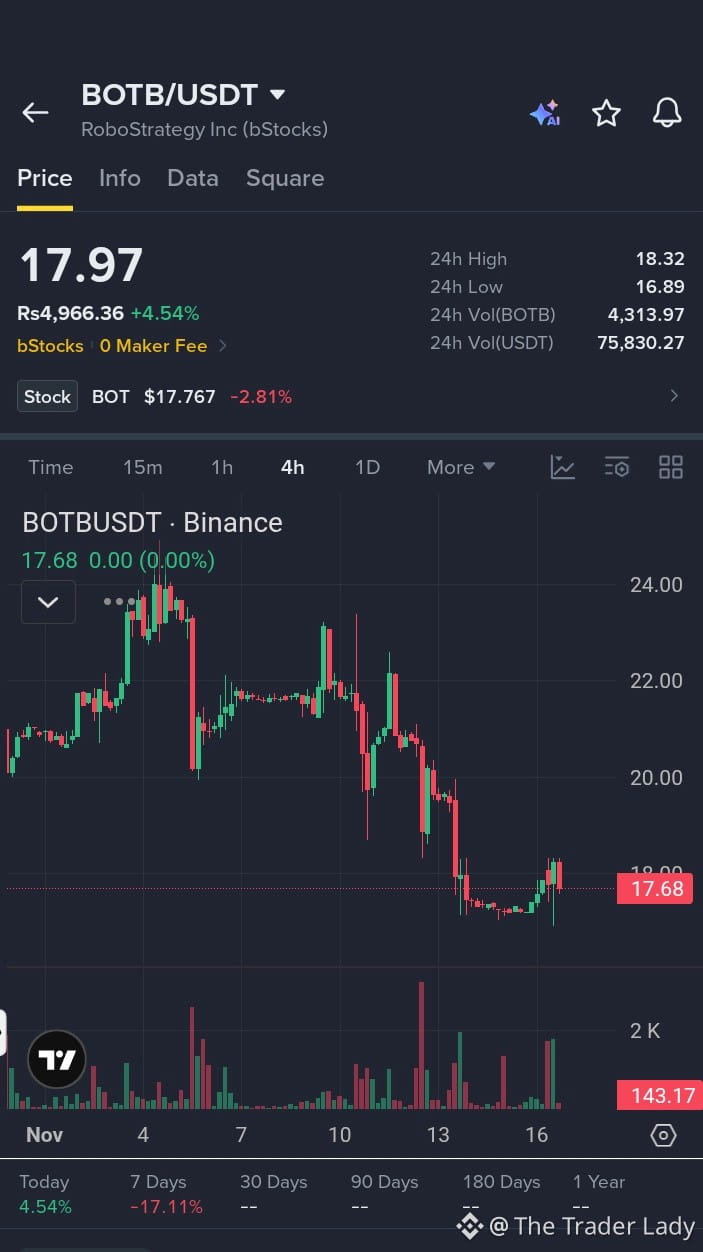
The 4H chart shows a heavy downtrend followed by a flat, sideways range around the $17.70 support. The current price is $17.97 (+4.5%), but the volume is completely dead, and the order book is incredibly thin.
Trade Plan:
EP: Avoid. This chart is currently untradeable due to the dead volume and lack of structure. Wait for a sustained increase in volume and a clear breakout above $19.00 before considering an entry.
**SL:** $16.50 (Strict stop below the recent structural low).
Targets:
🎯 TP1: $19.50
🎯 TP2: $21.00
🎯 TP3: $23.00
Note: ⚠️ Liquidity Warning: This is a tokenized equity product with extremely thin trading activity. You will face severe slippage, and exiting a position could be very difficult. Protect your capital and wait for real market participation. DYOR.
#BOTB #Stocks #Trading #Warning
{spot}(BOTBUSDT)
$SPACE
{alpha}(560x87acfa3fd7a6e0d48677d070644d76905c2bdc00)
$BLESS
{alpha}(560x7c8217517ed4711fe2deccdfeffe8d906b9ae11f)
$BOTB Rising conversion rates and repeat orders confirm that positive momentum is firmly established in our storefront. Positioning our inventory and ad spend at this juncture captures the maximum upside of this surging consumer demand. Scaling up right now ensures we meet every buyer with what they want while profit margins are at their strongest
Flatlining, extremely low liquidity.
The 4H chart shows a heavy downtrend followed by a flat, sideways range around the $17.70 support. The current price is $17.97 (+4.5%), but the volume is completely dead, and the order book is incredibly thin.
Trade Plan:
EP: Avoid. This chart is currently untradeable due to the dead volume and lack of structure. Wait for a sustained increase in volume and a clear breakout above $19.00 before considering an entry.
**SL:** $16.50 (Strict stop below the recent structural low).
Targets:
🎯 TP1: $19.50
🎯 TP2: $21.00
🎯 TP3: $23.00
Note: ⚠️ Liquidity Warning: This is a tokenized equity product with extremely thin trading activity. You will face severe slippage, and exiting a position could be very difficult. Protect your capital and wait for real market participation. DYOR.
#BOTB #Stocks #Trading #Warning
$SPACE
$BLESS
Flatlining, extremely low liquidity.
The 4H chart shows a heavy downtrend followed by a flat, sideways range around the $17.70 support. The current price is $17.97 (+4.5%), but the volume is completely dead, and the order book is incredibly thin.
Trade Plan:
EP: Avoid. This chart is currently untradeable due to the dead volume and lack of structure. Wait for a sustained increase in volume and a clear breakout above $19.00 before considering an entry.
**SL:** $16.50 (Strict stop below the recent structural low).
Targets:
🎯 TP1: $19.50
🎯 TP2: $21.00
🎯 TP3: $23.00
Note: ⚠️ Liquidity Warning: This is a tokenized equity product with extremely thin trading activity. You will face severe slippage, and exiting a position could be very difficult. Protect your capital and wait for real market participation. DYOR.
#BOTB #Stocks #Trading #Warning
$SPACE
$BLESS
6
·
--
Рост
$BOTB Ваши недавние достижения принесли свои плоды, и положительная динамика прочно укрепила вашу профессиональную репутацию. Сейчас, когда вы на виду, переход к новым руководящим ролям может дать максимальную выгоду. Лица, принимающие решения, обращают на вас внимание, поэтому это идеальный момент, чтобы попросить о желаемом и ускорить карьерный рост.
Слабый отскок на фоне сильного нисходящего тренда.
Это токенизированная акция, отражающая динамику RoboStrategy. После продолжительного снижения с пика $24.00 до уровня поддержки $17.00 цена пытается немного восстановиться (+4.5%) — до $17.97. На 4-часовом графике виден небольшой зелёный отскок, однако общая картина остаётся явно медвежьей, а объёмы — низкими.
План сделки:
EP: Подождать. Не стоит гнаться за этим слабым отскоком. Дождитесь подтверждённого закрытия зелёной 4-часовой свечи выше $19.00, чтобы убедиться в развороте, или дождитесь повторного тестирования поддержки на уровне $17.00.
SL: $16.50 (строгий стоп-лосс ниже недавнего структурного минимума).
Цели:
🎯 TP1: $19.50
🎯 TP2: $21.00
🎯 TP3: $23.00
Примечание: 💡 Контекст: этот актив отражает динамику традиционных фондовых рынков. Отскок незначительный, и для преодоления сопротивления сверху нужен резкий рост объёмов. Если цена потеряет поддержку на уровне $17.50, ожидайте повторного тестирования минимумов. Проводите собственный анализ.
#BOTB #Акции #Трейдинг #Лонг
{spot}(BOTBUSDT)
$VINE
{alpha}(CT_5016AJcP7wuLwmRYLBNbi825wgguaPsWzPBEHcHndpRpump)
$SPACE
{alpha}(560x87acfa3fd7a6e0d48677d070644d76905c2bdc00)
$BOTB Ваши недавние достижения принесли свои плоды, и положительная динамика прочно укрепила вашу профессиональную репутацию. Сейчас, когда вы на виду, переход к новым руководящим ролям может дать максимальную выгоду. Лица, принимающие решения, обращают на вас внимание, поэтому это идеальный момент, чтобы попросить о желаемом и ускорить карьерный рост.
Слабый отскок на фоне сильного нисходящего тренда.
Это токенизированная акция, отражающая динамику RoboStrategy. После продолжительного снижения с пика $24.00 до уровня поддержки $17.00 цена пытается немного восстановиться (+4.5%) — до $17.97. На 4-часовом графике виден небольшой зелёный отскок, однако общая картина остаётся явно медвежьей, а объёмы — низкими.
План сделки:
EP: Подождать. Не стоит гнаться за этим слабым отскоком. Дождитесь подтверждённого закрытия зелёной 4-часовой свечи выше $19.00, чтобы убедиться в развороте, или дождитесь повторного тестирования поддержки на уровне $17.00.
SL: $16.50 (строгий стоп-лосс ниже недавнего структурного минимума).
Цели:
🎯 TP1: $19.50
🎯 TP2: $21.00
🎯 TP3: $23.00
Примечание: 💡 Контекст: этот актив отражает динамику традиционных фондовых рынков. Отскок незначительный, и для преодоления сопротивления сверху нужен резкий рост объёмов. Если цена потеряет поддержку на уровне $17.50, ожидайте повторного тестирования минимумов. Проводите собственный анализ.
#BOTB #Акции #Трейдинг #Лонг
$VINE
$SPACE
Слабый отскок на фоне сильного нисходящего тренда.
Это токенизированная акция, отражающая динамику RoboStrategy. После продолжительного снижения с пика $24.00 до уровня поддержки $17.00 цена пытается немного восстановиться (+4.5%) — до $17.97. На 4-часовом графике виден небольшой зелёный отскок, однако общая картина остаётся явно медвежьей, а объёмы — низкими.
План сделки:
EP: Подождать. Не стоит гнаться за этим слабым отскоком. Дождитесь подтверждённого закрытия зелёной 4-часовой свечи выше $19.00, чтобы убедиться в развороте, или дождитесь повторного тестирования поддержки на уровне $17.00.
SL: $16.50 (строгий стоп-лосс ниже недавнего структурного минимума).
Цели:
🎯 TP1: $19.50
🎯 TP2: $21.00
🎯 TP3: $23.00
Примечание: 💡 Контекст: этот актив отражает динамику традиционных фондовых рынков. Отскок незначительный, и для преодоления сопротивления сверху нужен резкий рост объёмов. Если цена потеряет поддержку на уровне $17.50, ожидайте повторного тестирования минимумов. Проводите собственный анализ.
#BOTB #Акции #Трейдинг #Лонг
$VINE
$SPACE
3
·
--
Рост
См. перевод
$MMT After several decisive victories, positive momentum is firmly established in the locker room and on the field. Positioning our strategy aggressively at this juncture captures the maximum upside of our team's confidence and rhythm. When everything is clicking like this, pressing the advantage is the surest way to dominate the remainder of the season.
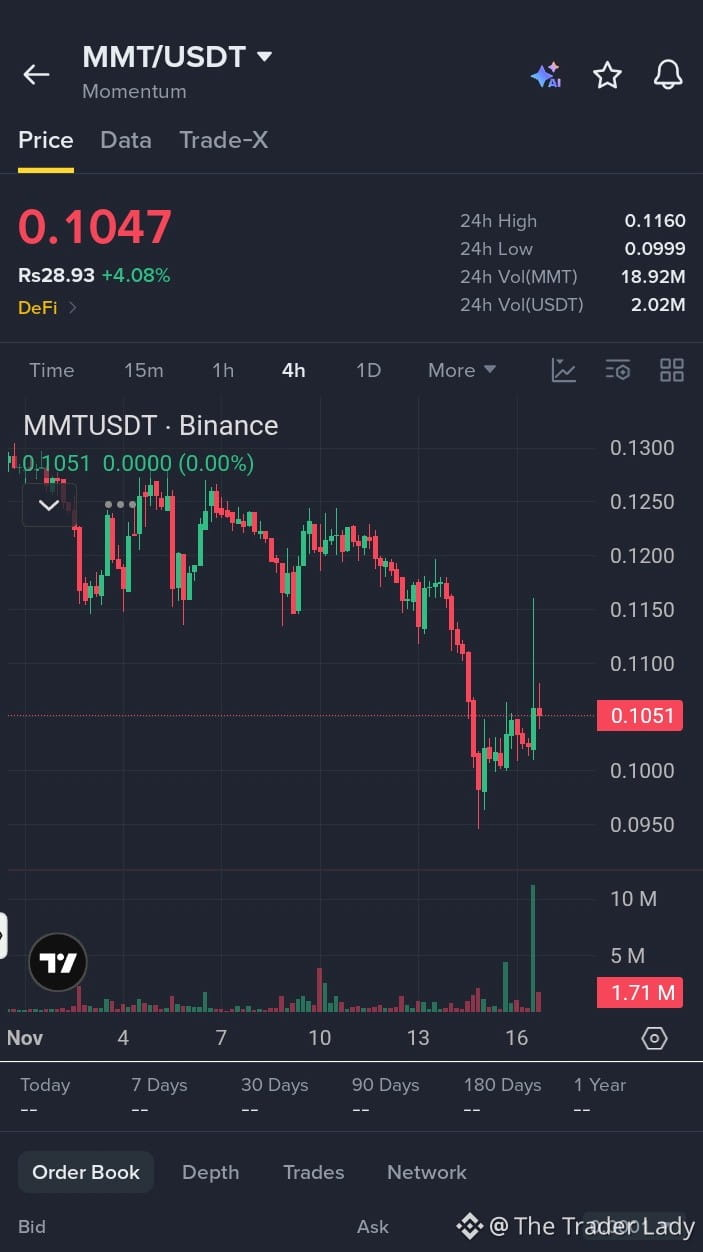
Choppy recovery after a heavy downtrend.
The 4H chart shows a prolonged decline from the $0.130 peak down to the $0.095 support. It recently printed a strong impulsive wick to $0.115 but was immediately rejected back to $0.105 (+4%). The price action remains highly volatile.
Trade Plan:
EP: Wait. Do not chase this volatile wick. Look for a confirmed 4H green candle close above $0.110 to validate a breakout, or wait for a pullback to hold support around the $0.098-$0.100 zone.
**SL:** $0.092 (Strict stop below the recent structural low).
Targets:
🎯 TP1: $0.115
🎯 TP2: $0.125
🎯 TP3: $0.130
Note: ⚠️ Caution: The chart shows a relief bounce with heavy rejection wicks and thin volume. It needs a strong surge in buying pressure to clear the overhead supply. If it loses the $0.100 support, expect a retest of the $0.095 lows. DYOR.
#MMT #Momentum #Crypto #Trading #Long
{future}(MMTUSDT)
$EVAA
{alpha}(560xaa036928c9c0df07d525b55ea8ee690bb5a628c1)
$BLESS
{alpha}(560x7c8217517ed4711fe2deccdfeffe8d906b9ae11f)
$MMT After several decisive victories, positive momentum is firmly established in the locker room and on the field. Positioning our strategy aggressively at this juncture captures the maximum upside of our team's confidence and rhythm. When everything is clicking like this, pressing the advantage is the surest way to dominate the remainder of the season.
Choppy recovery after a heavy downtrend.
The 4H chart shows a prolonged decline from the $0.130 peak down to the $0.095 support. It recently printed a strong impulsive wick to $0.115 but was immediately rejected back to $0.105 (+4%). The price action remains highly volatile.
Trade Plan:
EP: Wait. Do not chase this volatile wick. Look for a confirmed 4H green candle close above $0.110 to validate a breakout, or wait for a pullback to hold support around the $0.098-$0.100 zone.
**SL:** $0.092 (Strict stop below the recent structural low).
Targets:
🎯 TP1: $0.115
🎯 TP2: $0.125
🎯 TP3: $0.130
Note: ⚠️ Caution: The chart shows a relief bounce with heavy rejection wicks and thin volume. It needs a strong surge in buying pressure to clear the overhead supply. If it loses the $0.100 support, expect a retest of the $0.095 lows. DYOR.
#MMT #Momentum #Crypto #Trading #Long
$EVAA
$BLESS
Choppy recovery after a heavy downtrend.
The 4H chart shows a prolonged decline from the $0.130 peak down to the $0.095 support. It recently printed a strong impulsive wick to $0.115 but was immediately rejected back to $0.105 (+4%). The price action remains highly volatile.
Trade Plan:
EP: Wait. Do not chase this volatile wick. Look for a confirmed 4H green candle close above $0.110 to validate a breakout, or wait for a pullback to hold support around the $0.098-$0.100 zone.
**SL:** $0.092 (Strict stop below the recent structural low).
Targets:
🎯 TP1: $0.115
🎯 TP2: $0.125
🎯 TP3: $0.130
Note: ⚠️ Caution: The chart shows a relief bounce with heavy rejection wicks and thin volume. It needs a strong surge in buying pressure to clear the overhead supply. If it loses the $0.100 support, expect a retest of the $0.095 lows. DYOR.
#MMT #Momentum #Crypto #Trading #Long
$EVAA
$BLESS
4
·
--
Рост
$RPL Сильные квартальные результаты доказывают, что положительная динамика прочно закрепилась в наших ключевых направлениях деятельности. Размещение капитала с расчётом на расширение именно сейчас позволит максимально воспользоваться благоприятной экономической конъюнктурой. Вместо того чтобы оставаться в стороне, использование нашей нынешней силы уже сегодня укрепит наши лидирующие позиции на долгие годы.
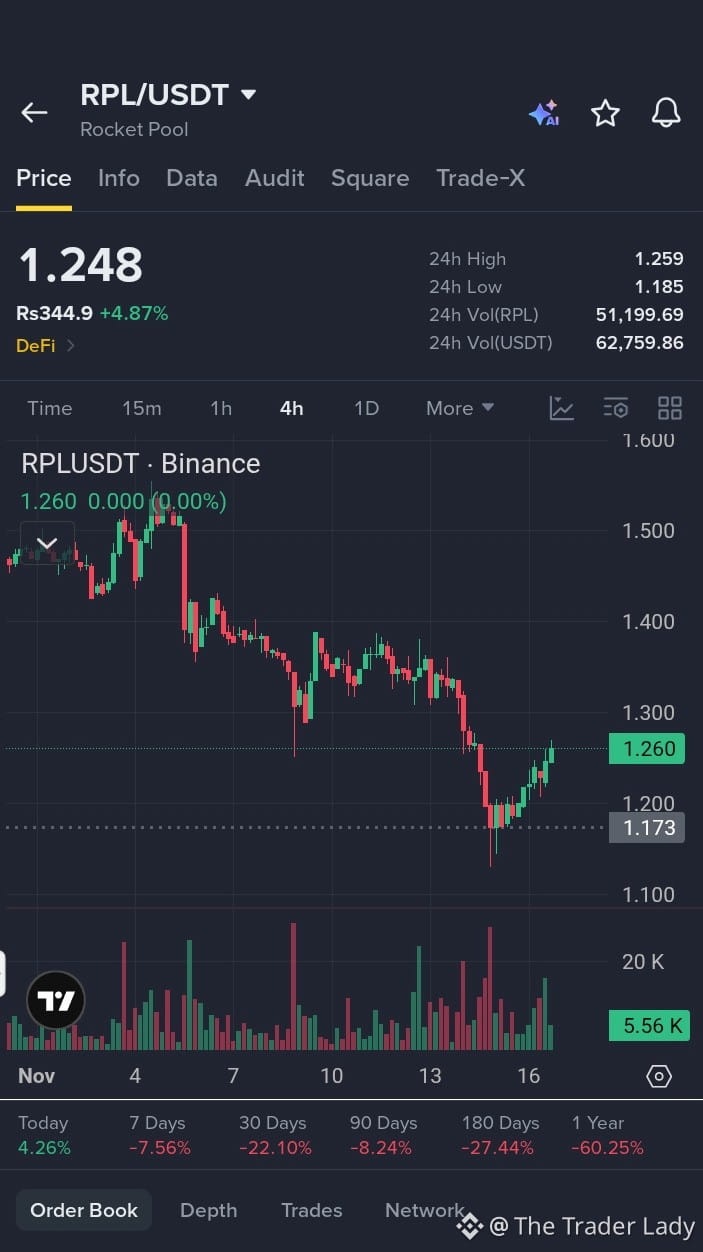
Резкий отскок от локальных минимумов: проверка ближайшего уровня сопротивления.
После продолжительного нисходящего тренда с уровня выше $1.50 до поддержки на $1.17 цена стабильно восстановилась (+4.9%) до $1.24. На 4-часовом графике формируется серия повышающихся минимумов, что указывает на активизацию покупателей, однако цена приближается к ближайшему сопротивлению сверху.
Торговый план:
EP: $1.22 – $1.25 (текущая зона консолидации. Дождитесь подтверждённого закрытия зелёной 4-часовой свечи выше $1.26, чтобы подтвердить пробой).
**SL:** $1.15 (строгий стоп-лосс ниже последнего структурного повышающегося минимума).
Цели:
🎯 TP1: $1.30
🎯 TP2: $1.36
🎯 TP3: $1.45
Примечание: отскок выглядит обнадёживающе, но для преодоления сопротивления на $1.30 необходим резкий всплеск объёма. Если цена отобьётся от этого уровня, ожидайте повторного тестирования поддержки на $1.20. Перемещайте стопы вслед за ценой, чтобы защитить прибыль. Проводите собственное исследование (DYOR).
#RPL #RocketPool #Криптовалюта #Трейдинг #Лонг
{future}(RPLUSDT)
$ZEC
{future}(ZECUSDT)
$BLESS
{alpha}(560x7c8217517ed4711fe2deccdfeffe8d906b9ae11f)
$RPL Сильные квартальные результаты доказывают, что положительная динамика прочно закрепилась в наших ключевых направлениях деятельности. Размещение капитала с расчётом на расширение именно сейчас позволит максимально воспользоваться благоприятной экономической конъюнктурой. Вместо того чтобы оставаться в стороне, использование нашей нынешней силы уже сегодня укрепит наши лидирующие позиции на долгие годы.
Резкий отскок от локальных минимумов: проверка ближайшего уровня сопротивления.
После продолжительного нисходящего тренда с уровня выше $1.50 до поддержки на $1.17 цена стабильно восстановилась (+4.9%) до $1.24. На 4-часовом графике формируется серия повышающихся минимумов, что указывает на активизацию покупателей, однако цена приближается к ближайшему сопротивлению сверху.
Торговый план:
EP: $1.22 – $1.25 (текущая зона консолидации. Дождитесь подтверждённого закрытия зелёной 4-часовой свечи выше $1.26, чтобы подтвердить пробой).
**SL:** $1.15 (строгий стоп-лосс ниже последнего структурного повышающегося минимума).
Цели:
🎯 TP1: $1.30
🎯 TP2: $1.36
🎯 TP3: $1.45
Примечание: отскок выглядит обнадёживающе, но для преодоления сопротивления на $1.30 необходим резкий всплеск объёма. Если цена отобьётся от этого уровня, ожидайте повторного тестирования поддержки на $1.20. Перемещайте стопы вслед за ценой, чтобы защитить прибыль. Проводите собственное исследование (DYOR).
#RPL #RocketPool #Криптовалюта #Трейдинг #Лонг
$ZEC
$BLESS
Резкий отскок от локальных минимумов: проверка ближайшего уровня сопротивления.
После продолжительного нисходящего тренда с уровня выше $1.50 до поддержки на $1.17 цена стабильно восстановилась (+4.9%) до $1.24. На 4-часовом графике формируется серия повышающихся минимумов, что указывает на активизацию покупателей, однако цена приближается к ближайшему сопротивлению сверху.
Торговый план:
EP: $1.22 – $1.25 (текущая зона консолидации. Дождитесь подтверждённого закрытия зелёной 4-часовой свечи выше $1.26, чтобы подтвердить пробой).
**SL:** $1.15 (строгий стоп-лосс ниже последнего структурного повышающегося минимума).
Цели:
🎯 TP1: $1.30
🎯 TP2: $1.36
🎯 TP3: $1.45
Примечание: отскок выглядит обнадёживающе, но для преодоления сопротивления на $1.30 необходим резкий всплеск объёма. Если цена отобьётся от этого уровня, ожидайте повторного тестирования поддержки на $1.20. Перемещайте стопы вслед за ценой, чтобы защитить прибыль. Проводите собственное исследование (DYOR).
#RPL #RocketPool #Криптовалюта #Трейдинг #Лонг
$ZEC
$BLESS
4
·
--
Рост
$ASTER Метрики активности сети и принятия показывают, что в этой экосистеме прочно закрепился позитивный импульс. Размещение стейка на этом этапе позволит получить максимальную выгоду до более широкого признания проекта. В быстро меняющихся секторах раннее распознавание подтверждённого тренда — главный ключ к раскрытию экспоненциального роста стоимости.
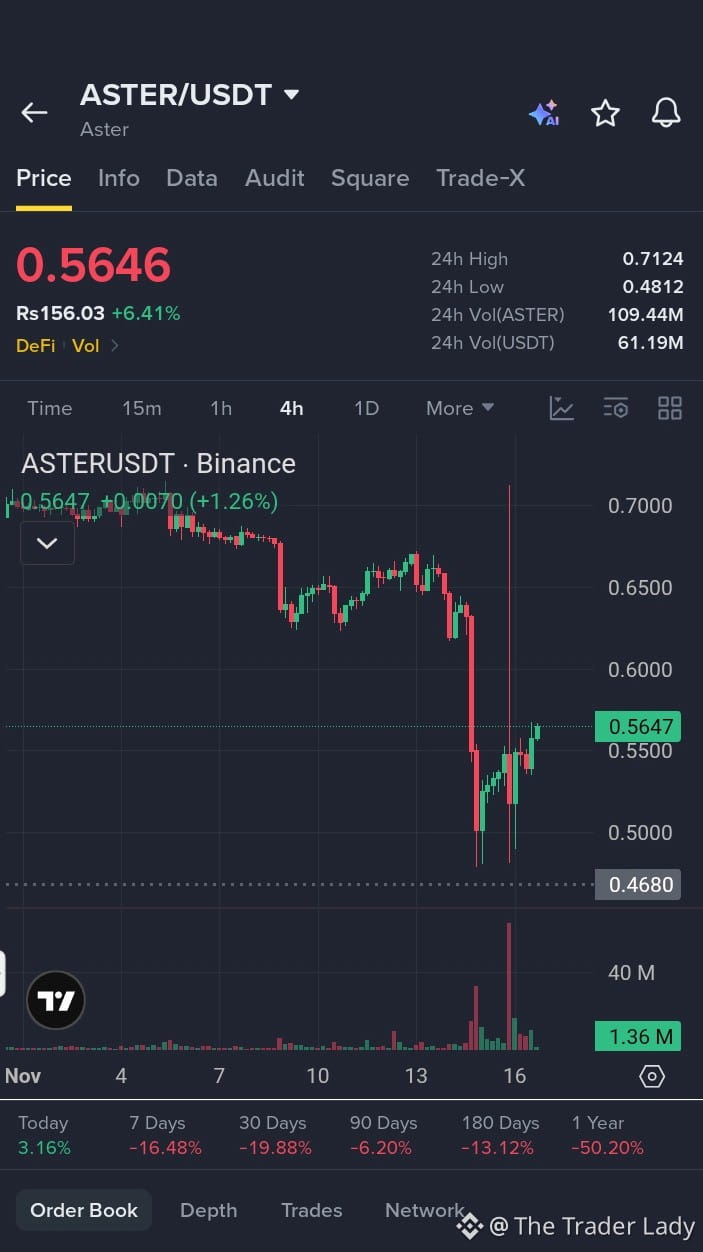
Слабый отскок после сильного нисходящего тренда.
На графике 4H виден затяжной спад с уровня выше $0.70 до минимума $0.468. Появилась небольшая зелёная свеча восстановления; сейчас цена торгуется на уровне $0.564 (+6.4%), однако общая структура остаётся явно медвежьей.
План сделки:
EP: Ждать. Не гнаться за этим слабым отскоком. Дождаться подтверждённого закрытия зелёной свечи 4H выше $0.600, чтобы подтвердить разворот, либо дождаться повторного тестирования поддержки $0.500.
SL: $0.460 (строгий стоп ниже недавнего структурного минимума).
Цели:
🎯 TP1: $0.620
🎯 TP2: $0.660
🎯 TP3: $0.712
Примечание: ⚠️ Осторожно: график показывает отскок коррекции при сильном сопротивлении сверху. Для преодоления ближайших уровней нужен резкий всплеск объёма. Если цена потеряет поддержку $0.530, ожидайте повторного тестирования минимумов $0.480. DYOR.
#ASTER #Aster #Криптовалюта #Трейдинг #Лонг
{future}(ASTERUSDT)
$VINE
{alpha}(CT_5016AJcP7wuLwmRYLBNbi825wgguaPsWzPBEHcHndpRpump)
$SPACE
{alpha}(560x87acfa3fd7a6e0d48677d070644d76905c2bdc00)
$ASTER Метрики активности сети и принятия показывают, что в этой экосистеме прочно закрепился позитивный импульс. Размещение стейка на этом этапе позволит получить максимальную выгоду до более широкого признания проекта. В быстро меняющихся секторах раннее распознавание подтверждённого тренда — главный ключ к раскрытию экспоненциального роста стоимости.
Слабый отскок после сильного нисходящего тренда.
На графике 4H виден затяжной спад с уровня выше $0.70 до минимума $0.468. Появилась небольшая зелёная свеча восстановления; сейчас цена торгуется на уровне $0.564 (+6.4%), однако общая структура остаётся явно медвежьей.
План сделки:
EP: Ждать. Не гнаться за этим слабым отскоком. Дождаться подтверждённого закрытия зелёной свечи 4H выше $0.600, чтобы подтвердить разворот, либо дождаться повторного тестирования поддержки $0.500.
SL: $0.460 (строгий стоп ниже недавнего структурного минимума).
Цели:
🎯 TP1: $0.620
🎯 TP2: $0.660
🎯 TP3: $0.712
Примечание: ⚠️ Осторожно: график показывает отскок коррекции при сильном сопротивлении сверху. Для преодоления ближайших уровней нужен резкий всплеск объёма. Если цена потеряет поддержку $0.530, ожидайте повторного тестирования минимумов $0.480. DYOR.
#ASTER #Aster #Криптовалюта #Трейдинг #Лонг
$VINE
$SPACE
Слабый отскок после сильного нисходящего тренда.
На графике 4H виден затяжной спад с уровня выше $0.70 до минимума $0.468. Появилась небольшая зелёная свеча восстановления; сейчас цена торгуется на уровне $0.564 (+6.4%), однако общая структура остаётся явно медвежьей.
План сделки:
EP: Ждать. Не гнаться за этим слабым отскоком. Дождаться подтверждённого закрытия зелёной свечи 4H выше $0.600, чтобы подтвердить разворот, либо дождаться повторного тестирования поддержки $0.500.
SL: $0.460 (строгий стоп ниже недавнего структурного минимума).
Цели:
🎯 TP1: $0.620
🎯 TP2: $0.660
🎯 TP3: $0.712
Примечание: ⚠️ Осторожно: график показывает отскок коррекции при сильном сопротивлении сверху. Для преодоления ближайших уровней нужен резкий всплеск объёма. Если цена потеряет поддержку $0.530, ожидайте повторного тестирования минимумов $0.480. DYOR.
#ASTER #Aster #Криптовалюта #Трейдинг #Лонг
$VINE
$SPACE
4
·
--
Рост
$WIN Ключевые этапы позади, и по мере перехода к следующей фазе реализации сохраняется уверенный позитивный импульс. Размещение наших лучших специалистов на этом этапе позволит максимально использовать потенциал текущей эффективности и обеспечить выдающийся конечный результат. Сохранение этого темпа сейчас станет решающим фактором между хорошим и отличным результатом.
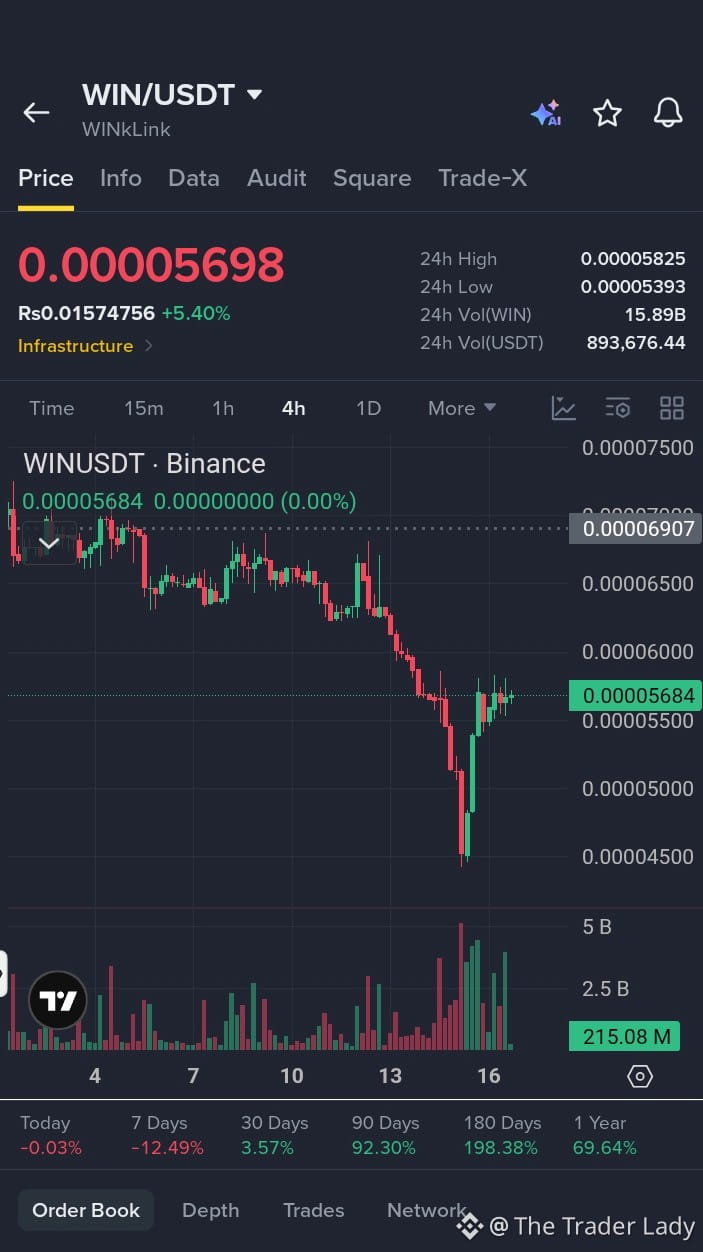
Слабый отскок на фоне сильного нисходящего тренда.
На 4-часовом графике видно продолжительное снижение с пика $0.000075 до уровня поддержки $0.000045. Появилась небольшая восстановительная свеча; сейчас цена составляет $0.000056 (+5.4%), однако общая структура по-прежнему выглядит крайне медвежьей, а импульс остаётся слабым.
План сделки:
EP: Ждать. Не гнаться за этим слабым отскоком. Дождаться подтверждённого закрытия зелёной 4-часовой свечи выше $0.000060, чтобы подтвердить разворот, либо дождаться повторного тестирования поддержки $0.000050.
SL: $0.000045 (Строгий стоп ниже недавнего структурного минимума).
Цели:
🎯 TP1: $0.000065
🎯 TP2: $0.000070
🎯 TP3: $0.000075
Примечание: ⚠️ Осторожно: это отскок коррекции с уменьшающимся объёмом. Для пробоя ближайшего сопротивления потребуется сильный всплеск покупательского давления. Если цена потеряет поддержку $0.000053, ожидайте повторного тестирования минимумов на $0.000045. DYOR.
#WIN #WINkLink #Crypto #Trading #Long
{spot}(WINUSDT)
$ZEC
{future}(ZECUSDT)
$WIN Ключевые этапы позади, и по мере перехода к следующей фазе реализации сохраняется уверенный позитивный импульс. Размещение наших лучших специалистов на этом этапе позволит максимально использовать потенциал текущей эффективности и обеспечить выдающийся конечный результат. Сохранение этого темпа сейчас станет решающим фактором между хорошим и отличным результатом.
Слабый отскок на фоне сильного нисходящего тренда.
На 4-часовом графике видно продолжительное снижение с пика $0.000075 до уровня поддержки $0.000045. Появилась небольшая восстановительная свеча; сейчас цена составляет $0.000056 (+5.4%), однако общая структура по-прежнему выглядит крайне медвежьей, а импульс остаётся слабым.
План сделки:
EP: Ждать. Не гнаться за этим слабым отскоком. Дождаться подтверждённого закрытия зелёной 4-часовой свечи выше $0.000060, чтобы подтвердить разворот, либо дождаться повторного тестирования поддержки $0.000050.
SL: $0.000045 (Строгий стоп ниже недавнего структурного минимума).
Цели:
🎯 TP1: $0.000065
🎯 TP2: $0.000070
🎯 TP3: $0.000075
Примечание: ⚠️ Осторожно: это отскок коррекции с уменьшающимся объёмом. Для пробоя ближайшего сопротивления потребуется сильный всплеск покупательского давления. Если цена потеряет поддержку $0.000053, ожидайте повторного тестирования минимумов на $0.000045. DYOR.
#WIN #WINkLink #Crypto #Trading #Long
$ZEC
Слабый отскок на фоне сильного нисходящего тренда.
На 4-часовом графике видно продолжительное снижение с пика $0.000075 до уровня поддержки $0.000045. Появилась небольшая восстановительная свеча; сейчас цена составляет $0.000056 (+5.4%), однако общая структура по-прежнему выглядит крайне медвежьей, а импульс остаётся слабым.
План сделки:
EP: Ждать. Не гнаться за этим слабым отскоком. Дождаться подтверждённого закрытия зелёной 4-часовой свечи выше $0.000060, чтобы подтвердить разворот, либо дождаться повторного тестирования поддержки $0.000050.
SL: $0.000045 (Строгий стоп ниже недавнего структурного минимума).
Цели:
🎯 TP1: $0.000065
🎯 TP2: $0.000070
🎯 TP3: $0.000075
Примечание: ⚠️ Осторожно: это отскок коррекции с уменьшающимся объёмом. Для пробоя ближайшего сопротивления потребуется сильный всплеск покупательского давления. Если цена потеряет поддержку $0.000053, ожидайте повторного тестирования минимумов на $0.000045. DYOR.
#WIN #WINkLink #Crypto #Trading #Long
$ZEC
3
·
--
Рост
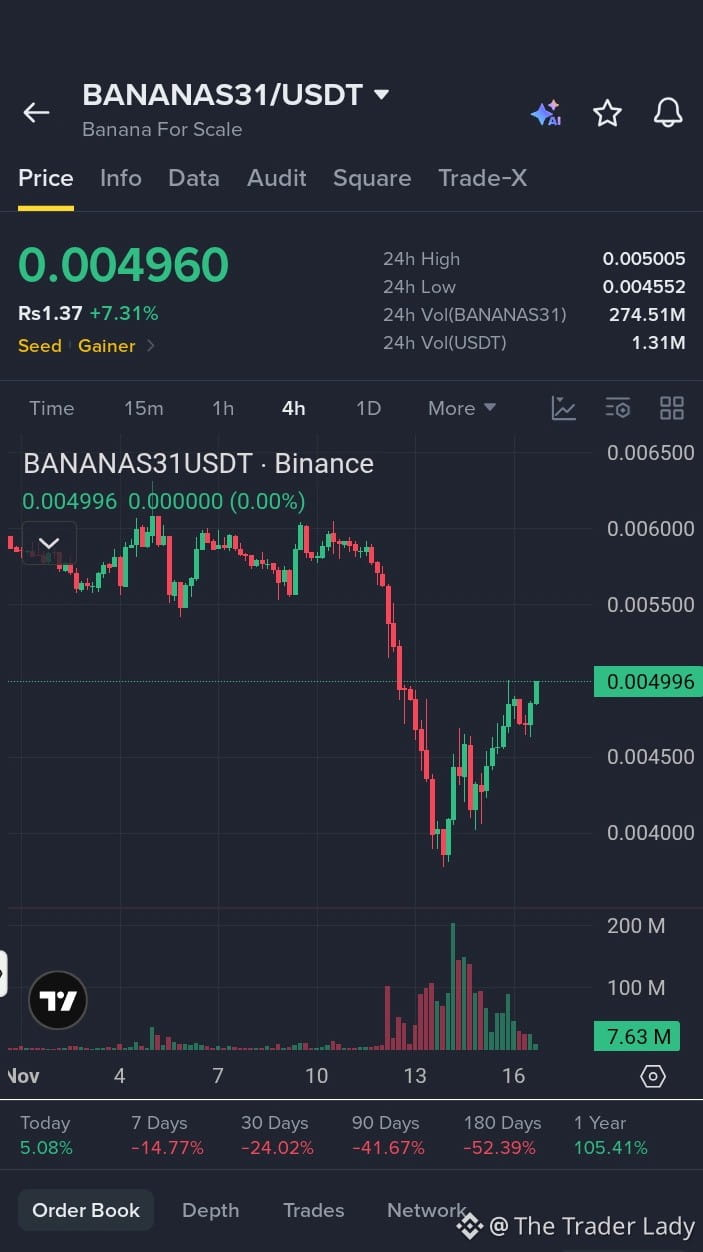
$BANANAS31 Вовлечённость аудитории стремительно растёт, подтверждая, что позитивный импульс для нашего бренда прочно закрепился. Запуск кампании в этот момент позволит извлечь максимальную выгоду из вирусного внимания и превратить любопытство в долгосрочную лояльность. Обратившись к аудитории на пике ажиотажа, мы максимизируем охват и влияние.
Сильное V-образное восстановление, проверка сопротивления.
После резкого падения к поддержке на уровне $0.0040 цена агрессивно отскочила (+7.3%) до $0.0049. На 4-часовом графике видна чёткая серия повышающихся минимумов в ходе восстановления, но цена приближается к зоне сопротивления сверху.
Торговый план:
EP: $0.0048 – $0.0050 (Текущая зона консолидации. Дождитесь подтверждённого закрытия зелёной 4-часовой свечи выше $0.0051, чтобы подтвердить пробой).
**SL:** $0.0044 (Стоп-лосс строго ниже недавнего структурного повышающегося минимума).
Цели:
🎯 TP1: $0.0055
🎯 TP2: $0.0060
🎯 TP3: $0.0065
Примечание: восстановление сильное, но цена упёрлась в ближайшее сопротивление. Чтобы преодолеть уровень $0.0050, нужен всплеск объёма. Если цена отобьётся от этого уровня, ожидайте повторного тестирования поддержки на $0.0045. Перемещайте стопы, чтобы защитить прибыль. Проводите собственное исследование.
#BANANAS31 #BananaForScale #Crypto #Trading #Long
{future}(BANANAS31USDT)
$BLESS
{alpha}(560x7c8217517ed4711fe2deccdfeffe8d906b9ae11f)
$ZEC
{future}(ZECUSDT)
$BANANAS31 Вовлечённость аудитории стремительно растёт, подтверждая, что позитивный импульс для нашего бренда прочно закрепился. Запуск кампании в этот момент позволит извлечь максимальную выгоду из вирусного внимания и превратить любопытство в долгосрочную лояльность. Обратившись к аудитории на пике ажиотажа, мы максимизируем охват и влияние.
Сильное V-образное восстановление, проверка сопротивления.
После резкого падения к поддержке на уровне $0.0040 цена агрессивно отскочила (+7.3%) до $0.0049. На 4-часовом графике видна чёткая серия повышающихся минимумов в ходе восстановления, но цена приближается к зоне сопротивления сверху.
Торговый план:
EP: $0.0048 – $0.0050 (Текущая зона консолидации. Дождитесь подтверждённого закрытия зелёной 4-часовой свечи выше $0.0051, чтобы подтвердить пробой).
**SL:** $0.0044 (Стоп-лосс строго ниже недавнего структурного повышающегося минимума).
Цели:
🎯 TP1: $0.0055
🎯 TP2: $0.0060
🎯 TP3: $0.0065
Примечание: восстановление сильное, но цена упёрлась в ближайшее сопротивление. Чтобы преодолеть уровень $0.0050, нужен всплеск объёма. Если цена отобьётся от этого уровня, ожидайте повторного тестирования поддержки на $0.0045. Перемещайте стопы, чтобы защитить прибыль. Проводите собственное исследование.
#BANANAS31 #BananaForScale #Crypto #Trading #Long
$BLESS
$ZEC
Сильное V-образное восстановление, проверка сопротивления.
После резкого падения к поддержке на уровне $0.0040 цена агрессивно отскочила (+7.3%) до $0.0049. На 4-часовом графике видна чёткая серия повышающихся минимумов в ходе восстановления, но цена приближается к зоне сопротивления сверху.
Торговый план:
EP: $0.0048 – $0.0050 (Текущая зона консолидации. Дождитесь подтверждённого закрытия зелёной 4-часовой свечи выше $0.0051, чтобы подтвердить пробой).
**SL:** $0.0044 (Стоп-лосс строго ниже недавнего структурного повышающегося минимума).
Цели:
🎯 TP1: $0.0055
🎯 TP2: $0.0060
🎯 TP3: $0.0065
Примечание: восстановление сильное, но цена упёрлась в ближайшее сопротивление. Чтобы преодолеть уровень $0.0050, нужен всплеск объёма. Если цена отобьётся от этого уровня, ожидайте повторного тестирования поддержки на $0.0045. Перемещайте стопы, чтобы защитить прибыль. Проводите собственное исследование.
#BANANAS31 #BananaForScale #Crypto #Trading #Long
$BLESS
$ZEC
4
·
--
Рост
См. перевод
$CYPHB Because positive momentum is firmly established, you no longer have to rely on guesswork to make your next move. Positioning at this juncture offers a reliable path to capture maximum upside without taking on unnecessary early-stage risks. The foundation is solid, the direction is clear, and the potential for strong returns is right in front of you
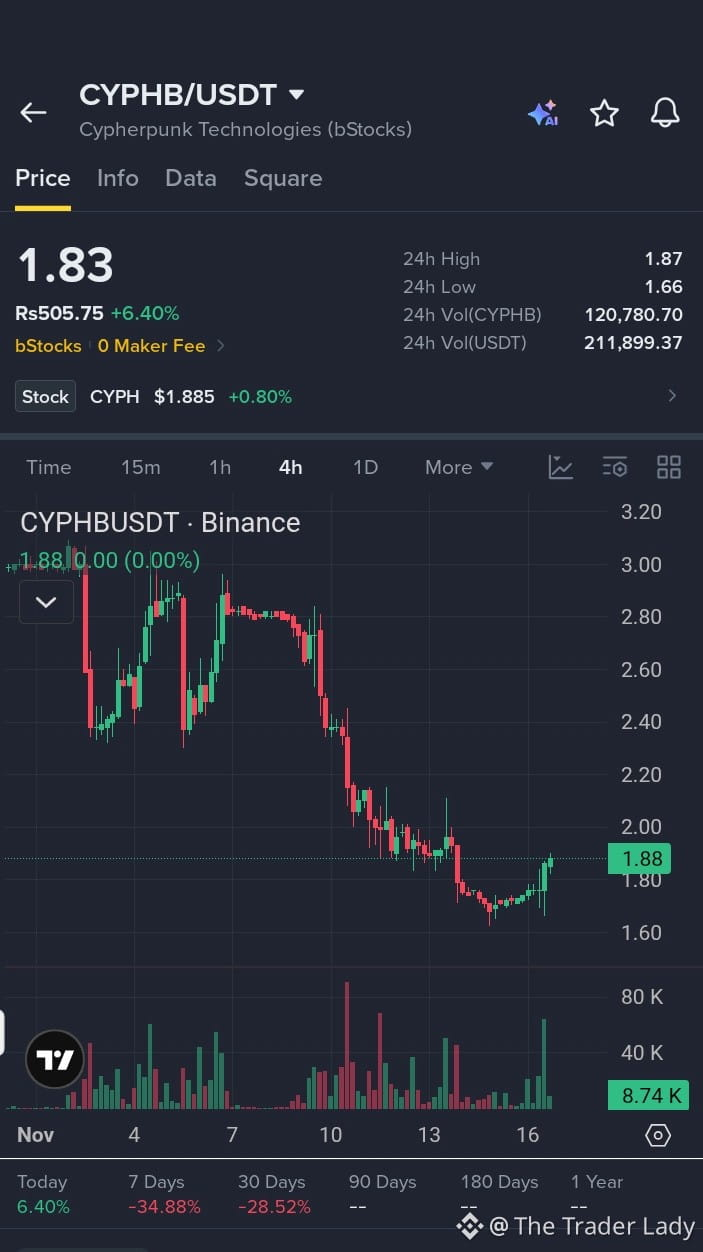
Weak bounce in a broader downtrend.
This is a tokenized stock tracking Cypherpunk Technologies. After a prolonged decline from the $3.00 peak down to the $1.60 support, the price is attempting a minor recovery (+6.4%) to $1.83. The 4H chart shows a small green bounce, but the overall structure remains bearish.
Trade Plan:
EP: Wait. Do not chase this weak bounce. Look for a confirmed 4H green candle close above $2.00 to validate a trend shift, or wait for a retest of the $1.70 support.
SL: $1.55 (Strict stop below the recent structural low).
Targets:
🎯 TP1: $2.10
🎯 TP2: $2.40
🎯 TP3: $2.80
Note: 💡 Context: This tracks traditional equity markets. The bounce is minor and volume is relatively low. It needs a strong surge in buying pressure to break through the overhead resistance. If it loses the $1.75 support, expect a retest of the lows. DYOR.
#CYPHB #Stocks #Trading #Long
{spot}(CYPHBUSDT)
$VINE
$CYPHB Because positive momentum is firmly established, you no longer have to rely on guesswork to make your next move. Positioning at this juncture offers a reliable path to capture maximum upside without taking on unnecessary early-stage risks. The foundation is solid, the direction is clear, and the potential for strong returns is right in front of you
Weak bounce in a broader downtrend.
This is a tokenized stock tracking Cypherpunk Technologies. After a prolonged decline from the $3.00 peak down to the $1.60 support, the price is attempting a minor recovery (+6.4%) to $1.83. The 4H chart shows a small green bounce, but the overall structure remains bearish.
Trade Plan:
EP: Wait. Do not chase this weak bounce. Look for a confirmed 4H green candle close above $2.00 to validate a trend shift, or wait for a retest of the $1.70 support.
SL: $1.55 (Strict stop below the recent structural low).
Targets:
🎯 TP1: $2.10
🎯 TP2: $2.40
🎯 TP3: $2.80
Note: 💡 Context: This tracks traditional equity markets. The bounce is minor and volume is relatively low. It needs a strong surge in buying pressure to break through the overhead resistance. If it loses the $1.75 support, expect a retest of the lows. DYOR.
#CYPHB #Stocks #Trading #Long
$VINE
Weak bounce in a broader downtrend.
This is a tokenized stock tracking Cypherpunk Technologies. After a prolonged decline from the $3.00 peak down to the $1.60 support, the price is attempting a minor recovery (+6.4%) to $1.83. The 4H chart shows a small green bounce, but the overall structure remains bearish.
Trade Plan:
EP: Wait. Do not chase this weak bounce. Look for a confirmed 4H green candle close above $2.00 to validate a trend shift, or wait for a retest of the $1.70 support.
SL: $1.55 (Strict stop below the recent structural low).
Targets:
🎯 TP1: $2.10
🎯 TP2: $2.40
🎯 TP3: $2.80
Note: 💡 Context: This tracks traditional equity markets. The bounce is minor and volume is relatively low. It needs a strong surge in buying pressure to break through the overhead resistance. If it loses the $1.75 support, expect a retest of the lows. DYOR.
#CYPHB #Stocks #Trading #Long
$VINE
7
·
--
Рост
См. перевод
$AIGENSYN You can feel the shift in the air; positive momentum is firmly established and pushing us toward new horizons. Positioning yourself at this juncture means stepping into the future with confidence and capturing the maximum upside of what is to come. Those who recognize the power of this moment and act with conviction will reap the greatest rewards.
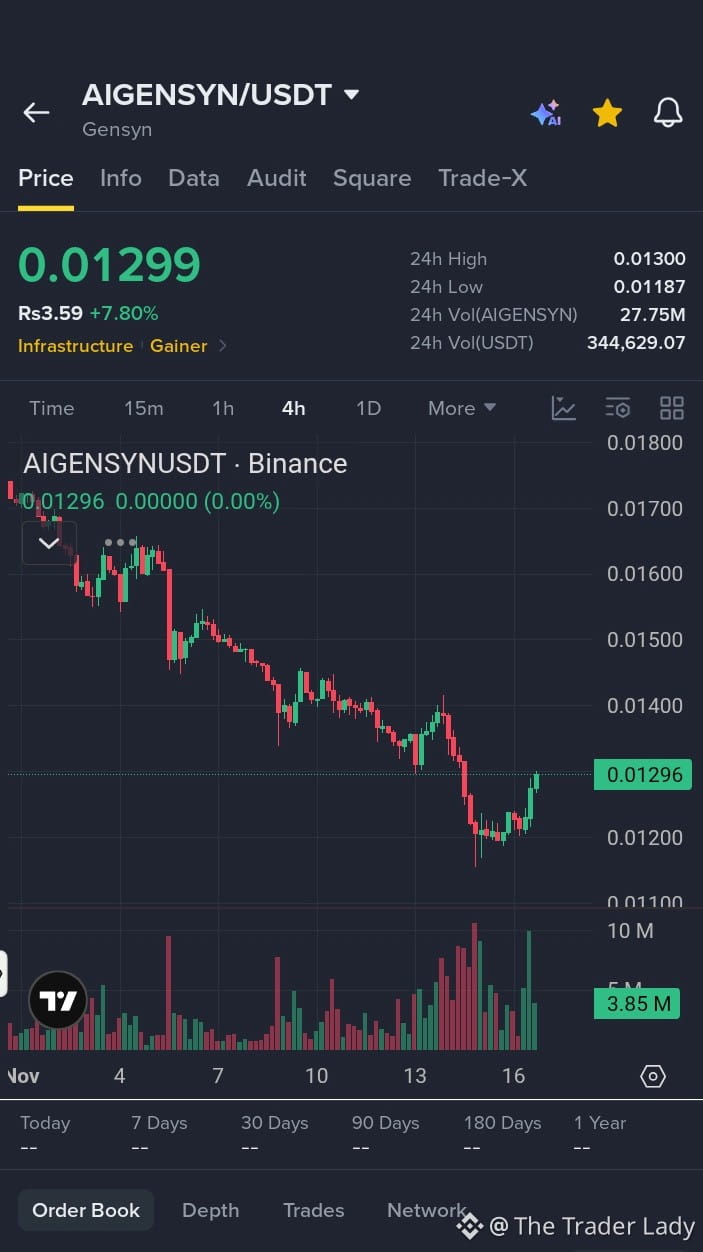
Weak bounce in a clear downtrend.
The 4H chart shows a prolonged, steady decline from the $0.0170 peak down to the $0.0120 support. It has printed a minor recovery candle, currently at $0.0129 (+7.8%), but the overall structure remains heavily bearish with low volume.
Trade Plan:
EP: Wait. Do not chase this weak bounce. Look for a confirmed 4H green candle close above $0.0140 to validate a reversal, or wait for a retest of the $0.0120 support.
SL: $0.0110 (Strict stop below the recent structural low).
Targets:
🎯 TP1: $0.0150
🎯 TP2: $0.0160
🎯 TP3: $0.0170
Note: ⚠️ Caution: This is a relief bounce in a heavy downtrend. It needs a strong surge in buying pressure to break through the overhead resistance. If it loses the $0.0125 support, expect a retest of the lows. Avoid heavy positions until a clear reversal is confirmed. DYOR.
#AIGENSYN #Gensyn #Crypto #Trading #Long
{future}(AIGENSYNUSDT)
$VINE
{alpha}(CT_5016AJcP7wuLwmRYLBNbi825wgguaPsWzPBEHcHndpRpump)
$BLESS
{future}(BLESSUSDT)
$AIGENSYN You can feel the shift in the air; positive momentum is firmly established and pushing us toward new horizons. Positioning yourself at this juncture means stepping into the future with confidence and capturing the maximum upside of what is to come. Those who recognize the power of this moment and act with conviction will reap the greatest rewards.
Weak bounce in a clear downtrend.
The 4H chart shows a prolonged, steady decline from the $0.0170 peak down to the $0.0120 support. It has printed a minor recovery candle, currently at $0.0129 (+7.8%), but the overall structure remains heavily bearish with low volume.
Trade Plan:
EP: Wait. Do not chase this weak bounce. Look for a confirmed 4H green candle close above $0.0140 to validate a reversal, or wait for a retest of the $0.0120 support.
SL: $0.0110 (Strict stop below the recent structural low).
Targets:
🎯 TP1: $0.0150
🎯 TP2: $0.0160
🎯 TP3: $0.0170
Note: ⚠️ Caution: This is a relief bounce in a heavy downtrend. It needs a strong surge in buying pressure to break through the overhead resistance. If it loses the $0.0125 support, expect a retest of the lows. Avoid heavy positions until a clear reversal is confirmed. DYOR.
#AIGENSYN #Gensyn #Crypto #Trading #Long
$VINE
$BLESS
Weak bounce in a clear downtrend.
The 4H chart shows a prolonged, steady decline from the $0.0170 peak down to the $0.0120 support. It has printed a minor recovery candle, currently at $0.0129 (+7.8%), but the overall structure remains heavily bearish with low volume.
Trade Plan:
EP: Wait. Do not chase this weak bounce. Look for a confirmed 4H green candle close above $0.0140 to validate a reversal, or wait for a retest of the $0.0120 support.
SL: $0.0110 (Strict stop below the recent structural low).
Targets:
🎯 TP1: $0.0150
🎯 TP2: $0.0160
🎯 TP3: $0.0170
Note: ⚠️ Caution: This is a relief bounce in a heavy downtrend. It needs a strong surge in buying pressure to break through the overhead resistance. If it loses the $0.0125 support, expect a retest of the lows. Avoid heavy positions until a clear reversal is confirmed. DYOR.
#AIGENSYN #Gensyn #Crypto #Trading #Long
$VINE
$BLESS
2
·
--
Рост
См. перевод
$SOXSB With rising demand and revitalized infrastructure, positive momentum is firmly established in this region. Positioning your investments at this juncture captures the maximum upside before property values reach their peak. Getting in while the growth curve is still steep ensures you benefit fully from the area's ongoing transformation.
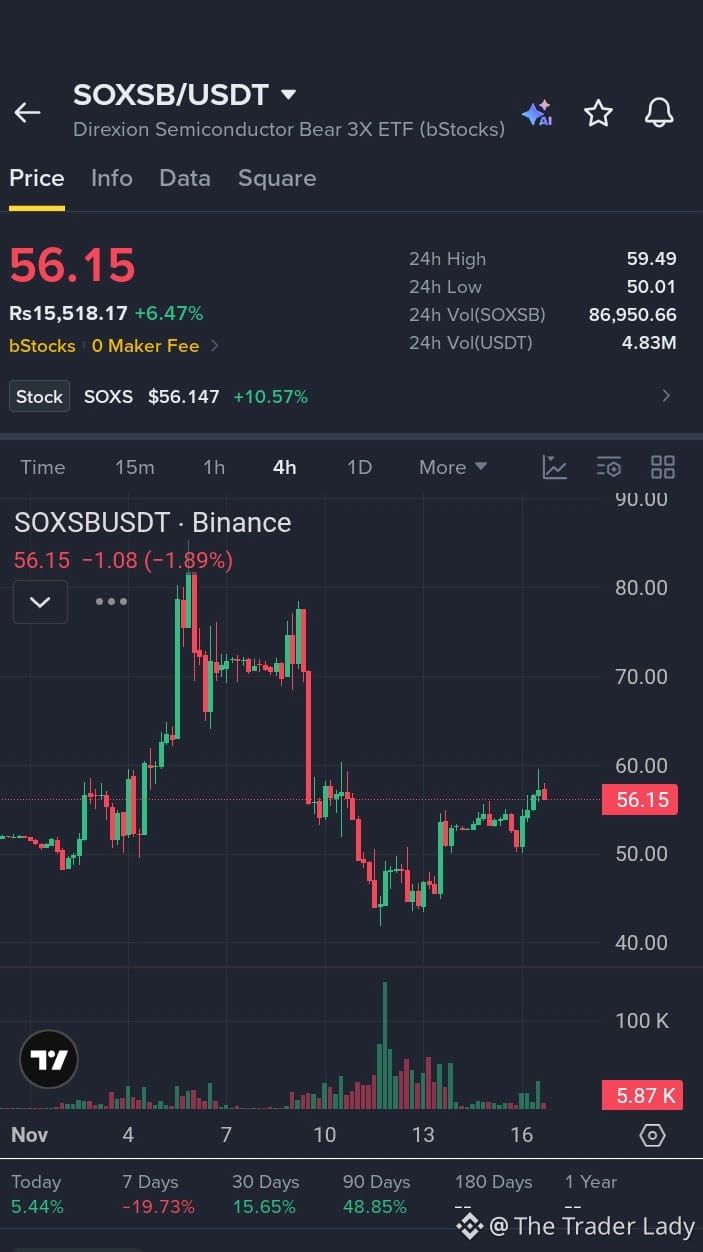
Choppy consolidation, testing resistance.
Following up on the previous setup, the price has pulled back slightly to $56.15 (+6.5%). The 4H chart shows it is struggling to hold momentum after the recent bounce from the $45 lows. The current candle is red, indicating selling pressure near the $60 resistance zone.
Trade Plan:
EP: Wait. Do not enter mid-chop. Look for a confirmed 4H green candle close above $58.00 to validate a breakout, or wait for a deeper pullback to hold support around the $52.00 zone.
SL: $48.00 (Strict stop below the recent structural higher-low).
Targets:
🎯 TP1: $60.00
🎯 TP2: $65.00
🎯 TP3: $70.00
Note: 💡 Context: This is a tokenized 3x leveraged inverse ETF. The structure is choppy and needs a strong push in volume to clear the $60 resistance. If it loses the $54.00 support, expect a retest of the $50.00 lows. Trail stops to protect gains. DYOR.
#SOXSB #Stocks #Trading #Long
{spot}(SOXSBUSDT)
$LAB
{alpha}(560x7ec43cf65f1663f820427c62a5780b8f2e25593a)
$ESPORTS
{alpha}(560xf39e4b21c84e737df08e2c3b32541d856f508e48)
$SOXSB With rising demand and revitalized infrastructure, positive momentum is firmly established in this region. Positioning your investments at this juncture captures the maximum upside before property values reach their peak. Getting in while the growth curve is still steep ensures you benefit fully from the area's ongoing transformation.
Choppy consolidation, testing resistance.
Following up on the previous setup, the price has pulled back slightly to $56.15 (+6.5%). The 4H chart shows it is struggling to hold momentum after the recent bounce from the $45 lows. The current candle is red, indicating selling pressure near the $60 resistance zone.
Trade Plan:
EP: Wait. Do not enter mid-chop. Look for a confirmed 4H green candle close above $58.00 to validate a breakout, or wait for a deeper pullback to hold support around the $52.00 zone.
SL: $48.00 (Strict stop below the recent structural higher-low).
Targets:
🎯 TP1: $60.00
🎯 TP2: $65.00
🎯 TP3: $70.00
Note: 💡 Context: This is a tokenized 3x leveraged inverse ETF. The structure is choppy and needs a strong push in volume to clear the $60 resistance. If it loses the $54.00 support, expect a retest of the $50.00 lows. Trail stops to protect gains. DYOR.
#SOXSB #Stocks #Trading #Long
$LAB
$ESPORTS
Choppy consolidation, testing resistance.
Following up on the previous setup, the price has pulled back slightly to $56.15 (+6.5%). The 4H chart shows it is struggling to hold momentum after the recent bounce from the $45 lows. The current candle is red, indicating selling pressure near the $60 resistance zone.
Trade Plan:
EP: Wait. Do not enter mid-chop. Look for a confirmed 4H green candle close above $58.00 to validate a breakout, or wait for a deeper pullback to hold support around the $52.00 zone.
SL: $48.00 (Strict stop below the recent structural higher-low).
Targets:
🎯 TP1: $60.00
🎯 TP2: $65.00
🎯 TP3: $70.00
Note: 💡 Context: This is a tokenized 3x leveraged inverse ETF. The structure is choppy and needs a strong push in volume to clear the $60 resistance. If it loses the $54.00 support, expect a retest of the $50.00 lows. Trail stops to protect gains. DYOR.
#SOXSB #Stocks #Trading #Long
$LAB
$ESPORTS
13
·
--
Рост
См. перевод
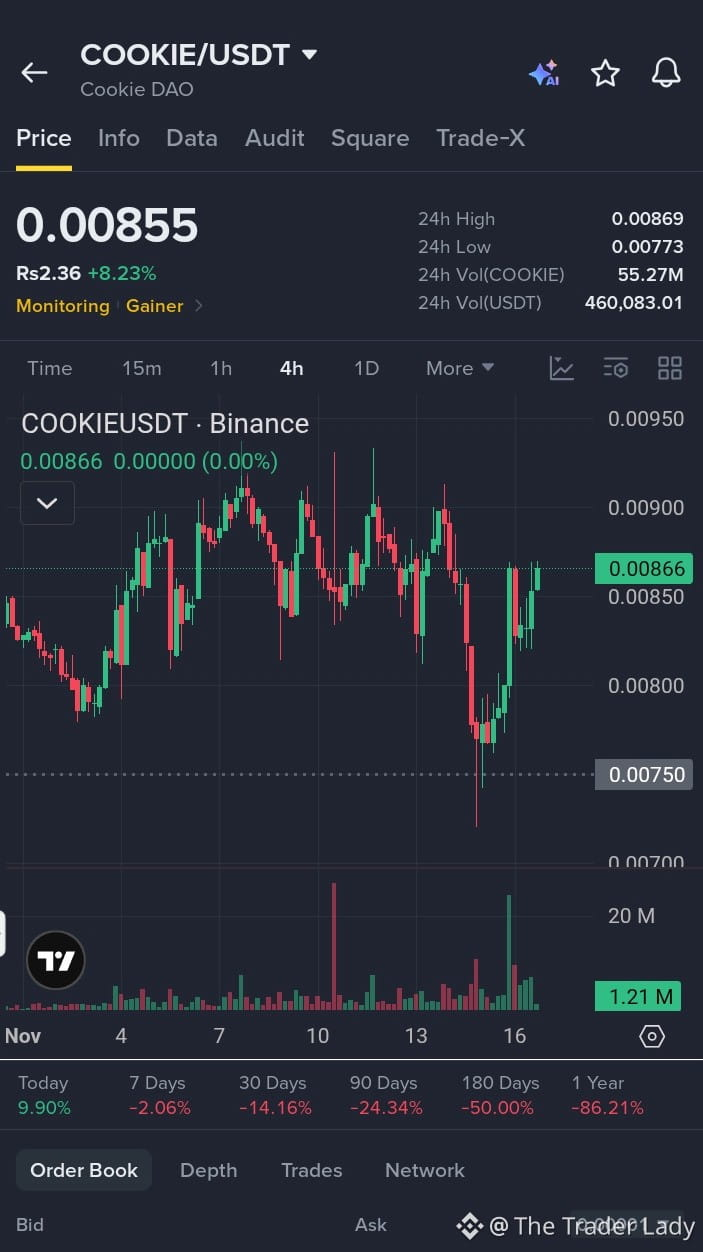
$COOKIE Look at what we have accomplished together—positive momentum is firmly established across every department. If we position ourselves effectively at this juncture, we will capture the maximum upside of our recent breakthroughs. Let’s keep our foot on the gas, stay focused on our goals, and turn this steady progress into an extraordinary finish.
Choppy recovery, testing immediate resistance.
Following up on the previous setup, the price has pushed slightly higher to $0.0085 (+9.9%). The 4H chart shows a steady bounce from the $0.0075 lows, but it is currently printing a red body with an upper wick, indicating resistance near the $0.0090 level.
Trade Plan:
EP: $0.0084 – $0.0086 (Current consolidation zone. Wait for a confirmed 4H green candle close above $0.0088 to validate a breakout).
**SL:** $0.0078 (Strict stop below the recent structural low).
Targets:
🎯 TP1: $0.0092
🎯 TP2: $0.0095
🎯 TP3: $0.0100
Note: ⚠️ Caution: The chart shows a relief bounce within a broader downtrend. It needs a strong surge in volume to push through the immediate resistance. If it loses the $0.0083 support, expect a retest of the $0.0075 lows. DYOR.
#COOKIE #CookieDAO #Crypto #Trading #Long
{future}(COOKIEUSDT)
$ZEC
{future}(ZECUSDT)
$BLESS
{future}(BLESSUSDT)
$COOKIE Look at what we have accomplished together—positive momentum is firmly established across every department. If we position ourselves effectively at this juncture, we will capture the maximum upside of our recent breakthroughs. Let’s keep our foot on the gas, stay focused on our goals, and turn this steady progress into an extraordinary finish.
Choppy recovery, testing immediate resistance.
Following up on the previous setup, the price has pushed slightly higher to $0.0085 (+9.9%). The 4H chart shows a steady bounce from the $0.0075 lows, but it is currently printing a red body with an upper wick, indicating resistance near the $0.0090 level.
Trade Plan:
EP: $0.0084 – $0.0086 (Current consolidation zone. Wait for a confirmed 4H green candle close above $0.0088 to validate a breakout).
**SL:** $0.0078 (Strict stop below the recent structural low).
Targets:
🎯 TP1: $0.0092
🎯 TP2: $0.0095
🎯 TP3: $0.0100
Note: ⚠️ Caution: The chart shows a relief bounce within a broader downtrend. It needs a strong surge in volume to push through the immediate resistance. If it loses the $0.0083 support, expect a retest of the $0.0075 lows. DYOR.
#COOKIE #CookieDAO #Crypto #Trading #Long
$ZEC
$BLESS
Choppy recovery, testing immediate resistance.
Following up on the previous setup, the price has pushed slightly higher to $0.0085 (+9.9%). The 4H chart shows a steady bounce from the $0.0075 lows, but it is currently printing a red body with an upper wick, indicating resistance near the $0.0090 level.
Trade Plan:
EP: $0.0084 – $0.0086 (Current consolidation zone. Wait for a confirmed 4H green candle close above $0.0088 to validate a breakout).
**SL:** $0.0078 (Strict stop below the recent structural low).
Targets:
🎯 TP1: $0.0092
🎯 TP2: $0.0095
🎯 TP3: $0.0100
Note: ⚠️ Caution: The chart shows a relief bounce within a broader downtrend. It needs a strong surge in volume to push through the immediate resistance. If it loses the $0.0083 support, expect a retest of the $0.0075 lows. DYOR.
#COOKIE #CookieDAO #Crypto #Trading #Long
$ZEC
$BLESS
12
·
--
Рост
См. перевод
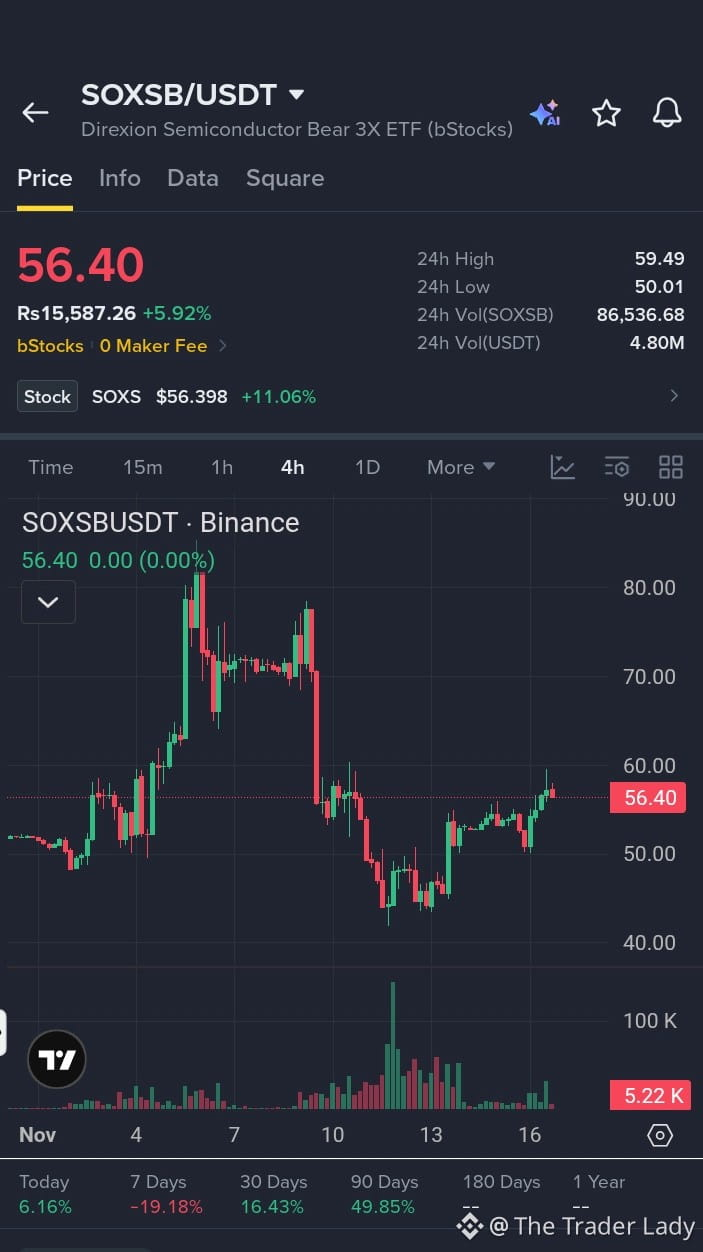
$SOXSB A sustained upward trend means that positive momentum is firmly established, shifting the focus from capital preservation to strategic growth. Positioning your assets at this juncture allows you to capture the maximum upside of the current cycle. By aligning with the prevailing strength early on, you set the stage for compounding gains over the long term
Choppy recovery after a heavy pullback.
Following up on the previous setup, the price is holding at $56.40 (+5.9%). The 4H chart shows a steady recovery from the $45.00 support, but it is currently facing resistance near the $60.00 psychological level.
Trade Plan:
EP: $54.00 – $56.50 (Current consolidation zone. Wait for a confirmed 4H green candle close above $58.00 to validate a breakout).
**SL:** $48.00 (Strict stop below the recent structural higher-low).
Targets:
🎯 TP1: $60.00
🎯 TP2: $65.00
🎯 TP3: $70.00
Note: 💡 Context: This is a tokenized 3x leveraged inverse ETF. The structure is recovering, but it needs a strong push in volume to clear the $60 resistance. If it rejects here, expect a retest of the $52 support. Trail stops to protect gains. DYOR.
#SOXSB #Stocks #Trading #Long
{spot}(SOXSBUSDT)
$BLESS
{alpha}(560x7c8217517ed4711fe2deccdfeffe8d906b9ae11f)
$VINE
{alpha}(CT_5016AJcP7wuLwmRYLBNbi825wgguaPsWzPBEHcHndpRpump)
$SOXSB A sustained upward trend means that positive momentum is firmly established, shifting the focus from capital preservation to strategic growth. Positioning your assets at this juncture allows you to capture the maximum upside of the current cycle. By aligning with the prevailing strength early on, you set the stage for compounding gains over the long term
Choppy recovery after a heavy pullback.
Following up on the previous setup, the price is holding at $56.40 (+5.9%). The 4H chart shows a steady recovery from the $45.00 support, but it is currently facing resistance near the $60.00 psychological level.
Trade Plan:
EP: $54.00 – $56.50 (Current consolidation zone. Wait for a confirmed 4H green candle close above $58.00 to validate a breakout).
**SL:** $48.00 (Strict stop below the recent structural higher-low).
Targets:
🎯 TP1: $60.00
🎯 TP2: $65.00
🎯 TP3: $70.00
Note: 💡 Context: This is a tokenized 3x leveraged inverse ETF. The structure is recovering, but it needs a strong push in volume to clear the $60 resistance. If it rejects here, expect a retest of the $52 support. Trail stops to protect gains. DYOR.
#SOXSB #Stocks #Trading #Long
$BLESS
$VINE
Choppy recovery after a heavy pullback.
Following up on the previous setup, the price is holding at $56.40 (+5.9%). The 4H chart shows a steady recovery from the $45.00 support, but it is currently facing resistance near the $60.00 psychological level.
Trade Plan:
EP: $54.00 – $56.50 (Current consolidation zone. Wait for a confirmed 4H green candle close above $58.00 to validate a breakout).
**SL:** $48.00 (Strict stop below the recent structural higher-low).
Targets:
🎯 TP1: $60.00
🎯 TP2: $65.00
🎯 TP3: $70.00
Note: 💡 Context: This is a tokenized 3x leveraged inverse ETF. The structure is recovering, but it needs a strong push in volume to clear the $60 resistance. If it rejects here, expect a retest of the $52 support. Trail stops to protect gains. DYOR.
#SOXSB #Stocks #Trading #Long
$BLESS
$VINE
1
·
--
Рост
См. перевод
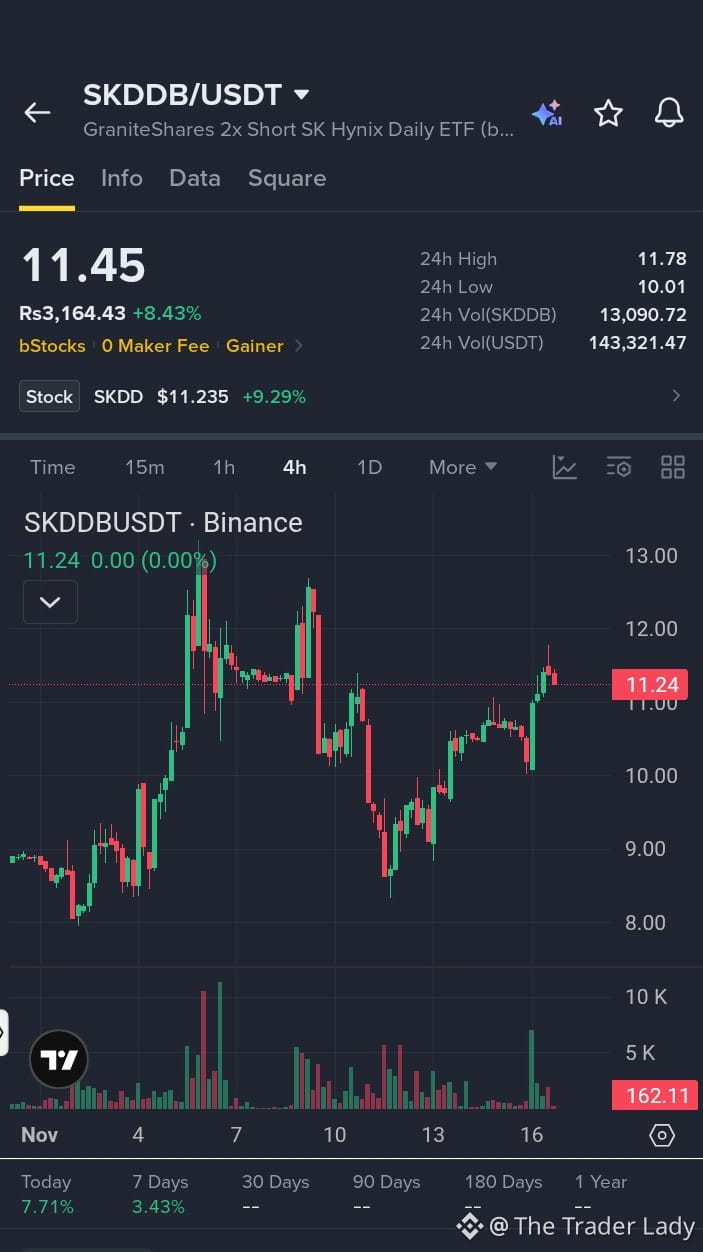
$SKDDB Traction is no longer just a projection; positive momentum is firmly established and driving real user adoption. For early supporters and team members, positioning at this juncture captures the maximum upside of our upcoming scaling phase. We have moved past the initial hurdles and are entering a high-growth period where today’s commitment translates into tomorrow's biggest wins.
Choppy consolidation after a volatile swing.
Following up on the previous setup, the price is hovering at $11.45 (+8.4%). The 4H chart shows it is recovering from the recent dip to the $8.50 support, but the current candle is printing a red body with an upper wick, indicating resistance near the $12.00 level.
Trade Plan:
EP: $11.00 – $11.50 (Current consolidation zone. Wait for a confirmed 4H green candle close above $11.80 to validate a breakout).
**SL:** $10.00 (Strict stop below the recent structural higher-low).
Targets:
🎯 TP1: $12.00
🎯 TP2: $12.80
🎯 TP3: $13.50
Note: 💡 Context: This is a tokenized 2x leveraged inverse ETF. The trend is choppy. It needs a strong push in volume to clear the overhead resistance. If it loses the $10.50 support, expect a retest of the $9.00 lows. Trail stops to protect gains. DYOR.
#SKDDB #Stocks #Trading #Long
{spot}(SKDDBUSDT)
$EVAA
{alpha}(560xaa036928c9c0df07d525b55ea8ee690bb5a628c1)
$SPACE
{alpha}(560x87acfa3fd7a6e0d48677d070644d76905c2bdc00)
$SKDDB Traction is no longer just a projection; positive momentum is firmly established and driving real user adoption. For early supporters and team members, positioning at this juncture captures the maximum upside of our upcoming scaling phase. We have moved past the initial hurdles and are entering a high-growth period where today’s commitment translates into tomorrow's biggest wins.
Choppy consolidation after a volatile swing.
Following up on the previous setup, the price is hovering at $11.45 (+8.4%). The 4H chart shows it is recovering from the recent dip to the $8.50 support, but the current candle is printing a red body with an upper wick, indicating resistance near the $12.00 level.
Trade Plan:
EP: $11.00 – $11.50 (Current consolidation zone. Wait for a confirmed 4H green candle close above $11.80 to validate a breakout).
**SL:** $10.00 (Strict stop below the recent structural higher-low).
Targets:
🎯 TP1: $12.00
🎯 TP2: $12.80
🎯 TP3: $13.50
Note: 💡 Context: This is a tokenized 2x leveraged inverse ETF. The trend is choppy. It needs a strong push in volume to clear the overhead resistance. If it loses the $10.50 support, expect a retest of the $9.00 lows. Trail stops to protect gains. DYOR.
#SKDDB #Stocks #Trading #Long
$EVAA
$SPACE
Choppy consolidation after a volatile swing.
Following up on the previous setup, the price is hovering at $11.45 (+8.4%). The 4H chart shows it is recovering from the recent dip to the $8.50 support, but the current candle is printing a red body with an upper wick, indicating resistance near the $12.00 level.
Trade Plan:
EP: $11.00 – $11.50 (Current consolidation zone. Wait for a confirmed 4H green candle close above $11.80 to validate a breakout).
**SL:** $10.00 (Strict stop below the recent structural higher-low).
Targets:
🎯 TP1: $12.00
🎯 TP2: $12.80
🎯 TP3: $13.50
Note: 💡 Context: This is a tokenized 2x leveraged inverse ETF. The trend is choppy. It needs a strong push in volume to clear the overhead resistance. If it loses the $10.50 support, expect a retest of the $9.00 lows. Trail stops to protect gains. DYOR.
#SKDDB #Stocks #Trading #Long
$EVAA
$SPACE
4
·
--
Рост
См. перевод
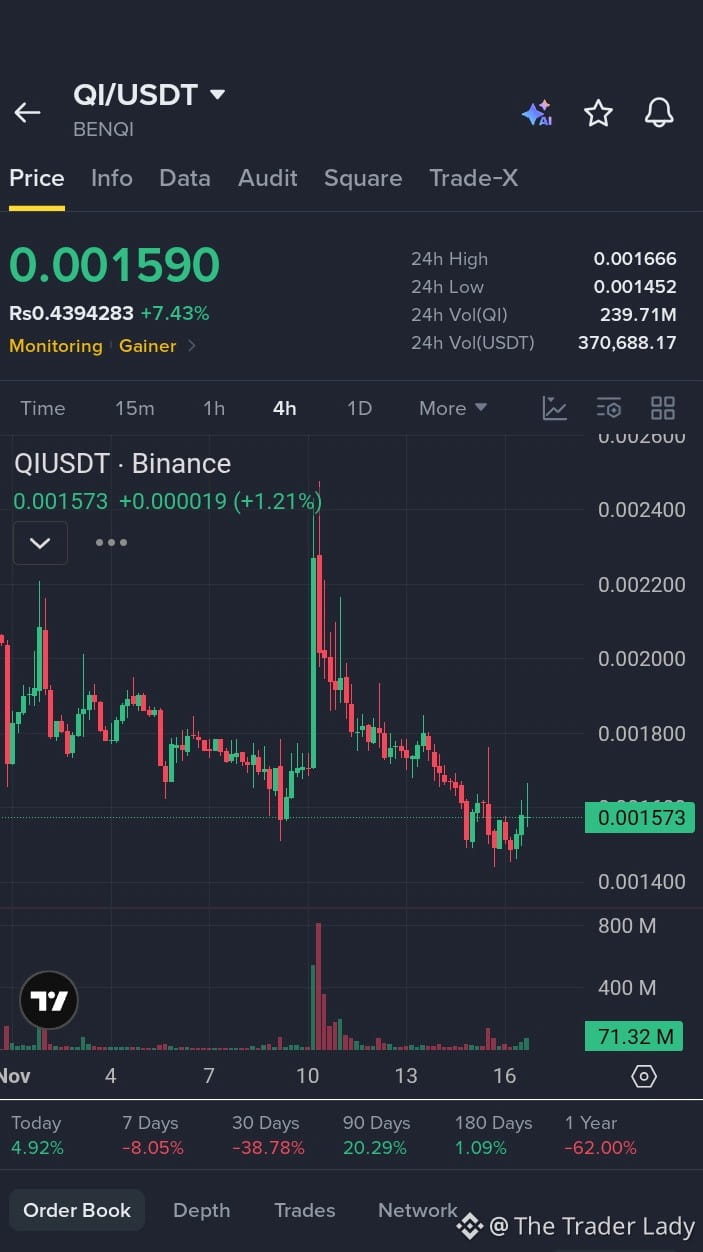
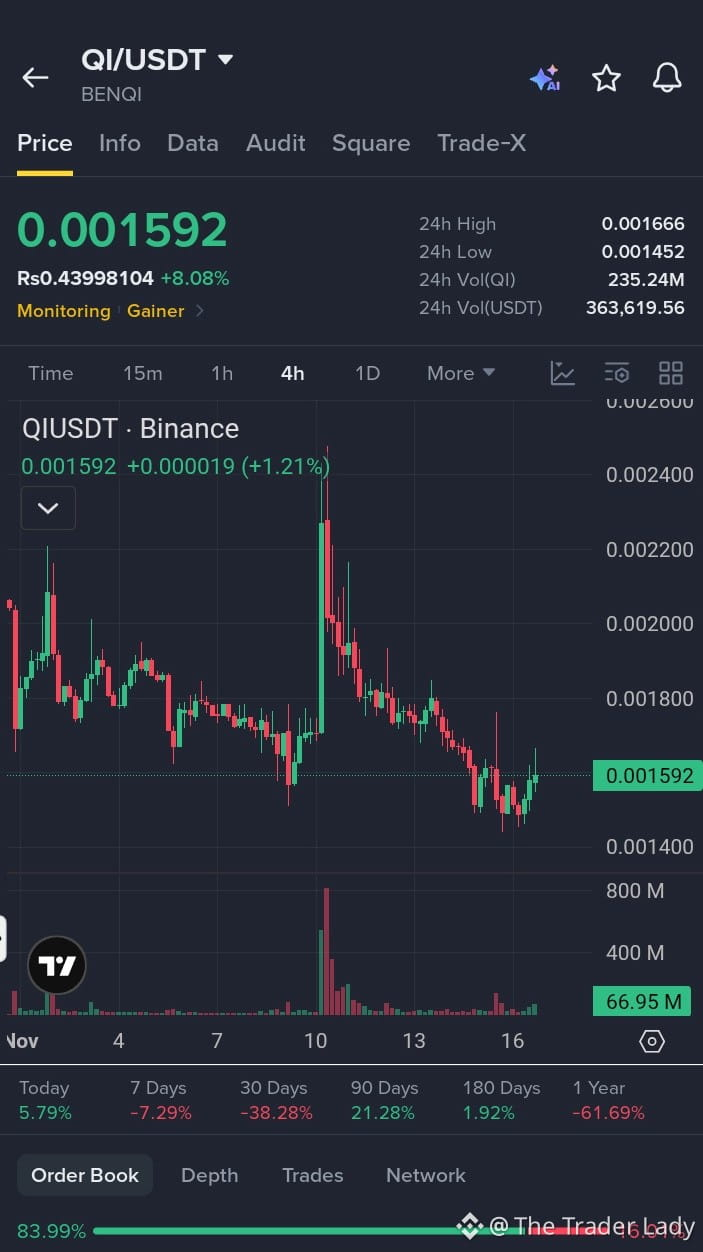
$QI Recent performance data confirms that positive momentum is firmly established, reducing the uncertainty that often clouds early decisions. Consequently, positioning at this juncture represents a calculated move that captures maximum upside while the trend still has plenty of room to run. Entering now strikes the ideal balance between confirmed strength and high growth potential.
Weak bounce, fading momentum.
Following up on the previous setup, the price is holding around $0.0015 (+7.4%). The 4H chart shows the relief bounce has stalled, with the current candle printing a red body and a long upper wick. Volume remains low.
Trade Plan:
EP: Wait. Do not chase this weak bounce. Look for a confirmed 4H green candle close above $0.0017 to validate a reversal, or wait for a retest of the $0.0014 support.
SL: $0.0013 (Strict stop below the recent structural low).
Targets:
🎯 TP1: $0.0018
🎯 TP2: $0.0020
🎯 TP3: $0.0022
Note: ⚠️ Caution: The chart shows a weak relief bounce with thin volume. It needs a strong surge in buying pressure to clear the overhead resistance. If it loses the $0.0015 support, expect a retest of the $0.0014 lows. DYOR.
#QI #BENQI #Crypto #Trading #Long
{spot}(QIUSDT)
$BLESS
{alpha}(560x7c8217517ed4711fe2deccdfeffe8d906b9ae11f)
$VINE
{alpha}(CT_5016AJcP7wuLwmRYLBNbi825wgguaPsWzPBEHcHndpRpump)
$QI Recent performance data confirms that positive momentum is firmly established, reducing the uncertainty that often clouds early decisions. Consequently, positioning at this juncture represents a calculated move that captures maximum upside while the trend still has plenty of room to run. Entering now strikes the ideal balance between confirmed strength and high growth potential.
Weak bounce, fading momentum.
Following up on the previous setup, the price is holding around $0.0015 (+7.4%). The 4H chart shows the relief bounce has stalled, with the current candle printing a red body and a long upper wick. Volume remains low.
Trade Plan:
EP: Wait. Do not chase this weak bounce. Look for a confirmed 4H green candle close above $0.0017 to validate a reversal, or wait for a retest of the $0.0014 support.
SL: $0.0013 (Strict stop below the recent structural low).
Targets:
🎯 TP1: $0.0018
🎯 TP2: $0.0020
🎯 TP3: $0.0022
Note: ⚠️ Caution: The chart shows a weak relief bounce with thin volume. It needs a strong surge in buying pressure to clear the overhead resistance. If it loses the $0.0015 support, expect a retest of the $0.0014 lows. DYOR.
#QI #BENQI #Crypto #Trading #Long
$BLESS
$VINE
Weak bounce, fading momentum.
Following up on the previous setup, the price is holding around $0.0015 (+7.4%). The 4H chart shows the relief bounce has stalled, with the current candle printing a red body and a long upper wick. Volume remains low.
Trade Plan:
EP: Wait. Do not chase this weak bounce. Look for a confirmed 4H green candle close above $0.0017 to validate a reversal, or wait for a retest of the $0.0014 support.
SL: $0.0013 (Strict stop below the recent structural low).
Targets:
🎯 TP1: $0.0018
🎯 TP2: $0.0020
🎯 TP3: $0.0022
Note: ⚠️ Caution: The chart shows a weak relief bounce with thin volume. It needs a strong surge in buying pressure to clear the overhead resistance. If it loses the $0.0015 support, expect a retest of the $0.0014 lows. DYOR.
#QI #BENQI #Crypto #Trading #Long
$BLESS
$VINE
3
·
--
Рост
См. перевод
$QI Make no mistake—positive momentum is firmly established, and the window of opportunity is wide open. Positioning yourself at this exact juncture is the smartest move you can make to capture maximum upside. As more people recognize this upward shift, the entry point will become less favorable, making immediate action essential for securing top-tier results
Weak bounce in a broader downtrend.
Following up on the previous setup, the price is holding around $0.0015 (+8%). The 4H chart shows a minor recovery from the recent lows, but the overall structure remains bearish after the massive drop from the $0.0024 peak. Volume is fading.
Trade Plan:
EP: Wait. Do not chase this weak bounce. Look for a confirmed 4H green candle close above $0.0017 to validate a reversal, or wait for a retest of the $0.0014 support.
SL: $0.0013 (Strict stop below the recent structural low).
Targets:
🎯 TP1: $0.0018
🎯 TP2: $0.0020
🎯 TP3: $0.0022
Note: ⚠️ Caution: The chart shows a relief bounce with thin volume and low momentum. It needs a strong surge in buying pressure to clear the overhead resistance. If it loses the $0.0015 support, expect a retest of the $0.0014 lows. DYOR.
#QI #BENQI #Crypto #Trading #Long
{spot}(QIUSDT)
$VINE
{alpha}(CT_5016AJcP7wuLwmRYLBNbi825wgguaPsWzPBEHcHndpRpump)
$BLESS
{future}(BLESSUSDT)
$QI Make no mistake—positive momentum is firmly established, and the window of opportunity is wide open. Positioning yourself at this exact juncture is the smartest move you can make to capture maximum upside. As more people recognize this upward shift, the entry point will become less favorable, making immediate action essential for securing top-tier results
Weak bounce in a broader downtrend.
Following up on the previous setup, the price is holding around $0.0015 (+8%). The 4H chart shows a minor recovery from the recent lows, but the overall structure remains bearish after the massive drop from the $0.0024 peak. Volume is fading.
Trade Plan:
EP: Wait. Do not chase this weak bounce. Look for a confirmed 4H green candle close above $0.0017 to validate a reversal, or wait for a retest of the $0.0014 support.
SL: $0.0013 (Strict stop below the recent structural low).
Targets:
🎯 TP1: $0.0018
🎯 TP2: $0.0020
🎯 TP3: $0.0022
Note: ⚠️ Caution: The chart shows a relief bounce with thin volume and low momentum. It needs a strong surge in buying pressure to clear the overhead resistance. If it loses the $0.0015 support, expect a retest of the $0.0014 lows. DYOR.
#QI #BENQI #Crypto #Trading #Long
$VINE
$BLESS
Weak bounce in a broader downtrend.
Following up on the previous setup, the price is holding around $0.0015 (+8%). The 4H chart shows a minor recovery from the recent lows, but the overall structure remains bearish after the massive drop from the $0.0024 peak. Volume is fading.
Trade Plan:
EP: Wait. Do not chase this weak bounce. Look for a confirmed 4H green candle close above $0.0017 to validate a reversal, or wait for a retest of the $0.0014 support.
SL: $0.0013 (Strict stop below the recent structural low).
Targets:
🎯 TP1: $0.0018
🎯 TP2: $0.0020
🎯 TP3: $0.0022
Note: ⚠️ Caution: The chart shows a relief bounce with thin volume and low momentum. It needs a strong surge in buying pressure to clear the overhead resistance. If it loses the $0.0015 support, expect a retest of the $0.0014 lows. DYOR.
#QI #BENQI #Crypto #Trading #Long
$VINE
$BLESS
10
·
--
Рост
См. перевод
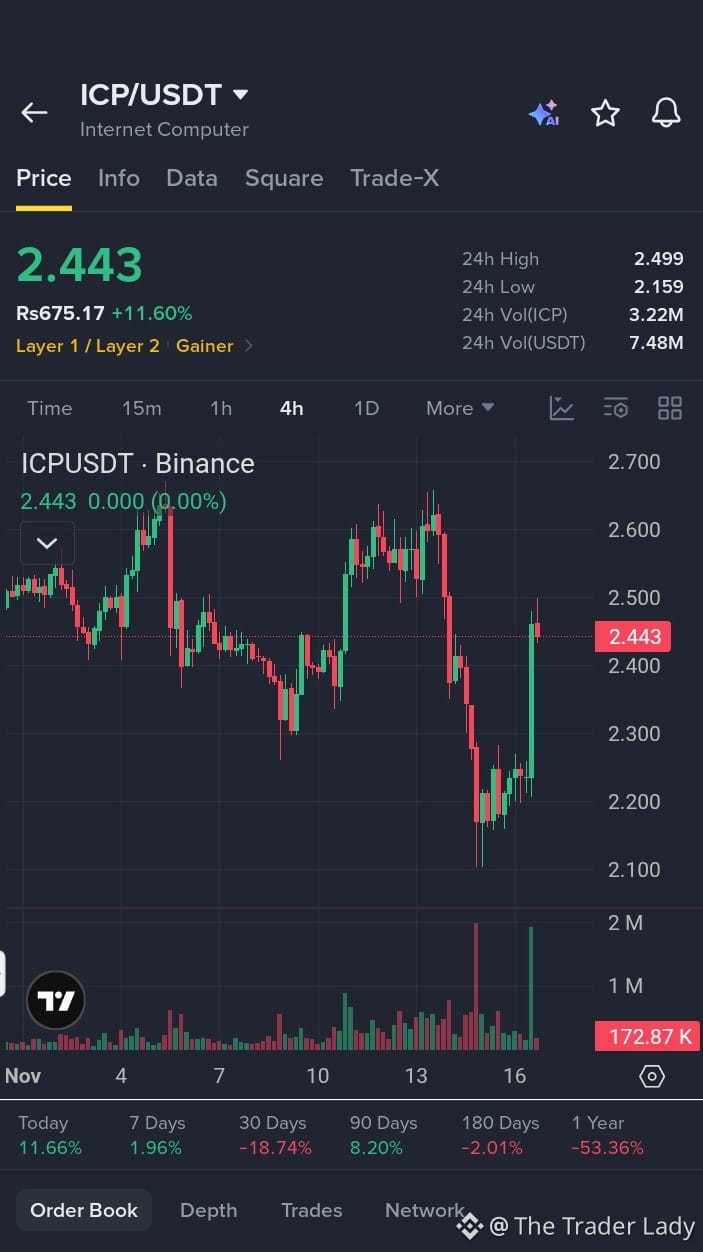
$ICP Customer interest and positive momentum are firmly established, creating an environment ripe for rapid expansion. Positioning our offerings aggressively at this juncture enables us to capture the maximum upside in market share and revenue. The market is ready to buy, and aligning our efforts right now guarantees we get the greatest possible return on our outreach.
Strong recovery, testing overhead resistance.
Following up on the previous setup, the price is holding at $2.44 (+11.6%) after bouncing from the $2.15 support. The 4H chart shows a solid green recovery candle, but it is currently facing selling pressure near the $2.50 level, leaving an upper wick.
Trade Plan:
EP: $2.40 – $2.46 (Current consolidation zone. Wait for a confirmed 4H green candle close above $2.50 to validate a breakout).
**SL:** $2.20 (Strict stop below the recent structural higher-low).
Targets:
🎯 TP1: $2.60
🎯 TP2: $2.70 (Previous major high)
🎯 TP3: $2.85
Note: The bounce is aggressive, but it needs a surge in volume to push through the immediate resistance. If it rejects here, expect a retest of the $2.35 support. Trail stops to protect gains. DYOR.
#ICP #InternetComputer #Crypto #Trading #Long
{future}(ICPUSDT)
$EVAA
{alpha}(560xaa036928c9c0df07d525b55ea8ee690bb5a628c1)
$SPACE
{future}(SPACEUSDT)
$ICP Customer interest and positive momentum are firmly established, creating an environment ripe for rapid expansion. Positioning our offerings aggressively at this juncture enables us to capture the maximum upside in market share and revenue. The market is ready to buy, and aligning our efforts right now guarantees we get the greatest possible return on our outreach.
Strong recovery, testing overhead resistance.
Following up on the previous setup, the price is holding at $2.44 (+11.6%) after bouncing from the $2.15 support. The 4H chart shows a solid green recovery candle, but it is currently facing selling pressure near the $2.50 level, leaving an upper wick.
Trade Plan:
EP: $2.40 – $2.46 (Current consolidation zone. Wait for a confirmed 4H green candle close above $2.50 to validate a breakout).
**SL:** $2.20 (Strict stop below the recent structural higher-low).
Targets:
🎯 TP1: $2.60
🎯 TP2: $2.70 (Previous major high)
🎯 TP3: $2.85
Note: The bounce is aggressive, but it needs a surge in volume to push through the immediate resistance. If it rejects here, expect a retest of the $2.35 support. Trail stops to protect gains. DYOR.
#ICP #InternetComputer #Crypto #Trading #Long
$EVAA
$SPACE
Strong recovery, testing overhead resistance.
Following up on the previous setup, the price is holding at $2.44 (+11.6%) after bouncing from the $2.15 support. The 4H chart shows a solid green recovery candle, but it is currently facing selling pressure near the $2.50 level, leaving an upper wick.
Trade Plan:
EP: $2.40 – $2.46 (Current consolidation zone. Wait for a confirmed 4H green candle close above $2.50 to validate a breakout).
**SL:** $2.20 (Strict stop below the recent structural higher-low).
Targets:
🎯 TP1: $2.60
🎯 TP2: $2.70 (Previous major high)
🎯 TP3: $2.85
Note: The bounce is aggressive, but it needs a surge in volume to push through the immediate resistance. If it rejects here, expect a retest of the $2.35 support. Trail stops to protect gains. DYOR.
#ICP #InternetComputer #Crypto #Trading #Long
$EVAA
$SPACE
3
·
--
Рост
См. перевод
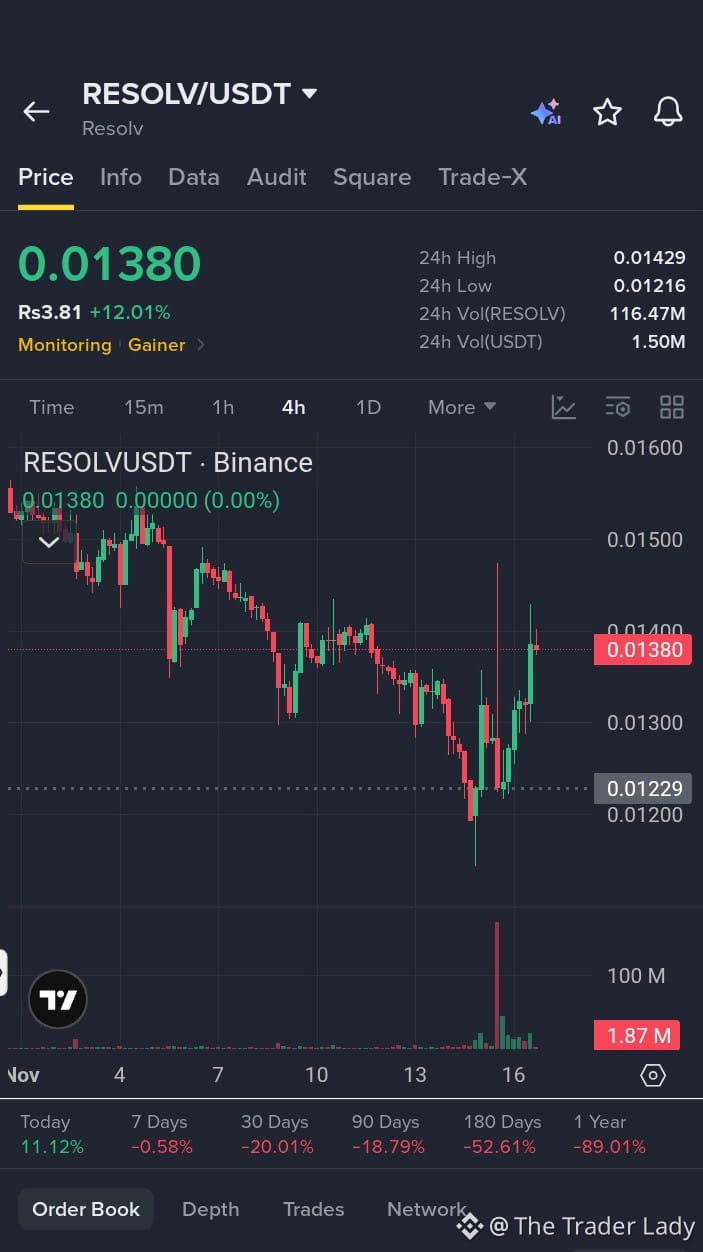
$RESOLV When positive momentum is firmly established in your life or career, hesitation is your biggest enemy. Positioning yourself boldly at this juncture allows you to ride that wave of energy and capture the maximum upside of your hard work. Everything is aligning in your favor, so lean into the progress you have made and seize the full potential of this moment
Choppy consolidation, fading momentum.
Following up on the previous setup, the price is holding around $0.0138 (+12%). The 4H chart shows the recent bounce has stalled, with the current candle printing a red body and a long upper wick. Volume remains extremely low.
Trade Plan:
EP: Wait. Do not chase this weak bounce. Look for a confirmed 4H green candle close above $0.0145 to validate a breakout, or wait for a pullback to hold support around the $0.0128-$0.0130 zone.
**SL:** $0.0115 (Strict stop below the recent structural low).
Targets:
🎯 TP1: $0.0150
🎯 TP2: $0.0160
🎯 TP3: $0.0175
Note: ⚠️ Caution: The chart shows a relief bounce with heavy rejection wicks and thin volume. It needs a strong surge in buying pressure to clear the overhead resistance. If it loses the $0.0130 support, expect a retest of the $0.0120 lows. DYOR.
#RESOLV #Resolv #Crypto #Trading #Long
{future}(RESOLVUSDT)
$VINE
{alpha}(CT_5016AJcP7wuLwmRYLBNbi825wgguaPsWzPBEHcHndpRpump)
$BLESS
{alpha}(560x7c8217517ed4711fe2deccdfeffe8d906b9ae11f)
$RESOLV When positive momentum is firmly established in your life or career, hesitation is your biggest enemy. Positioning yourself boldly at this juncture allows you to ride that wave of energy and capture the maximum upside of your hard work. Everything is aligning in your favor, so lean into the progress you have made and seize the full potential of this moment
Choppy consolidation, fading momentum.
Following up on the previous setup, the price is holding around $0.0138 (+12%). The 4H chart shows the recent bounce has stalled, with the current candle printing a red body and a long upper wick. Volume remains extremely low.
Trade Plan:
EP: Wait. Do not chase this weak bounce. Look for a confirmed 4H green candle close above $0.0145 to validate a breakout, or wait for a pullback to hold support around the $0.0128-$0.0130 zone.
**SL:** $0.0115 (Strict stop below the recent structural low).
Targets:
🎯 TP1: $0.0150
🎯 TP2: $0.0160
🎯 TP3: $0.0175
Note: ⚠️ Caution: The chart shows a relief bounce with heavy rejection wicks and thin volume. It needs a strong surge in buying pressure to clear the overhead resistance. If it loses the $0.0130 support, expect a retest of the $0.0120 lows. DYOR.
#RESOLV #Resolv #Crypto #Trading #Long
$VINE
$BLESS
Choppy consolidation, fading momentum.
Following up on the previous setup, the price is holding around $0.0138 (+12%). The 4H chart shows the recent bounce has stalled, with the current candle printing a red body and a long upper wick. Volume remains extremely low.
Trade Plan:
EP: Wait. Do not chase this weak bounce. Look for a confirmed 4H green candle close above $0.0145 to validate a breakout, or wait for a pullback to hold support around the $0.0128-$0.0130 zone.
**SL:** $0.0115 (Strict stop below the recent structural low).
Targets:
🎯 TP1: $0.0150
🎯 TP2: $0.0160
🎯 TP3: $0.0175
Note: ⚠️ Caution: The chart shows a relief bounce with heavy rejection wicks and thin volume. It needs a strong surge in buying pressure to clear the overhead resistance. If it loses the $0.0130 support, expect a retest of the $0.0120 lows. DYOR.
#RESOLV #Resolv #Crypto #Trading #Long
$VINE
$BLESS
1
·
--
Рост
См. перевод
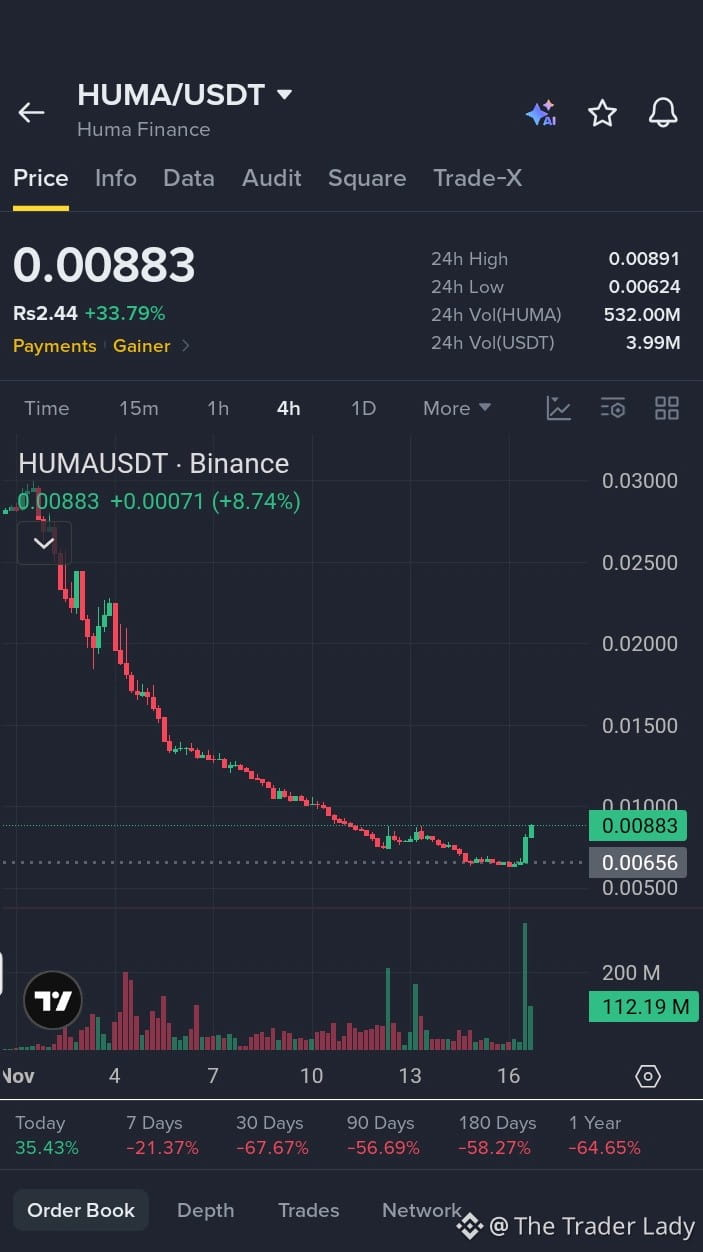
$HUMA All indicators show that positive momentum is solidly underway, giving our organization a rare strategic advantage. Stepping in and committing resources at this exact juncture ensures we capture the maximum upside before competitors can react. The groundwork has been laid, the trend is undeniable, and taking decisive action today will yield the strongest possible returns down the line.
Strong bounce approaching local resistance.
Following up on the previous setup, the price has pushed higher, currently at $0.0088 (+33.7%), nearing the 24h high of $0.0089. The 4H chart shows a solid recovery from the $0.0062 lows, but the current candle is printing a small upper wick, indicating resistance at this level.
Trade Plan:
EP: $0.0085 – $0.0089 (Current zone. Wait for a confirmed 4H green candle close above $0.0090 to validate a breakout).
**SL:** $0.0075 (Strict stop below the recent structural higher-low).
Targets:
🎯 TP1: $0.0095
🎯 TP2: $0.0105
🎯 TP3: $0.0120
Note: The bounce is aggressive, but the overall chart remains in a heavy downtrend. It needs a strong surge in volume to clear the $0.0090 resistance. If it loses the $0.0080 support, expect a retest of the $0.0070 lows. Trail stops to protect gains. DYOR.
#HUMA #HumaFinance #Crypto #Trading #Long
{future}(HUMAUSDT)
$BLESS
{alpha}(560x7c8217517ed4711fe2deccdfeffe8d906b9ae11f)
$VINE
{alpha}(CT_5016AJcP7wuLwmRYLBNbi825wgguaPsWzPBEHcHndpRpump)
$HUMA All indicators show that positive momentum is solidly underway, giving our organization a rare strategic advantage. Stepping in and committing resources at this exact juncture ensures we capture the maximum upside before competitors can react. The groundwork has been laid, the trend is undeniable, and taking decisive action today will yield the strongest possible returns down the line.
Strong bounce approaching local resistance.
Following up on the previous setup, the price has pushed higher, currently at $0.0088 (+33.7%), nearing the 24h high of $0.0089. The 4H chart shows a solid recovery from the $0.0062 lows, but the current candle is printing a small upper wick, indicating resistance at this level.
Trade Plan:
EP: $0.0085 – $0.0089 (Current zone. Wait for a confirmed 4H green candle close above $0.0090 to validate a breakout).
**SL:** $0.0075 (Strict stop below the recent structural higher-low).
Targets:
🎯 TP1: $0.0095
🎯 TP2: $0.0105
🎯 TP3: $0.0120
Note: The bounce is aggressive, but the overall chart remains in a heavy downtrend. It needs a strong surge in volume to clear the $0.0090 resistance. If it loses the $0.0080 support, expect a retest of the $0.0070 lows. Trail stops to protect gains. DYOR.
#HUMA #HumaFinance #Crypto #Trading #Long
$BLESS
$VINE
Strong bounce approaching local resistance.
Following up on the previous setup, the price has pushed higher, currently at $0.0088 (+33.7%), nearing the 24h high of $0.0089. The 4H chart shows a solid recovery from the $0.0062 lows, but the current candle is printing a small upper wick, indicating resistance at this level.
Trade Plan:
EP: $0.0085 – $0.0089 (Current zone. Wait for a confirmed 4H green candle close above $0.0090 to validate a breakout).
**SL:** $0.0075 (Strict stop below the recent structural higher-low).
Targets:
🎯 TP1: $0.0095
🎯 TP2: $0.0105
🎯 TP3: $0.0120
Note: The bounce is aggressive, but the overall chart remains in a heavy downtrend. It needs a strong surge in volume to clear the $0.0090 resistance. If it loses the $0.0080 support, expect a retest of the $0.0070 lows. Trail stops to protect gains. DYOR.
#HUMA #HumaFinance #Crypto #Trading #Long
$BLESS
$VINE
Войдите, чтобы посмотреть больше материала
Присоединяйтесь к пользователям криптовалют по всему миру на Binance Square
⚡️ Получайте новейшую и полезную информацию о криптоактивах.
💬 Нам доверяет крупнейшая в мире криптобиржа.
👍 Получите достоверные аналитические данные от верифицированных создателей контента.
Эл. почта/номер телефона
В тренде
fomcотслеживание
Просмотров: 121,858
594 обсуждают
Сейчас всё внимание приковано к решениям ФРС 🇺🇸
Рынок внимательно следит за сигналами от FOMC, ведь даже одно изменение в риторике представителей ФРС может повлиять на настроение инвесторов.
Особенно интересно наблюдать за реакцией BTC и ETH. Иногда рынок начинает двигаться ещё до официальных заявлений, а после публикации протокола волатильность может заметно вырасти.
$BTC
$ETH
Я бы сейчас не торопился с выводами. Лучше следить за новостями, объёмами и реакцией цены, чем пытаться угадать направление заранее.
А вы как думаете, чего сейчас больше ждёт рынок — снижения ставки или сохранения текущей политики?
#fomcотслеживание #ПротоколFOMC
Saymontop20
·Лайков: 0
·Просмотров: 79
ПротоколFOMC
Просмотров: 146,059
336 обсуждают
A Packed Week of Earnings and Data Tests Markets
Просмотров: 62,252
395 обсуждают