
Muhamamd Adeel
608 Публикации

Muhamamd Adeel
Отправить жалобу
Заблокировать пользователя
Daily provide Latest News.
10 подписок(и/а)
52 подписчиков(а)
59 понравилось
Посты
Все
Цитирования
Статья
См. перевод
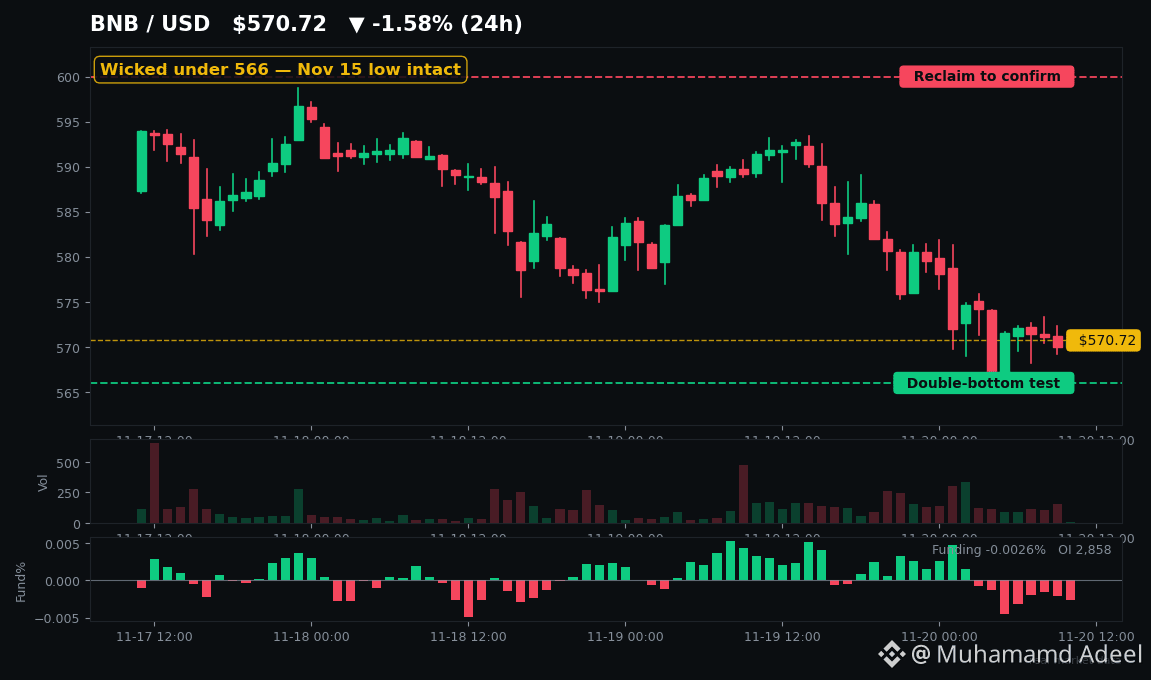
BNB Knocks on $566 Again With Fear at 12 — Hold, or $550 Next?BNB just wicked to $565.87.
Five days ago, $BNB bottomed at $565.41. Forty-six cents apart. Same floor. Same test. So here's the only question today: is this a double bottom forming right now — or the last bounce before it gives way?
BNB trades near $571, down about 3.3% in 24 hours and 9.6% on the week. It's 58% below its $1,370 all-time high, with daily RSI near 24 — deep oversold. And it's not a BNB-only problem. $BTC printed $61,213 today, its lowest since July, and the Fear & Greed Index sits at 12 — the eighth straight day in Extreme Fear. BNB is holding up slightly better than Bitcoin and Ether over 30 days. Barely.
Here's where it gets decided. The $566 zone is the pivot every desk is watching. Today BNB dipped thirteen cents under it, but the Nov 15 low at $565.41 did not break. That matters. Above, $580–582 is the first reclaim, then $593 (yesterday's high), then the real confirmation: a close over $600–603. Below, losing $565 on a close opens $555, then the $550 floor, then $540 — with the June–July lows near $537–546 under that. Tap $BNB and look at the daily chart yourself: the last bounce off this floor never closed above $600. It faded straight back here. History says these retests usually bounce, then base for weeks — they don't V-reverse on command. Until $600 closes, this is a test, not a bottom.
Now the weird part. While price tests its lows, Binance keeps expanding. On Nov 19 the CFTC deemed Binance.US's derivatives applications "materially complete" — that's the start of substantive review, explicitly not an approval, and US users still can't trade derivatives there. Three new stock perpetuals (Johnson & Johnson, a 2x AMD ETF, NIO) were scheduled to open this morning at up to 20x. And the REX-Osprey BNB staking ETF's registration goes effective today — but with no trading date announced, it brings zero buying power today. Meanwhile the chain did 17.6 million transactions and about $771 million in DEX volume in 24 hours, even as TVL slid to $4.42 billion, down roughly 10% in a week. Usage is holding. Capital is leaking. Price only cares about one of those.
So why could $566 still fail? Because BNB doesn't get to decide alone. Bitcoin ETFs just saw a record $541 million single-day outflow from BlackRock's fund, markets price a December Fed hike at about 95%, and if Bitcoin loses $60,000, this floor likely goes with it. Positioning isn't helping: roughly 72% of Binance accounts are long, while top traders by size are split 50/50 — crowded dip-buyers, no big-money confirmation. And the hack overhang isn't finished: about $2.85 billion frozen still hasn't been returned, with a court hearing on Dec 1.
My take? Respect the floor, don't worship it. Bulls need a close over $600; bears just need Bitcoin to break. Watch BNB against $566 — and Bitcoin against $60,000. One of them blinks first.
#BNB #Binance
Not financial advice. DYOR.
BNB Knocks on $566 Again With Fear at 12 — Hold, or $550 Next?
BNB just wicked to $565.87.
Five days ago, $BNB bottomed at $565.41. Forty-six cents apart. Same floor. Same test. So here's the only question today: is this a double bottom forming right now — or the last bounce before it gives way?
BNB trades near $571, down about 3.3% in 24 hours and 9.6% on the week. It's 58% below its $1,370 all-time high, with daily RSI near 24 — deep oversold. And it's not a BNB-only problem. $BTC printed $61,213 today, its lowest since July, and the Fear & Greed Index sits at 12 — the eighth straight day in Extreme Fear. BNB is holding up slightly better than Bitcoin and Ether over 30 days. Barely.
Here's where it gets decided. The $566 zone is the pivot every desk is watching. Today BNB dipped thirteen cents under it, but the Nov 15 low at $565.41 did not break. That matters. Above, $580–582 is the first reclaim, then $593 (yesterday's high), then the real confirmation: a close over $600–603. Below, losing $565 on a close opens $555, then the $550 floor, then $540 — with the June–July lows near $537–546 under that. Tap $BNB and look at the daily chart yourself: the last bounce off this floor never closed above $600. It faded straight back here. History says these retests usually bounce, then base for weeks — they don't V-reverse on command. Until $600 closes, this is a test, not a bottom.
Now the weird part. While price tests its lows, Binance keeps expanding. On Nov 19 the CFTC deemed Binance.US's derivatives applications "materially complete" — that's the start of substantive review, explicitly not an approval, and US users still can't trade derivatives there. Three new stock perpetuals (Johnson & Johnson, a 2x AMD ETF, NIO) were scheduled to open this morning at up to 20x. And the REX-Osprey BNB staking ETF's registration goes effective today — but with no trading date announced, it brings zero buying power today. Meanwhile the chain did 17.6 million transactions and about $771 million in DEX volume in 24 hours, even as TVL slid to $4.42 billion, down roughly 10% in a week. Usage is holding. Capital is leaking. Price only cares about one of those.
So why could $566 still fail? Because BNB doesn't get to decide alone. Bitcoin ETFs just saw a record $541 million single-day outflow from BlackRock's fund, markets price a December Fed hike at about 95%, and if Bitcoin loses $60,000, this floor likely goes with it. Positioning isn't helping: roughly 72% of Binance accounts are long, while top traders by size are split 50/50 — crowded dip-buyers, no big-money confirmation. And the hack overhang isn't finished: about $2.85 billion frozen still hasn't been returned, with a court hearing on Dec 1.
My take? Respect the floor, don't worship it. Bulls need a close over $600; bears just need Bitcoin to break. Watch BNB against $566 — and Bitcoin against $60,000. One of them blinks first.
#BNB #Binance
Not financial advice. DYOR.
Five days ago, $BNB bottomed at $565.41. Forty-six cents apart. Same floor. Same test. So here's the only question today: is this a double bottom forming right now — or the last bounce before it gives way?
BNB trades near $571, down about 3.3% in 24 hours and 9.6% on the week. It's 58% below its $1,370 all-time high, with daily RSI near 24 — deep oversold. And it's not a BNB-only problem. $BTC printed $61,213 today, its lowest since July, and the Fear & Greed Index sits at 12 — the eighth straight day in Extreme Fear. BNB is holding up slightly better than Bitcoin and Ether over 30 days. Barely.
Here's where it gets decided. The $566 zone is the pivot every desk is watching. Today BNB dipped thirteen cents under it, but the Nov 15 low at $565.41 did not break. That matters. Above, $580–582 is the first reclaim, then $593 (yesterday's high), then the real confirmation: a close over $600–603. Below, losing $565 on a close opens $555, then the $550 floor, then $540 — with the June–July lows near $537–546 under that. Tap $BNB and look at the daily chart yourself: the last bounce off this floor never closed above $600. It faded straight back here. History says these retests usually bounce, then base for weeks — they don't V-reverse on command. Until $600 closes, this is a test, not a bottom.
Now the weird part. While price tests its lows, Binance keeps expanding. On Nov 19 the CFTC deemed Binance.US's derivatives applications "materially complete" — that's the start of substantive review, explicitly not an approval, and US users still can't trade derivatives there. Three new stock perpetuals (Johnson & Johnson, a 2x AMD ETF, NIO) were scheduled to open this morning at up to 20x. And the REX-Osprey BNB staking ETF's registration goes effective today — but with no trading date announced, it brings zero buying power today. Meanwhile the chain did 17.6 million transactions and about $771 million in DEX volume in 24 hours, even as TVL slid to $4.42 billion, down roughly 10% in a week. Usage is holding. Capital is leaking. Price only cares about one of those.
So why could $566 still fail? Because BNB doesn't get to decide alone. Bitcoin ETFs just saw a record $541 million single-day outflow from BlackRock's fund, markets price a December Fed hike at about 95%, and if Bitcoin loses $60,000, this floor likely goes with it. Positioning isn't helping: roughly 72% of Binance accounts are long, while top traders by size are split 50/50 — crowded dip-buyers, no big-money confirmation. And the hack overhang isn't finished: about $2.85 billion frozen still hasn't been returned, with a court hearing on Dec 1.
My take? Respect the floor, don't worship it. Bulls need a close over $600; bears just need Bitcoin to break. Watch BNB against $566 — and Bitcoin against $60,000. One of them blinks first.
#BNB #Binance
Not financial advice. DYOR.
2
Статья
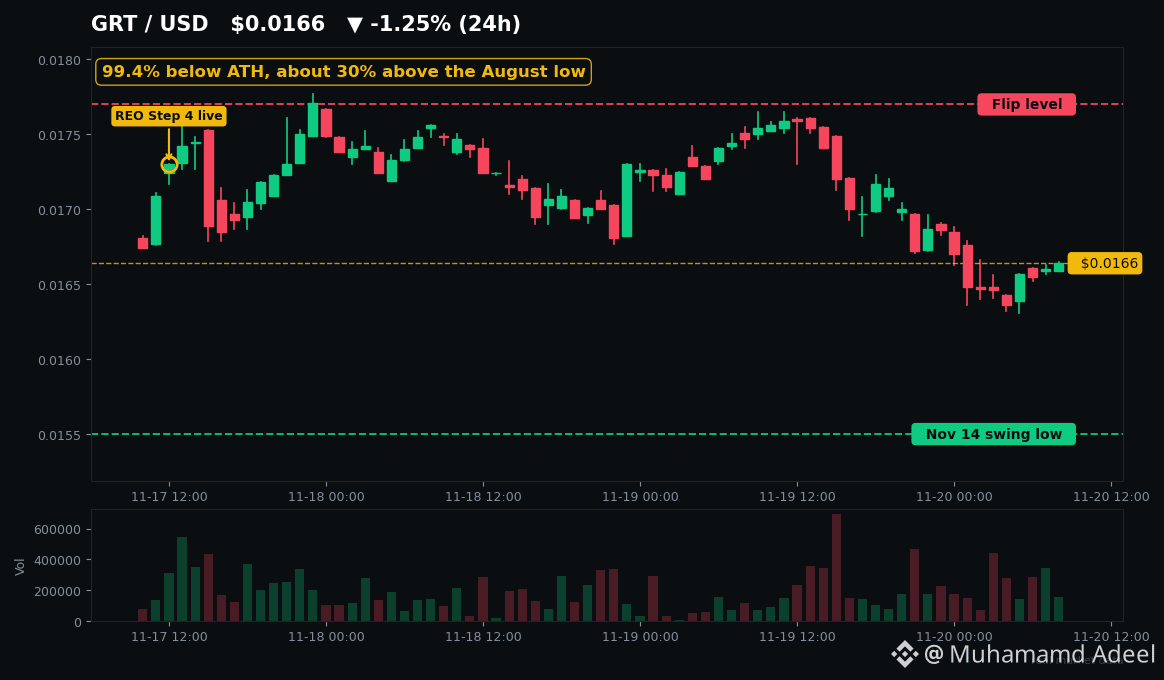
GRT по $0.0166: на 99,4% ниже исторического максимума в $2.84 — токен умер или недооценён?Повсюду говорят об ИИ. Так почему же один из старейших токенов данных в криптоиндустрии торгуется на 99,4% ниже своего максимума?
$GRT на момент написания статьи торгуется на Kraken примерно по $0.0166. За 30 дней цена упала примерно на 33% и теперь менее чем на 30% выше исторического минимума, зафиксированного 18 августа около $0.0130. Исторический максимум составлял примерно $2.84 в феврале 2021 года. Токен умер или просто жестоко недооценён?
Вот в чём суть. 17 ноября The Graph включил REO Step 4 — правило масштабирования, основанное на стейкинге. Теперь индексаторы, разместившие в стейкинге более 40 млн GRT, должны обслуживать подходящие запросы как минимум по 10 подграфам или по одному подграфу на каждые 4 млн GRT в стейкинге, чтобы продолжать получать вознаграждения. Конечная цель — один подграф на каждый миллион GRT; правило полностью вступит в силу примерно 1 декабря.
GRT по $0.0166: на 99,4% ниже исторического максимума в $2.84 — токен умер или недооценён?
Повсюду говорят об ИИ. Так почему же один из старейших токенов данных в криптоиндустрии торгуется на 99,4% ниже своего максимума?
$GRT на момент написания статьи торгуется на Kraken примерно по $0.0166. За 30 дней цена упала примерно на 33% и теперь менее чем на 30% выше исторического минимума, зафиксированного 18 августа около $0.0130. Исторический максимум составлял примерно $2.84 в феврале 2021 года. Токен умер или просто жестоко недооценён?
Вот в чём суть. 17 ноября The Graph включил REO Step 4 — правило масштабирования, основанное на стейкинге. Теперь индексаторы, разместившие в стейкинге более 40 млн GRT, должны обслуживать подходящие запросы как минимум по 10 подграфам или по одному подграфу на каждые 4 млн GRT в стейкинге, чтобы продолжать получать вознаграждения. Конечная цель — один подграф на каждый миллион GRT; правило полностью вступит в силу примерно 1 декабря.
$GRT на момент написания статьи торгуется на Kraken примерно по $0.0166. За 30 дней цена упала примерно на 33% и теперь менее чем на 30% выше исторического минимума, зафиксированного 18 августа около $0.0130. Исторический максимум составлял примерно $2.84 в феврале 2021 года. Токен умер или просто жестоко недооценён?
Вот в чём суть. 17 ноября The Graph включил REO Step 4 — правило масштабирования, основанное на стейкинге. Теперь индексаторы, разместившие в стейкинге более 40 млн GRT, должны обслуживать подходящие запросы как минимум по 10 подграфам или по одному подграфу на каждые 4 млн GRT в стейкинге, чтобы продолжать получать вознаграждения. Конечная цель — один подграф на каждый миллион GRT; правило полностью вступит в силу примерно 1 декабря.
Статья
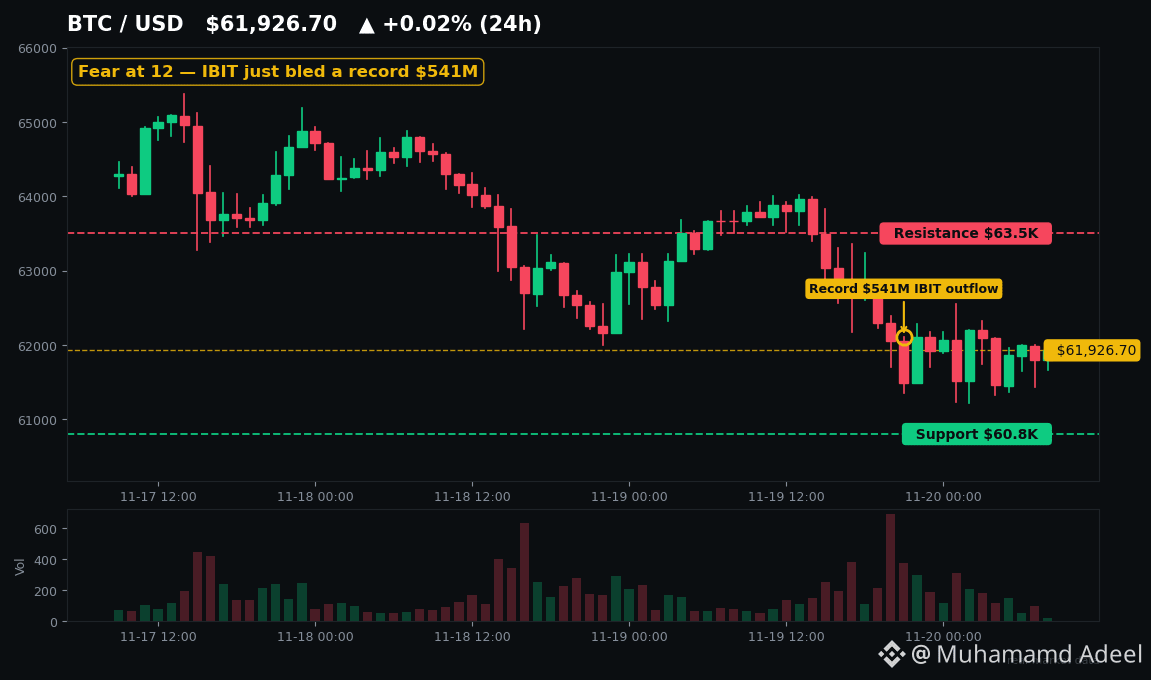
Бессрочные фьючерсы Anthropic обошли ETH. ETF на BTC потеряли рекордные $541 млнАкции ИИ-компании только что наторговали бессрочными фьючерсами больше, чем Ethereum. Вдумайтесь.
Пока биткоин падал до $61,9 тыс., трейдеры массово скупали бессрочные фьючерсы Anthropic — и уже через несколько часов это заметили регуляторы. Вот что на самом деле двигало крипторынком последние 24 часа и что это значит для ваших активов.
**1. IPO Anthropic отняло хлеб у крипты**
Anthropic провела IPO по цене $83 за акцию, привлекла около $81,3 млрд — это крупнейшее IPO в истории — и открыла торги на отметке $111,50, завершив первый день с ростом на 17%. На Hyperliquid бессрочные фьючерсы ANT за 24 часа набрали около $1,9 млрд торгового объёма — более чем вдвое больше, чем бессрочные фьючерсы ETH. Генеральный директор CoinShares Жан-Мари Могнетти сказал, что ИИ «высасывает из крипты каждый последний доллар на марже». Вот как я это вижу: ликвидность устремляется к тому, что сияет ярче, а сейчас ярче всего сияет не монета. Нажми $HYPE и посмотри, куда ушёл объём, — этот график рассказывает историю лучше любого заголовка.
Бессрочные фьючерсы Anthropic обошли ETH. ETF на BTC потеряли рекордные $541 млн
Акции ИИ-компании только что наторговали бессрочными фьючерсами больше, чем Ethereum. Вдумайтесь.
Пока биткоин падал до $61,9 тыс., трейдеры массово скупали бессрочные фьючерсы Anthropic — и уже через несколько часов это заметили регуляторы. Вот что на самом деле двигало крипторынком последние 24 часа и что это значит для ваших активов.
**1. IPO Anthropic отняло хлеб у крипты**
Anthropic провела IPO по цене $83 за акцию, привлекла около $81,3 млрд — это крупнейшее IPO в истории — и открыла торги на отметке $111,50, завершив первый день с ростом на 17%. На Hyperliquid бессрочные фьючерсы ANT за 24 часа набрали около $1,9 млрд торгового объёма — более чем вдвое больше, чем бессрочные фьючерсы ETH. Генеральный директор CoinShares Жан-Мари Могнетти сказал, что ИИ «высасывает из крипты каждый последний доллар на марже». Вот как я это вижу: ликвидность устремляется к тому, что сияет ярче, а сейчас ярче всего сияет не монета. Нажми $HYPE и посмотри, куда ушёл объём, — этот график рассказывает историю лучше любого заголовка.
Пока биткоин падал до $61,9 тыс., трейдеры массово скупали бессрочные фьючерсы Anthropic — и уже через несколько часов это заметили регуляторы. Вот что на самом деле двигало крипторынком последние 24 часа и что это значит для ваших активов.
**1. IPO Anthropic отняло хлеб у крипты**
Anthropic провела IPO по цене $83 за акцию, привлекла около $81,3 млрд — это крупнейшее IPO в истории — и открыла торги на отметке $111,50, завершив первый день с ростом на 17%. На Hyperliquid бессрочные фьючерсы ANT за 24 часа набрали около $1,9 млрд торгового объёма — более чем вдвое больше, чем бессрочные фьючерсы ETH. Генеральный директор CoinShares Жан-Мари Могнетти сказал, что ИИ «высасывает из крипты каждый последний доллар на марже». Вот как я это вижу: ликвидность устремляется к тому, что сияет ярче, а сейчас ярче всего сияет не монета. Нажми $HYPE и посмотри, куда ушёл объём, — этот график рассказывает историю лучше любого заголовка.
3
Статья
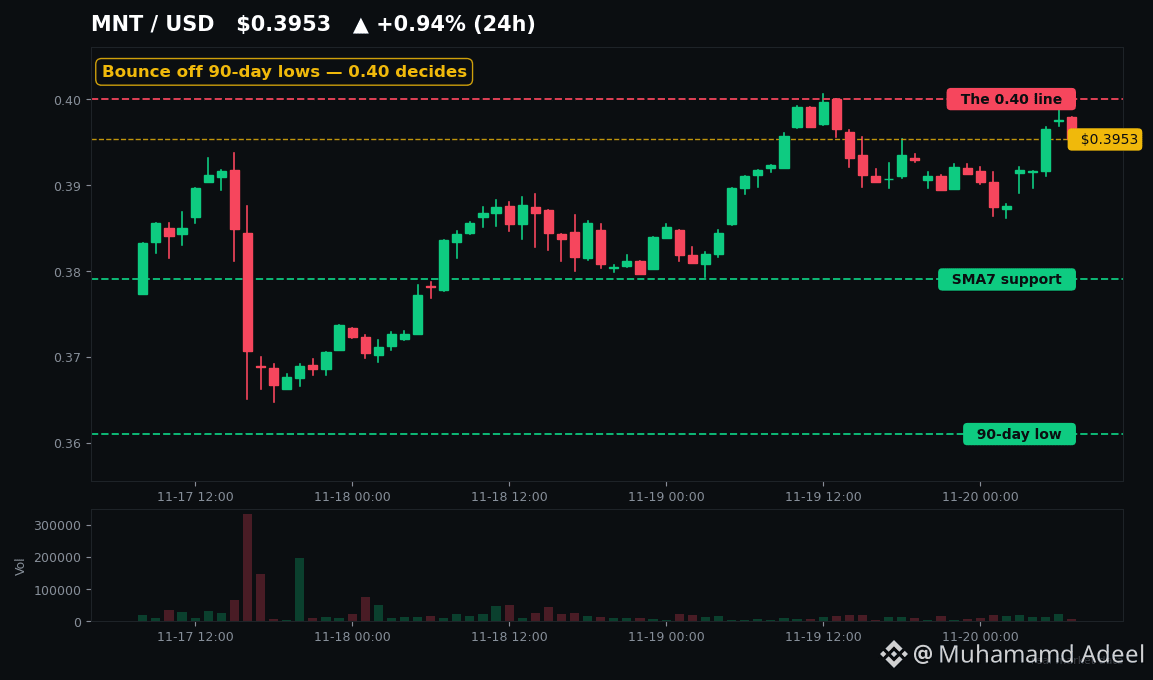
$MNT отскочил от минимумов за 90 дней, когда в Японии появился Mantle, а в блокчейне — Anthropic$MNT только что отскочил примерно на 8% от минимумов за 90 дней, пока $BTC терял позиции, — и за ту же неделю вышел на рынок Японии И разместил акции Anthropic в блокчейне. Так почему же цена всё ещё держится на уровне $0.39?
Весь смысл — в разрыве между заголовками новостей и ценой. Давайте разберёмся.
**Что только что произошло**
Mantle впервые вышла на японскую биржу — GMO Coin, зарегистрированную в FSA и насчитывающую более 825 000 аккаунтов. Объявление появилось 18 ноября (хотя обработка операций фактически началась 31 октября — важно учитывать этот нюанс). Доступ к регулируемому рынку Японии — это уже немало. Проект прошёл строгую японскую процедуру оценки активов.
$MNT отскочил от минимумов за 90 дней, когда в Японии появился Mantle, а в блокчейне — Anthropic
$MNT только что отскочил примерно на 8% от минимумов за 90 дней, пока $BTC терял позиции, — и за ту же неделю вышел на рынок Японии И разместил акции Anthropic в блокчейне. Так почему же цена всё ещё держится на уровне $0.39?
Весь смысл — в разрыве между заголовками новостей и ценой. Давайте разберёмся.
**Что только что произошло**
Mantle впервые вышла на японскую биржу — GMO Coin, зарегистрированную в FSA и насчитывающую более 825 000 аккаунтов. Объявление появилось 18 ноября (хотя обработка операций фактически началась 31 октября — важно учитывать этот нюанс). Доступ к регулируемому рынку Японии — это уже немало. Проект прошёл строгую японскую процедуру оценки активов.
Весь смысл — в разрыве между заголовками новостей и ценой. Давайте разберёмся.
**Что только что произошло**
Mantle впервые вышла на японскую биржу — GMO Coin, зарегистрированную в FSA и насчитывающую более 825 000 аккаунтов. Объявление появилось 18 ноября (хотя обработка операций фактически началась 31 октября — важно учитывать этот нюанс). Доступ к регулируемому рынку Японии — это уже немало. Проект прошёл строгую японскую процедуру оценки активов.
Статья
См. перевод
LINK Is Down 83% From Its High — But UBS Just Went Live Onchain$LINK is down 83% from its all-time high — and UBS just put tokenized structured notes into production on Chainlink yesterday. One of those two facts is lying. Which one?
Here's the disconnect nobody on your timeline can explain. On Nov 19, UBS went live with the Chainlink Runtime Environment to run the full lifecycle of a tokenized structured note — issuance, coupons, barrier checks — inside a market worth over $2 trillion. Two days earlier, Polymarket switched its hourly and daily crypto markets from Binance pricing to Chainlink Data Streams. And today, Nov 20, the REX-Osprey Chainlink ETF registration takes effect — the third US spot LINK fund, after Grayscale and Bitwise.
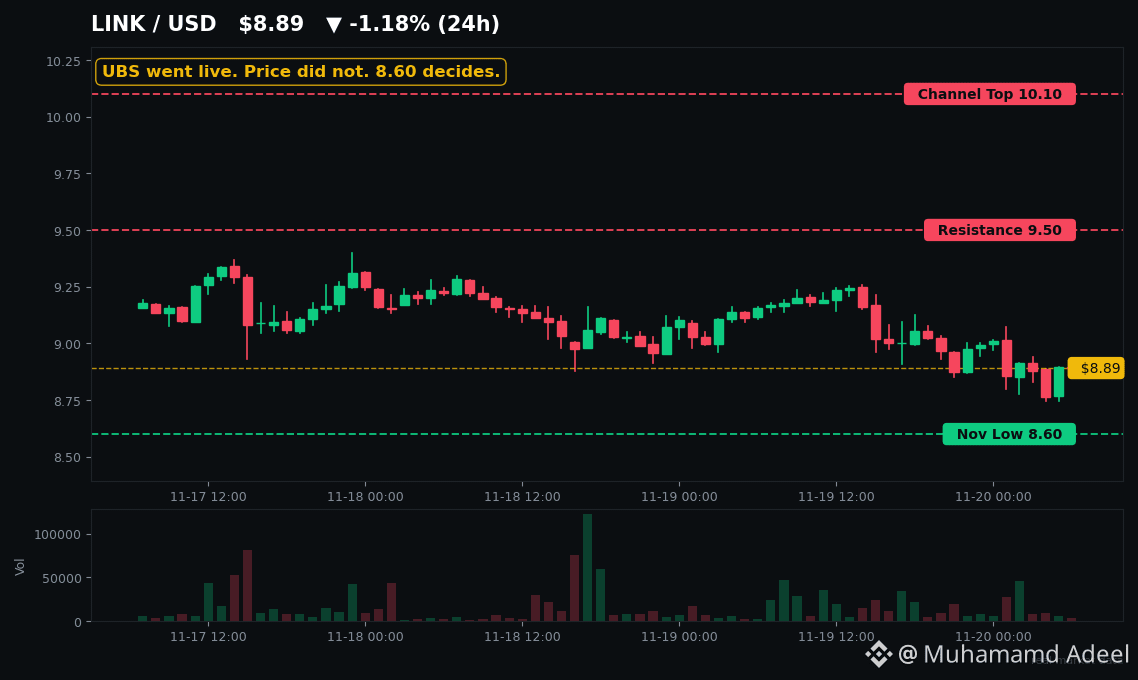
So why is LINK/USDT sitting at $8.89, down 28% in a month, with RSI at 31 and price below every major moving average?
Start with the uncomfortable math. Chainlink's network is winning — CCIP secures $85B+ in cross-chain value, and the Reserve has bought 6.8M LINK without selling a single token. Whales agree: over the last 30 days they've pulled $121.9M off exchanges against $60.7M deposited, and one OTC whale quietly bought 1.4M LINK for ~$15M during the dip.
But the token has a supply problem the network doesn't. Team wallets released 18.75M LINK in October alone, and another ~11.25M is expected around Dec 18. The Reserve buys roughly 1 LINK for every 13 released. Meanwhile US spot LINK ETFs just logged three straight outflow days, and perp whales are 87% short. Adoption is real. The bid is not.
So watch the levels, because they decide which story wins. Tap $LINK and look at the daily chart: $8.60 is the November low that has held again and again — lose it and $8.00, then $7.50, come into view. Reclaim $9.50, then the $10.10 zone where the 20-day average and channel top sit, and this stops looking like a breakdown. Above $10.83–$11.09 is where the real repair starts.
History says don't expect a V-bottom. The last time LINK was down ~90% (2022–23), the base took months — then it rebounded over 240%. Standard Chartered's August call of $200 by 2030 assumed fees scale 25x; at $8.89, even their $13 end-of-2026 marker is off track.
What this really means: you're not trading Chainlink the company. You're trading whether token economics can catch up to the rails. While $BTC dominance stays high and $ETH bleeds, LINK is a show-me story — and $8.60 is the line.
Breakout or breakdown — which side are you watching?
#Chainlink #Altcoins
Not financial advice. DYOR.
LINK Is Down 83% From Its High — But UBS Just Went Live Onchain
$LINK is down 83% from its all-time high — and UBS just put tokenized structured notes into production on Chainlink yesterday. One of those two facts is lying. Which one?
Here's the disconnect nobody on your timeline can explain. On Nov 19, UBS went live with the Chainlink Runtime Environment to run the full lifecycle of a tokenized structured note — issuance, coupons, barrier checks — inside a market worth over $2 trillion. Two days earlier, Polymarket switched its hourly and daily crypto markets from Binance pricing to Chainlink Data Streams. And today, Nov 20, the REX-Osprey Chainlink ETF registration takes effect — the third US spot LINK fund, after Grayscale and Bitwise.
So why is LINK/USDT sitting at $8.89, down 28% in a month, with RSI at 31 and price below every major moving average?
Start with the uncomfortable math. Chainlink's network is winning — CCIP secures $85B+ in cross-chain value, and the Reserve has bought 6.8M LINK without selling a single token. Whales agree: over the last 30 days they've pulled $121.9M off exchanges against $60.7M deposited, and one OTC whale quietly bought 1.4M LINK for ~$15M during the dip.
But the token has a supply problem the network doesn't. Team wallets released 18.75M LINK in October alone, and another ~11.25M is expected around Dec 18. The Reserve buys roughly 1 LINK for every 13 released. Meanwhile US spot LINK ETFs just logged three straight outflow days, and perp whales are 87% short. Adoption is real. The bid is not.
So watch the levels, because they decide which story wins. Tap $LINK and look at the daily chart: $8.60 is the November low that has held again and again — lose it and $8.00, then $7.50, come into view. Reclaim $9.50, then the $10.10 zone where the 20-day average and channel top sit, and this stops looking like a breakdown. Above $10.83–$11.09 is where the real repair starts.
History says don't expect a V-bottom. The last time LINK was down ~90% (2022–23), the base took months — then it rebounded over 240%. Standard Chartered's August call of $200 by 2030 assumed fees scale 25x; at $8.89, even their $13 end-of-2026 marker is off track.
What this really means: you're not trading Chainlink the company. You're trading whether token economics can catch up to the rails. While $BTC dominance stays high and $ETH bleeds, LINK is a show-me story — and $8.60 is the line.
Breakout or breakdown — which side are you watching?
#Chainlink #Altcoins
Not financial advice. DYOR.
Here's the disconnect nobody on your timeline can explain. On Nov 19, UBS went live with the Chainlink Runtime Environment to run the full lifecycle of a tokenized structured note — issuance, coupons, barrier checks — inside a market worth over $2 trillion. Two days earlier, Polymarket switched its hourly and daily crypto markets from Binance pricing to Chainlink Data Streams. And today, Nov 20, the REX-Osprey Chainlink ETF registration takes effect — the third US spot LINK fund, after Grayscale and Bitwise.
So why is LINK/USDT sitting at $8.89, down 28% in a month, with RSI at 31 and price below every major moving average?
Start with the uncomfortable math. Chainlink's network is winning — CCIP secures $85B+ in cross-chain value, and the Reserve has bought 6.8M LINK without selling a single token. Whales agree: over the last 30 days they've pulled $121.9M off exchanges against $60.7M deposited, and one OTC whale quietly bought 1.4M LINK for ~$15M during the dip.
But the token has a supply problem the network doesn't. Team wallets released 18.75M LINK in October alone, and another ~11.25M is expected around Dec 18. The Reserve buys roughly 1 LINK for every 13 released. Meanwhile US spot LINK ETFs just logged three straight outflow days, and perp whales are 87% short. Adoption is real. The bid is not.
So watch the levels, because they decide which story wins. Tap $LINK and look at the daily chart: $8.60 is the November low that has held again and again — lose it and $8.00, then $7.50, come into view. Reclaim $9.50, then the $10.10 zone where the 20-day average and channel top sit, and this stops looking like a breakdown. Above $10.83–$11.09 is where the real repair starts.
History says don't expect a V-bottom. The last time LINK was down ~90% (2022–23), the base took months — then it rebounded over 240%. Standard Chartered's August call of $200 by 2030 assumed fees scale 25x; at $8.89, even their $13 end-of-2026 marker is off track.
What this really means: you're not trading Chainlink the company. You're trading whether token economics can catch up to the rails. While $BTC dominance stays high and $ETH bleeds, LINK is a show-me story — and $8.60 is the line.
Breakout or breakdown — which side are you watching?
#Chainlink #Altcoins
Not financial advice. DYOR.
31
Статья
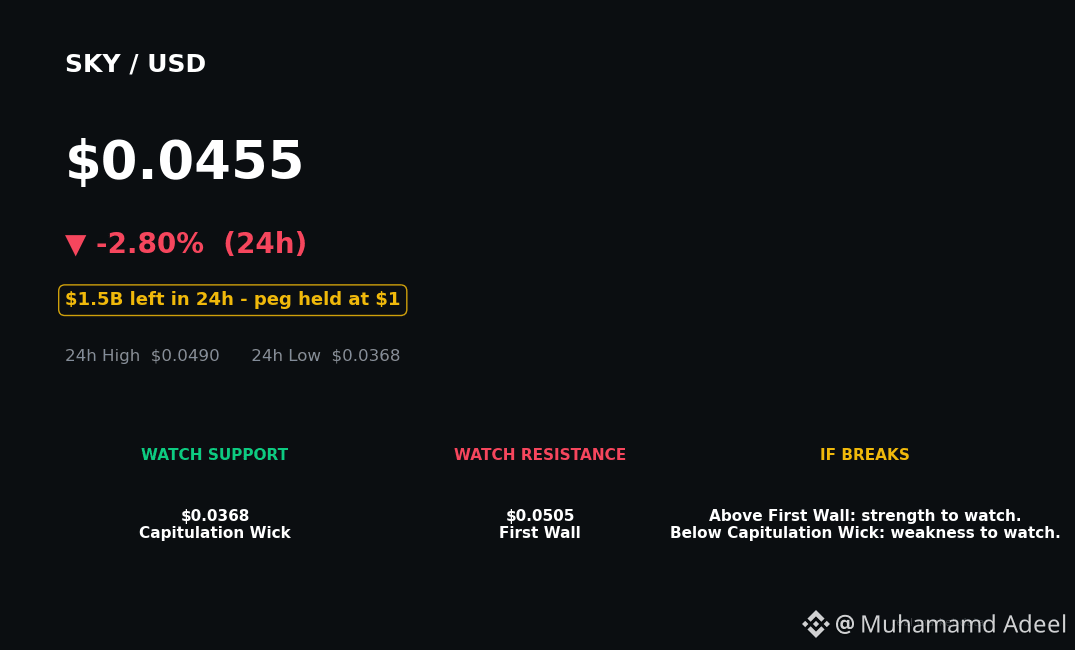
Связанные с Северной Кореей кошельки провели через Sky $101,9 млн. Затем из Sky ушло $1,5 млрдЗа один день из Sky вывели $1,5 млрд. А некоторые вкладчики до сих пор не могут снять ни цента.
Это не история о взломе. Sky не взламывали. В каком-то смысле всё хуже — это история о доверии. И за это расплачивается $SKY .
Вот что произошло на самом деле.
19 ноября Inca Digital опубликовала отчет, которым поделилась с CoinDesk: транзакции на сумму $518 млн через модуль поддержания стабильности привязки Peg Stability Module проекта Sky были связаны с 422 кошельками, принадлежащими хакерам и подсанкционным организациям. $101,9 млн приписали северокорейским злоумышленникам, в том числе $91,5 млн, переведенным в течение 10 дней после взлома Bybit в феврале 2025 года.
Связанные с Северной Кореей кошельки провели через Sky $101,9 млн. Затем из Sky ушло $1,5 млрд
За один день из Sky вывели $1,5 млрд. А некоторые вкладчики до сих пор не могут снять ни цента.
Это не история о взломе. Sky не взламывали. В каком-то смысле всё хуже — это история о доверии. И за это расплачивается $SKY .
Вот что произошло на самом деле.
19 ноября Inca Digital опубликовала отчет, которым поделилась с CoinDesk: транзакции на сумму $518 млн через модуль поддержания стабильности привязки Peg Stability Module проекта Sky были связаны с 422 кошельками, принадлежащими хакерам и подсанкционным организациям. $101,9 млн приписали северокорейским злоумышленникам, в том числе $91,5 млн, переведенным в течение 10 дней после взлома Bybit в феврале 2025 года.
Это не история о взломе. Sky не взламывали. В каком-то смысле всё хуже — это история о доверии. И за это расплачивается $SKY .
Вот что произошло на самом деле.
19 ноября Inca Digital опубликовала отчет, которым поделилась с CoinDesk: транзакции на сумму $518 млн через модуль поддержания стабильности привязки Peg Stability Module проекта Sky были связаны с 422 кошельками, принадлежащими хакерам и подсанкционным организациям. $101,9 млн приписали северокорейским злоумышленникам, в том числе $91,5 млн, переведенным в течение 10 дней после взлома Bybit в феврале 2025 года.
34
Статья
См. перевод
Glamsterdam: January or May? $ETH Devs Just Split the TimelineEthereum devs just split the Glamsterdam timeline in two — January if they ship as-is, May if they rewrite. And $ETH is sitting on the exact line that decides which story the market believes.
Here's what actually happened. At All Core Devs on Thursday 19 Nov, there was NO final go/no-go on EIP-8037 and EIP-8038 — the gas repricing that could break contracts with hardcoded gas budgets. Rough consensus: proceed with the current spec unless a viable alternative shows up. Hoodi testnet is penciled for the week of Dec 14, final call in about two weeks. Keep the spec and mainnet could land mid-January. Revise it and you're looking at April-May 2027.
Why the hesitation? The 10,000-15,000 exposed-contracts figure is an upper bound, not a confirmed list — audits flagged ~200 classes of issues, and the EF's Nov 9 update cited 4 reports of contracts that could actually break. Small dollars, huge headline. The market hates upgrade uncertainty in a downtrend.
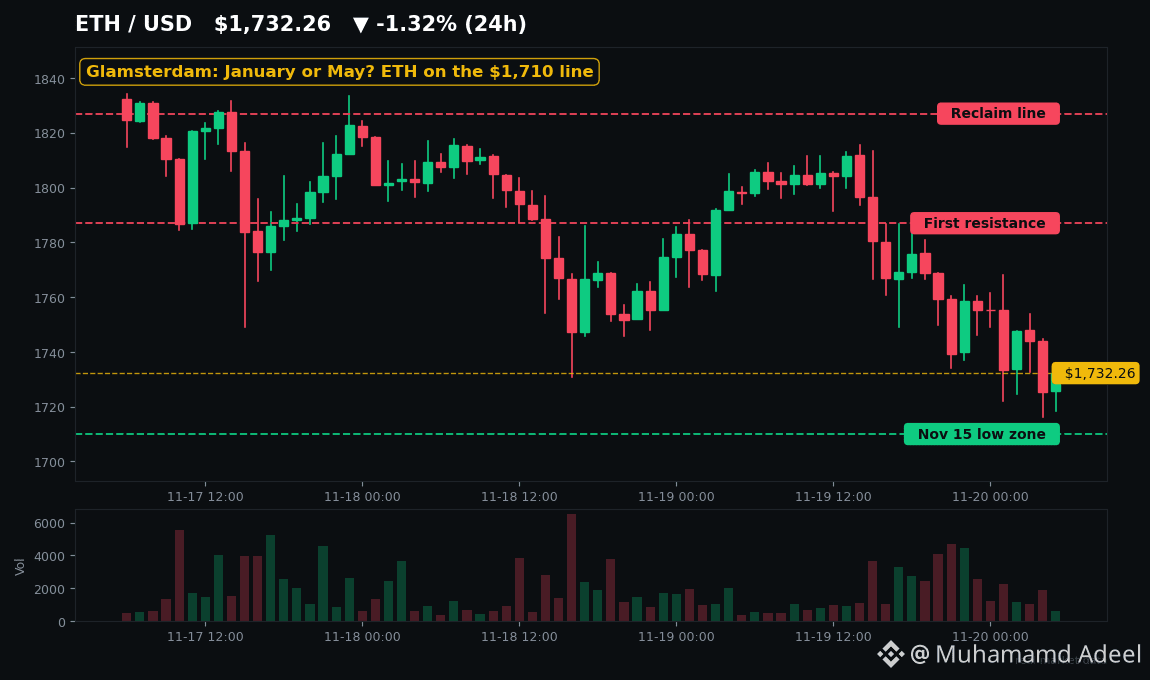
Now look at the chart. $ETH is trading around $1,730 — the weakest major today, down about 4% in 24h while $BTC holds near $61.6K. ETH/BTC is stuck at 0.0283. Support is $1,710-$1,724, the Nov 15 low zone. Resistance is $1,787-$1,827. Lose $1,710 on a close and the next magnet is $1,647, where underwater longs cluster. Reclaim $1,827 and the oversold bounce has room toward $2,018, the 20-day EMA. Tap $ETH and check that $1,710 line yourself — that's the whole trade right now.
The majors are splitting, not bouncing together. XRP is the strongest major this week, down only ~4.5% in 7 days. $SOL sits mid-pack near $72, support $68.50, resistance $75.50. AVAX is the weakest on the week at -15%. This isn't an altseason rotation. It's selective bleeding.
Flows tell the same story. US spot $ETH ETFs bled for a 4th straight day into Nov 19: -$29.1M on Nov 17, -$39.8M on Nov 18, and a reported -$5.2M on Nov 19 on partial fund reporting. Citi cut its 12-month $ETH target to $2,838 on Nov 18, citing exactly this — seven straight weeks of outflows and a broken holding pattern. Fear & Greed is 12, Extreme Fear. Daily RSI is ~24-25, deeply oversold.
So is this capitulation or a trap? Honest answer: both are still possible. Staking data dated Nov 13-15 showed a record 36.3-36.5% of supply staked with ~900K ETH in the entry queue — stakers aren't rushing out. But ETF distribution hasn't stopped, the Fed minutes priced another hike, and trapped longs who entered near $2,240 are still underwater. History says oversold + extreme fear has preceded big bounces — and also says fear alone is not a bottom.
My take: Glamsterdam uncertainty is now an $ETH-specific overhang on top of a macro downtrend. Until $1,827 is reclaimed or ETF flows flip green for 3+ sessions, rallies into resistance are guilty until proven innocent. Watch $1,710. Everything else is noise.
Reclaim $1,827 or lose $1,710 first — which side are you on?
#Ethereum #FOMC
Not financial advice. DYOR.
Glamsterdam: January or May? $ETH Devs Just Split the Timeline
Ethereum devs just split the Glamsterdam timeline in two — January if they ship as-is, May if they rewrite. And $ETH is sitting on the exact line that decides which story the market believes.
Here's what actually happened. At All Core Devs on Thursday 19 Nov, there was NO final go/no-go on EIP-8037 and EIP-8038 — the gas repricing that could break contracts with hardcoded gas budgets. Rough consensus: proceed with the current spec unless a viable alternative shows up. Hoodi testnet is penciled for the week of Dec 14, final call in about two weeks. Keep the spec and mainnet could land mid-January. Revise it and you're looking at April-May 2027.
Why the hesitation? The 10,000-15,000 exposed-contracts figure is an upper bound, not a confirmed list — audits flagged ~200 classes of issues, and the EF's Nov 9 update cited 4 reports of contracts that could actually break. Small dollars, huge headline. The market hates upgrade uncertainty in a downtrend.
Now look at the chart. $ETH is trading around $1,730 — the weakest major today, down about 4% in 24h while $BTC holds near $61.6K. ETH/BTC is stuck at 0.0283. Support is $1,710-$1,724, the Nov 15 low zone. Resistance is $1,787-$1,827. Lose $1,710 on a close and the next magnet is $1,647, where underwater longs cluster. Reclaim $1,827 and the oversold bounce has room toward $2,018, the 20-day EMA. Tap $ETH and check that $1,710 line yourself — that's the whole trade right now.
The majors are splitting, not bouncing together. XRP is the strongest major this week, down only ~4.5% in 7 days. $SOL sits mid-pack near $72, support $68.50, resistance $75.50. AVAX is the weakest on the week at -15%. This isn't an altseason rotation. It's selective bleeding.
Flows tell the same story. US spot $ETH ETFs bled for a 4th straight day into Nov 19: -$29.1M on Nov 17, -$39.8M on Nov 18, and a reported -$5.2M on Nov 19 on partial fund reporting. Citi cut its 12-month $ETH target to $2,838 on Nov 18, citing exactly this — seven straight weeks of outflows and a broken holding pattern. Fear & Greed is 12, Extreme Fear. Daily RSI is ~24-25, deeply oversold.
So is this capitulation or a trap? Honest answer: both are still possible. Staking data dated Nov 13-15 showed a record 36.3-36.5% of supply staked with ~900K ETH in the entry queue — stakers aren't rushing out. But ETF distribution hasn't stopped, the Fed minutes priced another hike, and trapped longs who entered near $2,240 are still underwater. History says oversold + extreme fear has preceded big bounces — and also says fear alone is not a bottom.
My take: Glamsterdam uncertainty is now an $ETH -specific overhang on top of a macro downtrend. Until $1,827 is reclaimed or ETF flows flip green for 3+ sessions, rallies into resistance are guilty until proven innocent. Watch $1,710. Everything else is noise.
Reclaim $1,827 or lose $1,710 first — which side are you on?
#Ethereum #FOMC
Not financial advice. DYOR.
Here's what actually happened. At All Core Devs on Thursday 19 Nov, there was NO final go/no-go on EIP-8037 and EIP-8038 — the gas repricing that could break contracts with hardcoded gas budgets. Rough consensus: proceed with the current spec unless a viable alternative shows up. Hoodi testnet is penciled for the week of Dec 14, final call in about two weeks. Keep the spec and mainnet could land mid-January. Revise it and you're looking at April-May 2027.
Why the hesitation? The 10,000-15,000 exposed-contracts figure is an upper bound, not a confirmed list — audits flagged ~200 classes of issues, and the EF's Nov 9 update cited 4 reports of contracts that could actually break. Small dollars, huge headline. The market hates upgrade uncertainty in a downtrend.
Now look at the chart. $ETH is trading around $1,730 — the weakest major today, down about 4% in 24h while $BTC holds near $61.6K. ETH/BTC is stuck at 0.0283. Support is $1,710-$1,724, the Nov 15 low zone. Resistance is $1,787-$1,827. Lose $1,710 on a close and the next magnet is $1,647, where underwater longs cluster. Reclaim $1,827 and the oversold bounce has room toward $2,018, the 20-day EMA. Tap $ETH and check that $1,710 line yourself — that's the whole trade right now.
The majors are splitting, not bouncing together. XRP is the strongest major this week, down only ~4.5% in 7 days. $SOL sits mid-pack near $72, support $68.50, resistance $75.50. AVAX is the weakest on the week at -15%. This isn't an altseason rotation. It's selective bleeding.
Flows tell the same story. US spot $ETH ETFs bled for a 4th straight day into Nov 19: -$29.1M on Nov 17, -$39.8M on Nov 18, and a reported -$5.2M on Nov 19 on partial fund reporting. Citi cut its 12-month $ETH target to $2,838 on Nov 18, citing exactly this — seven straight weeks of outflows and a broken holding pattern. Fear & Greed is 12, Extreme Fear. Daily RSI is ~24-25, deeply oversold.
So is this capitulation or a trap? Honest answer: both are still possible. Staking data dated Nov 13-15 showed a record 36.3-36.5% of supply staked with ~900K ETH in the entry queue — stakers aren't rushing out. But ETF distribution hasn't stopped, the Fed minutes priced another hike, and trapped longs who entered near $2,240 are still underwater. History says oversold + extreme fear has preceded big bounces — and also says fear alone is not a bottom.
My take: Glamsterdam uncertainty is now an $ETH -specific overhang on top of a macro downtrend. Until $1,827 is reclaimed or ETF flows flip green for 3+ sessions, rallies into resistance are guilty until proven innocent. Watch $1,710. Everything else is noise.
Reclaim $1,827 or lose $1,710 first — which side are you on?
#Ethereum #FOMC
Not financial advice. DYOR.
43
Статья
См. перевод
DOGE at $0.057: The Level That Flipped Twice Before Is BackEveryone is calling $DOGE dead. It just printed its lowest price since June 2023 — and the wallets that usually buy fear are quietly stacking while Wall Street sits frozen. Coincidence?
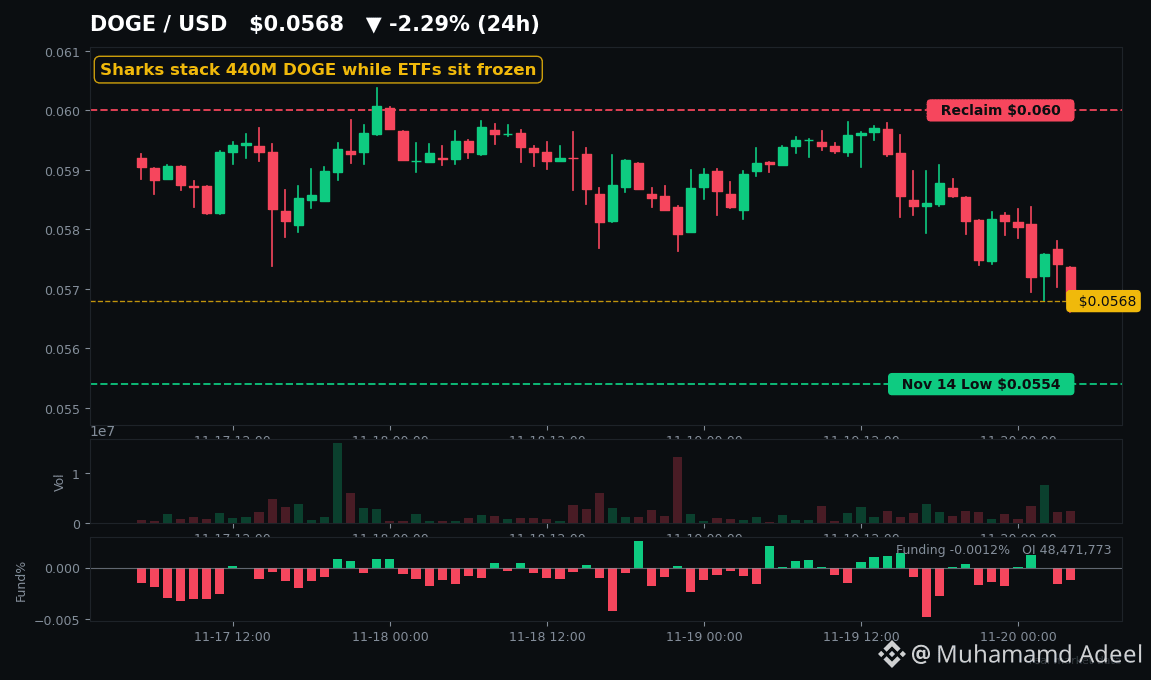
Dogecoin is trading around $0.0569 right now, down roughly 11% this week and about 30% in a month. It is sitting more than 92% below its May 2021 all-time high near $0.73, and the daily RSI is down near 26 — textbook oversold. Bitcoin just lost $62K, the Fear & Greed Index is at 12, and memecoins are bleeding across the board. $DOGE is not bouncing. It is pressing the lows again.
Here is the part nobody is pricing in. Santiment data covering 29 September to 17 November shows mid-size wallets — the 100K to 10M DOGE "shark" cohorts — added about 440 million DOGE while price kept falling. The biggest whales trimmed only slightly. Meanwhile the US spot DOGE ETFs have logged zero net flows for 25 straight sessions since mid-October. Sharks are buying the dip. Institutions are not even looking.
Now the level that matters. On 14 November DOGE wicked to $0.0554 — its lowest print since June 2023. Analyst Ali Martinez points out that the $0.054 zone is where DOGE bottomed in November 2022 before a 184% rebound, and again in June 2023 before a much bigger run. Two prior tests, two violent flips. That does not guarantee a third — but it is exactly why traders are watching this shelf instead of chasing green candles.
What would change the picture? Bulls need a daily close back above $0.060 first, then the 20-day average near $0.066. Lose $0.055 on a closing basis and the next real support gets thin fast — Martinez has flagged $0.04 as the downside scenario if this zone fails. Funding rates are negative, longs are still getting liquidated ($31M+ in the past week, mostly longs), and about 71% of Binance accounts are long. That is not a bottomed-out crowd. That is a crowd still leaning the wrong way.
Be honest about the risks. DOGE has no supply cap — roughly 5.3 billion new coins print every year, about $0.9M a day of sell pressure buyers must absorb just to hold price flat. The top wallets control a huge share of supply, there is no fresh Musk catalyst, and red Novembers have historically led to red Decembers for DOGE. Oversold can stay oversold.
So is this capitulation or a trap? Tap $DOGE and check the live chart yourself — $0.055 is the line. Hold it, and the flip thesis stays alive. Lose it, and the story changes fast. With $BTC still fragile and $SHIB at its own lows, memecoin rotation is not coming to save anyone yet.
Not financial advice. DYOR.
DOGE at $0.057: The Level That Flipped Twice Before Is Back
Everyone is calling $DOGE dead. It just printed its lowest price since June 2023 — and the wallets that usually buy fear are quietly stacking while Wall Street sits frozen. Coincidence?
Dogecoin is trading around $0.0569 right now, down roughly 11% this week and about 30% in a month. It is sitting more than 92% below its May 2021 all-time high near $0.73, and the daily RSI is down near 26 — textbook oversold. Bitcoin just lost $62K, the Fear & Greed Index is at 12, and memecoins are bleeding across the board. $DOGE is not bouncing. It is pressing the lows again.
Here is the part nobody is pricing in. Santiment data covering 29 September to 17 November shows mid-size wallets — the 100K to 10M DOGE "shark" cohorts — added about 440 million DOGE while price kept falling. The biggest whales trimmed only slightly. Meanwhile the US spot DOGE ETFs have logged zero net flows for 25 straight sessions since mid-October. Sharks are buying the dip. Institutions are not even looking.
Now the level that matters. On 14 November DOGE wicked to $0.0554 — its lowest print since June 2023. Analyst Ali Martinez points out that the $0.054 zone is where DOGE bottomed in November 2022 before a 184% rebound, and again in June 2023 before a much bigger run. Two prior tests, two violent flips. That does not guarantee a third — but it is exactly why traders are watching this shelf instead of chasing green candles.
What would change the picture? Bulls need a daily close back above $0.060 first, then the 20-day average near $0.066. Lose $0.055 on a closing basis and the next real support gets thin fast — Martinez has flagged $0.04 as the downside scenario if this zone fails. Funding rates are negative, longs are still getting liquidated ($31M+ in the past week, mostly longs), and about 71% of Binance accounts are long. That is not a bottomed-out crowd. That is a crowd still leaning the wrong way.
Be honest about the risks. DOGE has no supply cap — roughly 5.3 billion new coins print every year, about $0.9M a day of sell pressure buyers must absorb just to hold price flat. The top wallets control a huge share of supply, there is no fresh Musk catalyst, and red Novembers have historically led to red Decembers for DOGE. Oversold can stay oversold.
So is this capitulation or a trap? Tap $DOGE and check the live chart yourself — $0.055 is the line. Hold it, and the flip thesis stays alive. Lose it, and the story changes fast. With $BTC still fragile and $SHIB at its own lows, memecoin rotation is not coming to save anyone yet.
Not financial advice. DYOR.
Dogecoin is trading around $0.0569 right now, down roughly 11% this week and about 30% in a month. It is sitting more than 92% below its May 2021 all-time high near $0.73, and the daily RSI is down near 26 — textbook oversold. Bitcoin just lost $62K, the Fear & Greed Index is at 12, and memecoins are bleeding across the board. $DOGE is not bouncing. It is pressing the lows again.
Here is the part nobody is pricing in. Santiment data covering 29 September to 17 November shows mid-size wallets — the 100K to 10M DOGE "shark" cohorts — added about 440 million DOGE while price kept falling. The biggest whales trimmed only slightly. Meanwhile the US spot DOGE ETFs have logged zero net flows for 25 straight sessions since mid-October. Sharks are buying the dip. Institutions are not even looking.
Now the level that matters. On 14 November DOGE wicked to $0.0554 — its lowest print since June 2023. Analyst Ali Martinez points out that the $0.054 zone is where DOGE bottomed in November 2022 before a 184% rebound, and again in June 2023 before a much bigger run. Two prior tests, two violent flips. That does not guarantee a third — but it is exactly why traders are watching this shelf instead of chasing green candles.
What would change the picture? Bulls need a daily close back above $0.060 first, then the 20-day average near $0.066. Lose $0.055 on a closing basis and the next real support gets thin fast — Martinez has flagged $0.04 as the downside scenario if this zone fails. Funding rates are negative, longs are still getting liquidated ($31M+ in the past week, mostly longs), and about 71% of Binance accounts are long. That is not a bottomed-out crowd. That is a crowd still leaning the wrong way.
Be honest about the risks. DOGE has no supply cap — roughly 5.3 billion new coins print every year, about $0.9M a day of sell pressure buyers must absorb just to hold price flat. The top wallets control a huge share of supply, there is no fresh Musk catalyst, and red Novembers have historically led to red Decembers for DOGE. Oversold can stay oversold.
So is this capitulation or a trap? Tap $DOGE and check the live chart yourself — $0.055 is the line. Hold it, and the flip thesis stays alive. Lose it, and the story changes fast. With $BTC still fragile and $SHIB at its own lows, memecoin rotation is not coming to save anyone yet.
Not financial advice. DYOR.
56
Статья
См. перевод
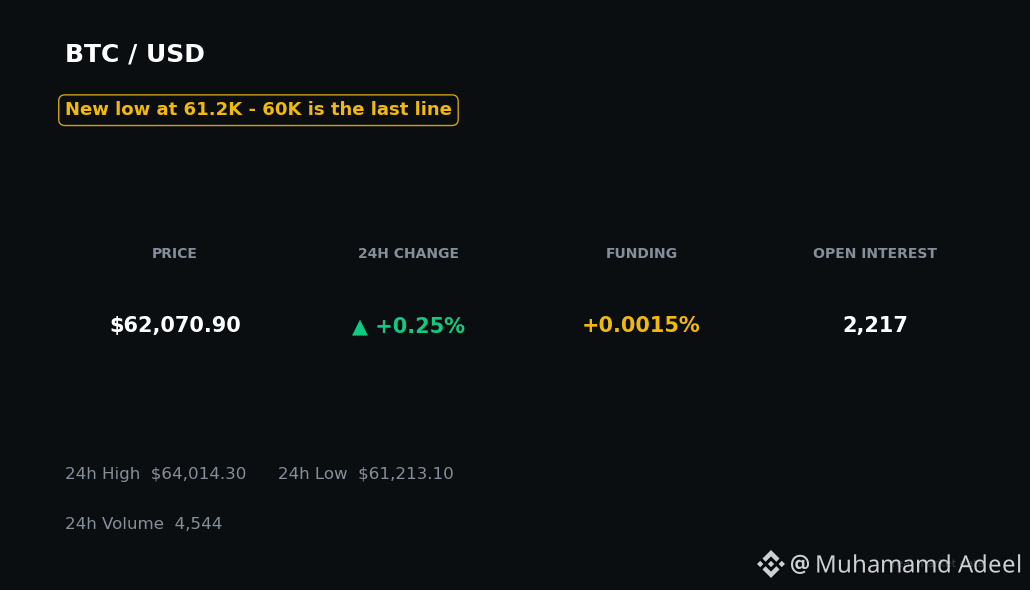
BTC Just Lost $62K — $60K Is Now the Last Line$BTC just printed $61,213 — its lowest price since early July. $60K is now roughly $1K away.
So be honest: is this the washout everyone has been waiting for... or just the warm-up act?
Bitcoin broke below last weekend's $62,006 low on Thursday, sliding from ~$64K to ~$62K into the US close as the Nasdaq fell 2.1% on Anthropic's IPO day. CoinGlass counted $528M in futures liquidations in 24 hours, about 80% of them longs, across more than 113,000 traders. BTC is on track for a seventh straight weekly loss. Tap $BTC and look at that weekly candle — it is not pretty.
Why is it falling? Three things, all verified.
First, the ETF bid is gone. US spot BTC ETFs lost $306.5M on Nov 18 alone (Farside), taking November outflows to about $2.9B through Nov 18, with net assets down to $77.7B — a three-month low. Nov 19's print is still partial (IBIT pending), so anyone quoting you a final number today is guessing.
Second, the Fed is not coming to save anyone. Markets price roughly 95% odds of a 25bp hike at the Dec 8–9 meeting, and Thursday's Philly Fed report showed prices paid jumping to 58.2 even as activity missed badly. Hawkish Fed speakers piled on the same day.
Third, the dry powder is draining. Glassnode says total stablecoin supply fell $14.2B in 30 days — the fastest contraction since June 2022 — while realized losses hit levels last seen near the 2018, 2020 and 2022 lows. Short-term holders' average cost sits near $74,100 (Glassnode), which is why every bounce keeps getting sold.
Now the level that actually matters: $60K. Wintermute flags a cluster of $60K puts on Deribit (about $900M notional) as the next magnet, and a daily close below $60K would open the June low near $58.5K, the July low near $57.7K, and below that the realized price near $53.7K. If Bitcoin loses $60K, $ETH usually feels it next — same ETF bleed, same fear.
But here is the part nobody wants to hear: Extreme Fear (12 today) is not a buy signal by itself. Past clusters at 10 or below were basically a coin flip 90 days out — February 2026 bounced about 21%, while 2022 fell another 51% after its first cluster. Fear tells you sellers are tired. It does not tell you they are done.
What would change the story? A daily close back above $65K, then a reclaim of the 200-week average near $68.2K with ETF inflows returning — Wintermute's own condition for turning less cautious. Until then, $60K is the line. Watch the close, not the wick.
#Bitcoin #Crypto
Not financial advice. DYOR.
BTC Just Lost $62K — $60K Is Now the Last Line
$BTC just printed $61,213 — its lowest price since early July. $60K is now roughly $1K away.
So be honest: is this the washout everyone has been waiting for... or just the warm-up act?
Bitcoin broke below last weekend's $62,006 low on Thursday, sliding from ~$64K to ~$62K into the US close as the Nasdaq fell 2.1% on Anthropic's IPO day. CoinGlass counted $528M in futures liquidations in 24 hours, about 80% of them longs, across more than 113,000 traders. BTC is on track for a seventh straight weekly loss. Tap $BTC and look at that weekly candle — it is not pretty.
Why is it falling? Three things, all verified.
First, the ETF bid is gone. US spot BTC ETFs lost $306.5M on Nov 18 alone (Farside), taking November outflows to about $2.9B through Nov 18, with net assets down to $77.7B — a three-month low. Nov 19's print is still partial (IBIT pending), so anyone quoting you a final number today is guessing.
Second, the Fed is not coming to save anyone. Markets price roughly 95% odds of a 25bp hike at the Dec 8–9 meeting, and Thursday's Philly Fed report showed prices paid jumping to 58.2 even as activity missed badly. Hawkish Fed speakers piled on the same day.
Third, the dry powder is draining. Glassnode says total stablecoin supply fell $14.2B in 30 days — the fastest contraction since June 2022 — while realized losses hit levels last seen near the 2018, 2020 and 2022 lows. Short-term holders' average cost sits near $74,100 (Glassnode), which is why every bounce keeps getting sold.
Now the level that actually matters: $60K. Wintermute flags a cluster of $60K puts on Deribit (about $900M notional) as the next magnet, and a daily close below $60K would open the June low near $58.5K, the July low near $57.7K, and below that the realized price near $53.7K. If Bitcoin loses $60K, $ETH usually feels it next — same ETF bleed, same fear.
But here is the part nobody wants to hear: Extreme Fear (12 today) is not a buy signal by itself. Past clusters at 10 or below were basically a coin flip 90 days out — February 2026 bounced about 21%, while 2022 fell another 51% after its first cluster. Fear tells you sellers are tired. It does not tell you they are done.
What would change the story? A daily close back above $65K, then a reclaim of the 200-week average near $68.2K with ETF inflows returning — Wintermute's own condition for turning less cautious. Until then, $60K is the line. Watch the close, not the wick.
#Bitcoin #Crypto
Not financial advice. DYOR.
So be honest: is this the washout everyone has been waiting for... or just the warm-up act?
Bitcoin broke below last weekend's $62,006 low on Thursday, sliding from ~$64K to ~$62K into the US close as the Nasdaq fell 2.1% on Anthropic's IPO day. CoinGlass counted $528M in futures liquidations in 24 hours, about 80% of them longs, across more than 113,000 traders. BTC is on track for a seventh straight weekly loss. Tap $BTC and look at that weekly candle — it is not pretty.
Why is it falling? Three things, all verified.
First, the ETF bid is gone. US spot BTC ETFs lost $306.5M on Nov 18 alone (Farside), taking November outflows to about $2.9B through Nov 18, with net assets down to $77.7B — a three-month low. Nov 19's print is still partial (IBIT pending), so anyone quoting you a final number today is guessing.
Second, the Fed is not coming to save anyone. Markets price roughly 95% odds of a 25bp hike at the Dec 8–9 meeting, and Thursday's Philly Fed report showed prices paid jumping to 58.2 even as activity missed badly. Hawkish Fed speakers piled on the same day.
Third, the dry powder is draining. Glassnode says total stablecoin supply fell $14.2B in 30 days — the fastest contraction since June 2022 — while realized losses hit levels last seen near the 2018, 2020 and 2022 lows. Short-term holders' average cost sits near $74,100 (Glassnode), which is why every bounce keeps getting sold.
Now the level that actually matters: $60K. Wintermute flags a cluster of $60K puts on Deribit (about $900M notional) as the next magnet, and a daily close below $60K would open the June low near $58.5K, the July low near $57.7K, and below that the realized price near $53.7K. If Bitcoin loses $60K, $ETH usually feels it next — same ETF bleed, same fear.
But here is the part nobody wants to hear: Extreme Fear (12 today) is not a buy signal by itself. Past clusters at 10 or below were basically a coin flip 90 days out — February 2026 bounced about 21%, while 2022 fell another 51% after its first cluster. Fear tells you sellers are tired. It does not tell you they are done.
What would change the story? A daily close back above $65K, then a reclaim of the 200-week average near $68.2K with ETF inflows returning — Wintermute's own condition for turning less cautious. Until then, $60K is the line. Watch the close, not the wick.
#Bitcoin #Crypto
Not financial advice. DYOR.
71
Статья
См. перевод
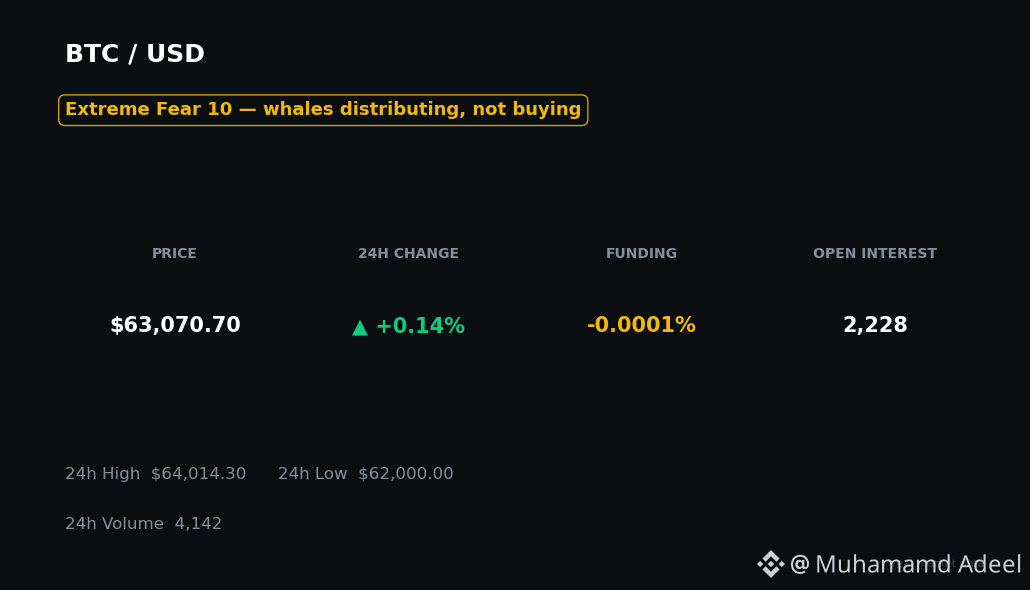
Whales Didn't Buy the FOMC Dip — $306M Left ETFs InsteadExtreme Fear for the seventh straight day — the index just printed 10. $BTC is sitting at $63K after the Fed minutes. And the whales? They didn't buy the dip. They moved coins toward exchanges.
That's the verdict from the chain in the 24 hours after Wednesday's FOMC minutes — and it's not the story most timelines are telling you.
Here's what happened. The minutes from the October 27–28 meeting dropped Wednesday at 19:00 UTC, and they were hawkish: almost all officials judged further hikes likely appropriate, with a couple even open to more than 25bp in December. CME pricing puts a 25bp December hike at roughly 95%. Bitcoin slipped from $63,117 before the release to $62,706 within the hour.
So did big money step in? Look at the wallets. Santiment counts 150,770 wallets holding at least 10 BTC — the highest since January. Sounds bullish, right? Except those same wallets hold 10,000 fewer BTC than four weeks ago. More wallets, less Bitcoin. That's distribution wearing an accumulation costume.
Long-term holders are joining in. CryptoQuant data through November 18 shows long-term holder supply down 73,900 BTC in a week to a 90-day low, with only about 52% of supply still in profit.
Exchange flows flipped the wrong way too. After outflows on November 18, AlphaFinance tracked a net inflow of about 8,948 BTC in the 24 hours to Thursday afternoon, led by Kraken and Binance, while Coinbase went the other way. Trackers disagree on the exact number, but the direction after the minutes was coins arriving where they can be sold, not leaving for cold storage.
And ETFs? They voted with their feet. US spot Bitcoin ETFs lost $306.5M on Wednesday, November 18 — BlackRock's IBIT alone shed $148.7M — taking November outflows to roughly $2.9B. $ETH funds lost another $39.8M the same day. No fund was positive. That's not dip-buying. That's an exit queue.
Now, before bears celebrate: leverage is washed out. Santiment puts BTC open interest at $17.99B, the lowest since October 2024. Realized losses have reached levels Glassnode has only seen near the 2018, 2020, 2022 and early-2023 lows. And history is humbling — across 25 past clusters where Fear & Greed hit 10 or below, Bitcoin's median 90-day move was just +1.4%. Extreme Fear marks value zones. It does not ring a bell.
My take: weak hands have capitulated, leverage is gone, but the big spot bid hasn't shown up yet. $62K is the line — the November 15 low zone, and Glassnode warns a daily close below it opens $58.5K. Reclaim $65K and pressure eases; $68K is the 200-week average Wintermute flagged; $74.1K is the short-term holder cost basis that would confirm a real bottom. Tap the $BTC cashtag and check where price sits against those levels — that's the chart that decides this, not the fear print.
Whales distributing into Extreme Fear, or the last shakeout before they load up? Tell me what you see.
#Bitcoin #OnChain
Not financial advice. DYOR.
Whales Didn't Buy the FOMC Dip — $306M Left ETFs Instead
Extreme Fear for the seventh straight day — the index just printed 10. $BTC is sitting at $63K after the Fed minutes. And the whales? They didn't buy the dip. They moved coins toward exchanges.
That's the verdict from the chain in the 24 hours after Wednesday's FOMC minutes — and it's not the story most timelines are telling you.
Here's what happened. The minutes from the October 27–28 meeting dropped Wednesday at 19:00 UTC, and they were hawkish: almost all officials judged further hikes likely appropriate, with a couple even open to more than 25bp in December. CME pricing puts a 25bp December hike at roughly 95%. Bitcoin slipped from $63,117 before the release to $62,706 within the hour.
So did big money step in? Look at the wallets. Santiment counts 150,770 wallets holding at least 10 BTC — the highest since January. Sounds bullish, right? Except those same wallets hold 10,000 fewer BTC than four weeks ago. More wallets, less Bitcoin. That's distribution wearing an accumulation costume.
Long-term holders are joining in. CryptoQuant data through November 18 shows long-term holder supply down 73,900 BTC in a week to a 90-day low, with only about 52% of supply still in profit.
Exchange flows flipped the wrong way too. After outflows on November 18, AlphaFinance tracked a net inflow of about 8,948 BTC in the 24 hours to Thursday afternoon, led by Kraken and Binance, while Coinbase went the other way. Trackers disagree on the exact number, but the direction after the minutes was coins arriving where they can be sold, not leaving for cold storage.
And ETFs? They voted with their feet. US spot Bitcoin ETFs lost $306.5M on Wednesday, November 18 — BlackRock's IBIT alone shed $148.7M — taking November outflows to roughly $2.9B. $ETH funds lost another $39.8M the same day. No fund was positive. That's not dip-buying. That's an exit queue.
Now, before bears celebrate: leverage is washed out. Santiment puts BTC open interest at $17.99B, the lowest since October 2024. Realized losses have reached levels Glassnode has only seen near the 2018, 2020, 2022 and early-2023 lows. And history is humbling — across 25 past clusters where Fear & Greed hit 10 or below, Bitcoin's median 90-day move was just +1.4%. Extreme Fear marks value zones. It does not ring a bell.
My take: weak hands have capitulated, leverage is gone, but the big spot bid hasn't shown up yet. $62K is the line — the November 15 low zone, and Glassnode warns a daily close below it opens $58.5K. Reclaim $65K and pressure eases; $68K is the 200-week average Wintermute flagged; $74.1K is the short-term holder cost basis that would confirm a real bottom. Tap the $BTC cashtag and check where price sits against those levels — that's the chart that decides this, not the fear print.
Whales distributing into Extreme Fear, or the last shakeout before they load up? Tell me what you see.
#Bitcoin #OnChain
Not financial advice. DYOR.
That's the verdict from the chain in the 24 hours after Wednesday's FOMC minutes — and it's not the story most timelines are telling you.
Here's what happened. The minutes from the October 27–28 meeting dropped Wednesday at 19:00 UTC, and they were hawkish: almost all officials judged further hikes likely appropriate, with a couple even open to more than 25bp in December. CME pricing puts a 25bp December hike at roughly 95%. Bitcoin slipped from $63,117 before the release to $62,706 within the hour.
So did big money step in? Look at the wallets. Santiment counts 150,770 wallets holding at least 10 BTC — the highest since January. Sounds bullish, right? Except those same wallets hold 10,000 fewer BTC than four weeks ago. More wallets, less Bitcoin. That's distribution wearing an accumulation costume.
Long-term holders are joining in. CryptoQuant data through November 18 shows long-term holder supply down 73,900 BTC in a week to a 90-day low, with only about 52% of supply still in profit.
Exchange flows flipped the wrong way too. After outflows on November 18, AlphaFinance tracked a net inflow of about 8,948 BTC in the 24 hours to Thursday afternoon, led by Kraken and Binance, while Coinbase went the other way. Trackers disagree on the exact number, but the direction after the minutes was coins arriving where they can be sold, not leaving for cold storage.
And ETFs? They voted with their feet. US spot Bitcoin ETFs lost $306.5M on Wednesday, November 18 — BlackRock's IBIT alone shed $148.7M — taking November outflows to roughly $2.9B. $ETH funds lost another $39.8M the same day. No fund was positive. That's not dip-buying. That's an exit queue.
Now, before bears celebrate: leverage is washed out. Santiment puts BTC open interest at $17.99B, the lowest since October 2024. Realized losses have reached levels Glassnode has only seen near the 2018, 2020, 2022 and early-2023 lows. And history is humbling — across 25 past clusters where Fear & Greed hit 10 or below, Bitcoin's median 90-day move was just +1.4%. Extreme Fear marks value zones. It does not ring a bell.
My take: weak hands have capitulated, leverage is gone, but the big spot bid hasn't shown up yet. $62K is the line — the November 15 low zone, and Glassnode warns a daily close below it opens $58.5K. Reclaim $65K and pressure eases; $68K is the 200-week average Wintermute flagged; $74.1K is the short-term holder cost basis that would confirm a real bottom. Tap the $BTC cashtag and check where price sits against those levels — that's the chart that decides this, not the fear print.
Whales distributing into Extreme Fear, or the last shakeout before they load up? Tell me what you see.
#Bitcoin #OnChain
Not financial advice. DYOR.
3
Статья
См. перевод
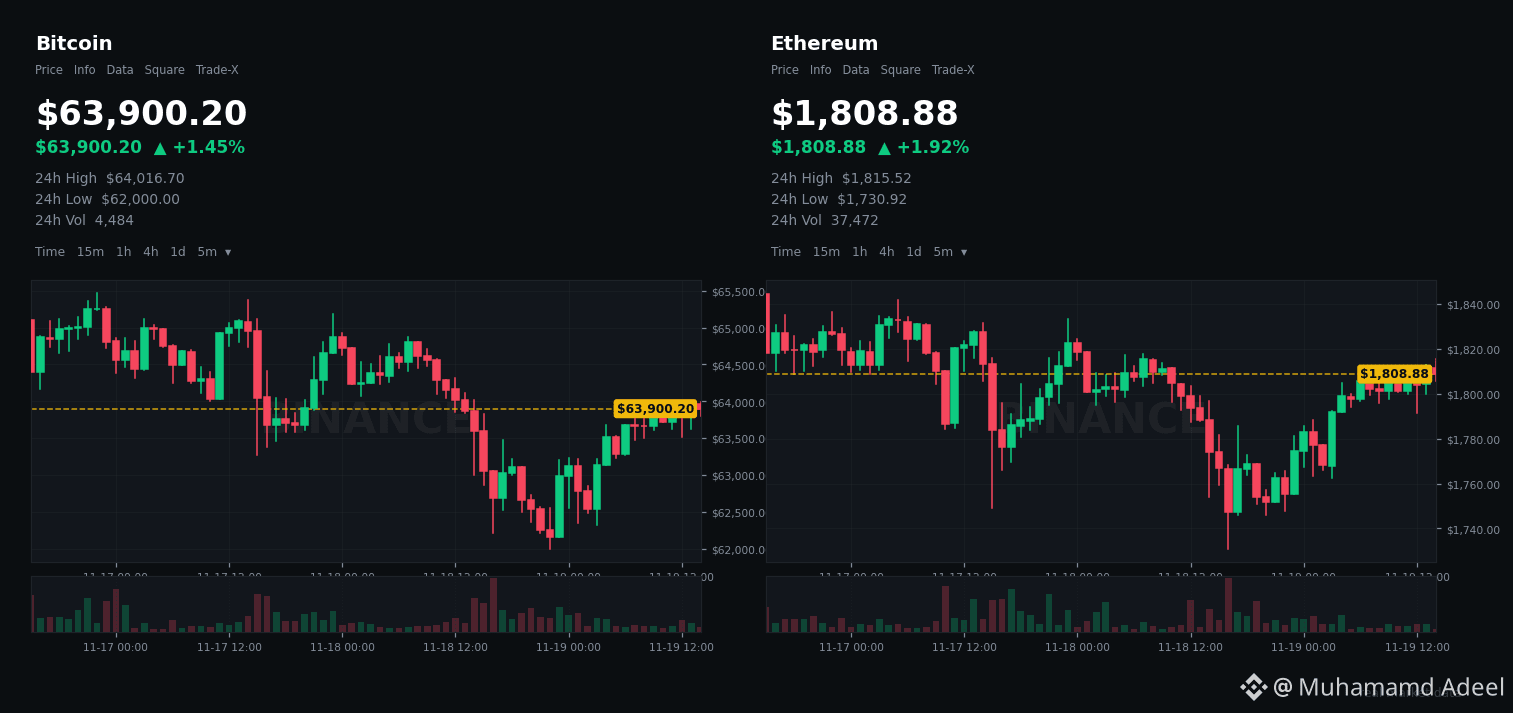
Factories Cracked, Prices Surged — So Why Did Bitcoin Bounce?Growth just cracked. Prices just surged. And Bitcoin bounced anyway.
That's the trap the Fed is in — and it's why $BTC near $63,900 today is the most honest chart in macro.
Look at what landed this morning, 19 Nov. The Philly Fed manufacturing index collapsed to 6.3 from 20.9 in October — a six-month low, miles below the ~20 expected. New orders slipped to -0.4. That's the growth side breaking.
Now the other side: prices paid in the same survey jumped to 58.2 from 43.2. Jobless claims ticked up to 203,000, and continuing claims rose 70,000 to 1.763 million — people who lose jobs are taking longer to find new ones.
Weak growth. Hot prices. Slowing hiring. Textbook stagflation mix, three weeks before the 8–9 December FOMC.
So what did Wall Street do? It added hikes. J.P. Morgan said today it now expects 25bp hikes in December, January AND March. Danske moved to three hikes to 4.50%–4.75% by March. Goldman reiterated December plus March. CME pricing sits near 95% for a 25bp December hike to 4.00%–4.25%, with only ~4% left on a 50bp shock — yesterday's minutes ("almost all" officials saw more hikes likely) killed the hold case, and today's data killed the panic case.
Institutions are still voting with their feet. Spot BTC ETFs lost $306.5M on 18 Nov — zero inflows across all 12 funds, IBIT -$148.7M leading. That's two straight red days, about -$546M combined, with November near -$2.9B. $ETH ETFs lost another $39.8M. Citi cut its 12-month BTC target to $99,532 from $113,000, citing ETF demand turning net-negative for the year. Fear & Greed? 10. Extreme Fear.
Here's what this really means: the bear trade is crowded and the surprise risk has flipped. The 10-year yield eased to ~5.07% after topping near 5.15%, the dollar sits at a 19-month high near 103.9, and on-chain buyers absorbed roughly 66,000 BTC between $62K–$66K during the heaviest selling. Options traders are paying up for $60K puts — 70% of volume — which is exactly the positioning that squeezes if December delivers "only" 25bp and 25 Nov PCE comes in soft. History says priced-in hikes grind more than they crash: September 2022's 84%-priced 75bp hike cost BTC just 1.7% on the day.
But don't confuse squeeze fuel with a bottom. CryptoQuant still scores this bearish (10/100), with the 200-day (~$72,900) now overhead resistance. The line is $62K: the $61,947 weekend low held Wednesday, and a daily close below $62K opens $58.5K. Reclaim $65K — Wednesday's $65,166 high — and the path back toward the 200-week near $68K opens. Tap $BTC and check which side of $62K–$65K it's closing on. That range decides December.
Not financial advice. DYOR.
Factories Cracked, Prices Surged — So Why Did Bitcoin Bounce?
Growth just cracked. Prices just surged. And Bitcoin bounced anyway.
That's the trap the Fed is in — and it's why $BTC near $63,900 today is the most honest chart in macro.
Look at what landed this morning, 19 Nov. The Philly Fed manufacturing index collapsed to 6.3 from 20.9 in October — a six-month low, miles below the ~20 expected. New orders slipped to -0.4. That's the growth side breaking.
Now the other side: prices paid in the same survey jumped to 58.2 from 43.2. Jobless claims ticked up to 203,000, and continuing claims rose 70,000 to 1.763 million — people who lose jobs are taking longer to find new ones.
Weak growth. Hot prices. Slowing hiring. Textbook stagflation mix, three weeks before the 8–9 December FOMC.
So what did Wall Street do? It added hikes. J.P. Morgan said today it now expects 25bp hikes in December, January AND March. Danske moved to three hikes to 4.50%–4.75% by March. Goldman reiterated December plus March. CME pricing sits near 95% for a 25bp December hike to 4.00%–4.25%, with only ~4% left on a 50bp shock — yesterday's minutes ("almost all" officials saw more hikes likely) killed the hold case, and today's data killed the panic case.
Institutions are still voting with their feet. Spot BTC ETFs lost $306.5M on 18 Nov — zero inflows across all 12 funds, IBIT -$148.7M leading. That's two straight red days, about -$546M combined, with November near -$2.9B. $ETH ETFs lost another $39.8M. Citi cut its 12-month BTC target to $99,532 from $113,000, citing ETF demand turning net-negative for the year. Fear & Greed? 10. Extreme Fear.
Here's what this really means: the bear trade is crowded and the surprise risk has flipped. The 10-year yield eased to ~5.07% after topping near 5.15%, the dollar sits at a 19-month high near 103.9, and on-chain buyers absorbed roughly 66,000 BTC between $62K–$66K during the heaviest selling. Options traders are paying up for $60K puts — 70% of volume — which is exactly the positioning that squeezes if December delivers "only" 25bp and 25 Nov PCE comes in soft. History says priced-in hikes grind more than they crash: September 2022's 84%-priced 75bp hike cost BTC just 1.7% on the day.
But don't confuse squeeze fuel with a bottom. CryptoQuant still scores this bearish (10/100), with the 200-day (~$72,900) now overhead resistance. The line is $62K: the $61,947 weekend low held Wednesday, and a daily close below $62K opens $58.5K. Reclaim $65K — Wednesday's $65,166 high — and the path back toward the 200-week near $68K opens. Tap $BTC and check which side of $62K–$65K it's closing on. That range decides December.
Not financial advice. DYOR.
That's the trap the Fed is in — and it's why $BTC near $63,900 today is the most honest chart in macro.
Look at what landed this morning, 19 Nov. The Philly Fed manufacturing index collapsed to 6.3 from 20.9 in October — a six-month low, miles below the ~20 expected. New orders slipped to -0.4. That's the growth side breaking.
Now the other side: prices paid in the same survey jumped to 58.2 from 43.2. Jobless claims ticked up to 203,000, and continuing claims rose 70,000 to 1.763 million — people who lose jobs are taking longer to find new ones.
Weak growth. Hot prices. Slowing hiring. Textbook stagflation mix, three weeks before the 8–9 December FOMC.
So what did Wall Street do? It added hikes. J.P. Morgan said today it now expects 25bp hikes in December, January AND March. Danske moved to three hikes to 4.50%–4.75% by March. Goldman reiterated December plus March. CME pricing sits near 95% for a 25bp December hike to 4.00%–4.25%, with only ~4% left on a 50bp shock — yesterday's minutes ("almost all" officials saw more hikes likely) killed the hold case, and today's data killed the panic case.
Institutions are still voting with their feet. Spot BTC ETFs lost $306.5M on 18 Nov — zero inflows across all 12 funds, IBIT -$148.7M leading. That's two straight red days, about -$546M combined, with November near -$2.9B. $ETH ETFs lost another $39.8M. Citi cut its 12-month BTC target to $99,532 from $113,000, citing ETF demand turning net-negative for the year. Fear & Greed? 10. Extreme Fear.
Here's what this really means: the bear trade is crowded and the surprise risk has flipped. The 10-year yield eased to ~5.07% after topping near 5.15%, the dollar sits at a 19-month high near 103.9, and on-chain buyers absorbed roughly 66,000 BTC between $62K–$66K during the heaviest selling. Options traders are paying up for $60K puts — 70% of volume — which is exactly the positioning that squeezes if December delivers "only" 25bp and 25 Nov PCE comes in soft. History says priced-in hikes grind more than they crash: September 2022's 84%-priced 75bp hike cost BTC just 1.7% on the day.
But don't confuse squeeze fuel with a bottom. CryptoQuant still scores this bearish (10/100), with the 200-day (~$72,900) now overhead resistance. The line is $62K: the $61,947 weekend low held Wednesday, and a daily close below $62K opens $58.5K. Reclaim $65K — Wednesday's $65,166 high — and the path back toward the 200-week near $68K opens. Tap $BTC and check which side of $62K–$65K it's closing on. That range decides December.
Not financial advice. DYOR.
Статья
См. перевод
The $2.5T Trade Gap Nobody Posts About — $XDC Sits at $0.029Everyone is watching $ONDO, $LINK and tokenized stocks.
Almost nobody is watching the $2.5 trillion trade-finance gap — and this week, that boring corner of RWA quietly started moving.
Here's what just happened.
On 19 November, Singapore's MAS announced S$100M in tokenized bills settled in wholesale CBDC, with DBS, HSBC, OCBC, UOB and Standard Chartered as dealers. One day earlier, HashKey and Olea moved to tokenize cross-border trade receivables across 70+ corridors.
That's not a roadmap. That's trade finance going on-chain, right now.
So where does $XDC fit?
XDC was built for exactly this market. The Asian Development Bank puts the global trade-finance gap at $2.5 trillion, with SME rejection rates around 41%. Standard Chartered now sees tokenized RWAs reaching $2 trillion by end-2028. Citi's base case is $5.5 trillion by 2030.
XDC has the access pieces: Robinhood US listing in October, MoneyGram as an institutional validator, native USDC, and about $103M in stablecoins on-chain. Honest caveat: roughly half that stablecoin jump came from one synthetic dollar, not organic growth.
Now the uncomfortable part.
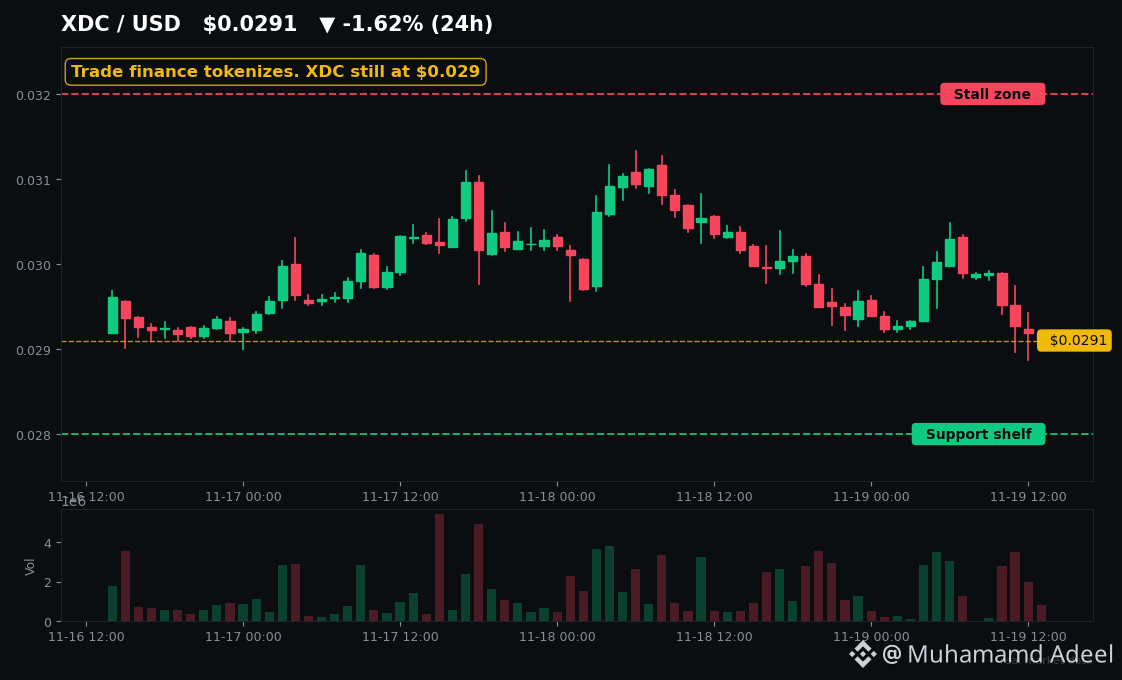
$XDC sits near $0.029 — about 85% below its 2021 high — with a market cap around $580-630M. There was no fresh XDC protocol announcement in the last 24 hours. On-chain DeFi TVL is under $2M and daily chain fees are tiny. The rails exist. The token hasn't captured the value yet.
We've seen this movie before. SBI Japan in 2023: +28% in a day, then fade. October 2026: +8% on the MoneyGram/Robinhood cluster, then about -10% in 30 days. Headlines pop. Sustained flow is still the unproven part.
Compare that with $ONDO, the largest tokenization platform at over $4B. Ondo wins the distributed-value race today. $LINK sells the plumbing to everyone. XDC is the single-chain trade bet — higher torque if trade flow lands, higher risk if it doesn't.
What are traders watching on $XDC?
Support clusters around $0.027-$0.029. Resistance sits near $0.031-$0.033, where price has repeatedly stalled. A clean break above that zone would change the conversation. A loss of $0.027 opens the door lower. Tap $XDC and check whether it's holding that shelf — that's the tell.
The risks are real: uncapped, inflationary supply, only about half the tokens circulating, and holding $XDC is not a claim on trade-finance revenue. Tokenized invoices are credit risk, not T-bills.
Trade finance is the biggest, dullest prize in RWA. The question isn't whether it tokenizes — MAS and HashKey just showed it is. The question is whether $XDC holders ever get paid for it.
Not financial advice. DYOR.
The $2.5T Trade Gap Nobody Posts About — $XDC Sits at $0.029
Everyone is watching $ONDO , $LINK and tokenized stocks.
Almost nobody is watching the $2.5 trillion trade-finance gap — and this week, that boring corner of RWA quietly started moving.
Here's what just happened.
On 19 November, Singapore's MAS announced S$100M in tokenized bills settled in wholesale CBDC, with DBS, HSBC, OCBC, UOB and Standard Chartered as dealers. One day earlier, HashKey and Olea moved to tokenize cross-border trade receivables across 70+ corridors.
That's not a roadmap. That's trade finance going on-chain, right now.
So where does $XDC fit?
XDC was built for exactly this market. The Asian Development Bank puts the global trade-finance gap at $2.5 trillion, with SME rejection rates around 41%. Standard Chartered now sees tokenized RWAs reaching $2 trillion by end-2028. Citi's base case is $5.5 trillion by 2030.
XDC has the access pieces: Robinhood US listing in October, MoneyGram as an institutional validator, native USDC, and about $103M in stablecoins on-chain. Honest caveat: roughly half that stablecoin jump came from one synthetic dollar, not organic growth.
Now the uncomfortable part.
$XDC sits near $0.029 — about 85% below its 2021 high — with a market cap around $580-630M. There was no fresh XDC protocol announcement in the last 24 hours. On-chain DeFi TVL is under $2M and daily chain fees are tiny. The rails exist. The token hasn't captured the value yet.
We've seen this movie before. SBI Japan in 2023: +28% in a day, then fade. October 2026: +8% on the MoneyGram/Robinhood cluster, then about -10% in 30 days. Headlines pop. Sustained flow is still the unproven part.
Compare that with $ONDO , the largest tokenization platform at over $4B. Ondo wins the distributed-value race today. $LINK sells the plumbing to everyone. XDC is the single-chain trade bet — higher torque if trade flow lands, higher risk if it doesn't.
What are traders watching on $XDC?
Support clusters around $0.027-$0.029. Resistance sits near $0.031-$0.033, where price has repeatedly stalled. A clean break above that zone would change the conversation. A loss of $0.027 opens the door lower. Tap $XDC and check whether it's holding that shelf — that's the tell.
The risks are real: uncapped, inflationary supply, only about half the tokens circulating, and holding $XDC is not a claim on trade-finance revenue. Tokenized invoices are credit risk, not T-bills.
Trade finance is the biggest, dullest prize in RWA. The question isn't whether it tokenizes — MAS and HashKey just showed it is. The question is whether $XDC holders ever get paid for it.
Not financial advice. DYOR.
Almost nobody is watching the $2.5 trillion trade-finance gap — and this week, that boring corner of RWA quietly started moving.
Here's what just happened.
On 19 November, Singapore's MAS announced S$100M in tokenized bills settled in wholesale CBDC, with DBS, HSBC, OCBC, UOB and Standard Chartered as dealers. One day earlier, HashKey and Olea moved to tokenize cross-border trade receivables across 70+ corridors.
That's not a roadmap. That's trade finance going on-chain, right now.
So where does $XDC fit?
XDC was built for exactly this market. The Asian Development Bank puts the global trade-finance gap at $2.5 trillion, with SME rejection rates around 41%. Standard Chartered now sees tokenized RWAs reaching $2 trillion by end-2028. Citi's base case is $5.5 trillion by 2030.
XDC has the access pieces: Robinhood US listing in October, MoneyGram as an institutional validator, native USDC, and about $103M in stablecoins on-chain. Honest caveat: roughly half that stablecoin jump came from one synthetic dollar, not organic growth.
Now the uncomfortable part.
$XDC sits near $0.029 — about 85% below its 2021 high — with a market cap around $580-630M. There was no fresh XDC protocol announcement in the last 24 hours. On-chain DeFi TVL is under $2M and daily chain fees are tiny. The rails exist. The token hasn't captured the value yet.
We've seen this movie before. SBI Japan in 2023: +28% in a day, then fade. October 2026: +8% on the MoneyGram/Robinhood cluster, then about -10% in 30 days. Headlines pop. Sustained flow is still the unproven part.
Compare that with $ONDO , the largest tokenization platform at over $4B. Ondo wins the distributed-value race today. $LINK sells the plumbing to everyone. XDC is the single-chain trade bet — higher torque if trade flow lands, higher risk if it doesn't.
What are traders watching on $XDC?
Support clusters around $0.027-$0.029. Resistance sits near $0.031-$0.033, where price has repeatedly stalled. A clean break above that zone would change the conversation. A loss of $0.027 opens the door lower. Tap $XDC and check whether it's holding that shelf — that's the tell.
The risks are real: uncapped, inflationary supply, only about half the tokens circulating, and holding $XDC is not a claim on trade-finance revenue. Tokenized invoices are credit risk, not T-bills.
Trade finance is the biggest, dullest prize in RWA. The question isn't whether it tokenizes — MAS and HashKey just showed it is. The question is whether $XDC holders ever get paid for it.
Not financial advice. DYOR.
6
Статья
IBIT от BlackRock теперь торгуется на Binance круглосуточно — с плечом до 20xУолл-стрит закрывается в 16:00. Ваш бессрочный контракт на IBIT на Binance — никогда.
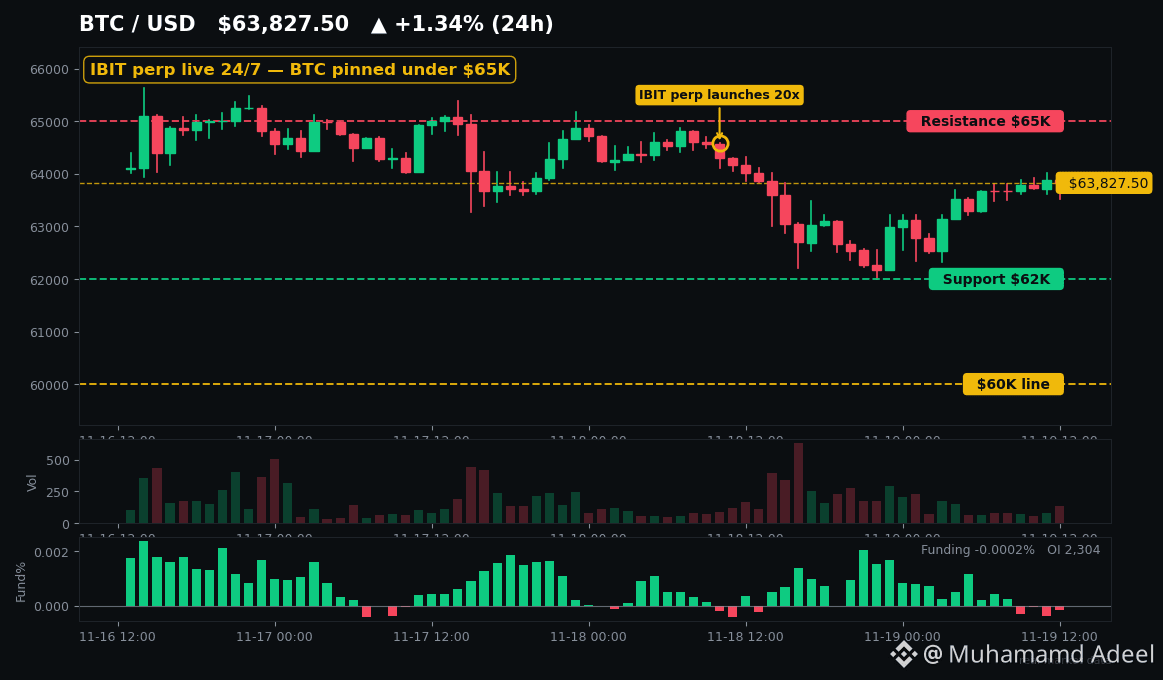
Вчера Binance Futures добавила шесть новых бессрочных контрактов на традиционные финансовые активы — и один из них меняет то, как можно торговать самим биткоином. Торговля IBITUSDT началась 18 ноября в 09:45 UTC: это бессрочный контракт с расчётами в USDT на ETF iShares Bitcoin Trust от BlackRock, доступный круглосуточно и с кредитным плечом до 20x.
Прочитайте это ещё раз. ETF, который торгуется только в часы работы рынков США, теперь обзавёлся кредитным близнецом, торгующим, пока вы спите, когда Nasdaq закрыт, в воскресенье вечером в Нью-Йорке.
Остальные пять в этой группе — SOXX, IGV, ARTY, CCJ и ETN — менее важны. Главная новость — IBIT, потому что IBIT $BTC надел костюм. Нажмите $BTC и проверьте график: биткоин держится около $63,800 — примерно на 23% ниже, чем месяц назад, и примерно на 49% ниже исторического максимума в $126K. Индекс страха и жадности держится на отметке 10 — «Крайний страх» уже семь дней подряд.
IBIT от BlackRock теперь торгуется на Binance круглосуточно — с плечом до 20x
Уолл-стрит закрывается в 16:00. Ваш бессрочный контракт на IBIT на Binance — никогда.
Вчера Binance Futures добавила шесть новых бессрочных контрактов на традиционные финансовые активы — и один из них меняет то, как можно торговать самим биткоином. Торговля IBITUSDT началась 18 ноября в 09:45 UTC: это бессрочный контракт с расчётами в USDT на ETF iShares Bitcoin Trust от BlackRock, доступный круглосуточно и с кредитным плечом до 20x.
Прочитайте это ещё раз. ETF, который торгуется только в часы работы рынков США, теперь обзавёлся кредитным близнецом, торгующим, пока вы спите, когда Nasdaq закрыт, в воскресенье вечером в Нью-Йорке.
Остальные пять в этой группе — SOXX, IGV, ARTY, CCJ и ETN — менее важны. Главная новость — IBIT, потому что IBIT $BTC надел костюм. Нажмите $BTC и проверьте график: биткоин держится около $63,800 — примерно на 23% ниже, чем месяц назад, и примерно на 49% ниже исторического максимума в $126K. Индекс страха и жадности держится на отметке 10 — «Крайний страх» уже семь дней подряд.
Вчера Binance Futures добавила шесть новых бессрочных контрактов на традиционные финансовые активы — и один из них меняет то, как можно торговать самим биткоином. Торговля IBITUSDT началась 18 ноября в 09:45 UTC: это бессрочный контракт с расчётами в USDT на ETF iShares Bitcoin Trust от BlackRock, доступный круглосуточно и с кредитным плечом до 20x.
Прочитайте это ещё раз. ETF, который торгуется только в часы работы рынков США, теперь обзавёлся кредитным близнецом, торгующим, пока вы спите, когда Nasdaq закрыт, в воскресенье вечером в Нью-Йорке.
Остальные пять в этой группе — SOXX, IGV, ARTY, CCJ и ETN — менее важны. Главная новость — IBIT, потому что IBIT $BTC надел костюм. Нажмите $BTC и проверьте график: биткоин держится около $63,800 — примерно на 23% ниже, чем месяц назад, и примерно на 49% ниже исторического максимума в $126K. Индекс страха и жадности держится на отметке 10 — «Крайний страх» уже семь дней подряд.
3
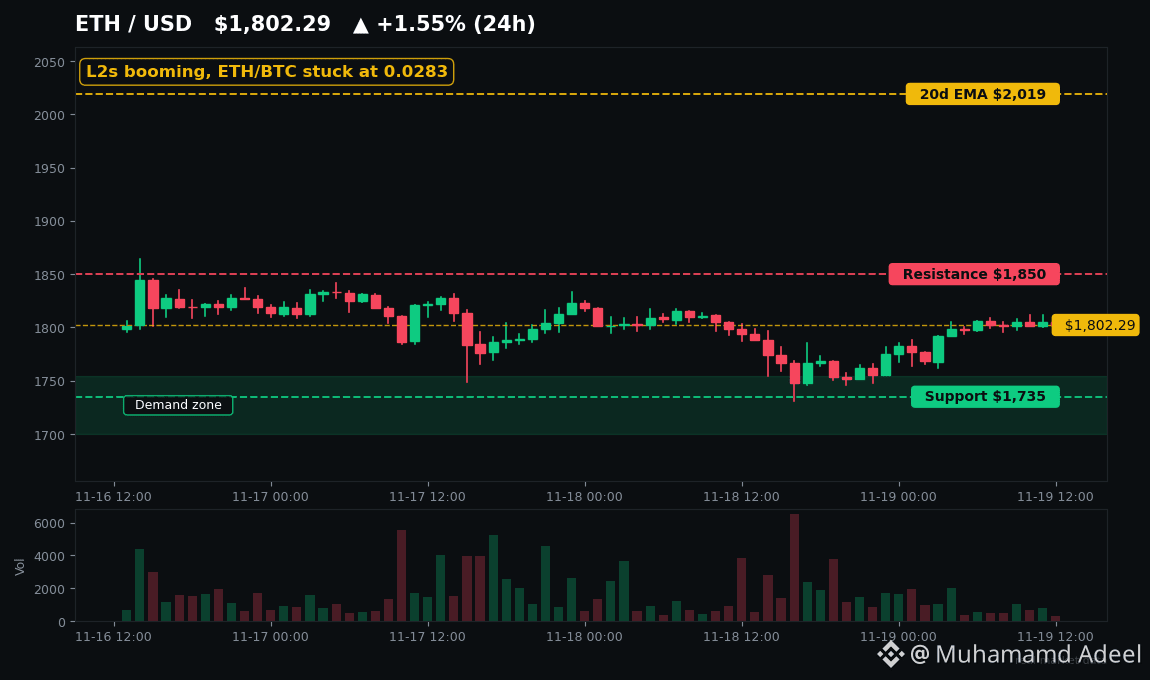
Статья
Base провела 8,6 млн транзакций за день. ETH всё ещё не может догнать BTCСети второго уровня Ethereum никогда не были так загружены. Почему же $ETH по-прежнему уступает биткоину?
Base только что преодолела отметку в 8,6 млн транзакций за день — а ETH/BTC всё ещё держится на уровне 0,028.
Это расхождение сейчас и есть суть происходящего. Экосистема растёт, но токен этого не отражает. А сегодня разработчики Ethereum встречаются, чтобы обсудить обновление, призванное решить проблему масштабирования в этом уравнении.
Обновление на паузе
Glamsterdam должно было повысить лимит газа с 60 млн до примерно 200 млн — в 3,3 раза. Вместо этого форк тестовой сети Hoodi приостановлен с октября, и новой даты пока нет. Сегодня в 14:00 UTC основные разработчики встречаются, чтобы обсудить EIP-8037 и EIP-8038 — пересмотр стоимости газа, лежащий в основе спора.
Base провела 8,6 млн транзакций за день. ETH всё ещё не может догнать BTC
Сети второго уровня Ethereum никогда не были так загружены. Почему же $ETH по-прежнему уступает биткоину?
Base только что преодолела отметку в 8,6 млн транзакций за день — а ETH/BTC всё ещё держится на уровне 0,028.
Это расхождение сейчас и есть суть происходящего. Экосистема растёт, но токен этого не отражает. А сегодня разработчики Ethereum встречаются, чтобы обсудить обновление, призванное решить проблему масштабирования в этом уравнении.
Обновление на паузе
Glamsterdam должно было повысить лимит газа с 60 млн до примерно 200 млн — в 3,3 раза. Вместо этого форк тестовой сети Hoodi приостановлен с октября, и новой даты пока нет. Сегодня в 14:00 UTC основные разработчики встречаются, чтобы обсудить EIP-8037 и EIP-8038 — пересмотр стоимости газа, лежащий в основе спора.
Base только что преодолела отметку в 8,6 млн транзакций за день — а ETH/BTC всё ещё держится на уровне 0,028.
Это расхождение сейчас и есть суть происходящего. Экосистема растёт, но токен этого не отражает. А сегодня разработчики Ethereum встречаются, чтобы обсудить обновление, призванное решить проблему масштабирования в этом уравнении.
Обновление на паузе
Glamsterdam должно было повысить лимит газа с 60 млн до примерно 200 млн — в 3,3 раза. Вместо этого форк тестовой сети Hoodi приостановлен с октября, и новой даты пока нет. Сегодня в 14:00 UTC основные разработчики встречаются, чтобы обсудить EIP-8037 и EIP-8038 — пересмотр стоимости газа, лежащий в основе спора.
7
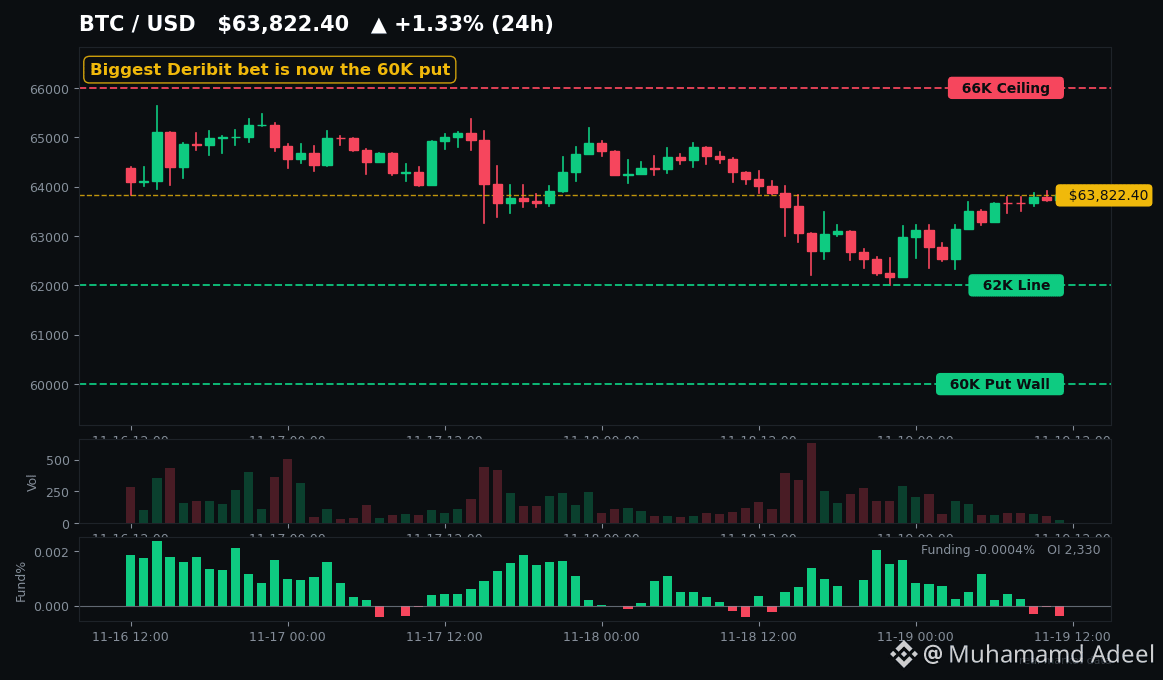
Статья
См. перевод
Bitcoin's Biggest Bet Isn't $100K Anymore — It's a $60K PutThe $100K call just lost its crown.
Deribit's biggest open bet is now a ~$900M put sitting at $60K. Traders aren't paying for a moonshot anymore — they're paying for a floor. Tap $BTC and check how close that floor really is.
**The options market flipped defensive**
On Nov 18, Deribit put skew spiked hard in just four hours, and 5 of the 6 most-traded BTC options were puts — led by the $60K put and the $63K put. Paradigm's EMEA head noted one big player rolling puts down strike by strike: $74K, $72K, $68K, $65K, $63K. That's not panic. That's a hedge being walked down as price falls. $ETH flipped the same way, with $1,700 and $1,800 puts leading volume.
**Retail is long. Whales are not.**
Here's the split that should make you pause. Roughly 73-78% of Binance accounts are long. But the largest Hyperliquid whale wallets tracked today are net short by about $180M — barely 3% long. And those whales still got clipped: six of them were liquidated 30 times today for ~$38.7M as $BTC slid toward $62,055. When the biggest books are short and still getting forced out on bounces, the tape is two-sided and violent.
**Churn, not conviction**
Futures volume jumped 14.5% to $205.3B in 24h, but open interest barely moved. Funding hovers near zero — slightly positive on Binance, slightly negative on Kraken and OKX. Nobody is crowded enough to call this a squeeze setup. Liquidations ran roughly $330-415M in 24h depending on the tracker, still mostly longs. Translation: traders are trading *around* each other, not building a new trend.
**The levels that decide it**
$BTC is bouncing off the $62,000 low at ~$63,800. Below sits the $59.5K-$62.2K liquidation cluster Glassnode flagged, then the $60K put wall. A daily close under $62K is the break scenario to watch. Above, $64,300 is the first ceiling, then $66K. $ETH needs $1,800 to hold; $SOL is clinging to $74-75. Check each cashtag's live chart before you form an opinion — these levels are moving intraday.
**The honest risk**
February 2026 had this exact signature — negative funding, flushed OI, Extreme Fear at 10. It bounced... then retested the lows weeks later. Spot demand is still missing: BTC ETFs lost another $306.5M on Nov 18. A floor built on puts is protection, not a bid.
#Bitcoin #CryptoFutures
Not financial advice. DYOR.
Bitcoin's Biggest Bet Isn't $100K Anymore — It's a $60K Put
The $100K call just lost its crown.
Deribit's biggest open bet is now a ~$900M put sitting at $60K. Traders aren't paying for a moonshot anymore — they're paying for a floor. Tap $BTC and check how close that floor really is.
**The options market flipped defensive**
On Nov 18, Deribit put skew spiked hard in just four hours, and 5 of the 6 most-traded BTC options were puts — led by the $60K put and the $63K put. Paradigm's EMEA head noted one big player rolling puts down strike by strike: $74K, $72K, $68K, $65K, $63K. That's not panic. That's a hedge being walked down as price falls. $ETH flipped the same way, with $1,700 and $1,800 puts leading volume.
**Retail is long. Whales are not.**
Here's the split that should make you pause. Roughly 73-78% of Binance accounts are long. But the largest Hyperliquid whale wallets tracked today are net short by about $180M — barely 3% long. And those whales still got clipped: six of them were liquidated 30 times today for ~$38.7M as $BTC slid toward $62,055. When the biggest books are short and still getting forced out on bounces, the tape is two-sided and violent.
**Churn, not conviction**
Futures volume jumped 14.5% to $205.3B in 24h, but open interest barely moved. Funding hovers near zero — slightly positive on Binance, slightly negative on Kraken and OKX. Nobody is crowded enough to call this a squeeze setup. Liquidations ran roughly $330-415M in 24h depending on the tracker, still mostly longs. Translation: traders are trading *around* each other, not building a new trend.
**The levels that decide it**
$BTC is bouncing off the $62,000 low at ~$63,800. Below sits the $59.5K-$62.2K liquidation cluster Glassnode flagged, then the $60K put wall. A daily close under $62K is the break scenario to watch. Above, $64,300 is the first ceiling, then $66K. $ETH needs $1,800 to hold; $SOL is clinging to $74-75. Check each cashtag's live chart before you form an opinion — these levels are moving intraday.
**The honest risk**
February 2026 had this exact signature — negative funding, flushed OI, Extreme Fear at 10. It bounced... then retested the lows weeks later. Spot demand is still missing: BTC ETFs lost another $306.5M on Nov 18. A floor built on puts is protection, not a bid.
#Bitcoin #CryptoFutures
Not financial advice. DYOR.
Deribit's biggest open bet is now a ~$900M put sitting at $60K. Traders aren't paying for a moonshot anymore — they're paying for a floor. Tap $BTC and check how close that floor really is.
**The options market flipped defensive**
On Nov 18, Deribit put skew spiked hard in just four hours, and 5 of the 6 most-traded BTC options were puts — led by the $60K put and the $63K put. Paradigm's EMEA head noted one big player rolling puts down strike by strike: $74K, $72K, $68K, $65K, $63K. That's not panic. That's a hedge being walked down as price falls. $ETH flipped the same way, with $1,700 and $1,800 puts leading volume.
**Retail is long. Whales are not.**
Here's the split that should make you pause. Roughly 73-78% of Binance accounts are long. But the largest Hyperliquid whale wallets tracked today are net short by about $180M — barely 3% long. And those whales still got clipped: six of them were liquidated 30 times today for ~$38.7M as $BTC slid toward $62,055. When the biggest books are short and still getting forced out on bounces, the tape is two-sided and violent.
**Churn, not conviction**
Futures volume jumped 14.5% to $205.3B in 24h, but open interest barely moved. Funding hovers near zero — slightly positive on Binance, slightly negative on Kraken and OKX. Nobody is crowded enough to call this a squeeze setup. Liquidations ran roughly $330-415M in 24h depending on the tracker, still mostly longs. Translation: traders are trading *around* each other, not building a new trend.
**The levels that decide it**
$BTC is bouncing off the $62,000 low at ~$63,800. Below sits the $59.5K-$62.2K liquidation cluster Glassnode flagged, then the $60K put wall. A daily close under $62K is the break scenario to watch. Above, $64,300 is the first ceiling, then $66K. $ETH needs $1,800 to hold; $SOL is clinging to $74-75. Check each cashtag's live chart before you form an opinion — these levels are moving intraday.
**The honest risk**
February 2026 had this exact signature — negative funding, flushed OI, Extreme Fear at 10. It bounced... then retested the lows weeks later. Spot demand is still missing: BTC ETFs lost another $306.5M on Nov 18. A floor built on puts is protection, not a bid.
#Bitcoin #CryptoFutures
Not financial advice. DYOR.
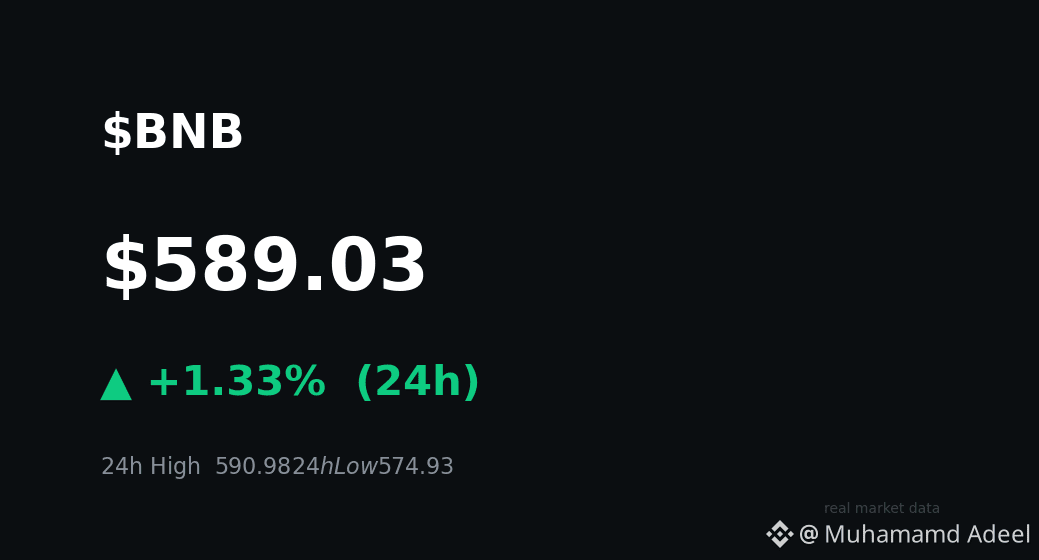
Статья
Anthropic только что появилась в сети BNB. $BNB даже не дрогнулСегодня Anthropic выходит на биржу — а её акции уже торгуются в сети BNB, хотя большинство брокеров ещё даже не открылось.
Тем временем $BNB стоит $589 — на 57% ниже исторического максимума, а настроения на рынке достигли уровня «крайний страх». Одна из этих двух картин обманчива. Давайте разберёмся.
**Что только что произошло**
Anthropic установила цену IPO на уровне $83 за акцию — выше диапазона $70–$78 — и сегодня (19 ноября) выходит на Nasdaq под тикером ANT. CZ подтвердил, что токенизированные активы, привязанные к Anthropic, стали доступны в первый же день в сети BNB через bStocks, Ondo и xStocks. На такой сигнал спроса трудно не обратить внимание: предлистинговая подписка в Binance Wallet достигла лимита в 500 миллионов USDC всего за несколько часов 18 ноября, и её закрыли досрочно.
Anthropic только что появилась в сети BNB. $BNB даже не дрогнул
Сегодня Anthropic выходит на биржу — а её акции уже торгуются в сети BNB, хотя большинство брокеров ещё даже не открылось.
Тем временем $BNB стоит $589 — на 57% ниже исторического максимума, а настроения на рынке достигли уровня «крайний страх». Одна из этих двух картин обманчива. Давайте разберёмся.
**Что только что произошло**
Anthropic установила цену IPO на уровне $83 за акцию — выше диапазона $70–$78 — и сегодня (19 ноября) выходит на Nasdaq под тикером ANT. CZ подтвердил, что токенизированные активы, привязанные к Anthropic, стали доступны в первый же день в сети BNB через bStocks, Ondo и xStocks. На такой сигнал спроса трудно не обратить внимание: предлистинговая подписка в Binance Wallet достигла лимита в 500 миллионов USDC всего за несколько часов 18 ноября, и её закрыли досрочно.
Тем временем $BNB стоит $589 — на 57% ниже исторического максимума, а настроения на рынке достигли уровня «крайний страх». Одна из этих двух картин обманчива. Давайте разберёмся.
**Что только что произошло**
Anthropic установила цену IPO на уровне $83 за акцию — выше диапазона $70–$78 — и сегодня (19 ноября) выходит на Nasdaq под тикером ANT. CZ подтвердил, что токенизированные активы, привязанные к Anthropic, стали доступны в первый же день в сети BNB через bStocks, Ondo и xStocks. На такой сигнал спроса трудно не обратить внимание: предлистинговая подписка в Binance Wallet достигла лимита в 500 миллионов USDC всего за несколько часов 18 ноября, и её закрыли досрочно.
10
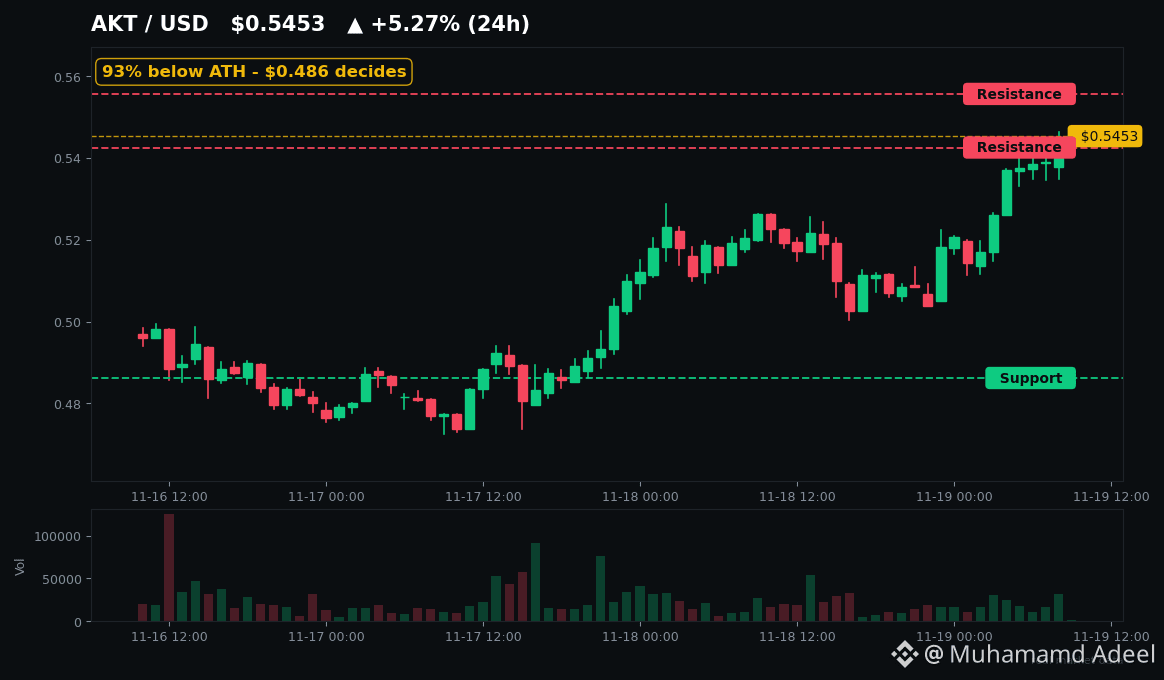
Статья
См. перевод
The $8 AI Coin at $0.54 — Dead, or Just Early?In April 2021, $AKT touched $8.07. Today it's trading around $0.54 — 93.6% below that high.
Here's the twist: right now, $AKT is the strongest of the big AI names. Up ~5% in 24 hours while $TAO and RENDER sit flat and FET bleeds red. And this is happening while $BTC is pinned near $63K and Fear & Greed just printed 10 — Extreme Fear, seven days straight. In this tape, that's not nothing.
So why is the "Airbnb for GPUs" catching a bid?
Two catalysts landed this week. On Nov 17 at Solana Breakpoint, Akash unveiled Akash Forwards: commodity-style forward contracts for future GPU capacity — 8-GPU NVIDIA B300 node-months at a fixed price, settled by actually delivering the compute. Think futures, but for AI hardware. Pilot starts Q1 2027, public launch targeted Q2 2027. Nothing trades yet — this is a market design, not live revenue.
Same week, the one-way migration portal from Cosmos to Solana opened (Nov 12). Only ~1.8M AKT — 0.6% of supply — crossed on day one, and the compute marketplace itself still runs on Cosmos. A separate vote decides the cutover.
And the macro wind: Nvidia's latest quarter printed $115.8B in revenue, up 103% year over year. When the GPU king posts numbers like that, every decentralized-compute token gets a second look.
Now the levels that actually matter. Tap $AKT and look at the daily chart with me:
Support: $0.502, then the real line at $0.486
Resistance: $0.543 (just reclaimed) and $0.556 overhead
Trend averages sit at $0.61-$0.65 — price is below all of them
Daily RSI is ~39 — washed out, but not capitulation. Hourly RSI is already ~72, meaning this bounce is stretched right into resistance. A daily close above $0.556 opens the conversation toward that $0.61-$0.65 zone. Lose $0.486 and the bounce thesis is done.
History check: AKT has done this before. Its violent bounces — May 2023's GPU testnet run, the Nov 2024 Binance Futures listing (+35% in a day) — all needed a fresh catalyst, and all stalled at prior resistance. Oversold alone only bought +13-20% range bounces.
Now the honest bear case, because 93% down doesn't mean cheap. Real lease revenue was $253K last quarter, down 45% QoQ. The network does roughly $8-10K/day in compute spend with ~200 GPUs leased and 52-57 providers — a record low. Inflation runs at 4%, and the Burn-Mint Equilibrium mechanism hyped in March still shows zero net permanent burn. Staking yield roughly equals inflation — you're diluted to stand still.
My take: $AKT is a real network with a genuinely interesting idea — forward markets for GPU compute — priced like it's dying, in a market pricing everything like it's dying. The bounce is real. The business is tiny. Both things are true.
Does $AKT hold $0.486 and push through $0.556 — or is this another dead-cat bounce into resistance? Drop your number below.
#AI #DePIN
Not financial advice. DYOR.
The $8 AI Coin at $0.54 — Dead, or Just Early?
In April 2021, $AKT touched $8.07. Today it's trading around $0.54 — 93.6% below that high.
Here's the twist: right now, $AKT is the strongest of the big AI names. Up ~5% in 24 hours while $TAO and RENDER sit flat and FET bleeds red. And this is happening while $BTC is pinned near $63K and Fear & Greed just printed 10 — Extreme Fear, seven days straight. In this tape, that's not nothing.
So why is the "Airbnb for GPUs" catching a bid?
Two catalysts landed this week. On Nov 17 at Solana Breakpoint, Akash unveiled Akash Forwards: commodity-style forward contracts for future GPU capacity — 8-GPU NVIDIA B300 node-months at a fixed price, settled by actually delivering the compute. Think futures, but for AI hardware. Pilot starts Q1 2027, public launch targeted Q2 2027. Nothing trades yet — this is a market design, not live revenue.
Same week, the one-way migration portal from Cosmos to Solana opened (Nov 12). Only ~1.8M AKT — 0.6% of supply — crossed on day one, and the compute marketplace itself still runs on Cosmos. A separate vote decides the cutover.
And the macro wind: Nvidia's latest quarter printed $115.8B in revenue, up 103% year over year. When the GPU king posts numbers like that, every decentralized-compute token gets a second look.
Now the levels that actually matter. Tap $AKT and look at the daily chart with me:
Support: $0.502, then the real line at $0.486
Resistance: $0.543 (just reclaimed) and $0.556 overhead
Trend averages sit at $0.61-$0.65 — price is below all of them
Daily RSI is ~39 — washed out, but not capitulation. Hourly RSI is already ~72, meaning this bounce is stretched right into resistance. A daily close above $0.556 opens the conversation toward that $0.61-$0.65 zone. Lose $0.486 and the bounce thesis is done.
History check: AKT has done this before. Its violent bounces — May 2023's GPU testnet run, the Nov 2024 Binance Futures listing (+35% in a day) — all needed a fresh catalyst, and all stalled at prior resistance. Oversold alone only bought +13-20% range bounces.
Now the honest bear case, because 93% down doesn't mean cheap. Real lease revenue was $253K last quarter, down 45% QoQ. The network does roughly $8-10K/day in compute spend with ~200 GPUs leased and 52-57 providers — a record low. Inflation runs at 4%, and the Burn-Mint Equilibrium mechanism hyped in March still shows zero net permanent burn. Staking yield roughly equals inflation — you're diluted to stand still.
My take: $AKT is a real network with a genuinely interesting idea — forward markets for GPU compute — priced like it's dying, in a market pricing everything like it's dying. The bounce is real. The business is tiny. Both things are true.
Does $AKT hold $0.486 and push through $0.556 — or is this another dead-cat bounce into resistance? Drop your number below.
#AI #DePIN
Not financial advice. DYOR.
Here's the twist: right now, $AKT is the strongest of the big AI names. Up ~5% in 24 hours while $TAO and RENDER sit flat and FET bleeds red. And this is happening while $BTC is pinned near $63K and Fear & Greed just printed 10 — Extreme Fear, seven days straight. In this tape, that's not nothing.
So why is the "Airbnb for GPUs" catching a bid?
Two catalysts landed this week. On Nov 17 at Solana Breakpoint, Akash unveiled Akash Forwards: commodity-style forward contracts for future GPU capacity — 8-GPU NVIDIA B300 node-months at a fixed price, settled by actually delivering the compute. Think futures, but for AI hardware. Pilot starts Q1 2027, public launch targeted Q2 2027. Nothing trades yet — this is a market design, not live revenue.
Same week, the one-way migration portal from Cosmos to Solana opened (Nov 12). Only ~1.8M AKT — 0.6% of supply — crossed on day one, and the compute marketplace itself still runs on Cosmos. A separate vote decides the cutover.
And the macro wind: Nvidia's latest quarter printed $115.8B in revenue, up 103% year over year. When the GPU king posts numbers like that, every decentralized-compute token gets a second look.
Now the levels that actually matter. Tap $AKT and look at the daily chart with me:
Support: $0.502, then the real line at $0.486
Resistance: $0.543 (just reclaimed) and $0.556 overhead
Trend averages sit at $0.61-$0.65 — price is below all of them
Daily RSI is ~39 — washed out, but not capitulation. Hourly RSI is already ~72, meaning this bounce is stretched right into resistance. A daily close above $0.556 opens the conversation toward that $0.61-$0.65 zone. Lose $0.486 and the bounce thesis is done.
History check: AKT has done this before. Its violent bounces — May 2023's GPU testnet run, the Nov 2024 Binance Futures listing (+35% in a day) — all needed a fresh catalyst, and all stalled at prior resistance. Oversold alone only bought +13-20% range bounces.
Now the honest bear case, because 93% down doesn't mean cheap. Real lease revenue was $253K last quarter, down 45% QoQ. The network does roughly $8-10K/day in compute spend with ~200 GPUs leased and 52-57 providers — a record low. Inflation runs at 4%, and the Burn-Mint Equilibrium mechanism hyped in March still shows zero net permanent burn. Staking yield roughly equals inflation — you're diluted to stand still.
My take: $AKT is a real network with a genuinely interesting idea — forward markets for GPU compute — priced like it's dying, in a market pricing everything like it's dying. The bounce is real. The business is tiny. Both things are true.
Does $AKT hold $0.486 and push through $0.556 — or is this another dead-cat bounce into resistance? Drop your number below.
#AI #DePIN
Not financial advice. DYOR.
1
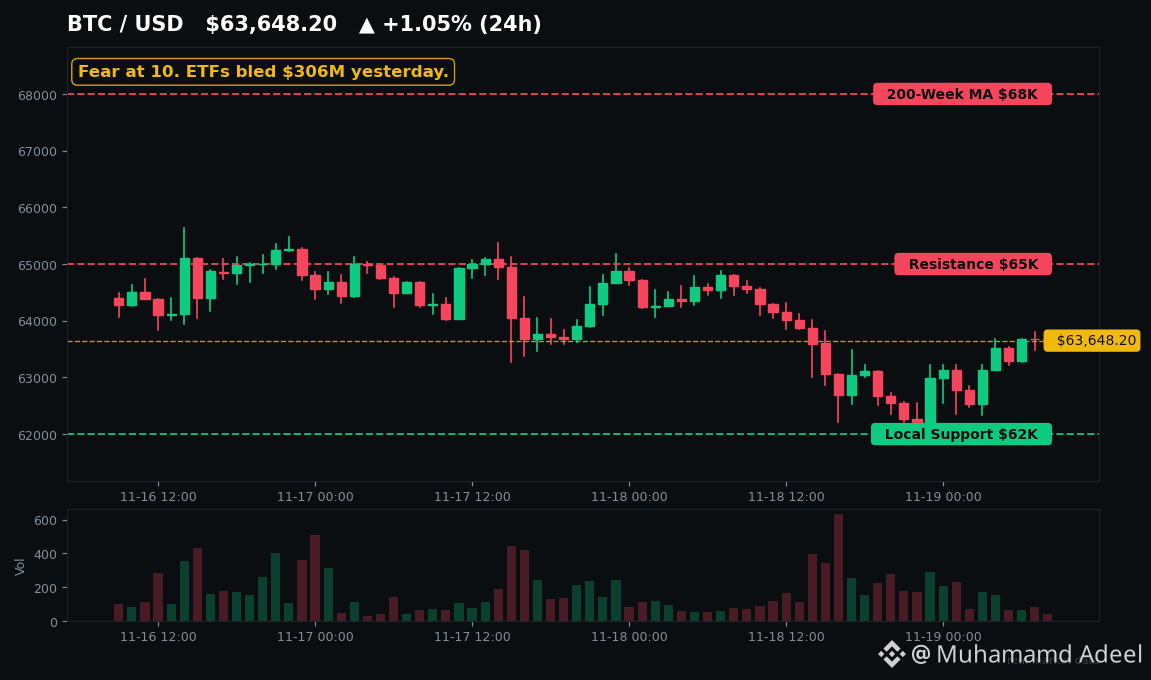
Статья
Binance добилась судебного решения на $6,3 млрд — пока BTC падает до $63KБиткоин упал на 50% от своего исторического максимума. А вчера главная новость в криптомире была не о цене — она пришла из зала суда в Абу-Даби.
Вот что на самом деле произошло за последние 24 часа — и какой один уровень определит всё дальнейшее.
**1. Binance добилась судебного решения на $6,3 млрд**
18 ноября Суд глобального рынка Абу-Даби вынес в отношении Binance судебный запрет на распоряжение активами по всему миру из-за хищения примерно $6,3 млрд из кошельков под управлением Binance 29 октября, которое приписывают Северной Корее. Восемнадцать названных компаний, включая Circle и World Liberty Financial, обязаны сохранять заморозку активов, хотя ни одну из них не обвиняют в неправомерных действиях. Третьим сторонам уже удалось заморозить или перехватить около $2,85 млрд. Следующее слушание назначено на 1 декабря.
Binance добилась судебного решения на $6,3 млрд — пока BTC падает до $63K
Биткоин упал на 50% от своего исторического максимума. А вчера главная новость в криптомире была не о цене — она пришла из зала суда в Абу-Даби.
Вот что на самом деле произошло за последние 24 часа — и какой один уровень определит всё дальнейшее.
**1. Binance добилась судебного решения на $6,3 млрд**
18 ноября Суд глобального рынка Абу-Даби вынес в отношении Binance судебный запрет на распоряжение активами по всему миру из-за хищения примерно $6,3 млрд из кошельков под управлением Binance 29 октября, которое приписывают Северной Корее. Восемнадцать названных компаний, включая Circle и World Liberty Financial, обязаны сохранять заморозку активов, хотя ни одну из них не обвиняют в неправомерных действиях. Третьим сторонам уже удалось заморозить или перехватить около $2,85 млрд. Следующее слушание назначено на 1 декабря.
Вот что на самом деле произошло за последние 24 часа — и какой один уровень определит всё дальнейшее.
**1. Binance добилась судебного решения на $6,3 млрд**
18 ноября Суд глобального рынка Абу-Даби вынес в отношении Binance судебный запрет на распоряжение активами по всему миру из-за хищения примерно $6,3 млрд из кошельков под управлением Binance 29 октября, которое приписывают Северной Корее. Восемнадцать названных компаний, включая Circle и World Liberty Financial, обязаны сохранять заморозку активов, хотя ни одну из них не обвиняют в неправомерных действиях. Третьим сторонам уже удалось заморозить или перехватить около $2,85 млрд. Следующее слушание назначено на 1 декабря.
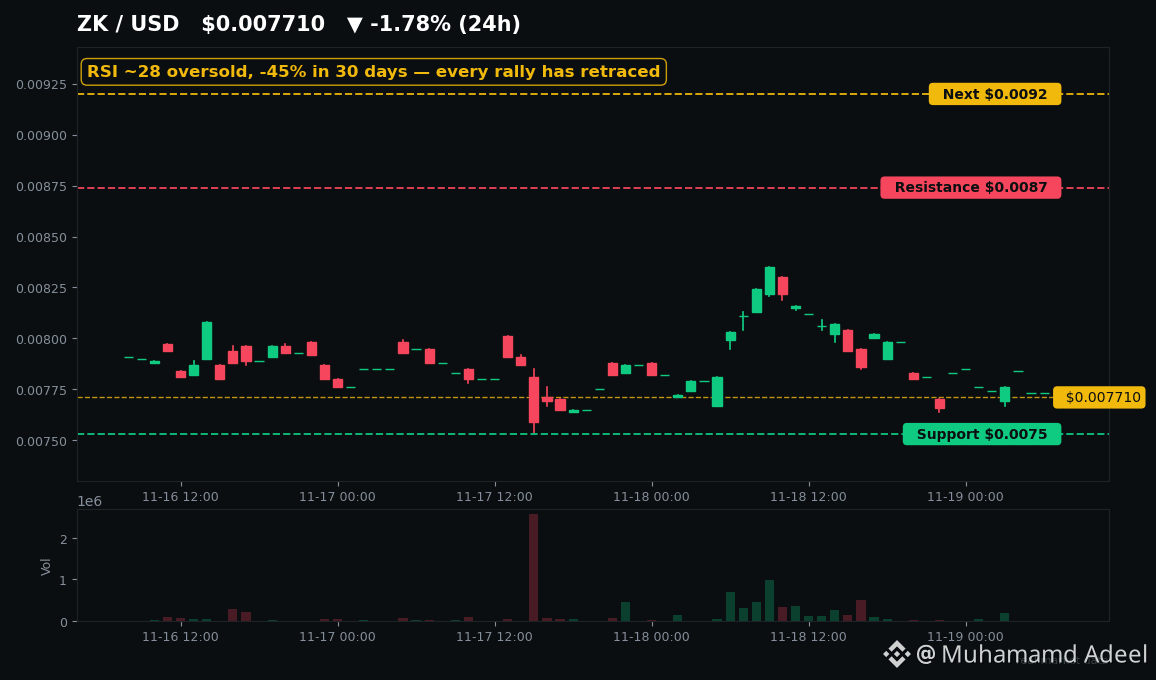
Статья
См. перевод
ZK Is 97% Below ATH — But the Tech Story Just Got Louder$ZK is trading at $0.0077.
That's 97.6% below its all-time high — and barely 9% above its all-time low.
One of $ETH's flagship ZK-rollups is priced like a dead coin. Yet this month, the team has been building for banks, not retail.
So which is lying — the price, or the story?
THE STORY GOT LOUDER THIS MONTH
On 10 November, zkSync launched Prividium Connect — private cross-chain settlement built for banks and asset managers. Three days later, co-founder Alex Gluchowski rewrote the tokenomics pitch: enterprise licensing fees are out, but a "Fee Flow" system could convert interoperability fees into $ZK demand.
Then came the integrations. LCX added zkSync swaps to its Liberty DEX on 16 November, and Xsolla ZK went live for game commerce on 18 November.
On paper, this is the institutional L2 play. In practice? The market yawned.
THE PRICE TELLS A DIFFERENT STORY
$ZK is down 45% in 30 days. The 14-day RSI sits near 28 — deep oversold. And every moving average still screams sell.
The levels that matter now:
Support: $0.0075 — lose it and the all-time low at $0.0071 is next.
Resistance: $0.0087, then $0.0092.
A break above $0.0087 with volume would be the first sign the sellers are tired. Until then, this is a falling knife with a good story attached.
HISTORY HAS SEEN THIS MOVIE BEFORE
This isn't the first time $ZK has sat at the bottom with a loud narrative. In August, it bounced 49% off this same all-time-low zone in two weeks — then ran 161% to $0.0186 in October. Then it gave the whole move back.
And in November 2025, Vitalik called the Atlas upgrade "underrated and valuable." $ZK spiked 120% in a day. Ten months later, it had retraced 98% of that move.
Every $ZK narrative spike has fully retraced. That's the pattern you have to respect.
THE HONEST RISKS
Three things keep me cautious. First, around 173 million $ZK unlocks to investors and team every month until June 2028 — the next one lands 17 December. Second, no fee capture is live yet: the Fee Flow idea still needs governance approval. Third, zkSync Era's DeFi TVL is just $10.8 million — a 12-month low — while Base secures billions. The chain is being used, but the capital isn't staying.
For context, rival L2s like $ARB trade with far deeper liquidity and activity — $ZK is the high-beta, high-risk end of the L2 trade.
BOTTOM LINE
$ZK is a bet on a gap: world-class ZK tech priced at all-time-low territory, against a token with no live value capture and a monthly unlock drip. If the $0.0075 support holds and $0.0087 breaks, the setup flips fast — this zone has bounced hard twice before. If support fails, there's no floor underneath.
Check the $ZK chart before you decide — the next break above resistance changes the whole setup.
Not financial advice. DYOR.
ZK Is 97% Below ATH — But the Tech Story Just Got Louder
$ZK is trading at $0.0077.
That's 97.6% below its all-time high — and barely 9% above its all-time low.
One of $ETH 's flagship ZK-rollups is priced like a dead coin. Yet this month, the team has been building for banks, not retail.
So which is lying — the price, or the story?
THE STORY GOT LOUDER THIS MONTH
On 10 November, zkSync launched Prividium Connect — private cross-chain settlement built for banks and asset managers. Three days later, co-founder Alex Gluchowski rewrote the tokenomics pitch: enterprise licensing fees are out, but a "Fee Flow" system could convert interoperability fees into $ZK demand.
Then came the integrations. LCX added zkSync swaps to its Liberty DEX on 16 November, and Xsolla ZK went live for game commerce on 18 November.
On paper, this is the institutional L2 play. In practice? The market yawned.
THE PRICE TELLS A DIFFERENT STORY
$ZK is down 45% in 30 days. The 14-day RSI sits near 28 — deep oversold. And every moving average still screams sell.
The levels that matter now:
Support: $0.0075 — lose it and the all-time low at $0.0071 is next.
Resistance: $0.0087, then $0.0092.
A break above $0.0087 with volume would be the first sign the sellers are tired. Until then, this is a falling knife with a good story attached.
HISTORY HAS SEEN THIS MOVIE BEFORE
This isn't the first time $ZK has sat at the bottom with a loud narrative. In August, it bounced 49% off this same all-time-low zone in two weeks — then ran 161% to $0.0186 in October. Then it gave the whole move back.
And in November 2025, Vitalik called the Atlas upgrade "underrated and valuable." $ZK spiked 120% in a day. Ten months later, it had retraced 98% of that move.
Every $ZK narrative spike has fully retraced. That's the pattern you have to respect.
THE HONEST RISKS
Three things keep me cautious. First, around 173 million $ZK unlocks to investors and team every month until June 2028 — the next one lands 17 December. Second, no fee capture is live yet: the Fee Flow idea still needs governance approval. Third, zkSync Era's DeFi TVL is just $10.8 million — a 12-month low — while Base secures billions. The chain is being used, but the capital isn't staying.
For context, rival L2s like $ARB trade with far deeper liquidity and activity — $ZK is the high-beta, high-risk end of the L2 trade.
BOTTOM LINE
$ZK is a bet on a gap: world-class ZK tech priced at all-time-low territory, against a token with no live value capture and a monthly unlock drip. If the $0.0075 support holds and $0.0087 breaks, the setup flips fast — this zone has bounced hard twice before. If support fails, there's no floor underneath.
Check the $ZK chart before you decide — the next break above resistance changes the whole setup.
Not financial advice. DYOR.
That's 97.6% below its all-time high — and barely 9% above its all-time low.
One of $ETH 's flagship ZK-rollups is priced like a dead coin. Yet this month, the team has been building for banks, not retail.
So which is lying — the price, or the story?
THE STORY GOT LOUDER THIS MONTH
On 10 November, zkSync launched Prividium Connect — private cross-chain settlement built for banks and asset managers. Three days later, co-founder Alex Gluchowski rewrote the tokenomics pitch: enterprise licensing fees are out, but a "Fee Flow" system could convert interoperability fees into $ZK demand.
Then came the integrations. LCX added zkSync swaps to its Liberty DEX on 16 November, and Xsolla ZK went live for game commerce on 18 November.
On paper, this is the institutional L2 play. In practice? The market yawned.
THE PRICE TELLS A DIFFERENT STORY
$ZK is down 45% in 30 days. The 14-day RSI sits near 28 — deep oversold. And every moving average still screams sell.
The levels that matter now:
Support: $0.0075 — lose it and the all-time low at $0.0071 is next.
Resistance: $0.0087, then $0.0092.
A break above $0.0087 with volume would be the first sign the sellers are tired. Until then, this is a falling knife with a good story attached.
HISTORY HAS SEEN THIS MOVIE BEFORE
This isn't the first time $ZK has sat at the bottom with a loud narrative. In August, it bounced 49% off this same all-time-low zone in two weeks — then ran 161% to $0.0186 in October. Then it gave the whole move back.
And in November 2025, Vitalik called the Atlas upgrade "underrated and valuable." $ZK spiked 120% in a day. Ten months later, it had retraced 98% of that move.
Every $ZK narrative spike has fully retraced. That's the pattern you have to respect.
THE HONEST RISKS
Three things keep me cautious. First, around 173 million $ZK unlocks to investors and team every month until June 2028 — the next one lands 17 December. Second, no fee capture is live yet: the Fee Flow idea still needs governance approval. Third, zkSync Era's DeFi TVL is just $10.8 million — a 12-month low — while Base secures billions. The chain is being used, but the capital isn't staying.
For context, rival L2s like $ARB trade with far deeper liquidity and activity — $ZK is the high-beta, high-risk end of the L2 trade.
BOTTOM LINE
$ZK is a bet on a gap: world-class ZK tech priced at all-time-low territory, against a token with no live value capture and a monthly unlock drip. If the $0.0075 support holds and $0.0087 breaks, the setup flips fast — this zone has bounced hard twice before. If support fails, there's no floor underneath.
Check the $ZK chart before you decide — the next break above resistance changes the whole setup.
Not financial advice. DYOR.
6
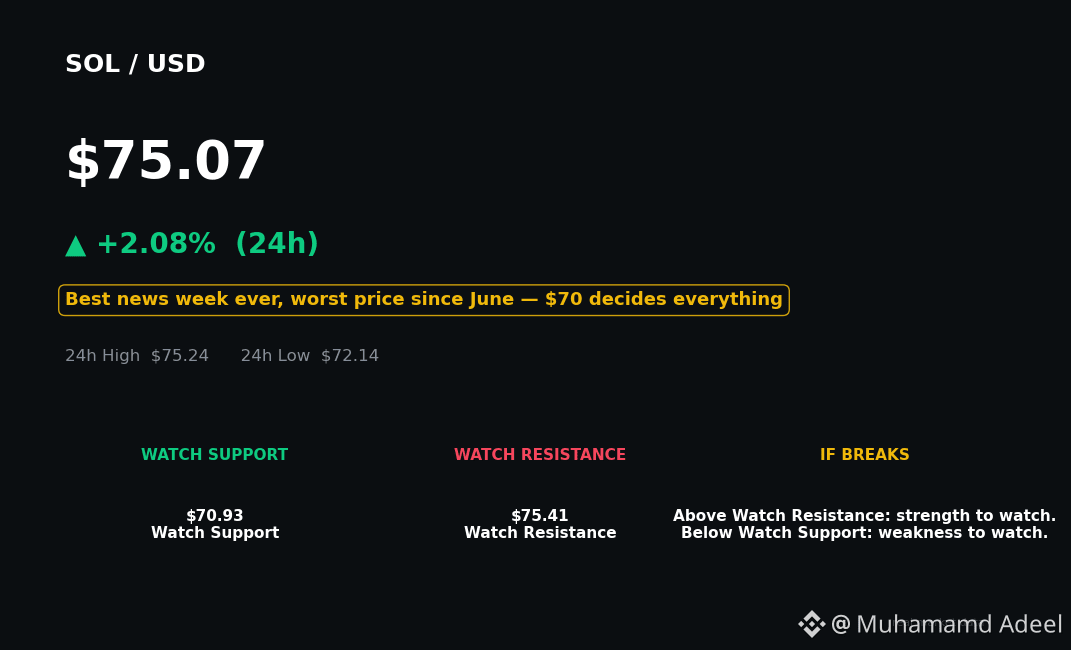
Статья
См. перевод
SOL Just Dropped Its 'Beta' Label — But $70 Decides EverythingSolana just had the best news week of its life. The price just hit its lowest level since June.
Read that again. In the same week the Solana Foundation dropped the "Mainnet Beta" label after six years, Zelle picked Solana for its new dollar stablecoin, and the Foundation took a majority stake in CoinGecko — $SOL fell to $67.41, down 30% in 30 days.
This is the contradiction every trader on Square is arguing about right now. And honestly? Both sides have a point.
Here's the bull case, and it's real. Solana 1.0 is not a rebrand — it removes the last institutional excuse for ignoring the chain. Zelle's ZelleUSD, built for international payments, chose Solana. DTCC plans to connect its tokenization service to Solana in the second half of 2027. The network is maturing in front of our eyes while the token bleeds. That's exactly the kind of divergence that has marked Solana bottoms before — in April 2025, SOL crashed 62% from its all-time high to $95, then ripped 132% in six months.
But here's the part the bulls don't want to hear. The sellers are not imaginary. Whales deposited over $150 million of SOL to exchanges in ten days. Pump.fun has now sold roughly 5.6 million SOL — about $888 million — since early 2024. US spot SOL ETFs bled for six straight weeks before a single $10.8 million inflow day on 16 November. And the memecoin revenue engine that powered Solana's 2025 is down roughly 87% year over year. Oversold does not mean bottom — SOL's RSI is in the 20s, and it was in the 20s last week too.
So what actually decides this? One number: $70.
SOL is trading around $73–$75 right now, bouncing off that $67 low. Check the $SOL chart and you'll see it — $70 to $72 is the floor that has held twice, in June and again this week. Hold it, and the relief-bounce crowd gets its shot at $75, then $80, the level analysts keep naming as the real test. Lose it on a daily close, and $67 opens up, then $60 — the June low that nobody wants to revisit.
$BTC decides the weather here, as always. If Bitcoin holds its $62K–$65K range, SOL gets room to breathe. If Bitcoin breaks down, no amount of Breakpoint good news saves a high-beta altcoin. And $ETH is the quiet comparison worth watching: Solana now trades at a fraction of the valuation-per-fee that Ethereum commands, which is either a bargain or a warning, depending on whether you believe fees follow the chain or the apps on it.
My take? This is a "show me" market. The news is genuinely the best Solana has ever had. The price is genuinely the worst it has been in five months. One of those two stories is wrong — and $70 is where we'll find out which one.
Watch the level. Not the headlines.
Not financial advice. DYOR.
SOL Just Dropped Its 'Beta' Label — But $70 Decides Everything
Solana just had the best news week of its life. The price just hit its lowest level since June.
Read that again. In the same week the Solana Foundation dropped the "Mainnet Beta" label after six years, Zelle picked Solana for its new dollar stablecoin, and the Foundation took a majority stake in CoinGecko — $SOL fell to $67.41, down 30% in 30 days.
This is the contradiction every trader on Square is arguing about right now. And honestly? Both sides have a point.
Here's the bull case, and it's real. Solana 1.0 is not a rebrand — it removes the last institutional excuse for ignoring the chain. Zelle's ZelleUSD, built for international payments, chose Solana. DTCC plans to connect its tokenization service to Solana in the second half of 2027. The network is maturing in front of our eyes while the token bleeds. That's exactly the kind of divergence that has marked Solana bottoms before — in April 2025, SOL crashed 62% from its all-time high to $95, then ripped 132% in six months.
But here's the part the bulls don't want to hear. The sellers are not imaginary. Whales deposited over $150 million of SOL to exchanges in ten days. Pump.fun has now sold roughly 5.6 million SOL — about $888 million — since early 2024. US spot SOL ETFs bled for six straight weeks before a single $10.8 million inflow day on 16 November. And the memecoin revenue engine that powered Solana's 2025 is down roughly 87% year over year. Oversold does not mean bottom — SOL's RSI is in the 20s, and it was in the 20s last week too.
So what actually decides this? One number: $70.
SOL is trading around $73–$75 right now, bouncing off that $67 low. Check the $SOL chart and you'll see it — $70 to $72 is the floor that has held twice, in June and again this week. Hold it, and the relief-bounce crowd gets its shot at $75, then $80, the level analysts keep naming as the real test. Lose it on a daily close, and $67 opens up, then $60 — the June low that nobody wants to revisit.
$BTC decides the weather here, as always. If Bitcoin holds its $62K–$65K range, SOL gets room to breathe. If Bitcoin breaks down, no amount of Breakpoint good news saves a high-beta altcoin. And $ETH is the quiet comparison worth watching: Solana now trades at a fraction of the valuation-per-fee that Ethereum commands, which is either a bargain or a warning, depending on whether you believe fees follow the chain or the apps on it.
My take? This is a "show me" market. The news is genuinely the best Solana has ever had. The price is genuinely the worst it has been in five months. One of those two stories is wrong — and $70 is where we'll find out which one.
Watch the level. Not the headlines.
Not financial advice. DYOR.
Read that again. In the same week the Solana Foundation dropped the "Mainnet Beta" label after six years, Zelle picked Solana for its new dollar stablecoin, and the Foundation took a majority stake in CoinGecko — $SOL fell to $67.41, down 30% in 30 days.
This is the contradiction every trader on Square is arguing about right now. And honestly? Both sides have a point.
Here's the bull case, and it's real. Solana 1.0 is not a rebrand — it removes the last institutional excuse for ignoring the chain. Zelle's ZelleUSD, built for international payments, chose Solana. DTCC plans to connect its tokenization service to Solana in the second half of 2027. The network is maturing in front of our eyes while the token bleeds. That's exactly the kind of divergence that has marked Solana bottoms before — in April 2025, SOL crashed 62% from its all-time high to $95, then ripped 132% in six months.
But here's the part the bulls don't want to hear. The sellers are not imaginary. Whales deposited over $150 million of SOL to exchanges in ten days. Pump.fun has now sold roughly 5.6 million SOL — about $888 million — since early 2024. US spot SOL ETFs bled for six straight weeks before a single $10.8 million inflow day on 16 November. And the memecoin revenue engine that powered Solana's 2025 is down roughly 87% year over year. Oversold does not mean bottom — SOL's RSI is in the 20s, and it was in the 20s last week too.
So what actually decides this? One number: $70.
SOL is trading around $73–$75 right now, bouncing off that $67 low. Check the $SOL chart and you'll see it — $70 to $72 is the floor that has held twice, in June and again this week. Hold it, and the relief-bounce crowd gets its shot at $75, then $80, the level analysts keep naming as the real test. Lose it on a daily close, and $67 opens up, then $60 — the June low that nobody wants to revisit.
$BTC decides the weather here, as always. If Bitcoin holds its $62K–$65K range, SOL gets room to breathe. If Bitcoin breaks down, no amount of Breakpoint good news saves a high-beta altcoin. And $ETH is the quiet comparison worth watching: Solana now trades at a fraction of the valuation-per-fee that Ethereum commands, which is either a bargain or a warning, depending on whether you believe fees follow the chain or the apps on it.
My take? This is a "show me" market. The news is genuinely the best Solana has ever had. The price is genuinely the worst it has been in five months. One of those two stories is wrong — and $70 is where we'll find out which one.
Watch the level. Not the headlines.
Not financial advice. DYOR.
28
Войдите, чтобы посмотреть больше материала
Присоединяйтесь к пользователям криптовалют по всему миру на Binance Square
⚡️ Получайте новейшую и полезную информацию о криптоактивах.
💬 Нам доверяет крупнейшая в мире криптобиржа.
👍 Получите достоверные аналитические данные от верифицированных создателей контента.
Эл. почта/номер телефона
В тренде
fomcотслеживание
Просмотров: 122,244
598 обсуждают
Сейчас всё внимание приковано к решениям ФРС 🇺🇸
Рынок внимательно следит за сигналами от FOMC, ведь даже одно изменение в риторике представителей ФРС может повлиять на настроение инвесторов.
Особенно интересно наблюдать за реакцией BTC и ETH. Иногда рынок начинает двигаться ещё до официальных заявлений, а после публикации протокола волатильность может заметно вырасти.
$BTC
$ETH
Я бы сейчас не торопился с выводами. Лучше следить за новостями, объёмами и реакцией цены, чем пытаться угадать направление заранее.
А вы как думаете, чего сейчас больше ждёт рынок — снижения ставки или сохранения текущей политики?
#fomcотслеживание #ПротоколFOMC
Saymontop20
·Лайков: 0
·Просмотров: 101
ПротоколFOMC
Просмотров: 146,842
348 обсуждают
IsAnthropic’s$1.5TMarketCapJustified?
Просмотров: 53,868
265 обсуждают