

CLYTHERONIX 1
173 Публикации

CLYTHERONIX 1
Отправить жалобу
Заблокировать пользователя
Smarter Plays, Sharper Insights 𓃦
0 подписок(и/а)
1 подписчиков(а)
7 понравилось
Посты
См. перевод
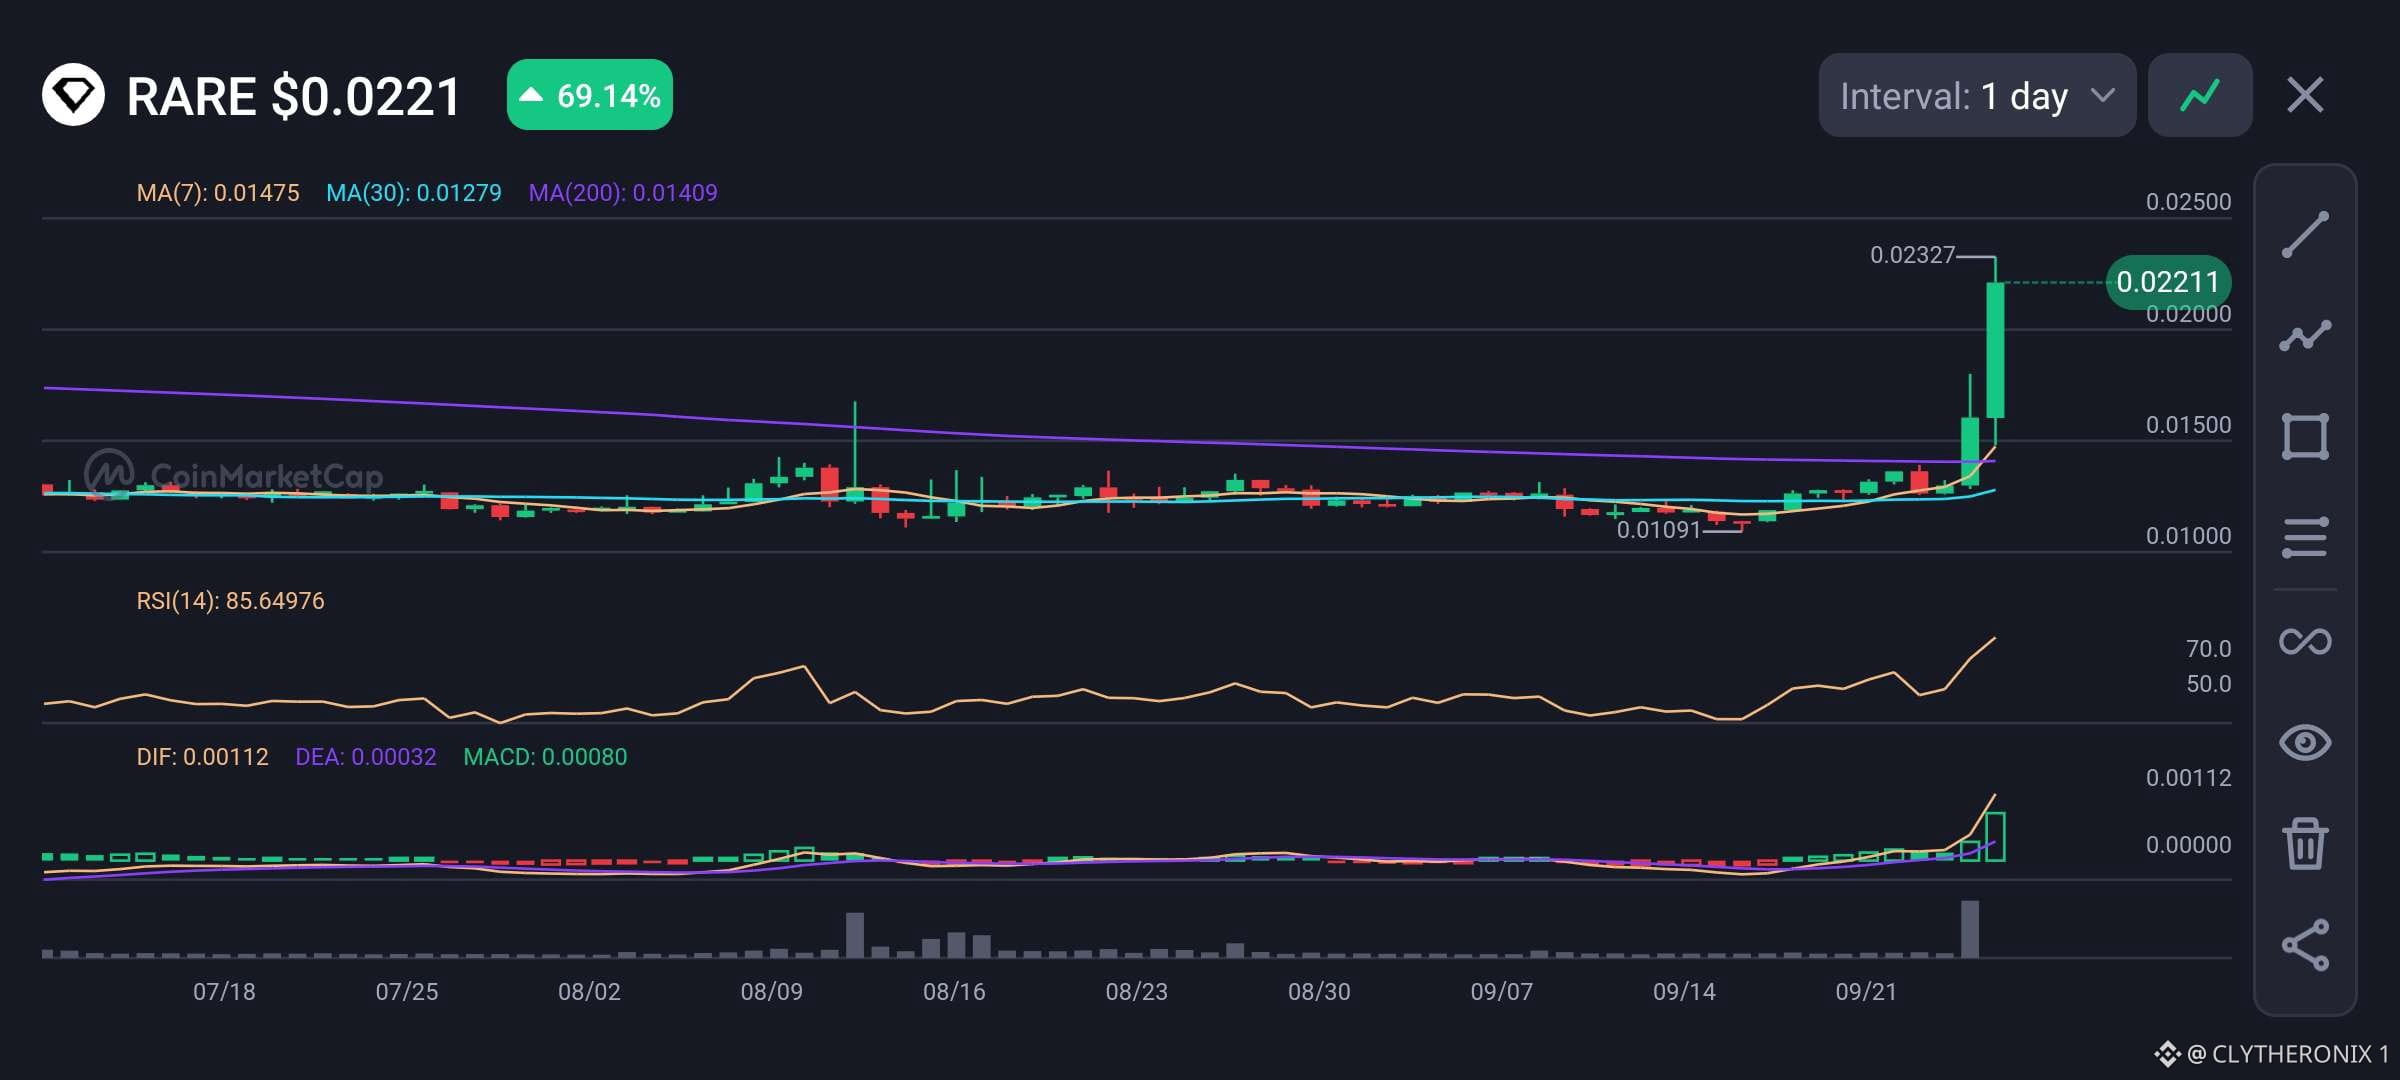
SUPERRARE is showing a major breakout on the daily chart, trading around $0.0221 after gaining 69.14%.
• Price: $0.0221
• 24h gain: +69.14%
• MA(7): $0.01475
• MA(30): $0.01279
• MA(200): $0.01409
• RSI(14): 85.65
• MACD: 0.00080
Price has moved sharply above all three moving averages, confirming a strong shift in short-term momentum. The breakout is also supported by a major increase in trading volume, suggesting strong buying activity behind the move.
MACD has turned strongly positive and is rising, adding further confirmation to the bullish momentum. However, RSI at 85.65 is deeply overbought, so the risk of profit taking and a short-term pullback is now elevated.
The recent high around $0.02327 is the immediate resistance to watch. If $RARE breaks and holds above it, the move could continue. On the downside, $0.01475 around the 7 day MA is an important support area if the market starts cooling off.
#Altcoin Season#
SUPERRARE is showing a major breakout on the daily chart, trading around $0.0221 after gaining 69.14%.
• Price: $0.0221
• 24h gain: +69.14%
• MA(7): $0.01475
• MA(30): $0.01279
• MA(200): $0.01409
• RSI(14): 85.65
• MACD: 0.00080
Price has moved sharply above all three moving averages, confirming a strong shift in short-term momentum. The breakout is also supported by a major increase in trading volume, suggesting strong buying activity behind the move.
MACD has turned strongly positive and is rising, adding further confirmation to the bullish momentum. However, RSI at 85.65 is deeply overbought, so the risk of profit taking and a short-term pullback is now elevated.
The recent high around $0.02327 is the immediate resistance to watch. If $RARE breaks and holds above it, the move could continue. On the downside, $0.01475 around the 7 day MA is an important support area if the market starts cooling off.
#Altcoin Season#
• Price: $0.0221
• 24h gain: +69.14%
• MA(7): $0.01475
• MA(30): $0.01279
• MA(200): $0.01409
• RSI(14): 85.65
• MACD: 0.00080
Price has moved sharply above all three moving averages, confirming a strong shift in short-term momentum. The breakout is also supported by a major increase in trading volume, suggesting strong buying activity behind the move.
MACD has turned strongly positive and is rising, adding further confirmation to the bullish momentum. However, RSI at 85.65 is deeply overbought, so the risk of profit taking and a short-term pullback is now elevated.
The recent high around $0.02327 is the immediate resistance to watch. If $RARE breaks and holds above it, the move could continue. On the downside, $0.01475 around the 7 day MA is an important support area if the market starts cooling off.
#Altcoin Season#
51
См. перевод
If you keep crypto on Bitget, you deserve to lose it.
But for Bitcoin, this $351M hack is actually bullish. Every exchange collapse dumps short-term panic on $BTC prices, driving weak hands to sell. Yet, it ruthlessly proves Bitcoin’s core purpose: self-custody. Centralized exchanges are just predatory, unregulated banks.
When they halt withdrawals, paper-bitcoin illusions shatter, and real $BTC gets pulled into cold storage.
Stop crying about frozen funds when you were too lazy to buy a hardware wallet.
BTC survives because of cryptography, not parasitic middlemen.
Own your keys 🔑.
If you keep crypto on Bitget, you deserve to lose it.
But for Bitcoin, this $351M hack is actually bullish. Every exchange collapse dumps short-term panic on $BTC prices, driving weak hands to sell. Yet, it ruthlessly proves Bitcoin’s core purpose: self-custody. Centralized exchanges are just predatory, unregulated banks.
When they halt withdrawals, paper-bitcoin illusions shatter, and real $BTC gets pulled into cold storage.
Stop crying about frozen funds when you were too lazy to buy a hardware wallet.
BTC survives because of cryptography, not parasitic middlemen.
Own your keys 🔑.
But for Bitcoin, this $351M hack is actually bullish. Every exchange collapse dumps short-term panic on $BTC prices, driving weak hands to sell. Yet, it ruthlessly proves Bitcoin’s core purpose: self-custody. Centralized exchanges are just predatory, unregulated banks.
When they halt withdrawals, paper-bitcoin illusions shatter, and real $BTC gets pulled into cold storage.
Stop crying about frozen funds when you were too lazy to buy a hardware wallet.
BTC survives because of cryptography, not parasitic middlemen.
Own your keys 🔑.
28
См. перевод
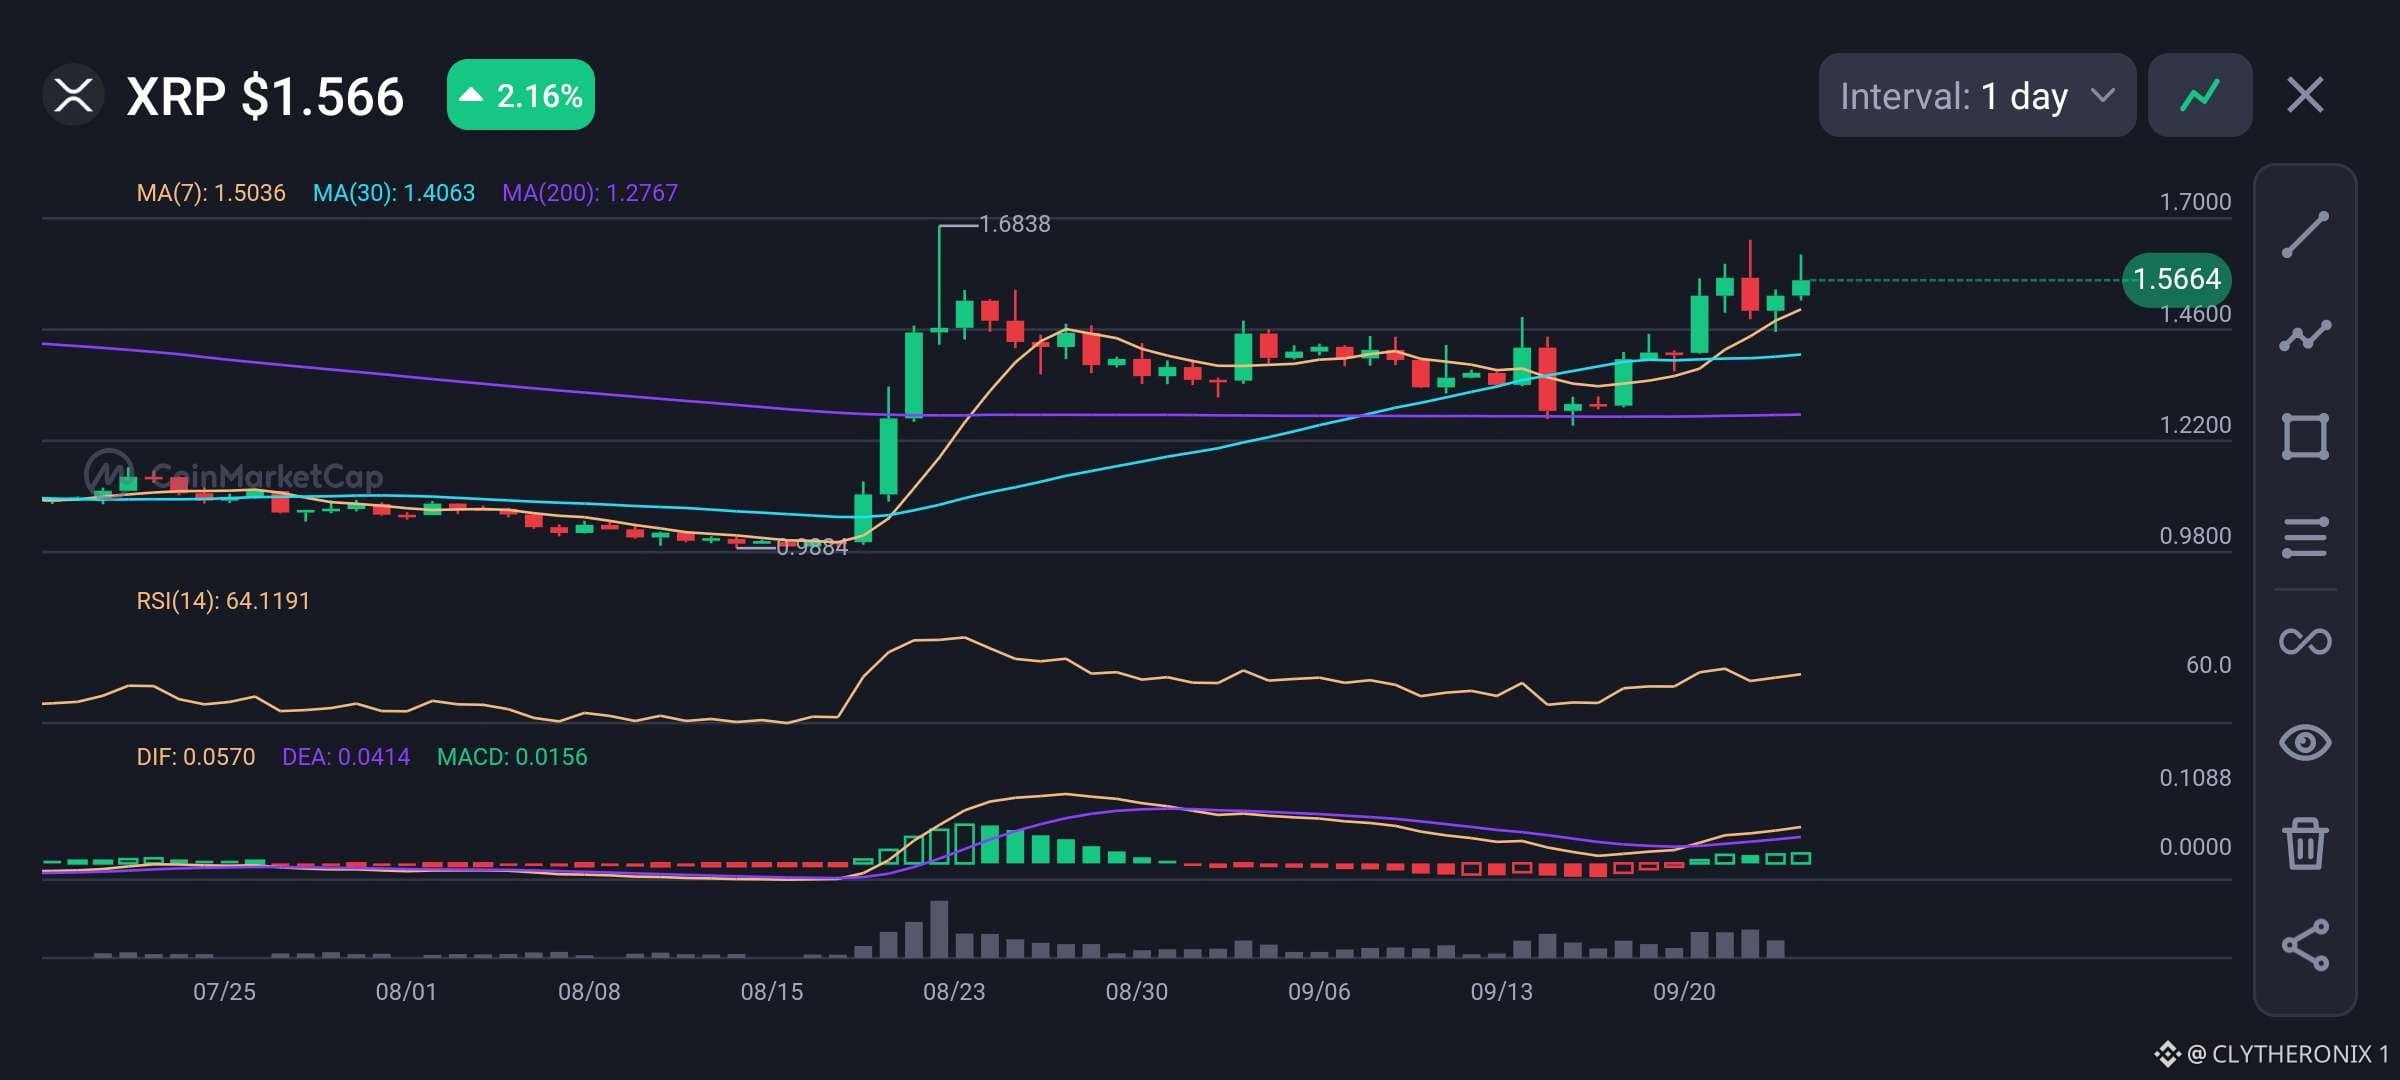
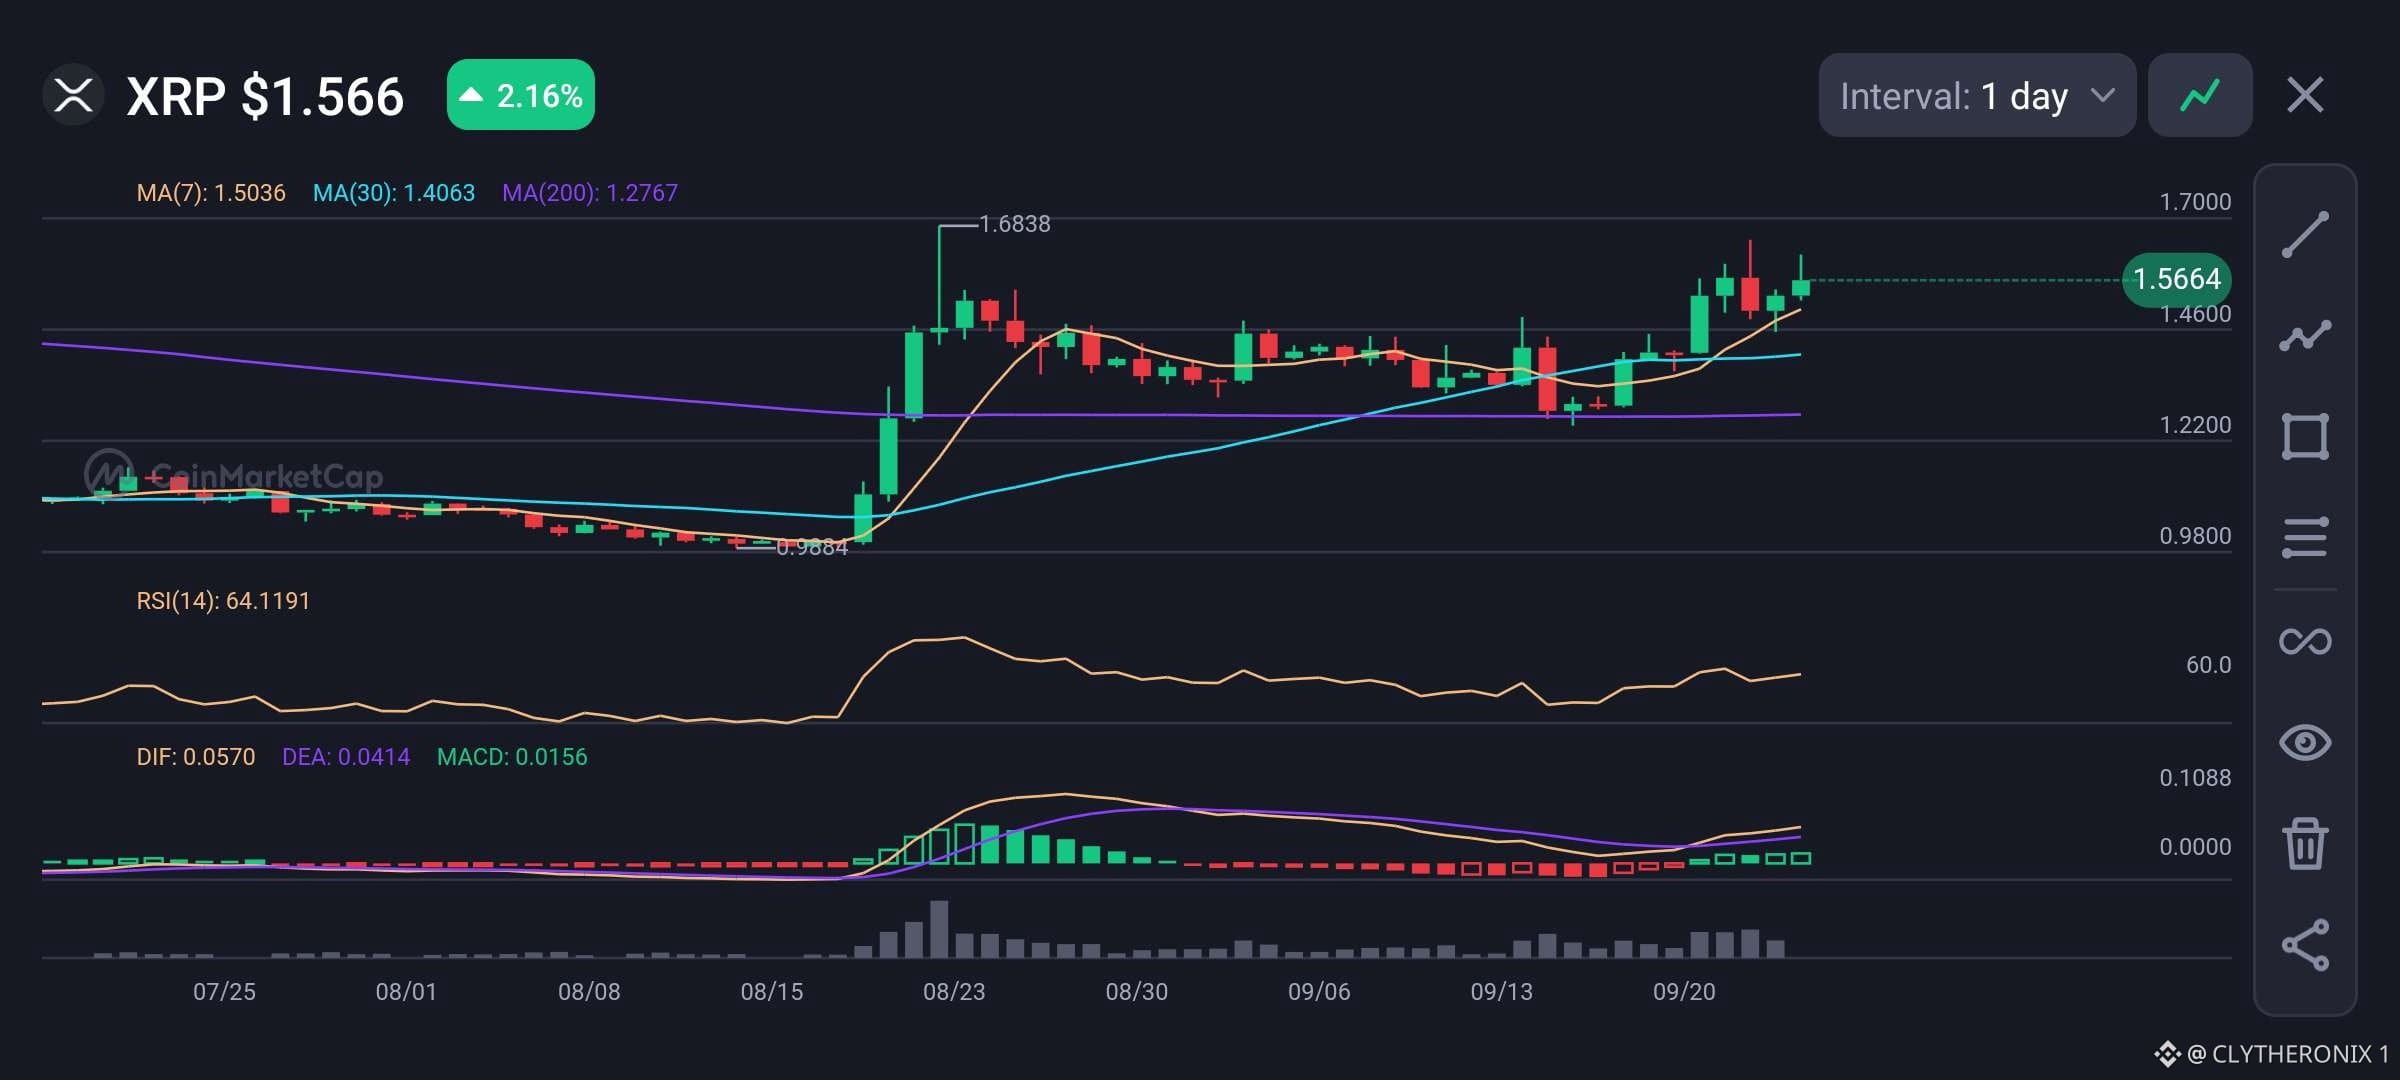
XRP is currently trading at $1.566 following a 2.16% price gain on the daily chart.
The main trend stays strongly bullish as the price remains above key support levels.
The 7 day Moving Average sits at $1.5036, the 30-day Moving Average is at $1.4063, and the 200-day Moving Average is at $1.2767.
Short-term support is near the 7 day line at $1.5036, while the main resistance is at $1.6838.
The 14 period RSI is at 64.12, which shows healthy buying momentum without reaching overbought levels for $XRP.
The MACD indicator remains positive with DIF at 0.0570 above DEA at 0.0414, giving a green MACD value of 0.0156.
If buyers hold the $1.5036 support level, $XRP can push back up toward $1.6838. However, dropping below this level could push the price down to test $1.4063.
#Altcoin Season#
XRP is currently trading at $1.566 following a 2.16% price gain on the daily chart.
The main trend stays strongly bullish as the price remains above key support levels.
The 7 day Moving Average sits at $1.5036, the 30-day Moving Average is at $1.4063, and the 200-day Moving Average is at $1.2767.
Short-term support is near the 7 day line at $1.5036, while the main resistance is at $1.6838.
The 14 period RSI is at 64.12, which shows healthy buying momentum without reaching overbought levels for $XRP.
The MACD indicator remains positive with DIF at 0.0570 above DEA at 0.0414, giving a green MACD value of 0.0156.
If buyers hold the $1.5036 support level, $XRP can push back up toward $1.6838. However, dropping below this level could push the price down to test $1.4063.
#Altcoin Season#
The main trend stays strongly bullish as the price remains above key support levels.
The 7 day Moving Average sits at $1.5036, the 30-day Moving Average is at $1.4063, and the 200-day Moving Average is at $1.2767.
Short-term support is near the 7 day line at $1.5036, while the main resistance is at $1.6838.
The 14 period RSI is at 64.12, which shows healthy buying momentum without reaching overbought levels for $XRP.
The MACD indicator remains positive with DIF at 0.0570 above DEA at 0.0414, giving a green MACD value of 0.0156.
If buyers hold the $1.5036 support level, $XRP can push back up toward $1.6838. However, dropping below this level could push the price down to test $1.4063.
#Altcoin Season#
39
См. перевод
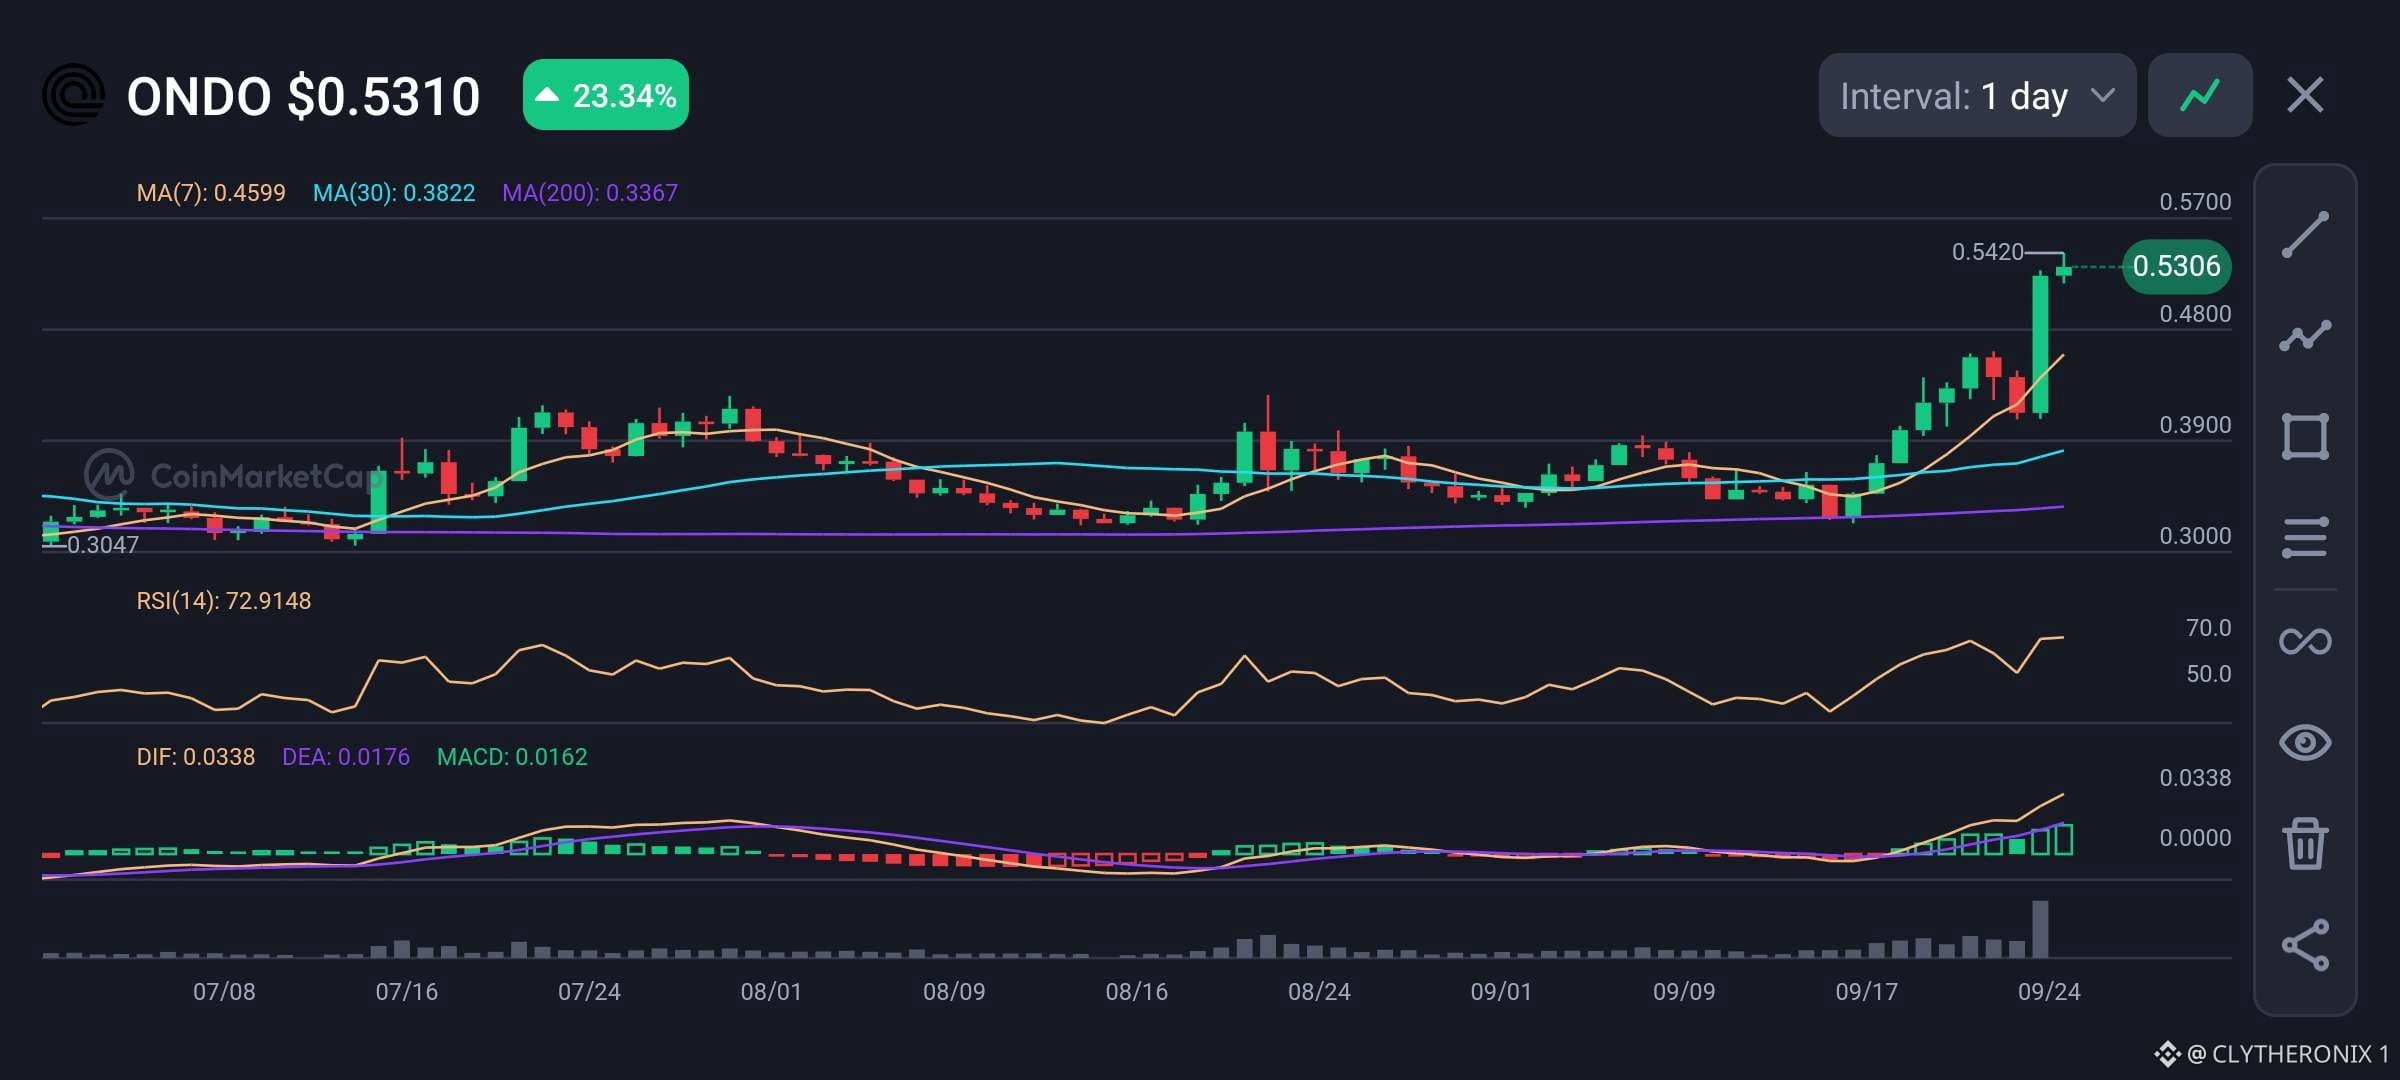
ONDO is showing strong bullish momentum on the daily chart, trading around $0.5310 after gaining 23.34%.
• Price: $0.5310
• 24h gain: +23.34%
• MA(7): $0.4599
• MA(30): $0.3822
• MA(200): $0.3367
• RSI(14): 72.91
• MACD: 0.0162
$ONDO has moved well above the 7 day, 30 day, and 200 day moving averages, showing that buyers are firmly in control of the current trend. The recent candles also came with a clear increase in trading volume, supporting the strength of the breakout.
MACD is positive and rising, which adds further confirmation to the current momentum. However, RSI is at 72.91, placing ONDO in overbought territory. This means the price could see some profit taking or short-term consolidation after such a strong move.
The $0.480 area is an important level to watch, while the 7 day MA around $0.4599 could act as deeper support. Holding these levels would keep the current bullish structure intact, while a rejection from the recent high could lead to a temporary pullback.
#Macro Insights#
ONDO is showing strong bullish momentum on the daily chart, trading around $0.5310 after gaining 23.34%.
• Price: $0.5310
• 24h gain: +23.34%
• MA(7): $0.4599
• MA(30): $0.3822
• MA(200): $0.3367
• RSI(14): 72.91
• MACD: 0.0162
$ONDO has moved well above the 7 day, 30 day, and 200 day moving averages, showing that buyers are firmly in control of the current trend. The recent candles also came with a clear increase in trading volume, supporting the strength of the breakout.
MACD is positive and rising, which adds further confirmation to the current momentum. However, RSI is at 72.91, placing ONDO in overbought territory. This means the price could see some profit taking or short-term consolidation after such a strong move.
The $0.480 area is an important level to watch, while the 7 day MA around $0.4599 could act as deeper support. Holding these levels would keep the current bullish structure intact, while a rejection from the recent high could lead to a temporary pullback.
#Macro Insights#
• Price: $0.5310
• 24h gain: +23.34%
• MA(7): $0.4599
• MA(30): $0.3822
• MA(200): $0.3367
• RSI(14): 72.91
• MACD: 0.0162
$ONDO has moved well above the 7 day, 30 day, and 200 day moving averages, showing that buyers are firmly in control of the current trend. The recent candles also came with a clear increase in trading volume, supporting the strength of the breakout.
MACD is positive and rising, which adds further confirmation to the current momentum. However, RSI is at 72.91, placing ONDO in overbought territory. This means the price could see some profit taking or short-term consolidation after such a strong move.
The $0.480 area is an important level to watch, while the 7 day MA around $0.4599 could act as deeper support. Holding these levels would keep the current bullish structure intact, while a rejection from the recent high could lead to a temporary pullback.
#Macro Insights#
47
См. перевод
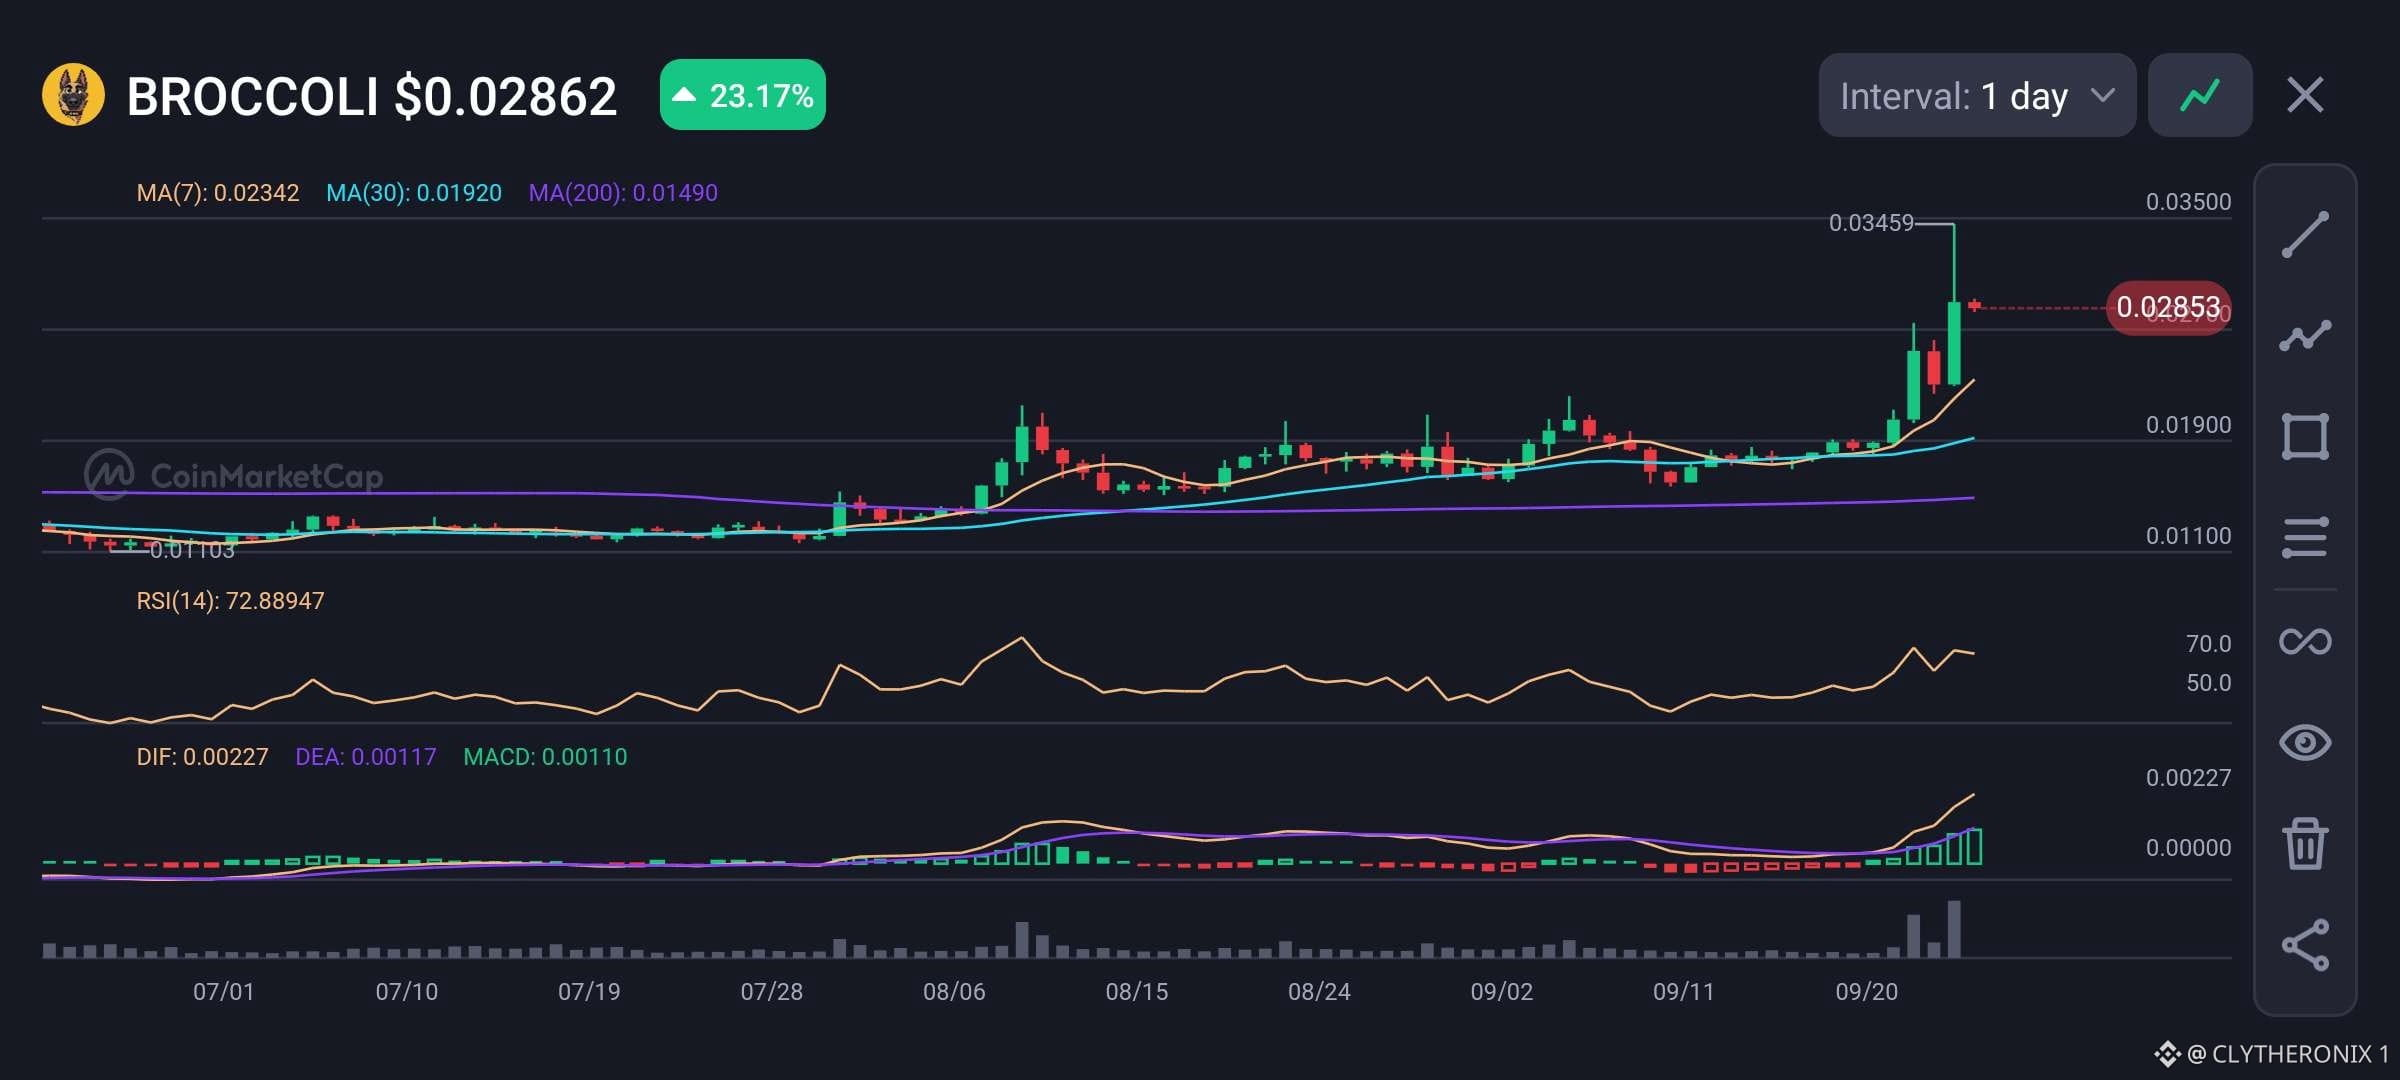
BROCCOLI is showing a sharp breakout on the daily chart, trading around $0.02862 after gaining 23.17% today.
• Price: $0.02862
• 24h gain: +23.17%
• MA(7): $0.02342
• MA(30): $0.01920
• MA(200): $0.01490
• RSI(14): 72.89
• MACD: 0.00110
Technically, the price has moved well above all three moving averages, confirming strong short-term momentum.
And lf course, recent candles show increased buying activity, with volume rising alongside the breakout.
MACD remains positive and is accelerating, supporting the current move. However, RSI at 72.89 puts $BROCCOLI in overbought territory, so a short-term pullback or consolidation remains possible.
Holding the $0.0234 area, near the 7 day MA, would help preserve the current structure, while a break below it could bring $0.0192 into focus.
Momentum remains strong, but volatility is elevated.
#Meme Alpha#
BROCCOLI is showing a sharp breakout on the daily chart, trading around $0.02862 after gaining 23.17% today.
• Price: $0.02862
• 24h gain: +23.17%
• MA(7): $0.02342
• MA(30): $0.01920
• MA(200): $0.01490
• RSI(14): 72.89
• MACD: 0.00110
Technically, the price has moved well above all three moving averages, confirming strong short-term momentum.
And lf course, recent candles show increased buying activity, with volume rising alongside the breakout.
MACD remains positive and is accelerating, supporting the current move. However, RSI at 72.89 puts $BROCCOLI in overbought territory, so a short-term pullback or consolidation remains possible.
Holding the $0.0234 area, near the 7 day MA, would help preserve the current structure, while a break below it could bring $0.0192 into focus.
Momentum remains strong, but volatility is elevated.
#Meme Alpha#
• Price: $0.02862
• 24h gain: +23.17%
• MA(7): $0.02342
• MA(30): $0.01920
• MA(200): $0.01490
• RSI(14): 72.89
• MACD: 0.00110
Technically, the price has moved well above all three moving averages, confirming strong short-term momentum.
And lf course, recent candles show increased buying activity, with volume rising alongside the breakout.
MACD remains positive and is accelerating, supporting the current move. However, RSI at 72.89 puts $BROCCOLI in overbought territory, so a short-term pullback or consolidation remains possible.
Holding the $0.0234 area, near the 7 day MA, would help preserve the current structure, while a break below it could bring $0.0192 into focus.
Momentum remains strong, but volatility is elevated.
#Meme Alpha#
56
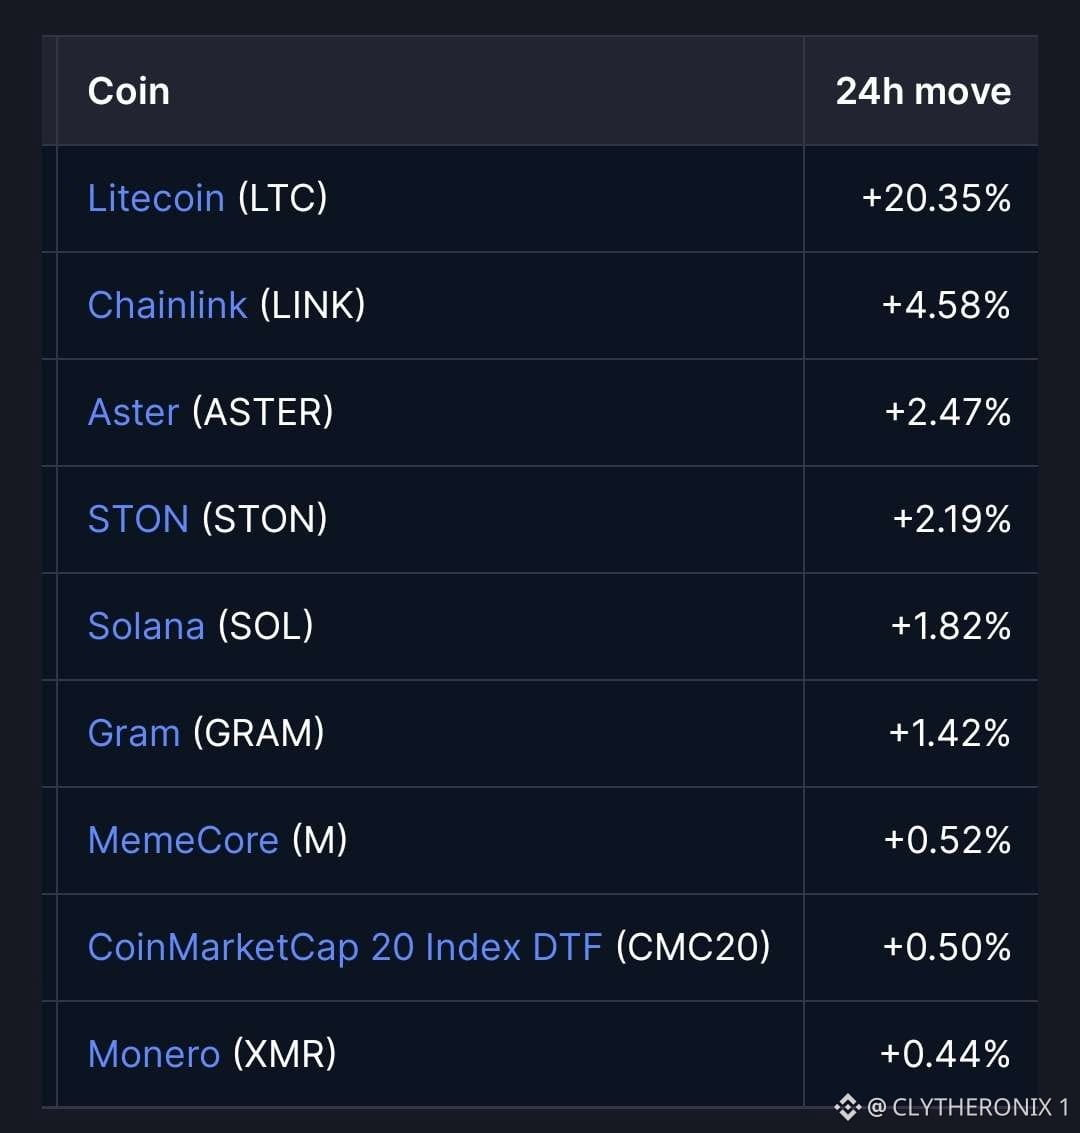
Сегодня крипторынок демонстрирует широкую силу, но движение в основном сосредоточено в Litecoin. Результаты за 24 часа в моем списке наблюдения:
• $LTC: +20.35%
• $LINK: +4.71%
• $ASTER: +2.45%
• $STON: +2.19%
• $SOL: +1.80%
Технически LTC — явный лидер по импульсу: его движение более чем в четыре раза сильнее, чем у LINK.
Резкий рост указывает на сильный покупательский спрос, но также повышает риск краткосрочной фиксации прибыли и волатильности.
Теперь LINK показывает более ровный импульс, а ASTER, STON и SOL — более сдержанные приросты.
Ключевой вопрос и самое важное, на что я смотрю, — сможет ли LTC удержать недавний пробой и распространится ли сила покупок на более широкий рынок альткоинов.
Устойчивое движение при здоровом объеме даст более сильное подтверждение, тогда как быстрое отклонение может сигнализировать о краткосрочном охлаждении.
Жду...
#Altcoin Season#
Сегодня крипторынок демонстрирует широкую силу, но движение в основном сосредоточено в Litecoin. Результаты за 24 часа в моем списке наблюдения:
• $LTC: +20.35%
• $LINK: +4.71%
• $ASTER: +2.45%
• $STON: +2.19%
• $SOL: +1.80%
Технически LTC — явный лидер по импульсу: его движение более чем в четыре раза сильнее, чем у LINK.
Резкий рост указывает на сильный покупательский спрос, но также повышает риск краткосрочной фиксации прибыли и волатильности.
Теперь LINK показывает более ровный импульс, а ASTER, STON и SOL — более сдержанные приросты.
Ключевой вопрос и самое важное, на что я смотрю, — сможет ли LTC удержать недавний пробой и распространится ли сила покупок на более широкий рынок альткоинов.
Устойчивое движение при здоровом объеме даст более сильное подтверждение, тогда как быстрое отклонение может сигнализировать о краткосрочном охлаждении.
Жду...
#Altcoin Season#
• $LTC: +20.35%
• $LINK: +4.71%
• $ASTER: +2.45%
• $STON: +2.19%
• $SOL: +1.80%
Технически LTC — явный лидер по импульсу: его движение более чем в четыре раза сильнее, чем у LINK.
Резкий рост указывает на сильный покупательский спрос, но также повышает риск краткосрочной фиксации прибыли и волатильности.
Теперь LINK показывает более ровный импульс, а ASTER, STON и SOL — более сдержанные приросты.
Ключевой вопрос и самое важное, на что я смотрю, — сможет ли LTC удержать недавний пробой и распространится ли сила покупок на более широкий рынок альткоинов.
Устойчивое движение при здоровом объеме даст более сильное подтверждение, тогда как быстрое отклонение может сигнализировать о краткосрочном охлаждении.
Жду...
#Altcoin Season#
56
См. перевод
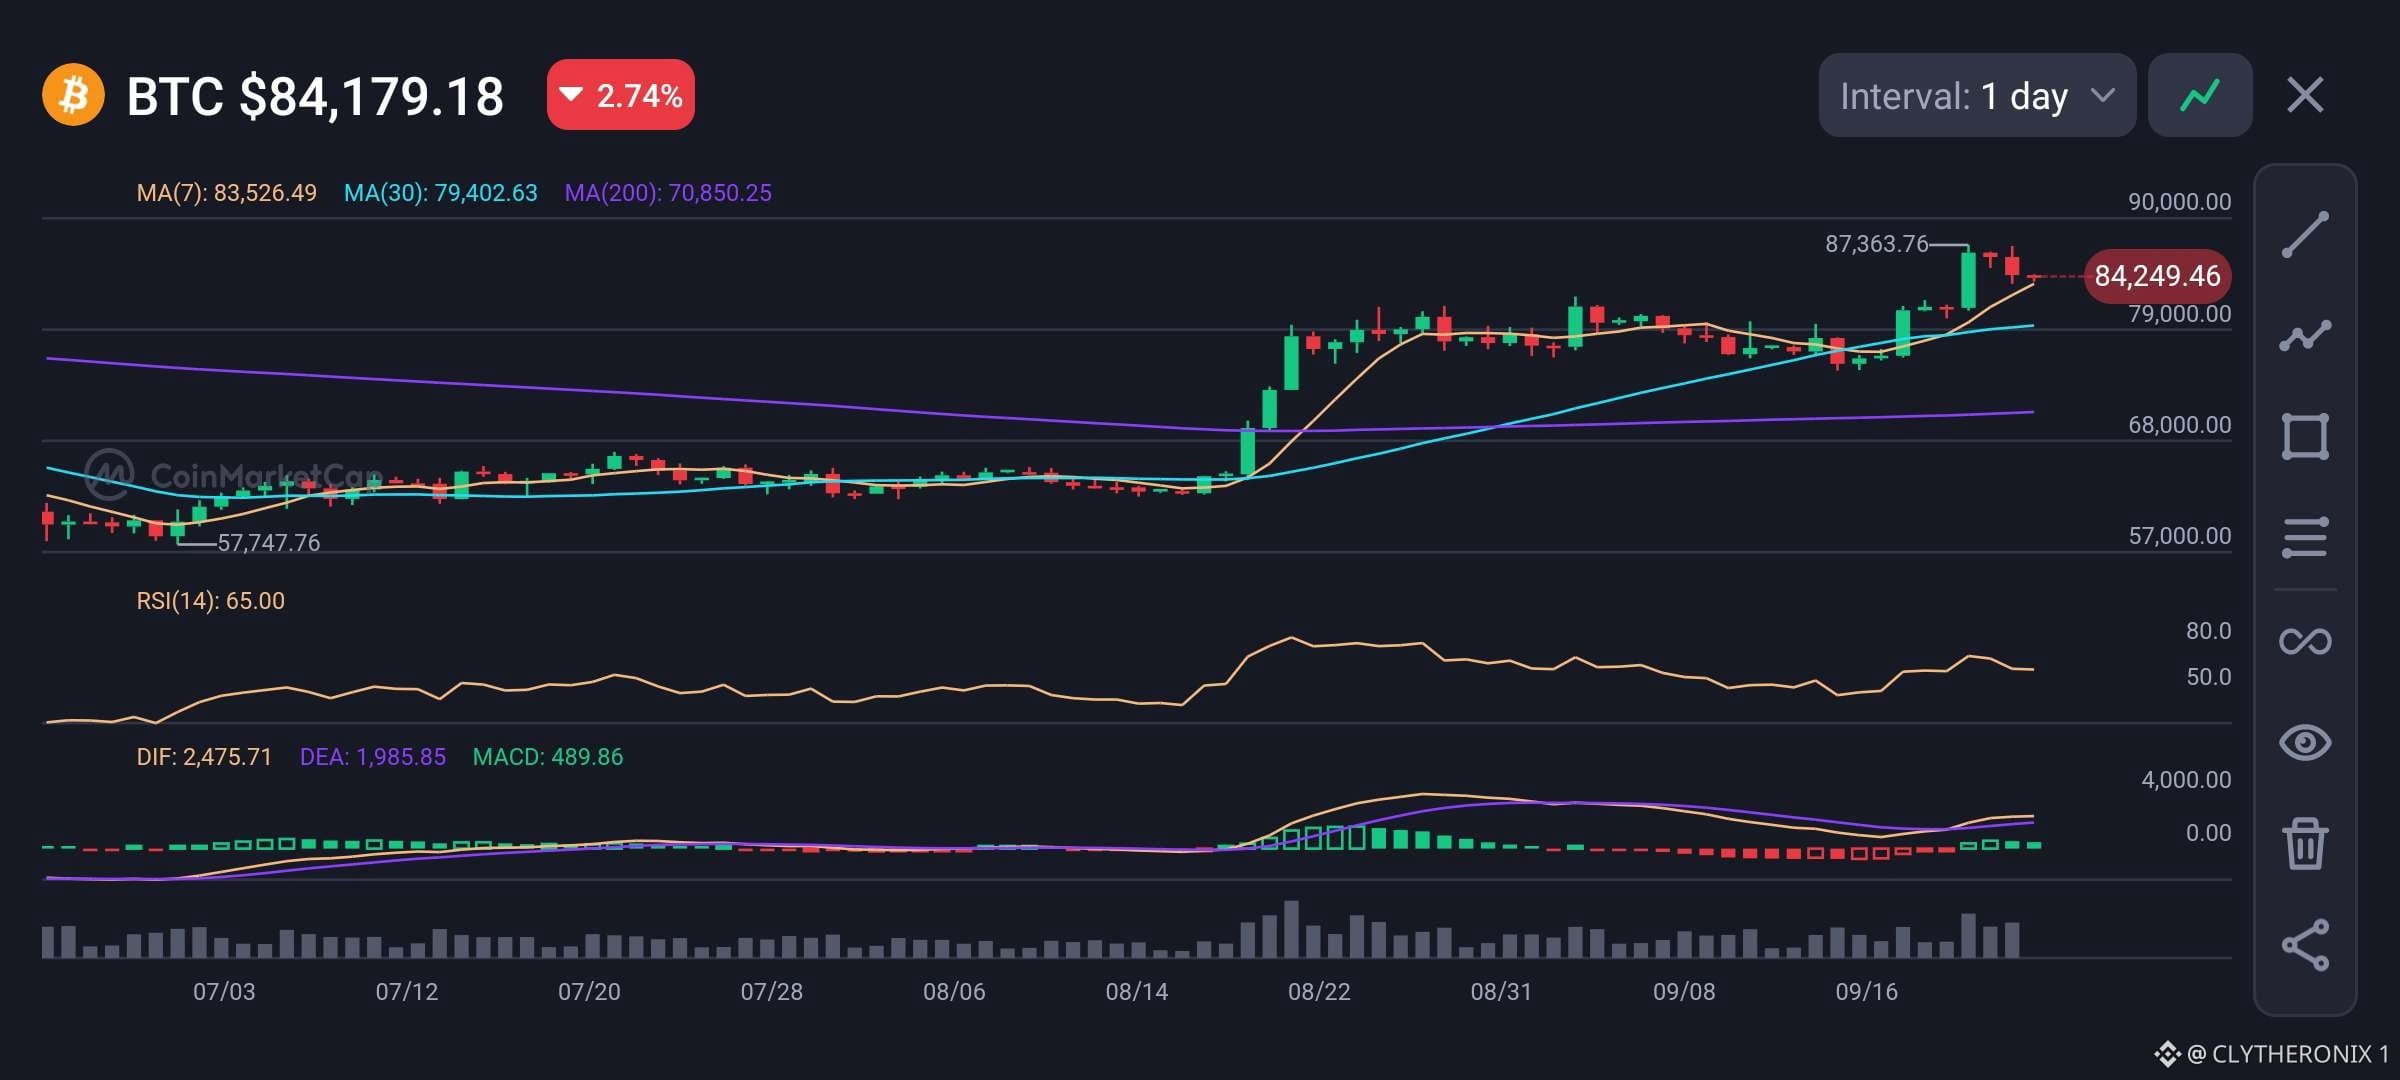
Bitcoin trades at $84,179.18 after a 2.74% price drop from its recent high of $87,363.76. The main trend stays strongly bullish because the price remains above key support lines.
The 7 day Moving Average sits at $83,526.49, the 30-day Moving Average is at $79,402.63, and the 200-day Moving Average is at $70,350.25.
Now, looking at the chart of $BTC, the short-term support is near the 7 day line at $83,500, while the main resistance is at $87,360.
The 14 period RSI is at 65.00, which shows strong buying momentum without being overbought.
The MACD indicator remains positive with DIF at 2,475.71 above DEA at 1,985.85, giving a green MACD value of 489.86.
Therefore, if buyers hold the $83,500 support level, Bitcoin can move back up toward $87,363. However, dropping below this level could push the price down to test $79,400.
#BTC Price Analysis#
Bitcoin trades at $84,179.18 after a 2.74% price drop from its recent high of $87,363.76. The main trend stays strongly bullish because the price remains above key support lines.
The 7 day Moving Average sits at $83,526.49, the 30-day Moving Average is at $79,402.63, and the 200-day Moving Average is at $70,350.25.
Now, looking at the chart of $BTC, the short-term support is near the 7 day line at $83,500, while the main resistance is at $87,360.
The 14 period RSI is at 65.00, which shows strong buying momentum without being overbought.
The MACD indicator remains positive with DIF at 2,475.71 above DEA at 1,985.85, giving a green MACD value of 489.86.
Therefore, if buyers hold the $83,500 support level, Bitcoin can move back up toward $87,363. However, dropping below this level could push the price down to test $79,400.
#BTC Price Analysis#
The 7 day Moving Average sits at $83,526.49, the 30-day Moving Average is at $79,402.63, and the 200-day Moving Average is at $70,350.25.
Now, looking at the chart of $BTC, the short-term support is near the 7 day line at $83,500, while the main resistance is at $87,360.
The 14 period RSI is at 65.00, which shows strong buying momentum without being overbought.
The MACD indicator remains positive with DIF at 2,475.71 above DEA at 1,985.85, giving a green MACD value of 489.86.
Therefore, if buyers hold the $83,500 support level, Bitcoin can move back up toward $87,363. However, dropping below this level could push the price down to test $79,400.
#BTC Price Analysis#
60
См. перевод
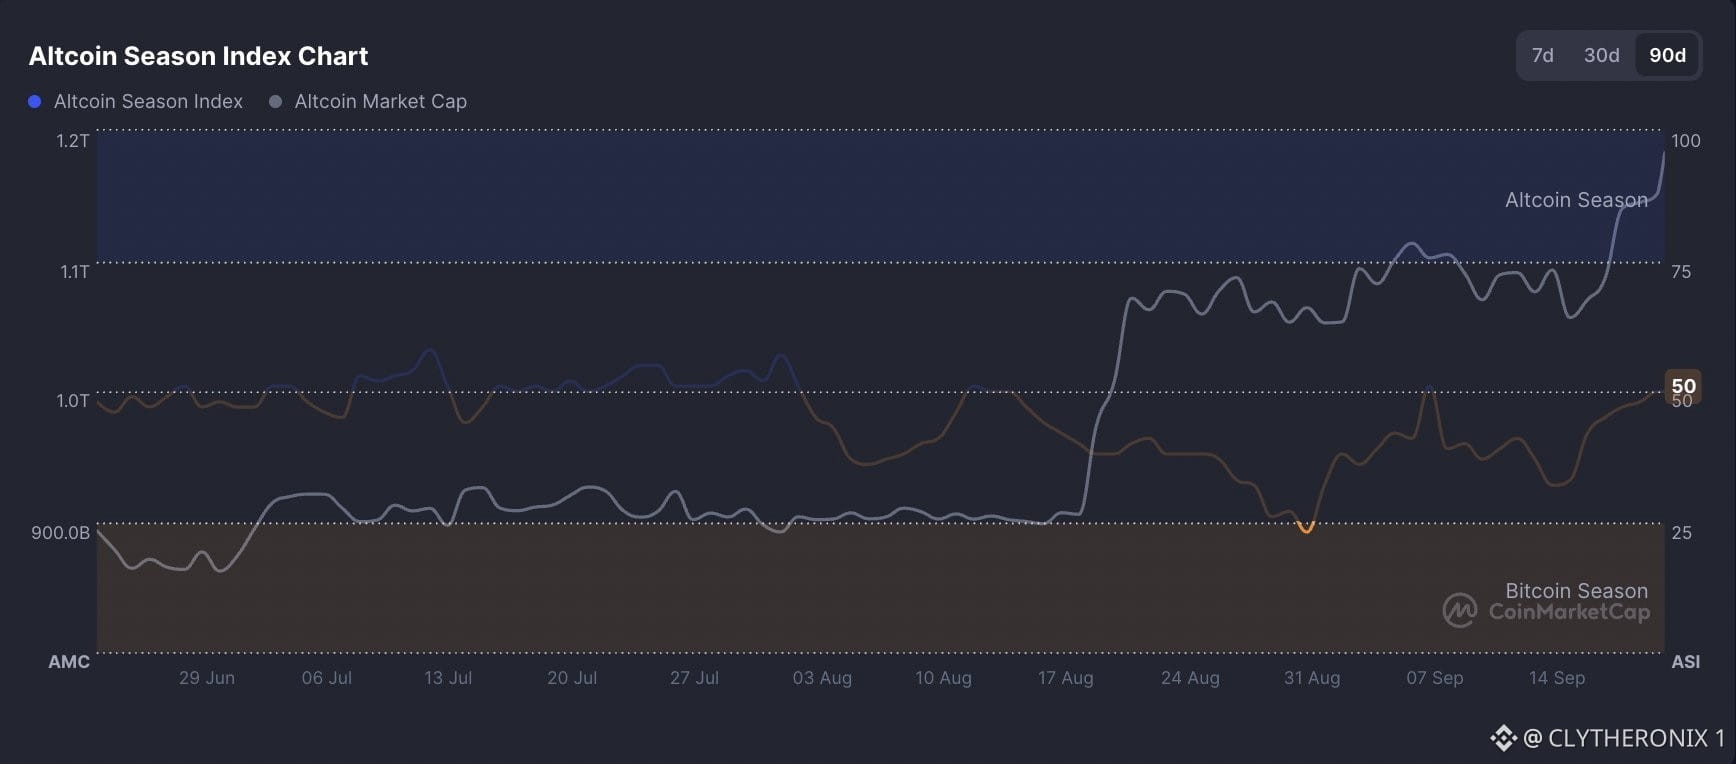
According to recent CoinMarketCap charts, altseason appears to be officially starting.
The Altcoin Season Index has climbed past the 75 threshold, entering official altcoin season territory.
This signal means that over 75% of the top 100 cryptocurrencies have outperformed Bitcoin over the past 90 days.
Concurrently, the total altcoin market capitalization is climbing toward $1.2 trillion. Together, these key metrics point to a clear market shift as capital flows out of Bitcoin and into alternative tokens.
While crypto trends can pivot quickly, current market charts confirm strong and growing altseason momentum.
#Macro Insights#
According to recent CoinMarketCap charts, altseason appears to be officially starting.
The Altcoin Season Index has climbed past the 75 threshold, entering official altcoin season territory.
This signal means that over 75% of the top 100 cryptocurrencies have outperformed Bitcoin over the past 90 days.
Concurrently, the total altcoin market capitalization is climbing toward $1.2 trillion. Together, these key metrics point to a clear market shift as capital flows out of Bitcoin and into alternative tokens.
While crypto trends can pivot quickly, current market charts confirm strong and growing altseason momentum.
#Macro Insights#
The Altcoin Season Index has climbed past the 75 threshold, entering official altcoin season territory.
This signal means that over 75% of the top 100 cryptocurrencies have outperformed Bitcoin over the past 90 days.
Concurrently, the total altcoin market capitalization is climbing toward $1.2 trillion. Together, these key metrics point to a clear market shift as capital flows out of Bitcoin and into alternative tokens.
While crypto trends can pivot quickly, current market charts confirm strong and growing altseason momentum.
#Macro Insights#
51
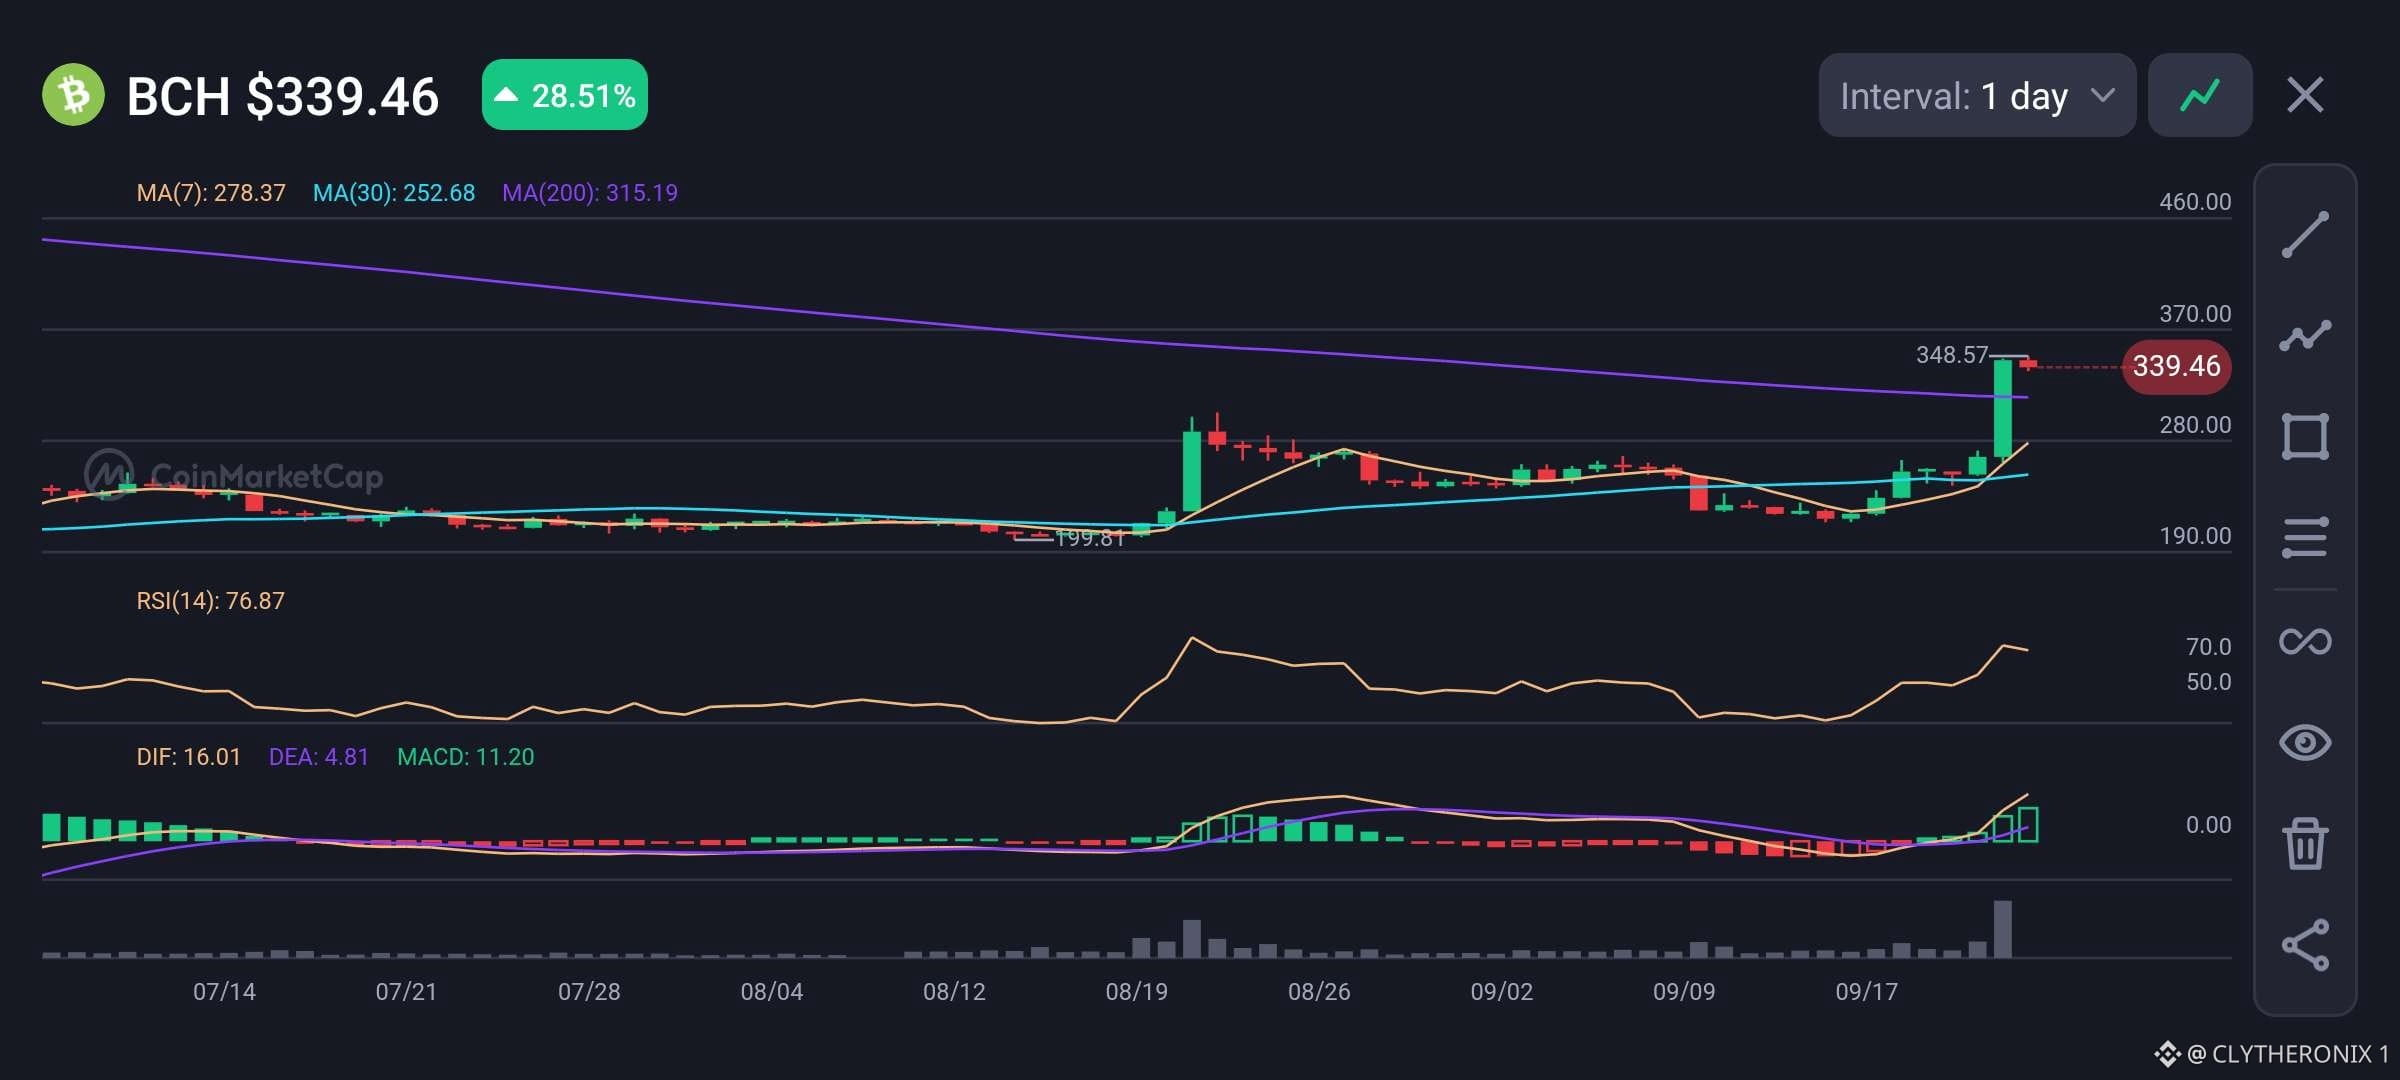
Bitcoin Cash демонстрирует сильный импульс на дневном графике: торгуется около $339.46 после всплеска на 28.51%.
Цена поднялась выше 7-дневной MA на $278.37, 30-дневной MA на $252.68 и 200-дневной MA на $315.19, выводя на первый план более широкий тренд для $BCH.
Теперь ближайший уровень, за которым стоит следить, — $348.57. Устойчивая динамика выше этой зоны может открыть путь к $370 и потенциально более высоким уровням.
Однако RSI по $BCH на уровне 76.87 показывает, что импульс уже чрезмерно разогнан, поэтому откат исключать нельзя.
Зона $315 теперь становится важным уровнем, который нужно удержать, затем $280.
MACD остается в положительной зоне, поддерживая текущий импульс, а резкий рост объема подтверждает активность рынка.
Bitcoin Cash демонстрирует сильный импульс на дневном графике: торгуется около $339.46 после всплеска на 28.51%.
Цена поднялась выше 7-дневной MA на $278.37, 30-дневной MA на $252.68 и 200-дневной MA на $315.19, выводя на первый план более широкий тренд для $BCH.
Теперь ближайший уровень, за которым стоит следить, — $348.57. Устойчивая динамика выше этой зоны может открыть путь к $370 и потенциально более высоким уровням.
Однако RSI по $BCH на уровне 76.87 показывает, что импульс уже чрезмерно разогнан, поэтому откат исключать нельзя.
Зона $315 теперь становится важным уровнем, который нужно удержать, затем $280.
MACD остается в положительной зоне, поддерживая текущий импульс, а резкий рост объема подтверждает активность рынка.
Цена поднялась выше 7-дневной MA на $278.37, 30-дневной MA на $252.68 и 200-дневной MA на $315.19, выводя на первый план более широкий тренд для $BCH.
Теперь ближайший уровень, за которым стоит следить, — $348.57. Устойчивая динамика выше этой зоны может открыть путь к $370 и потенциально более высоким уровням.
Однако RSI по $BCH на уровне 76.87 показывает, что импульс уже чрезмерно разогнан, поэтому откат исключать нельзя.
Зона $315 теперь становится важным уровнем, который нужно удержать, затем $280.
MACD остается в положительной зоне, поддерживая текущий импульс, а резкий рост объема подтверждает активность рынка.
50
См. перевод
STON TOKEN: STON.FI AND THE GROWING TON ECOSYSTEM
CURRENT MARKET POSITION
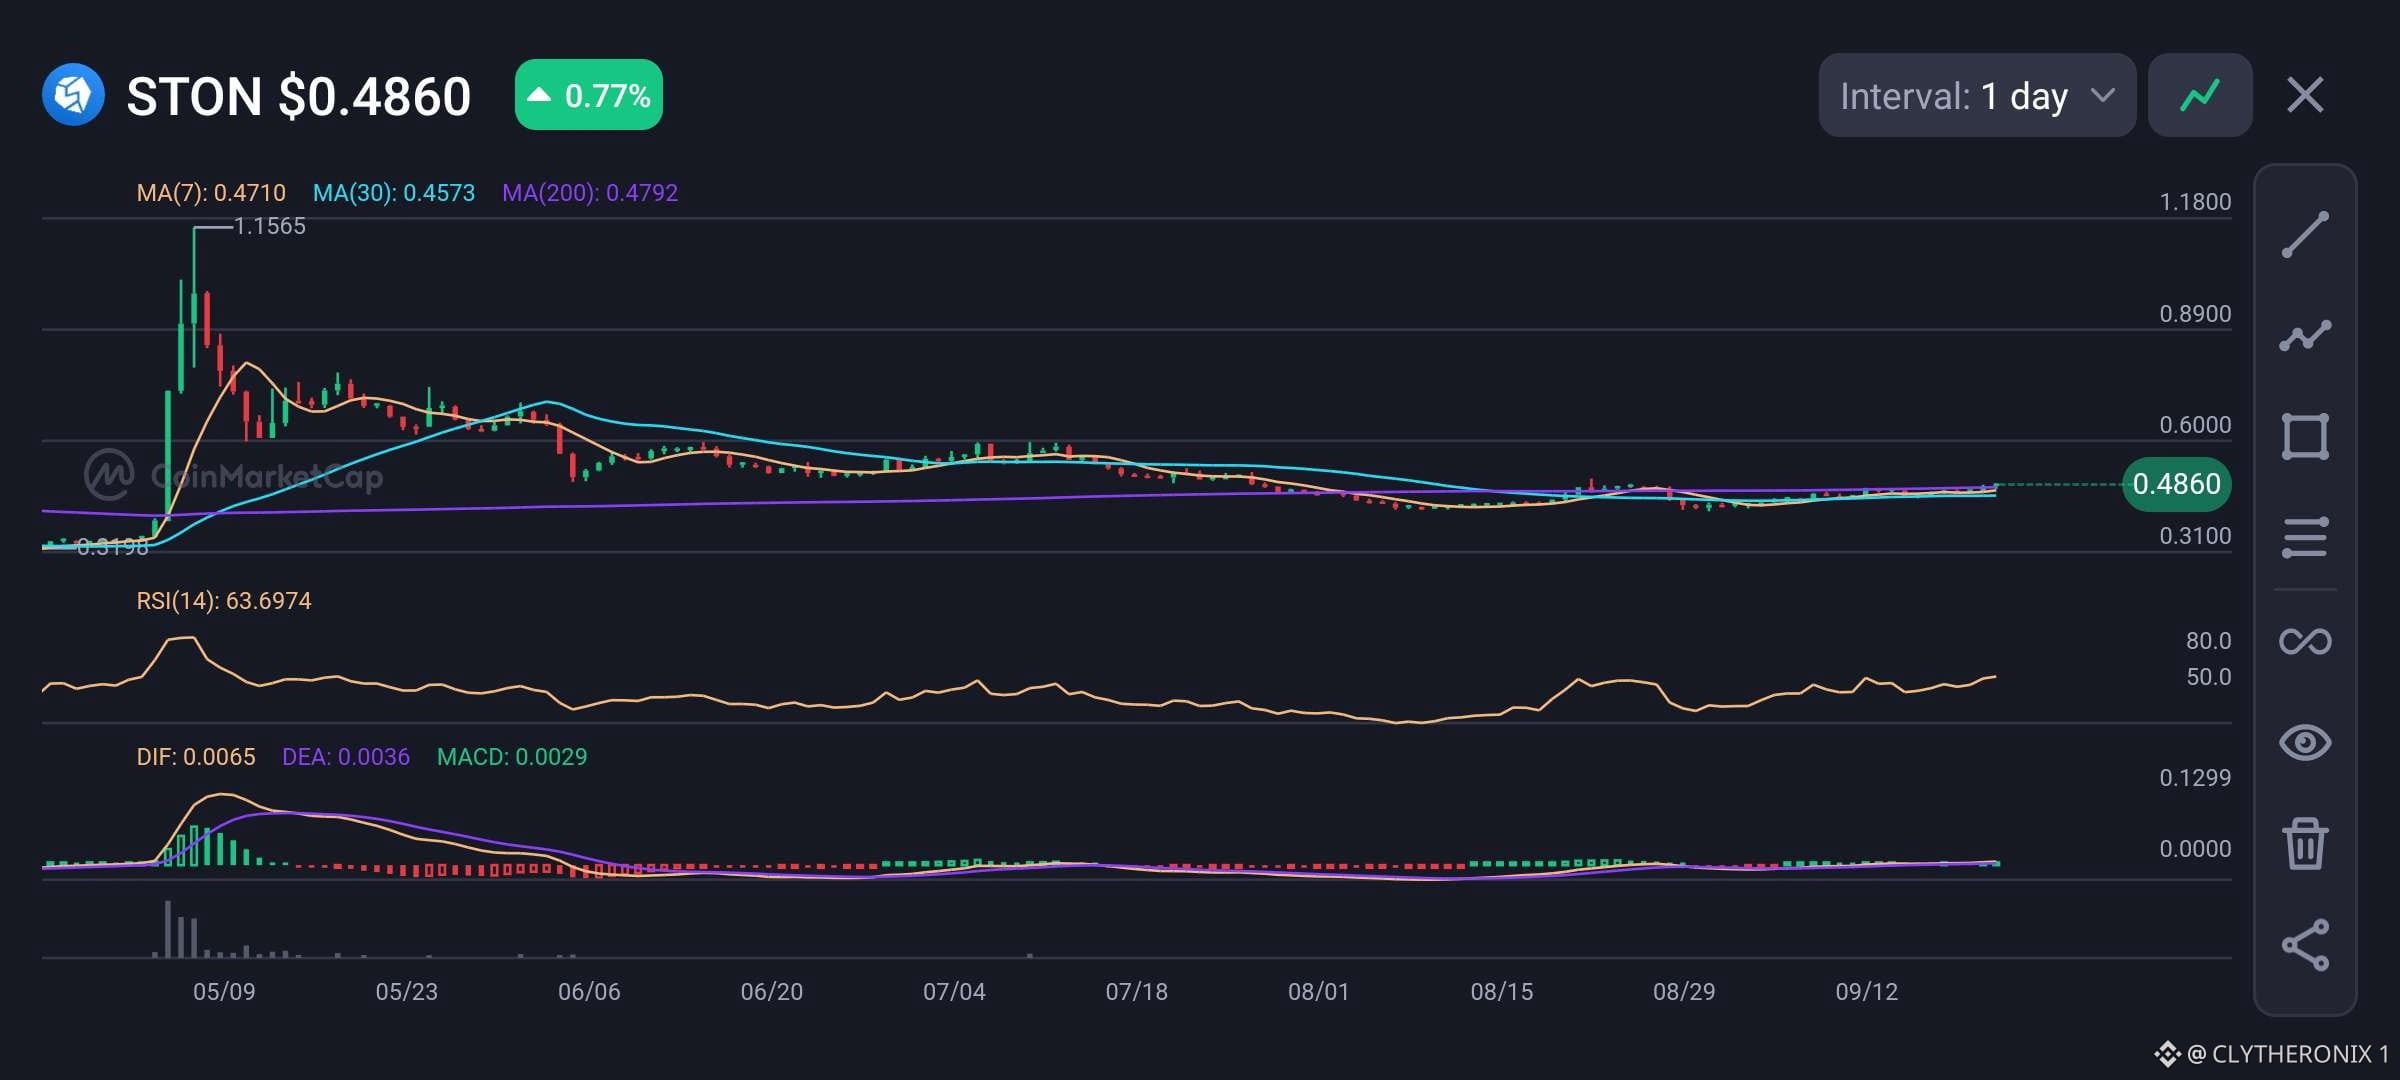
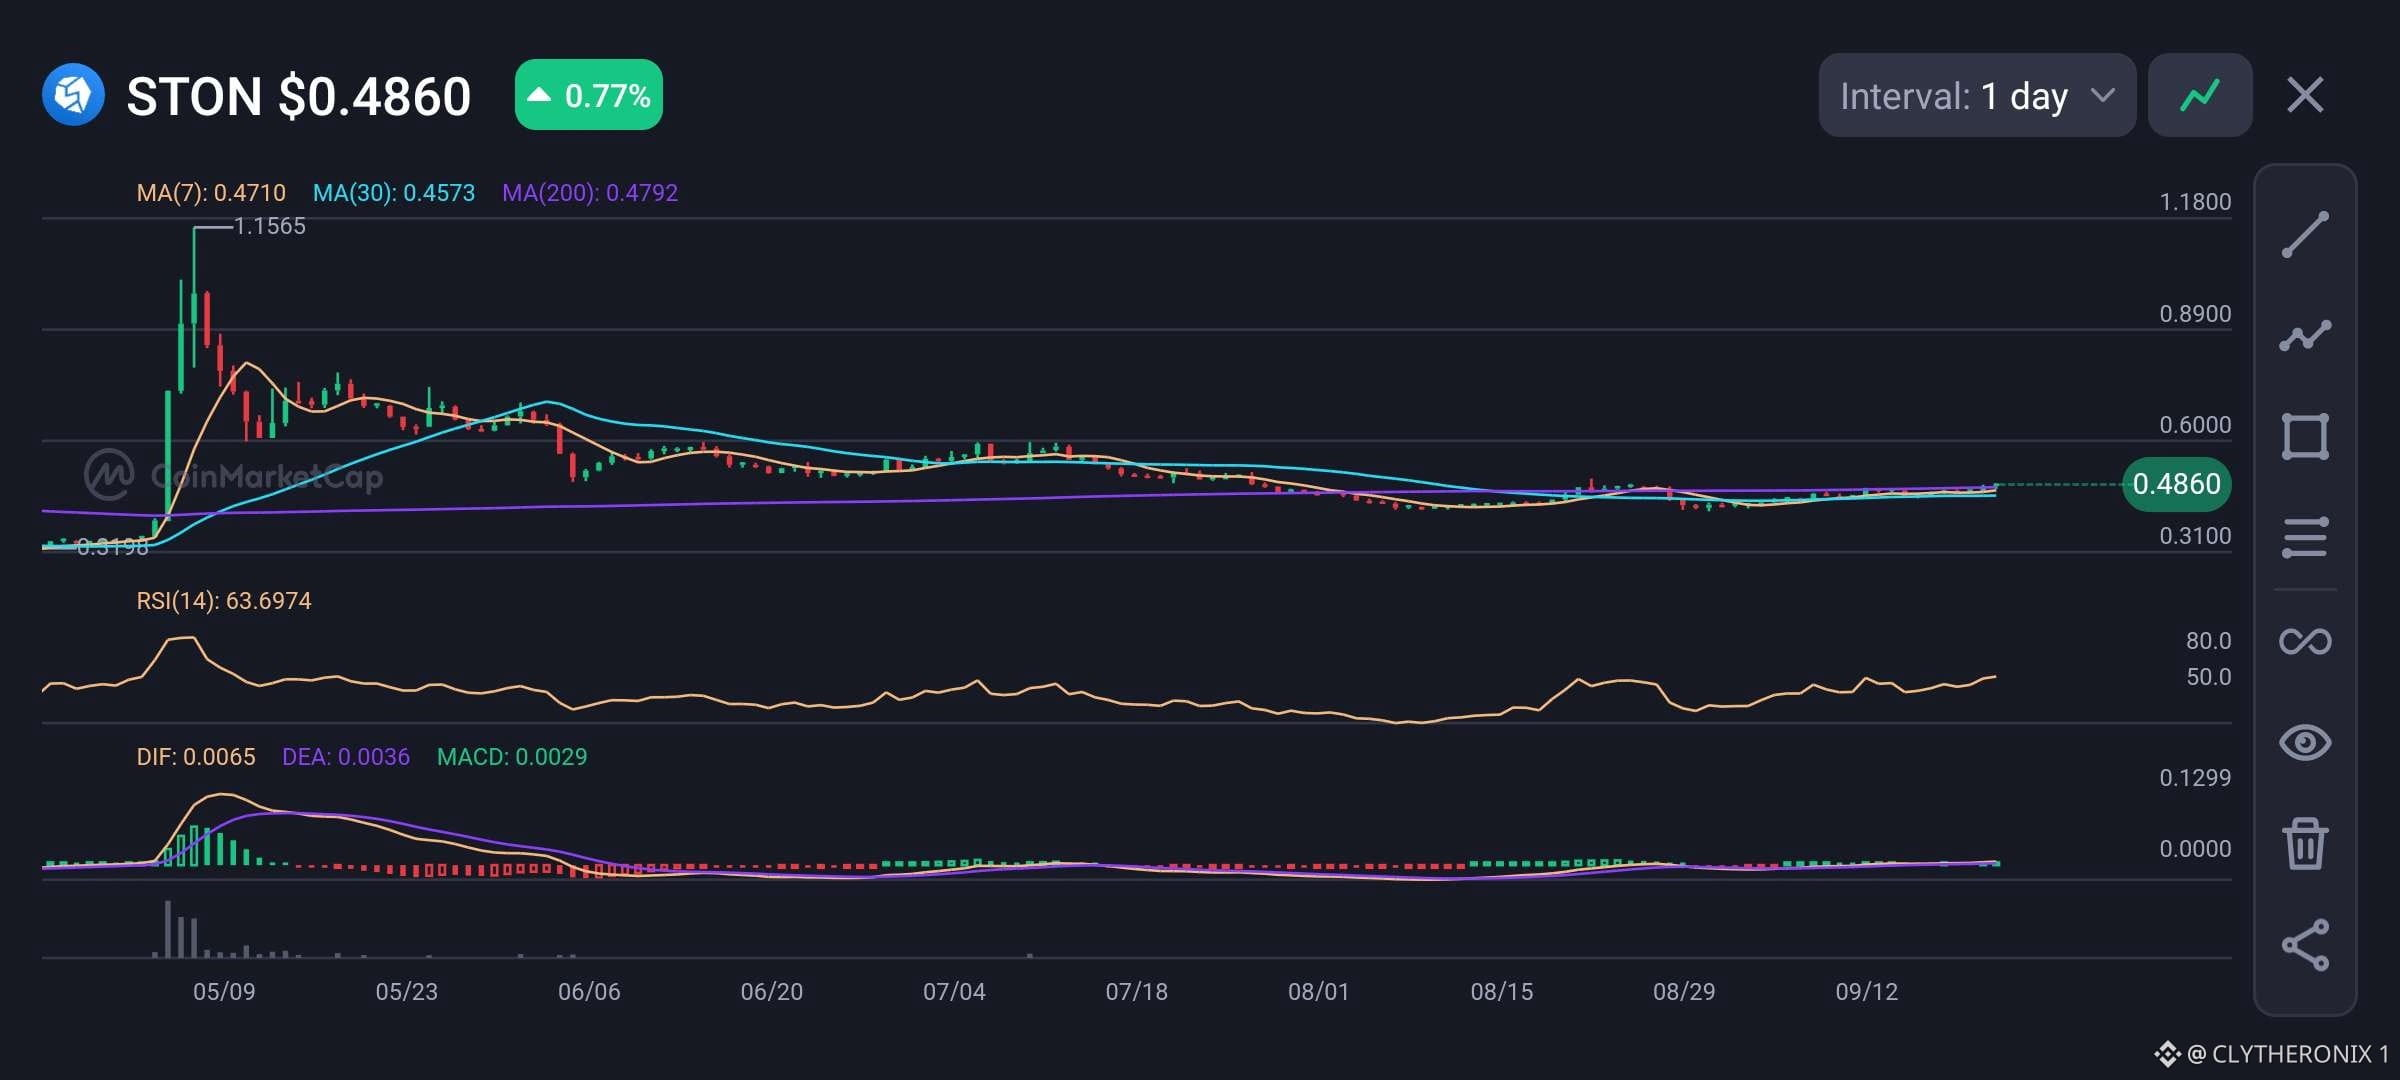
$STON is the utility token of STON.fi, a decentralized exchange built on the TON blockchain. At around $0.486, $STON is showing a modest daily gain.
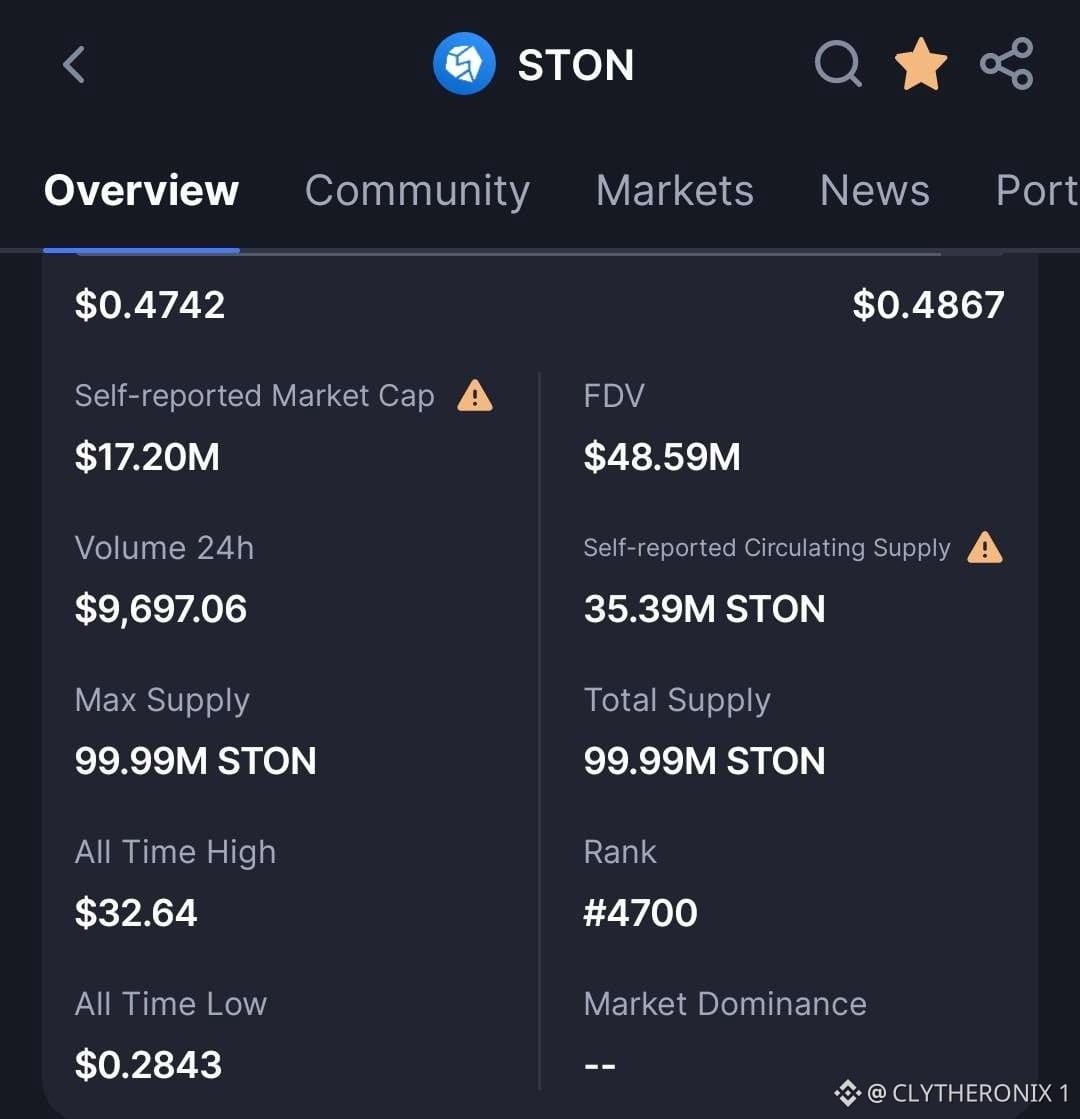
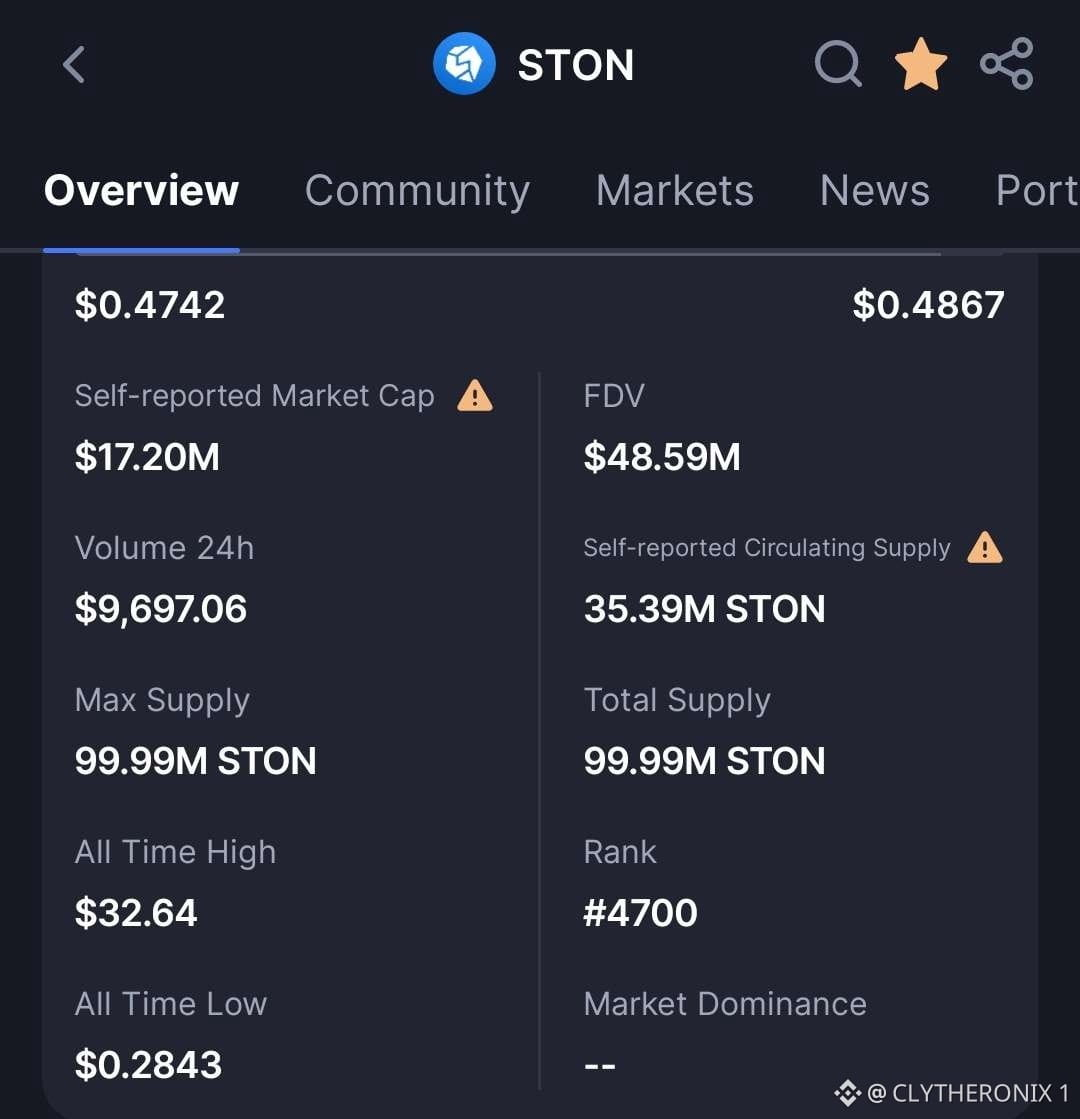
Its market capitalization is about $17.20 million, while its fully diluted valuation is $48.59 million.
The circulating supply is 35.39 million out of a total supply of 99.99 million.
SOCIAL ACTIVITY AND PRICE ACTION
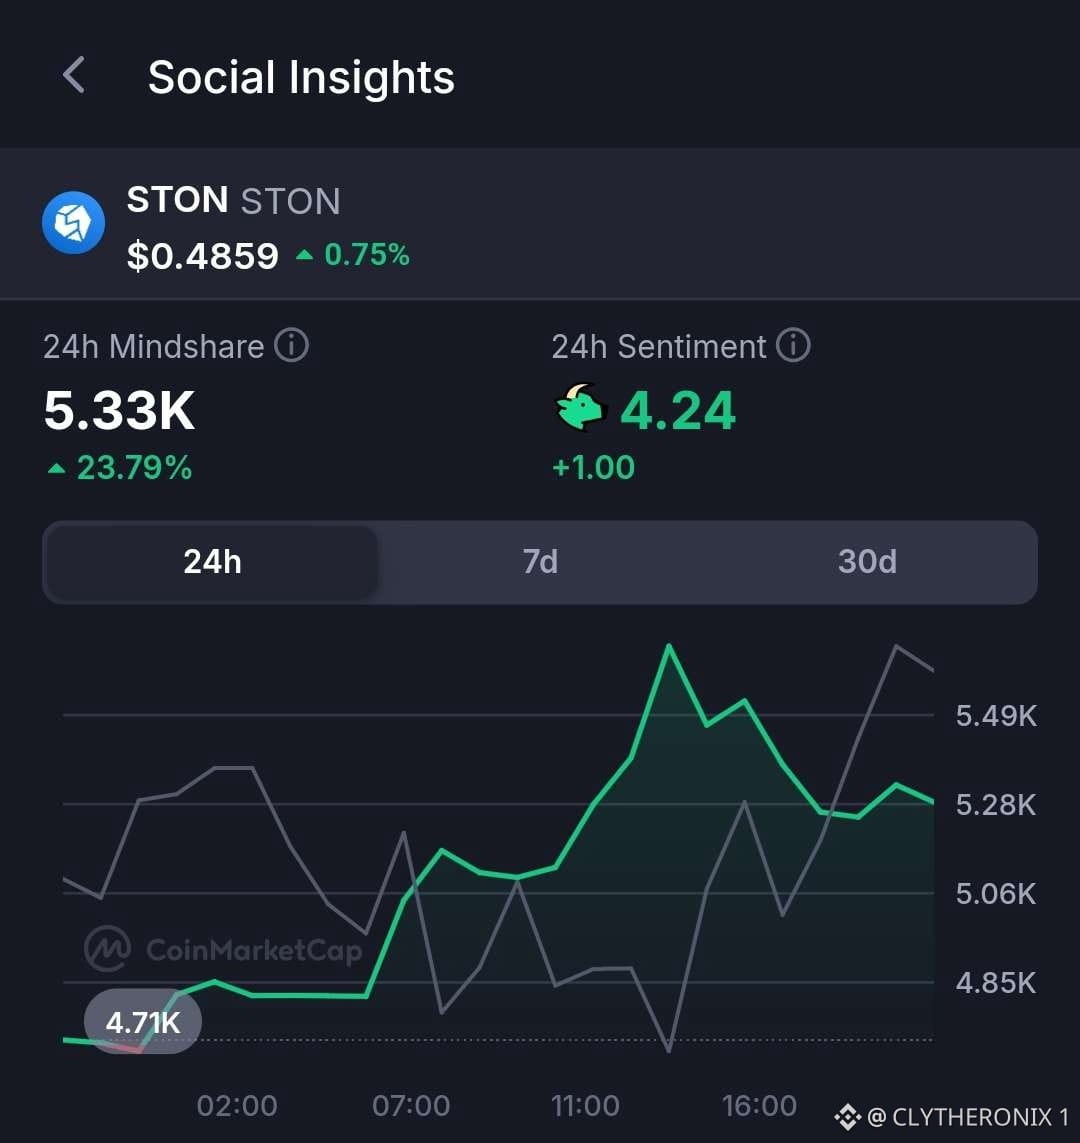
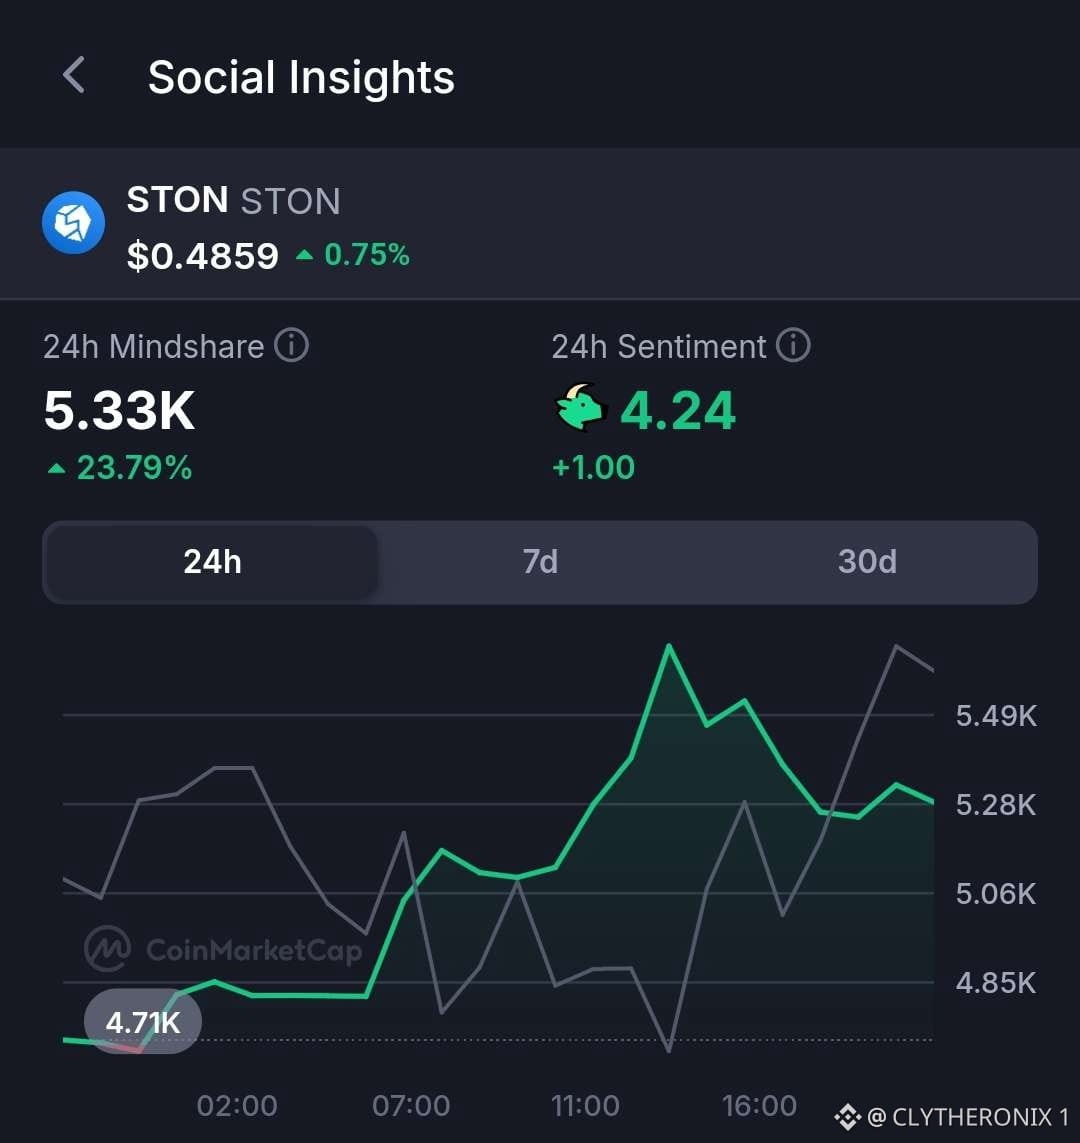
Trading volume remains modest, but social interest in STON has increased by 23.79% in the last 24 hours. Sentiment currently stands at 4.24.
On the daily chart, STON has been consolidating after its earlier decline. The price is holding above key moving averages, while the RSI is around 64, showing that momentum has improved.
STON.FI AND TON
STONfi allows users to swap tokens with low fees and connects easily with wallets on TON. $STON holders can also participate in governance through staking.
As TON continues to grow, more users could bring more activity to decentralized exchanges such as STON.fi. This could also create more attention around tokens such as $STON and $GRAM.
The improving chart structure and rising social interest make STON a token worth watching within the TON ecosystem. However, its relatively low trading volume and market capitalization mean that the token can still experience strong price movements.
NFA.
STON TOKEN: STON.FI AND THE GROWING TON ECOSYSTEM
CURRENT MARKET POSITION
$STON is the utility token of STON.fi, a decentralized exchange built on the TON blockchain. At around $0.486, $STON is showing a modest daily gain.
Its market capitalization is about $17.20 million, while its fully diluted valuation is $48.59 million.
The circulating supply is 35.39 million out of a total supply of 99.99 million.
SOCIAL ACTIVITY AND PRICE ACTION
Trading volume remains modest, but social interest in STON has increased by 23.79% in the last 24 hours. Sentiment currently stands at 4.24.
On the daily chart, STON has been consolidating after its earlier decline. The price is holding above key moving averages, while the RSI is around 64, showing that momentum has improved.
STON.FI AND TON
STONfi allows users to swap tokens with low fees and connects easily with wallets on TON. $STON holders can also participate in governance through staking.
As TON continues to grow, more users could bring more activity to decentralized exchanges such as STON.fi. This could also create more attention around tokens such as $STON and $GRAM.
The improving chart structure and rising social interest make STON a token worth watching within the TON ecosystem. However, its relatively low trading volume and market capitalization mean that the token can still experience strong price movements.
NFA.
CURRENT MARKET POSITION
$STON is the utility token of STON.fi, a decentralized exchange built on the TON blockchain. At around $0.486, $STON is showing a modest daily gain.
Its market capitalization is about $17.20 million, while its fully diluted valuation is $48.59 million.
The circulating supply is 35.39 million out of a total supply of 99.99 million.
SOCIAL ACTIVITY AND PRICE ACTION
Trading volume remains modest, but social interest in STON has increased by 23.79% in the last 24 hours. Sentiment currently stands at 4.24.
On the daily chart, STON has been consolidating after its earlier decline. The price is holding above key moving averages, while the RSI is around 64, showing that momentum has improved.
STON.FI AND TON
STONfi allows users to swap tokens with low fees and connects easily with wallets on TON. $STON holders can also participate in governance through staking.
As TON continues to grow, more users could bring more activity to decentralized exchanges such as STON.fi. This could also create more attention around tokens such as $STON and $GRAM.
The improving chart structure and rising social interest make STON a token worth watching within the TON ecosystem. However, its relatively low trading volume and market capitalization mean that the token can still experience strong price movements.
NFA.
42
См. перевод
$STON: STON.FI AND THE GROWING TON ECOSYSTEM
CURRENT MARKET POSITION
$STON is the utility token of STON.fi, a decentralized exchange built on the TON blockchain. At around $0.486, $STON is showing a modest daily gain. Its market capitalization is about $17.20 million, while its fully diluted valuation is $48.59 million.
The circulating supply is 35.39 million out of a total supply of 99.99 million.
SOCIAL ACTIVITY AND PRICE ACTION
Trading volume remains modest, but social interest in $STON has increased by 23.79% in the last 24 hours. Sentiment currently stands at 4.24.
On the daily chart, $STON has been consolidating after its earlier decline. The price is holding above key moving averages, while the RSI is around 64, showing that momentum has improved.
STON.FI AND TON
STON.fi allows users to swap tokens with low fees and connects easily with wallets on TON. $STON holders can also participate in governance through staking.
As TON continues to grow, more users could bring more activity to decentralized exchanges such as STON.fi. This could also create more attention around tokens such as $STON and $GRAM.
WHAT TO WATCH
The improving chart structure and rising social interest make $STON a token worth watching within the TON ecosystem. However, its relatively low trading volume and market capitalization mean that the token can still experience strong price movements.
For now, the key areas to watch are TON adoption, STON.fi activity, $STON liquidity, and growing interest around $GRAM.
$STON: STON.FI AND THE GROWING TON ECOSYSTEM
CURRENT MARKET POSITION
$STON is the utility token of STON.fi, a decentralized exchange built on the TON blockchain. At around $0.486, $STON is showing a modest daily gain. Its market capitalization is about $17.20 million, while its fully diluted valuation is $48.59 million.
The circulating supply is 35.39 million out of a total supply of 99.99 million.
SOCIAL ACTIVITY AND PRICE ACTION
Trading volume remains modest, but social interest in $STON has increased by 23.79% in the last 24 hours. Sentiment currently stands at 4.24.
On the daily chart, $STON has been consolidating after its earlier decline. The price is holding above key moving averages, while the RSI is around 64, showing that momentum has improved.
STON.FI AND TON
STON.fi allows users to swap tokens with low fees and connects easily with wallets on TON. $STON holders can also participate in governance through staking.
As TON continues to grow, more users could bring more activity to decentralized exchanges such as STON.fi. This could also create more attention around tokens such as $STON and $GRAM.
WHAT TO WATCH
The improving chart structure and rising social interest make $STON a token worth watching within the TON ecosystem. However, its relatively low trading volume and market capitalization mean that the token can still experience strong price movements.
For now, the key areas to watch are TON adoption, STON.fi activity, $STON liquidity, and growing interest around $GRAM.
CURRENT MARKET POSITION
$STON is the utility token of STON.fi, a decentralized exchange built on the TON blockchain. At around $0.486, $STON is showing a modest daily gain. Its market capitalization is about $17.20 million, while its fully diluted valuation is $48.59 million.
The circulating supply is 35.39 million out of a total supply of 99.99 million.
SOCIAL ACTIVITY AND PRICE ACTION
Trading volume remains modest, but social interest in $STON has increased by 23.79% in the last 24 hours. Sentiment currently stands at 4.24.
On the daily chart, $STON has been consolidating after its earlier decline. The price is holding above key moving averages, while the RSI is around 64, showing that momentum has improved.
STON.FI AND TON
STON.fi allows users to swap tokens with low fees and connects easily with wallets on TON. $STON holders can also participate in governance through staking.
As TON continues to grow, more users could bring more activity to decentralized exchanges such as STON.fi. This could also create more attention around tokens such as $STON and $GRAM.
WHAT TO WATCH
The improving chart structure and rising social interest make $STON a token worth watching within the TON ecosystem. However, its relatively low trading volume and market capitalization mean that the token can still experience strong price movements.
For now, the key areas to watch are TON adoption, STON.fi activity, $STON liquidity, and growing interest around $GRAM.
47
См. перевод
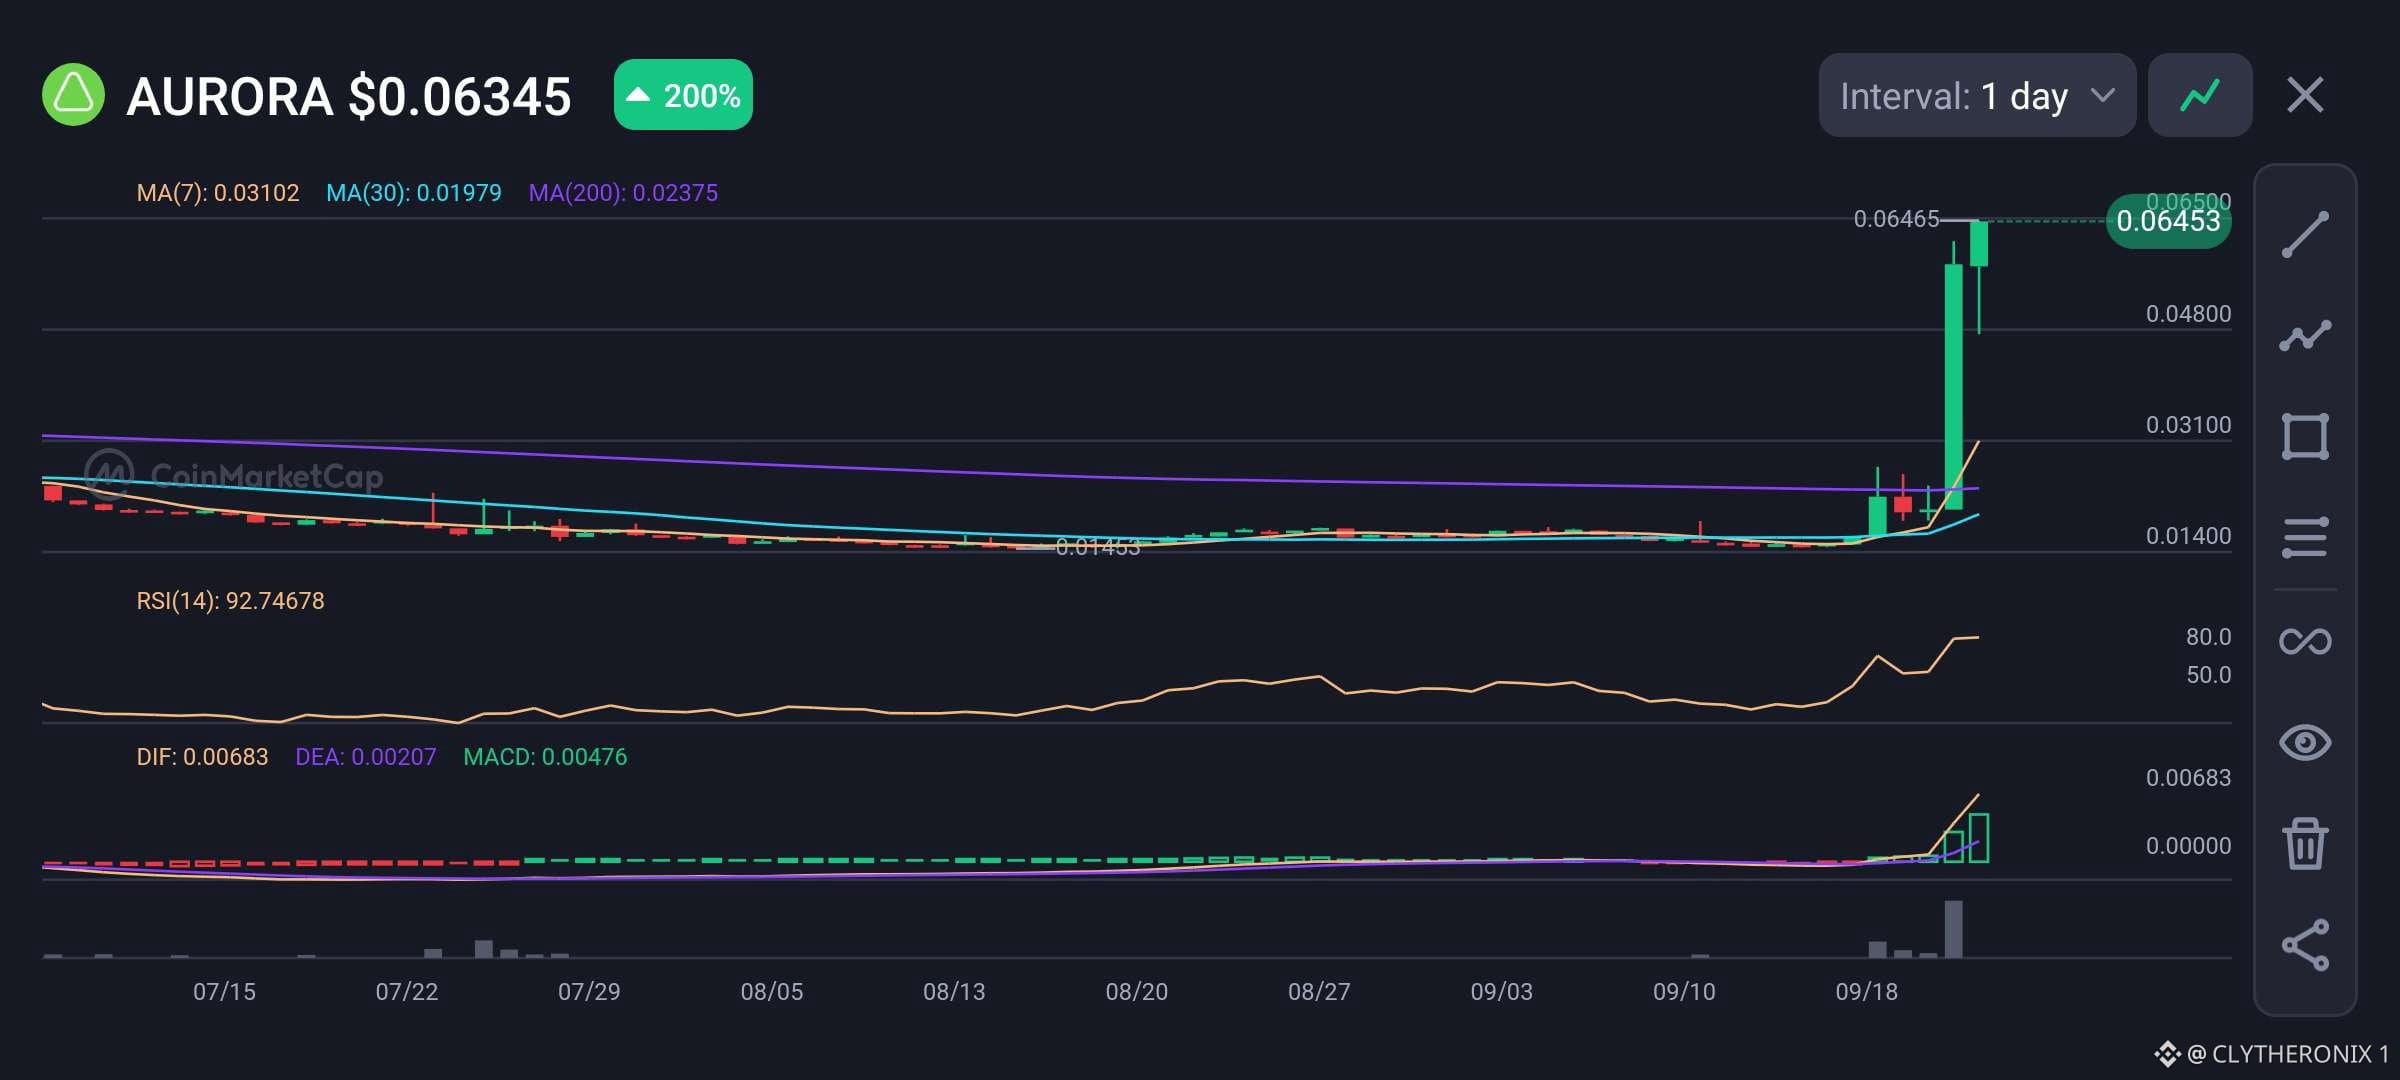
Aurora is up 191.56% to $0.0616 in 24h, massively outperforming a broader market up 1.07% and driven primarily by a surge in ecosystem utility.
The move is independent of Bitcoin's modest 1.56% gain, indicating strong coin-specific alpha.
1. Primary reason:
Major ecosystem catalyst, as Aurora Intents, processed over $19 million for a high-profile Zcash NFT auction, demonstrating real demand and utility.
2. Secondary reasons:
A supportive risk-on environment for altcoins, with market sentiment in "Greed" territory and capital rotating into smaller caps.
Near-term market outlook: If $AURORA holds
above $0.06, it could extend toward $0.075; a break below $0.045 risks a sharp correction as speculative momentum cools.
Keep an eye on $AURORA, I will not enter any trade for now, buts its a gem to watch out for. NFA.
Aurora is up 191.56% to $0.0616 in 24h, massively outperforming a broader market up 1.07% and driven primarily by a surge in ecosystem utility.
The move is independent of Bitcoin's modest 1.56% gain, indicating strong coin-specific alpha.
1. Primary reason:
Major ecosystem catalyst, as Aurora Intents, processed over $19 million for a high-profile Zcash NFT auction, demonstrating real demand and utility.
2. Secondary reasons:
A supportive risk-on environment for altcoins, with market sentiment in "Greed" territory and capital rotating into smaller caps.
Near-term market outlook: If $AURORA holds
above $0.06, it could extend toward $0.075; a break below $0.045 risks a sharp correction as speculative momentum cools.
Keep an eye on $AURORA, I will not enter any trade for now, buts its a gem to watch out for. NFA.
The move is independent of Bitcoin's modest 1.56% gain, indicating strong coin-specific alpha.
1. Primary reason:
Major ecosystem catalyst, as Aurora Intents, processed over $19 million for a high-profile Zcash NFT auction, demonstrating real demand and utility.
2. Secondary reasons:
A supportive risk-on environment for altcoins, with market sentiment in "Greed" territory and capital rotating into smaller caps.
Near-term market outlook: If $AURORA holds
above $0.06, it could extend toward $0.075; a break below $0.045 risks a sharp correction as speculative momentum cools.
Keep an eye on $AURORA, I will not enter any trade for now, buts its a gem to watch out for. NFA.
54
СТРУКТУРА РЫНКА БИТКОИНА.
$BTC снова выше $80 000, но следующее движение нуждается в подтверждении.
Движение цены показывает, что покупатели отстаивают восстановление, а шорт-сквиз добавил сильный импульс.
Ключевой уровень, за которым стоит следить, — это $80K. Удержание выше этого уровня может поддержать еще один подъём, тогда как явный отказ может отправить BTC обратно к недавней поддержке.
Теперь, $ETH тоже восстанавливается, но сохраняющаяся слабость притоков в ETF остается причиной для беспокойства.
При этом $SOL продолжает демонстрировать более сильный импульс, поскольку покупатели толкают цену к недавним максимумам.
Пока что BTC должен удержать $80K и сформировать более высокие минимумы, прежде чем более широкий рынок сможет подтвердить устойчивую бычью структуру.
#Анализ цены BTC#
СТРУКТУРА РЫНКА БИТКОИНА.
$BTC снова выше $80 000, но следующее движение нуждается в подтверждении.
Движение цены показывает, что покупатели отстаивают восстановление, а шорт-сквиз добавил сильный импульс.
Ключевой уровень, за которым стоит следить, — это $80K. Удержание выше этого уровня может поддержать еще один подъём, тогда как явный отказ может отправить BTC обратно к недавней поддержке.
Теперь, $ETH тоже восстанавливается, но сохраняющаяся слабость притоков в ETF остается причиной для беспокойства.
При этом $SOL продолжает демонстрировать более сильный импульс, поскольку покупатели толкают цену к недавним максимумам.
Пока что BTC должен удержать $80K и сформировать более высокие минимумы, прежде чем более широкий рынок сможет подтвердить устойчивую бычью структуру.
#Анализ цены BTC#
$BTC снова выше $80 000, но следующее движение нуждается в подтверждении.
Движение цены показывает, что покупатели отстаивают восстановление, а шорт-сквиз добавил сильный импульс.
Ключевой уровень, за которым стоит следить, — это $80K. Удержание выше этого уровня может поддержать еще один подъём, тогда как явный отказ может отправить BTC обратно к недавней поддержке.
Теперь, $ETH тоже восстанавливается, но сохраняющаяся слабость притоков в ETF остается причиной для беспокойства.
При этом $SOL продолжает демонстрировать более сильный импульс, поскольку покупатели толкают цену к недавним максимумам.
Пока что BTC должен удержать $80K и сформировать более высокие минимумы, прежде чем более широкий рынок сможет подтвердить устойчивую бычью структуру.
#Анализ цены BTC#
55
Celer Network наконец-то просыпается.
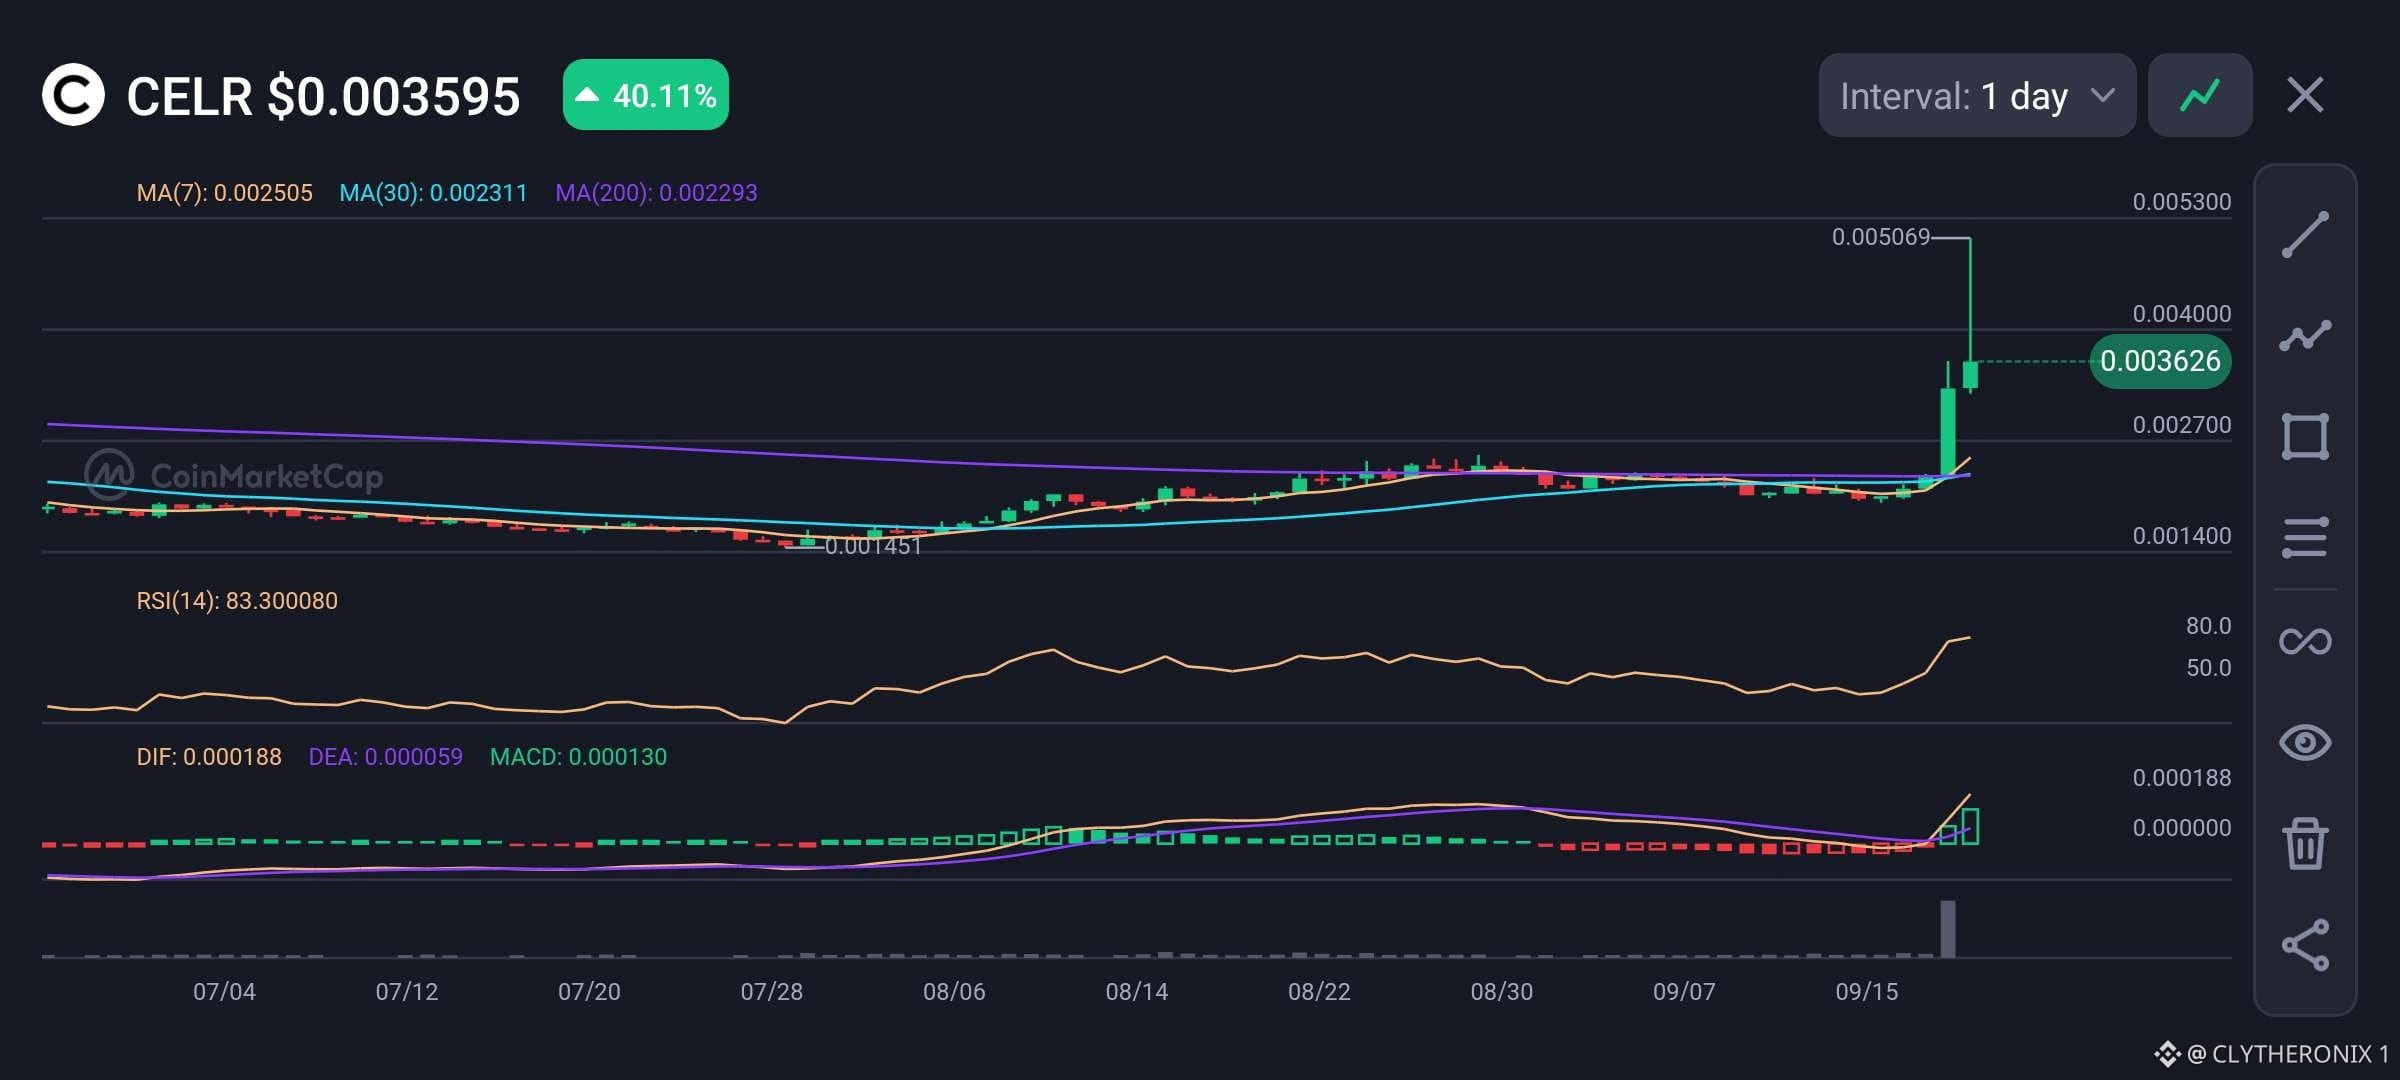
Celer Network вырос сегодня более чем на 40%, цена сейчас около $0.0036 после резкого прорыва после долгого периода консолидации.
Этот рост вывел CELR далеко выше его 7-дневной, 30-дневной и 200-дневной скользящих средних, показывая явный сдвиг в импульсе.
График становится интересным. MACD резко ушёл в положительную зону, а гистограмма расширяется, при этом объёмы резко увеличились.
RSI около 83, так что краткосрочный откат после такого быстрого движения не был бы удивительным.
$CELR уже достиг $0.00507. Если покупатели смогут удержать прорыв и закрепиться выше $0.0040, на горизонте может оказаться ещё один рывок к недавнему максимуму.
Импульс вернулся, и $CELR стоит держать в поле зрения.
Celer Network наконец-то просыпается.
Celer Network вырос сегодня более чем на 40%, цена сейчас около $0.0036 после резкого прорыва после долгого периода консолидации.
Этот рост вывел CELR далеко выше его 7-дневной, 30-дневной и 200-дневной скользящих средних, показывая явный сдвиг в импульсе.
График становится интересным. MACD резко ушёл в положительную зону, а гистограмма расширяется, при этом объёмы резко увеличились.
RSI около 83, так что краткосрочный откат после такого быстрого движения не был бы удивительным.
$CELR уже достиг $0.00507. Если покупатели смогут удержать прорыв и закрепиться выше $0.0040, на горизонте может оказаться ещё один рывок к недавнему максимуму.
Импульс вернулся, и $CELR стоит держать в поле зрения.
Celer Network вырос сегодня более чем на 40%, цена сейчас около $0.0036 после резкого прорыва после долгого периода консолидации.
Этот рост вывел CELR далеко выше его 7-дневной, 30-дневной и 200-дневной скользящих средних, показывая явный сдвиг в импульсе.
График становится интересным. MACD резко ушёл в положительную зону, а гистограмма расширяется, при этом объёмы резко увеличились.
RSI около 83, так что краткосрочный откат после такого быстрого движения не был бы удивительным.
$CELR уже достиг $0.00507. Если покупатели смогут удержать прорыв и закрепиться выше $0.0040, на горизонте может оказаться ещё один рывок к недавнему максимуму.
Импульс вернулся, и $CELR стоит держать в поле зрения.
52
См. перевод
Celer Network is finally waking up.
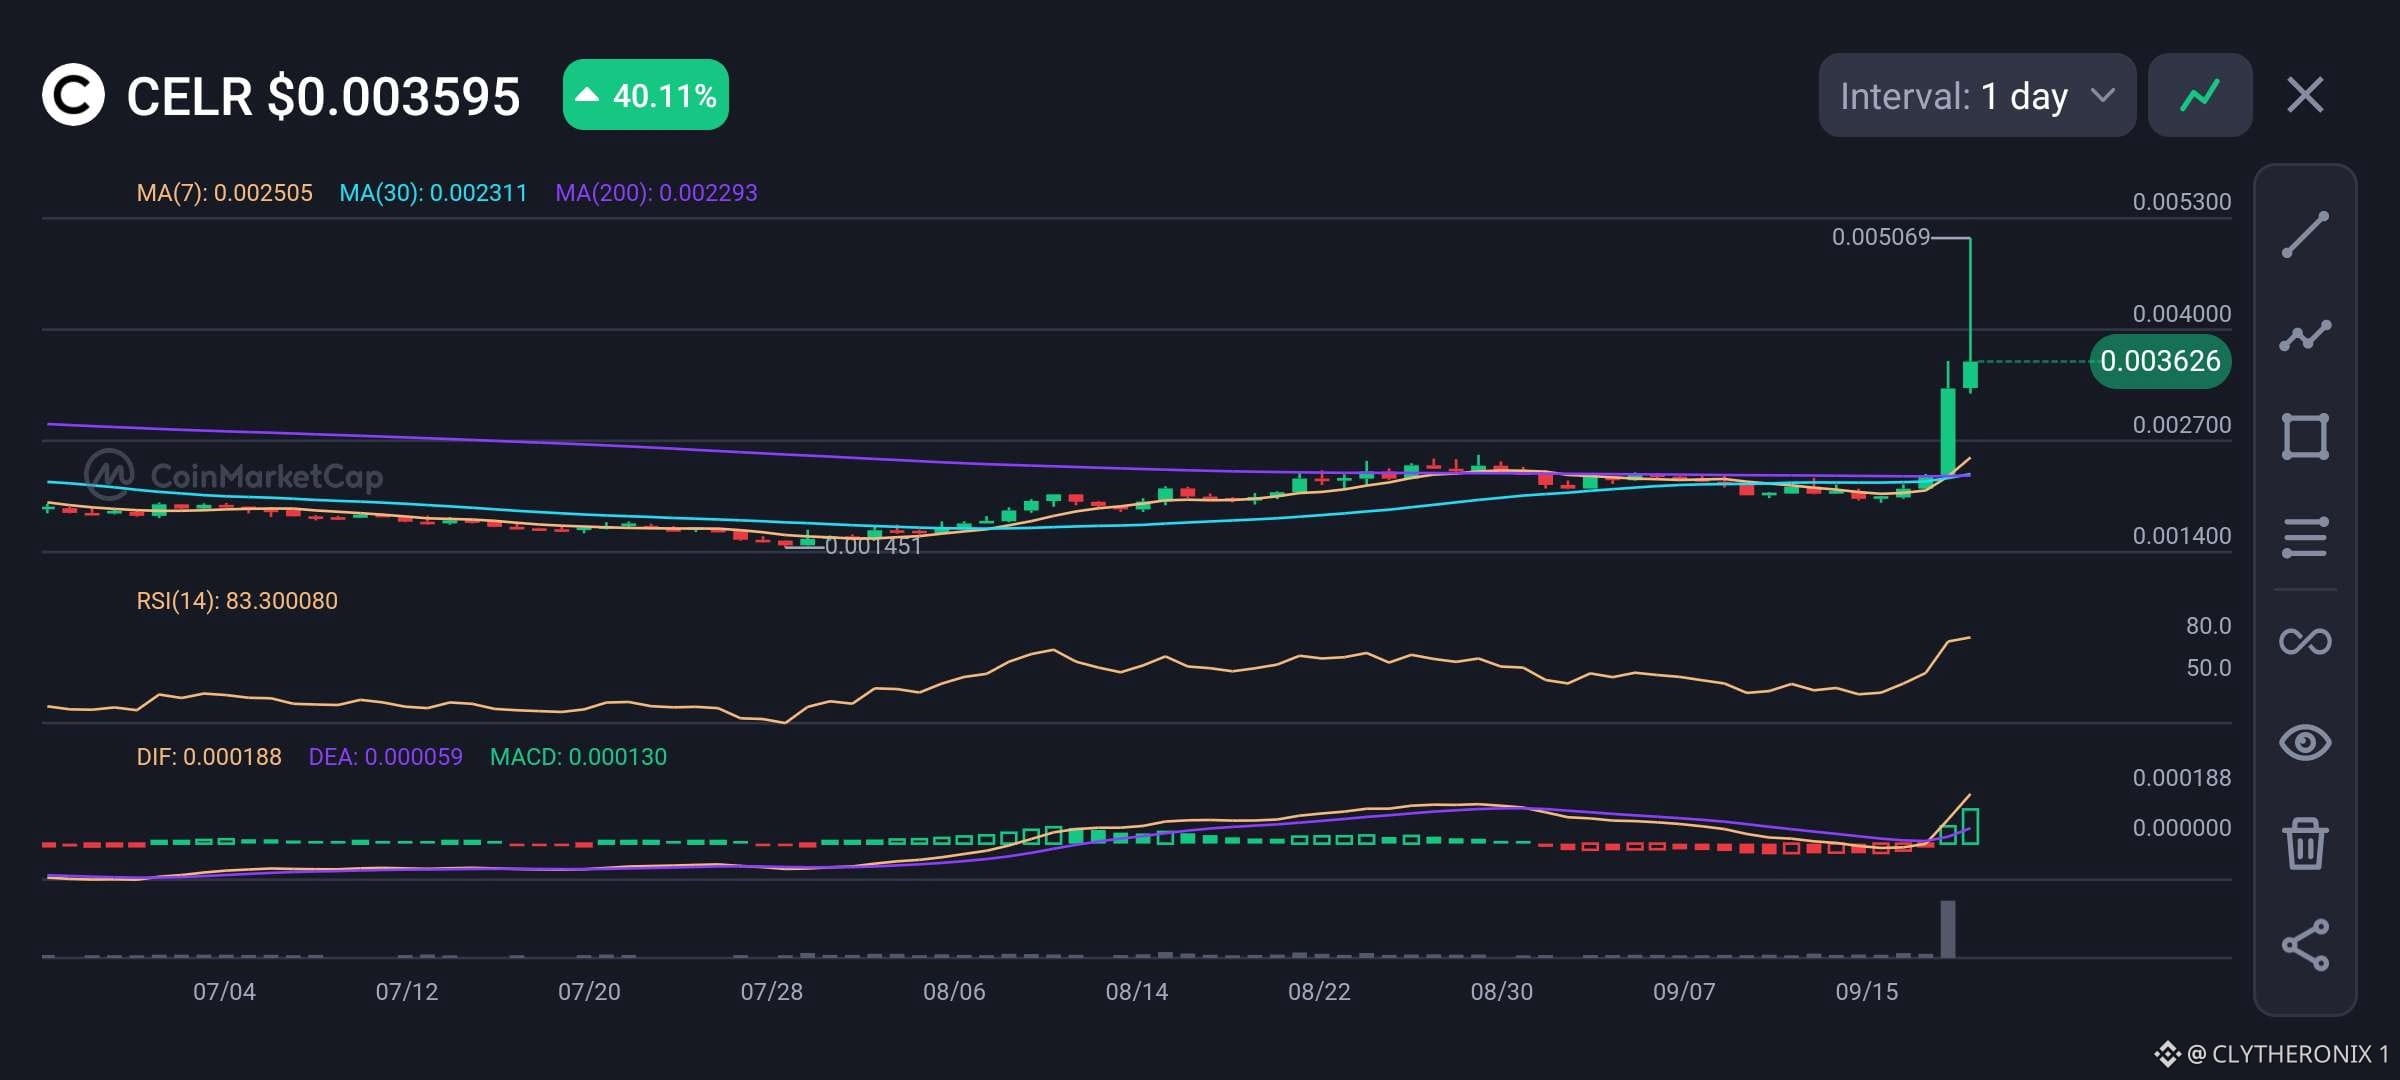
Celer Network is up over 40% today, with price around $0.0036 after a sharp breakout from a long period of consolidation.
This pump has pushed CELR well above its 7 day, 30 day and 200 day moving averages, showing a clear shift in momentum.
The chart is getting interesting. MACD has turned strongly positive, and the histogram is expanding, while volume has picked up sharply.
RSI is around 83, so a short term pullback would not be surprising after such a fast move.
$CELR has already reached $0.00507. If buyers can hold the breakout and build above $0.0040, another push toward the recent high could be on the table.
The momentum is back, and $CELR is one to watch.
Celer Network is finally waking up.
Celer Network is up over 40% today, with price around $0.0036 after a sharp breakout from a long period of consolidation.
This pump has pushed CELR well above its 7 day, 30 day and 200 day moving averages, showing a clear shift in momentum.
The chart is getting interesting. MACD has turned strongly positive, and the histogram is expanding, while volume has picked up sharply.
RSI is around 83, so a short term pullback would not be surprising after such a fast move.
$CELR has already reached $0.00507. If buyers can hold the breakout and build above $0.0040, another push toward the recent high could be on the table.
The momentum is back, and $CELR is one to watch.
Celer Network is up over 40% today, with price around $0.0036 after a sharp breakout from a long period of consolidation.
This pump has pushed CELR well above its 7 day, 30 day and 200 day moving averages, showing a clear shift in momentum.
The chart is getting interesting. MACD has turned strongly positive, and the histogram is expanding, while volume has picked up sharply.
RSI is around 83, so a short term pullback would not be surprising after such a fast move.
$CELR has already reached $0.00507. If buyers can hold the breakout and build above $0.0040, another push toward the recent high could be on the table.
The momentum is back, and $CELR is one to watch.
60
См. перевод
AKE is making a serious move, and the chart is starting to tell a bullish story.
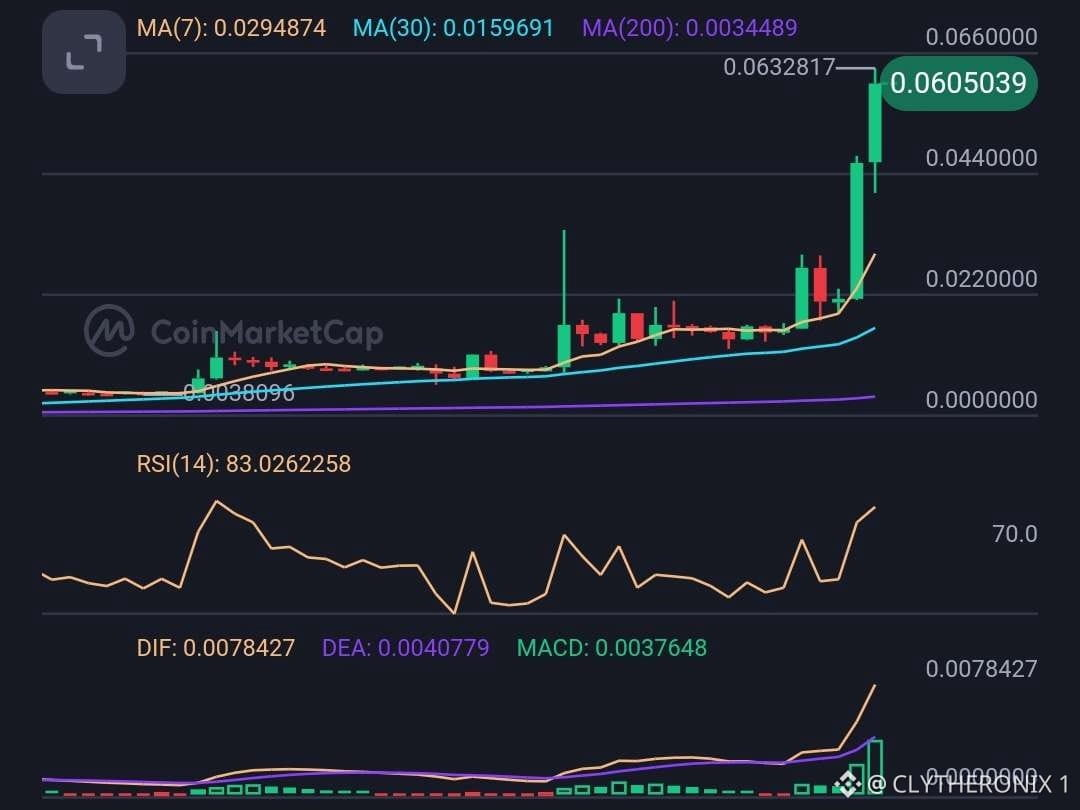
$AKE is trading around $0.0605 after a strong breakout, with price now sitting far above the 7 day, 30-day, and 200-day moving averages. The 7 day MA is around $0.0295, while the 30-day sits near $0.0160. That gap shows how quickly momentum has picked up.
RSI is at 83, so the move is overheated in the short term, and a pullback would not be surprising. But MACD is strongly positive and expanding, showing strong buying momentum.
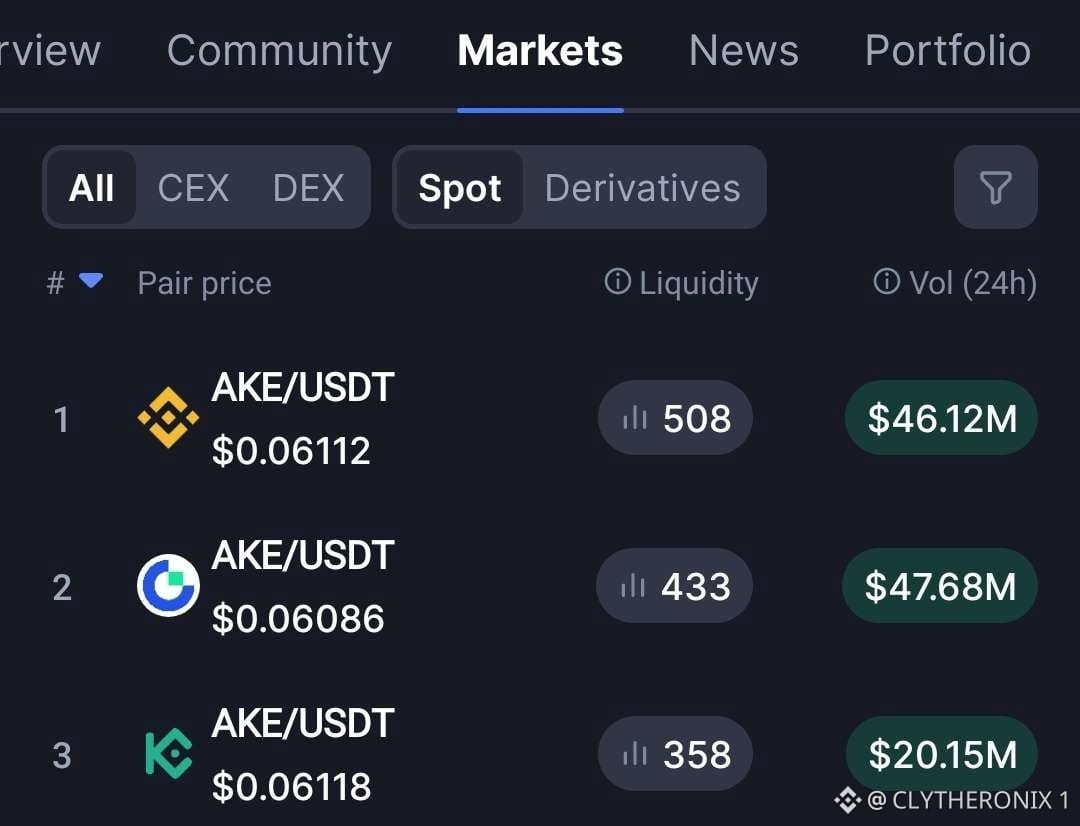
Market activity is also impressive. $AKE/ $USDT pairs are showing more than $100M in combined 24-hour volume across leading markets.
If AKE holds above $0.044 and breaks the $0.0633 high. The bullish momentum could continue.
AKE is making a serious move, and the chart is starting to tell a bullish story.
$AKE is trading around $0.0605 after a strong breakout, with price now sitting far above the 7 day, 30-day, and 200-day moving averages. The 7 day MA is around $0.0295, while the 30-day sits near $0.0160. That gap shows how quickly momentum has picked up.
RSI is at 83, so the move is overheated in the short term, and a pullback would not be surprising. But MACD is strongly positive and expanding, showing strong buying momentum.
Market activity is also impressive. $AKE/ $USDT pairs are showing more than $100M in combined 24-hour volume across leading markets.
If AKE holds above $0.044 and breaks the $0.0633 high. The bullish momentum could continue.
$AKE is trading around $0.0605 after a strong breakout, with price now sitting far above the 7 day, 30-day, and 200-day moving averages. The 7 day MA is around $0.0295, while the 30-day sits near $0.0160. That gap shows how quickly momentum has picked up.
RSI is at 83, so the move is overheated in the short term, and a pullback would not be surprising. But MACD is strongly positive and expanding, showing strong buying momentum.
Market activity is also impressive. $AKE/ $USDT pairs are showing more than $100M in combined 24-hour volume across leading markets.
If AKE holds above $0.044 and breaks the $0.0633 high. The bullish momentum could continue.
60
Биткоин держится около $77.6K, и график снова начинает выглядеть интересно.
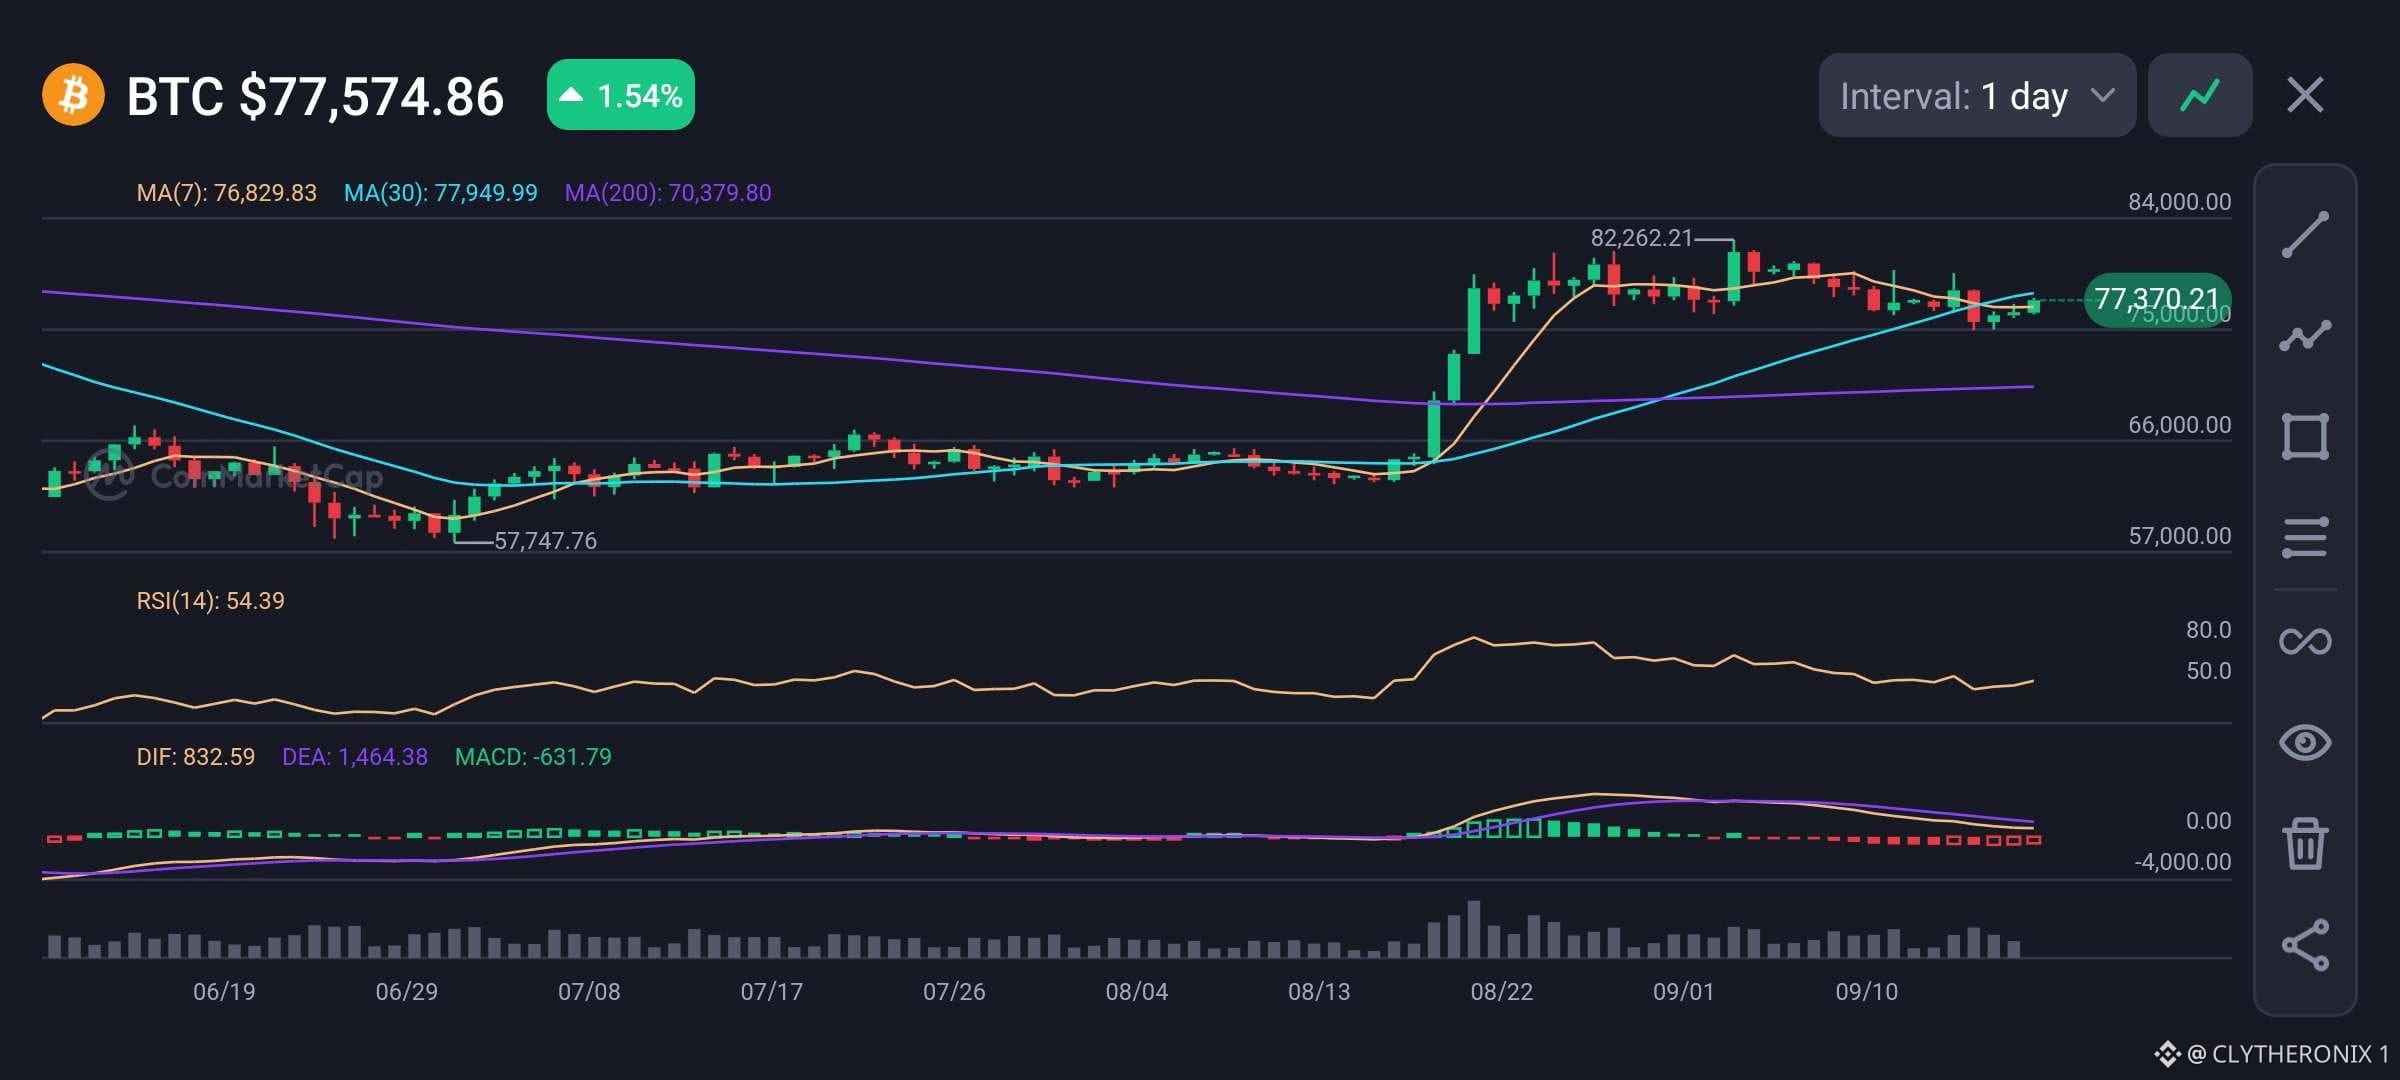
После пробоя к локальному максимуму около $82.3K, $BTC уже несколько недель консолидируется. Цена сейчас снова выше 7-дневной MA на уровне $76.8K и близка к 30-дневной MA примерно на $77.9K, тогда как 200-дневная MA находится заметно ниже — около $70.4K.
RSI около 54, оставляя пространство для ещё одного движения, не выглядя при этом перегретым.
MACD всё ещё в отрицательной зоне, но давление продавцов, похоже, ослабевает.
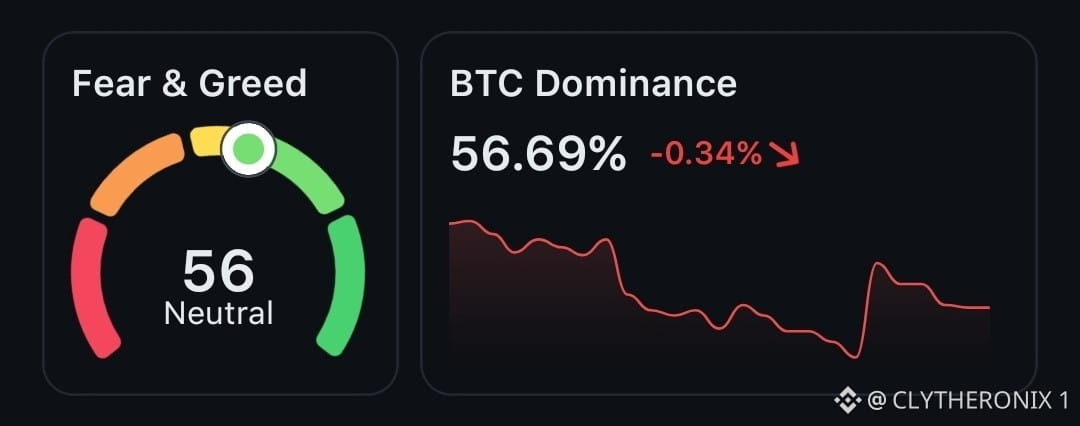
Теперь важна и более общая картина. Fear & Greed нейтральна на 56, а доминирование BTC снизилось до 56.69%. Если BTC вернёт $78K и начнёт строиться выше него, может снова появиться фокус на ретесте $82K.
Так что на данный момент ключевой вопрос — смогут ли покупатели превратить эту консолидацию в следующий пробой. Я буду наблюдать со стороны и, безусловно, не буду торговать этот сетап пока.
#BTC Price Analysis#
Биткоин держится около $77.6K, и график снова начинает выглядеть интересно.
После пробоя к локальному максимуму около $82.3K, $BTC уже несколько недель консолидируется. Цена сейчас снова выше 7-дневной MA на уровне $76.8K и близка к 30-дневной MA примерно на $77.9K, тогда как 200-дневная MA находится заметно ниже — около $70.4K.
RSI около 54, оставляя пространство для ещё одного движения, не выглядя при этом перегретым.
MACD всё ещё в отрицательной зоне, но давление продавцов, похоже, ослабевает.
Теперь важна и более общая картина. Fear & Greed нейтральна на 56, а доминирование BTC снизилось до 56.69%. Если BTC вернёт $78K и начнёт строиться выше него, может снова появиться фокус на ретесте $82K.
Так что на данный момент ключевой вопрос — смогут ли покупатели превратить эту консолидацию в следующий пробой. Я буду наблюдать со стороны и, безусловно, не буду торговать этот сетап пока.
#BTC Price Analysis#
После пробоя к локальному максимуму около $82.3K, $BTC уже несколько недель консолидируется. Цена сейчас снова выше 7-дневной MA на уровне $76.8K и близка к 30-дневной MA примерно на $77.9K, тогда как 200-дневная MA находится заметно ниже — около $70.4K.
RSI около 54, оставляя пространство для ещё одного движения, не выглядя при этом перегретым.
MACD всё ещё в отрицательной зоне, но давление продавцов, похоже, ослабевает.
Теперь важна и более общая картина. Fear & Greed нейтральна на 56, а доминирование BTC снизилось до 56.69%. Если BTC вернёт $78K и начнёт строиться выше него, может снова появиться фокус на ретесте $82K.
Так что на данный момент ключевой вопрос — смогут ли покупатели превратить эту консолидацию в следующий пробой. Я буду наблюдать со стороны и, безусловно, не буду торговать этот сетап пока.
#BTC Price Analysis#
51
МЕЖЦЕПOЧЕЧНЫЙ ОБМЕН.
Межцепочечный обмен позволяет переместить актив с одной блокчейн-платформы на другой актив в другой блокчейн в рамках одного согласованного процесса. Вы начинаете с одного токена на его родной сети и заканчиваете другим токеном на отдельной сети, без необходимости выполнять несколько ручных шагов.
Блокчейны не имеют общей нативной информации о состоянии. Каждая сеть ведёт собственный независимый реестр и не может напрямую читать или проверять балансы в другой цепочке. Такая изоляция означает, что значение нельзя просто передать между ними без какого-либо слоя координации.
Обмены внутри одной цепочки проще. Оба актива находятся в одной сети, поэтому один смарт-контракт может мгновенно выполнить обмен. Межцепочечные обмены требуют дополнительных механизмов, потому что два реестра никогда не «разговаривают» друг с другом напрямую.
Существуют два распространённых подхода. Традиционные мосты часто блокируют активы на одной стороне и чеканят их обёрнутую версию на другой. Атомарные свопы используют криптографические блокировки, чтобы обе стороны сделки либо полностью завершились, либо полностью откатились назад, снижая потребность в большом общем пуле средств.
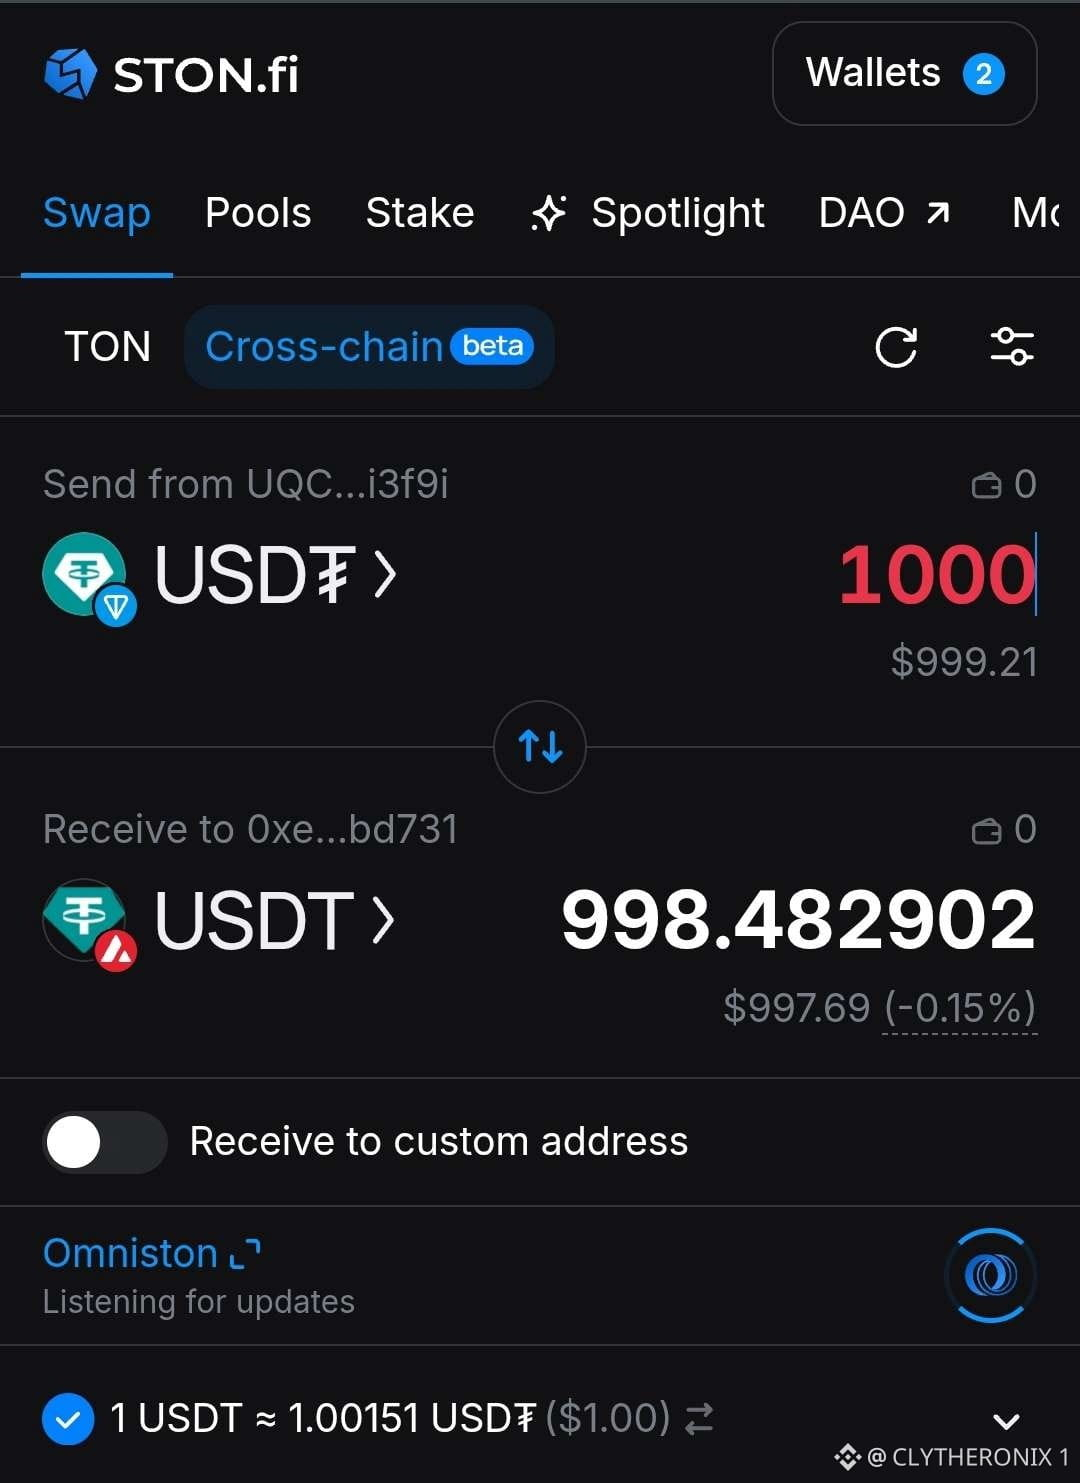
Например, обмен $USDT на $GRAM на $AAVA цепи соответственно. Omniston [https://ston.fi/omniston] предлагает одну практичную архитектуру. Она использует модель на основе резолверов (resolver) с хэшированными контрактами с таймлоками. Резолвер блокирует актив назначения, пока исходный актив пользователя заблокирован в своей цепочке. Оба контракта используют одну и ту же криптографическую условность. Когда условие выполнено, обе стороны рассчитываются по котируемому курсу.
Если что-то не сработает в пределах временного окна, блокировки истекают, и каждый актив автоматически возвращается. В итоге получается исход «всё или ничего» без посредника (custodian), который удерживает средства между сторонами.
Такая конструкция сохраняет процесс без доверительной стороны и фокусирует его на точном расчёте по заявленному курсу между цепочками.
#Macro Insights#
МЕЖЦЕПOЧЕЧНЫЙ ОБМЕН.
Межцепочечный обмен позволяет переместить актив с одной блокчейн-платформы на другой актив в другой блокчейн в рамках одного согласованного процесса. Вы начинаете с одного токена на его родной сети и заканчиваете другим токеном на отдельной сети, без необходимости выполнять несколько ручных шагов.
Блокчейны не имеют общей нативной информации о состоянии. Каждая сеть ведёт собственный независимый реестр и не может напрямую читать или проверять балансы в другой цепочке. Такая изоляция означает, что значение нельзя просто передать между ними без какого-либо слоя координации.
Обмены внутри одной цепочки проще. Оба актива находятся в одной сети, поэтому один смарт-контракт может мгновенно выполнить обмен. Межцепочечные обмены требуют дополнительных механизмов, потому что два реестра никогда не «разговаривают» друг с другом напрямую.
Существуют два распространённых подхода. Традиционные мосты часто блокируют активы на одной стороне и чеканят их обёрнутую версию на другой. Атомарные свопы используют криптографические блокировки, чтобы обе стороны сделки либо полностью завершились, либо полностью откатились назад, снижая потребность в большом общем пуле средств.
Например, обмен $USDT на $GRAM на $AAVA цепи соответственно. Omniston [https://ston.fi/omniston] предлагает одну практичную архитектуру. Она использует модель на основе резолверов (resolver) с хэшированными контрактами с таймлоками. Резолвер блокирует актив назначения, пока исходный актив пользователя заблокирован в своей цепочке. Оба контракта используют одну и ту же криптографическую условность. Когда условие выполнено, обе стороны рассчитываются по котируемому курсу.
Если что-то не сработает в пределах временного окна, блокировки истекают, и каждый актив автоматически возвращается. В итоге получается исход «всё или ничего» без посредника (custodian), который удерживает средства между сторонами.
Такая конструкция сохраняет процесс без доверительной стороны и фокусирует его на точном расчёте по заявленному курсу между цепочками.
#Macro Insights#
Межцепочечный обмен позволяет переместить актив с одной блокчейн-платформы на другой актив в другой блокчейн в рамках одного согласованного процесса. Вы начинаете с одного токена на его родной сети и заканчиваете другим токеном на отдельной сети, без необходимости выполнять несколько ручных шагов.
Блокчейны не имеют общей нативной информации о состоянии. Каждая сеть ведёт собственный независимый реестр и не может напрямую читать или проверять балансы в другой цепочке. Такая изоляция означает, что значение нельзя просто передать между ними без какого-либо слоя координации.
Обмены внутри одной цепочки проще. Оба актива находятся в одной сети, поэтому один смарт-контракт может мгновенно выполнить обмен. Межцепочечные обмены требуют дополнительных механизмов, потому что два реестра никогда не «разговаривают» друг с другом напрямую.
Существуют два распространённых подхода. Традиционные мосты часто блокируют активы на одной стороне и чеканят их обёрнутую версию на другой. Атомарные свопы используют криптографические блокировки, чтобы обе стороны сделки либо полностью завершились, либо полностью откатились назад, снижая потребность в большом общем пуле средств.
Например, обмен $USDT на $GRAM на $AAVA цепи соответственно. Omniston [https://ston.fi/omniston] предлагает одну практичную архитектуру. Она использует модель на основе резолверов (resolver) с хэшированными контрактами с таймлоками. Резолвер блокирует актив назначения, пока исходный актив пользователя заблокирован в своей цепочке. Оба контракта используют одну и ту же криптографическую условность. Когда условие выполнено, обе стороны рассчитываются по котируемому курсу.
Если что-то не сработает в пределах временного окна, блокировки истекают, и каждый актив автоматически возвращается. В итоге получается исход «всё или ничего» без посредника (custodian), который удерживает средства между сторонами.
Такая конструкция сохраняет процесс без доверительной стороны и фокусирует его на точном расчёте по заявленному курсу между цепочками.
#Macro Insights#
69
КАК ИЗБЕЖАТЬ РАСПРОСТРАНЁННЫХ СКАМОВ В DEFI.
DeFi даёт вам контроль над вашими активами, но это также значит, что нужно быть внимательным. Одно неверное нажатие или подпись может обойтись дорого.
Вот простые способы быть в безопасности:
• ПРОВЕРЯЙТЕ САЙТ. Фишинговые страницы могут выглядеть точно так же, как настоящие. Используйте официальные ссылки на проекты и добавляйте в закладки доверенные домены. Избегайте ссылок из случайных личных сообщений (DM).
• ПРОВЕРЯЙТЕ ТОКЕНЫ. Мошенники могут скопировать название токена, логотип и тикер. Перед покупкой или обменом всегда сверяйте адрес контракта из официального источника.
• БУДЬТЕ ОСТОРОЖНЫ С AIRDROPS (ДРОПАМИ). Неожиданный токен или DM по умолчанию не является подарком. Не нажимайте на подозрительные ссылки и не подключайте кошелёк только чтобы получить награду.
• ЗАЩИТИТЕ СВОИ КЛЮЧИ. Никогда не сообщайте seed-фразу (seed phrase) или приватный ключ. Перед тем как подписывать, прочитайте, что именно ваш кошелёк просит вас одобрить.
На $GRAM, STON.fi использует метки вроде Fake, Honeypot, Taxable и Suspicious, чтобы дать дополнительный контекст для некоторых нестандартных токенов. Эти предупреждения помогают, но они не могут поймать каждый скам.
Сначала проверяйте. Потом подписывайте.
КАК ИЗБЕЖАТЬ РАСПРОСТРАНЁННЫХ СКАМОВ В DEFI.
DeFi даёт вам контроль над вашими активами, но это также значит, что нужно быть внимательным. Одно неверное нажатие или подпись может обойтись дорого.
Вот простые способы быть в безопасности:
• ПРОВЕРЯЙТЕ САЙТ. Фишинговые страницы могут выглядеть точно так же, как настоящие. Используйте официальные ссылки на проекты и добавляйте в закладки доверенные домены. Избегайте ссылок из случайных личных сообщений (DM).
• ПРОВЕРЯЙТЕ ТОКЕНЫ. Мошенники могут скопировать название токена, логотип и тикер. Перед покупкой или обменом всегда сверяйте адрес контракта из официального источника.
• БУДЬТЕ ОСТОРОЖНЫ С AIRDROPS (ДРОПАМИ). Неожиданный токен или DM по умолчанию не является подарком. Не нажимайте на подозрительные ссылки и не подключайте кошелёк только чтобы получить награду.
• ЗАЩИТИТЕ СВОИ КЛЮЧИ. Никогда не сообщайте seed-фразу (seed phrase) или приватный ключ. Перед тем как подписывать, прочитайте, что именно ваш кошелёк просит вас одобрить.
На $GRAM, STON.fi использует метки вроде Fake, Honeypot, Taxable и Suspicious, чтобы дать дополнительный контекст для некоторых нестандартных токенов. Эти предупреждения помогают, но они не могут поймать каждый скам.
Сначала проверяйте. Потом подписывайте.
DeFi даёт вам контроль над вашими активами, но это также значит, что нужно быть внимательным. Одно неверное нажатие или подпись может обойтись дорого.
Вот простые способы быть в безопасности:
• ПРОВЕРЯЙТЕ САЙТ. Фишинговые страницы могут выглядеть точно так же, как настоящие. Используйте официальные ссылки на проекты и добавляйте в закладки доверенные домены. Избегайте ссылок из случайных личных сообщений (DM).
• ПРОВЕРЯЙТЕ ТОКЕНЫ. Мошенники могут скопировать название токена, логотип и тикер. Перед покупкой или обменом всегда сверяйте адрес контракта из официального источника.
• БУДЬТЕ ОСТОРОЖНЫ С AIRDROPS (ДРОПАМИ). Неожиданный токен или DM по умолчанию не является подарком. Не нажимайте на подозрительные ссылки и не подключайте кошелёк только чтобы получить награду.
• ЗАЩИТИТЕ СВОИ КЛЮЧИ. Никогда не сообщайте seed-фразу (seed phrase) или приватный ключ. Перед тем как подписывать, прочитайте, что именно ваш кошелёк просит вас одобрить.
На $GRAM, STON.fi использует метки вроде Fake, Honeypot, Taxable и Suspicious, чтобы дать дополнительный контекст для некоторых нестандартных токенов. Эти предупреждения помогают, но они не могут поймать каждый скам.
Сначала проверяйте. Потом подписывайте.

44
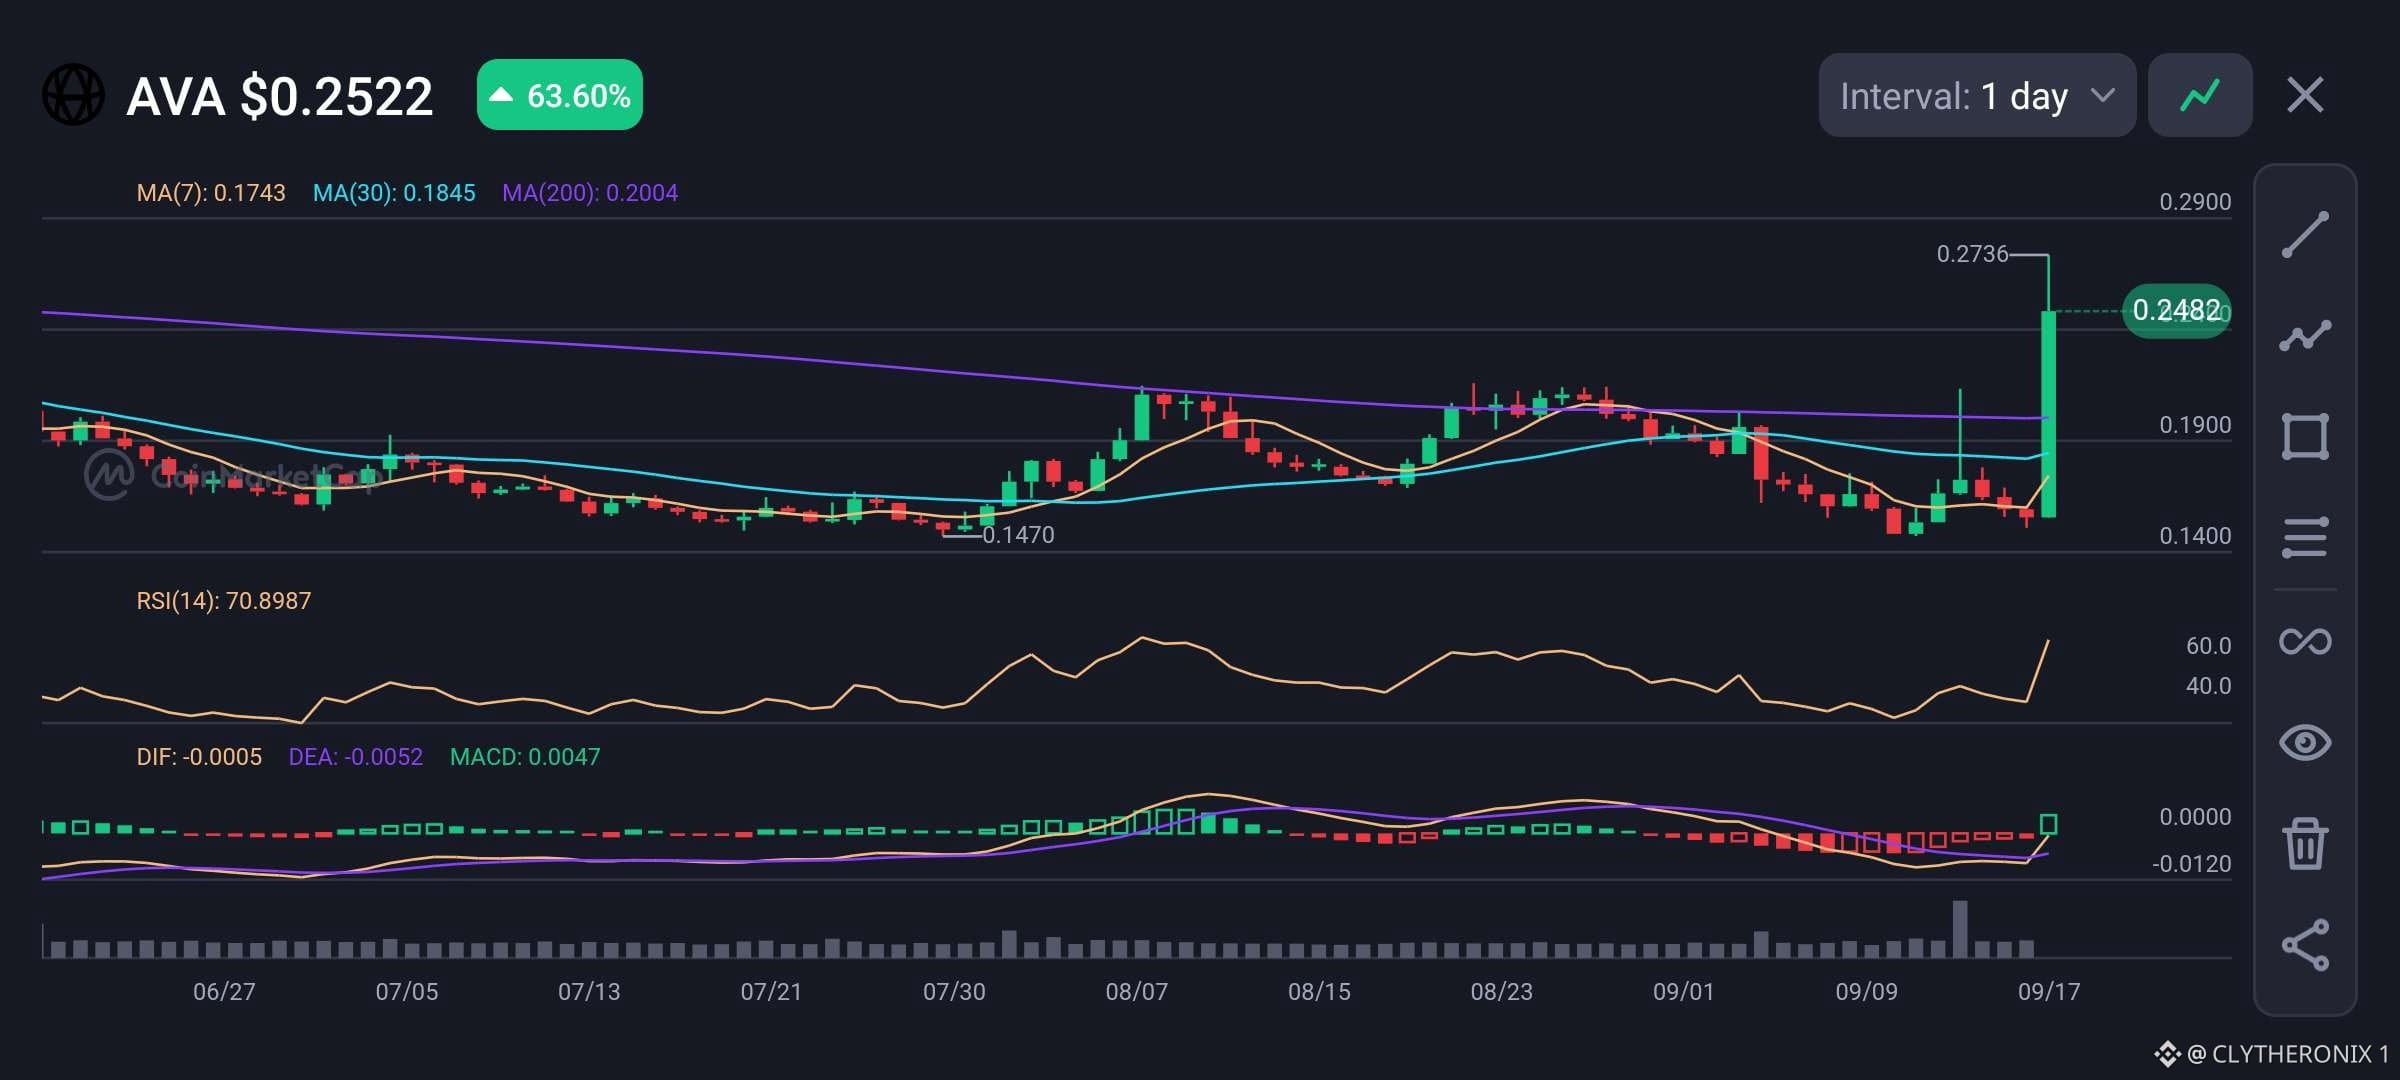
Коин Travala торгуется по $0.2522 после резкого роста на 63,60% сегодня. Цена уверенно пробила выше своих 7-дневной, 30-дневной и 200-дневной скользящих средних после периода консолидации.
Сильная зелёная свеча подтолкнула $AVA к максимуму около $0.2736 на фоне значительного всплеска объёма. RSI достиг примерно 71, в то время как MACD стал положительным.
Этот памп пока в основном технический: высокая торговая активность способствовала пробою. Travala продолжает развивать свои AI-инструменты для путешествий и программу лояльности, благодаря чему интерес к токену сохраняется.
На графике видно чёткое изменение: переход от торговли в более низком диапазоне к сильному восходящему импульсу.
Итак, подтверждение объёмом поддерживает силу движения, когда рынок тестирует более высокие уровни. Как далеко, по вашему мнению, это зайдёт для $AVA?
#Macro Insights#
Коин Travala торгуется по $0.2522 после резкого роста на 63,60% сегодня. Цена уверенно пробила выше своих 7-дневной, 30-дневной и 200-дневной скользящих средних после периода консолидации.
Сильная зелёная свеча подтолкнула $AVA к максимуму около $0.2736 на фоне значительного всплеска объёма. RSI достиг примерно 71, в то время как MACD стал положительным.
Этот памп пока в основном технический: высокая торговая активность способствовала пробою. Travala продолжает развивать свои AI-инструменты для путешествий и программу лояльности, благодаря чему интерес к токену сохраняется.
На графике видно чёткое изменение: переход от торговли в более низком диапазоне к сильному восходящему импульсу.
Итак, подтверждение объёмом поддерживает силу движения, когда рынок тестирует более высокие уровни. Как далеко, по вашему мнению, это зайдёт для $AVA?
#Macro Insights#
Сильная зелёная свеча подтолкнула $AVA к максимуму около $0.2736 на фоне значительного всплеска объёма. RSI достиг примерно 71, в то время как MACD стал положительным.
Этот памп пока в основном технический: высокая торговая активность способствовала пробою. Travala продолжает развивать свои AI-инструменты для путешествий и программу лояльности, благодаря чему интерес к токену сохраняется.
На графике видно чёткое изменение: переход от торговли в более низком диапазоне к сильному восходящему импульсу.
Итак, подтверждение объёмом поддерживает силу движения, когда рынок тестирует более высокие уровни. Как далеко, по вашему мнению, это зайдёт для $AVA?
#Macro Insights#
48
Войдите, чтобы посмотреть больше материала
Присоединяйтесь к пользователям криптовалют по всему миру на Binance Square
⚡️ Получайте новейшую и полезную информацию о криптоактивах.
💬 Нам доверяет крупнейшая в мире криптобиржа.
👍 Получите достоверные аналитические данные от верифицированных создателей контента.
Эл. почта/номер телефона
В тренде
fomcотслеживание
Просмотров: 41,509
339 обсуждают
Btc требуется спрос
Значительные средства поступают в Btc ETF — в начале сентября спотовые биткоин-ETF США за неделю показали чистый приток ~ $987 млн. Это увеличивает реальный спотовый спрос.
Если политика ФРС США смягчится и ставки снизятся или рынок будет ожидать будущего снижения, приток капитала в риск-активы, включая BTC, может усилиться. И наоборот: высокие ставки оказывают давление на BTC. #ПротоколFOMC #fomcотслеживание #NEARRisesNearly80%InAWeek #MultiversXPlansHardForkRecovery #CircleLaunchesInstitutionalBTCBackedBorrowing
za3a
·Лайков: 0
·Просмотров: 316
ПротоколFOMC
Просмотров: 29,806
129 обсуждают
CircleMints500MUSDCOnSolana
Просмотров: 29,154
819 обсуждают