

ScalpingX TG Channel
3.9k Публикации

ScalpingX TG Channel
Отправить жалобу
Заблокировать пользователя
1 scalper with unconventional mindset, loves big risks with big profits. Don't ask about the leverage I use, it's always maximum!
0 подписок(и/а)
10 подписчиков(а)
9 понравилось
Посты
См. перевод
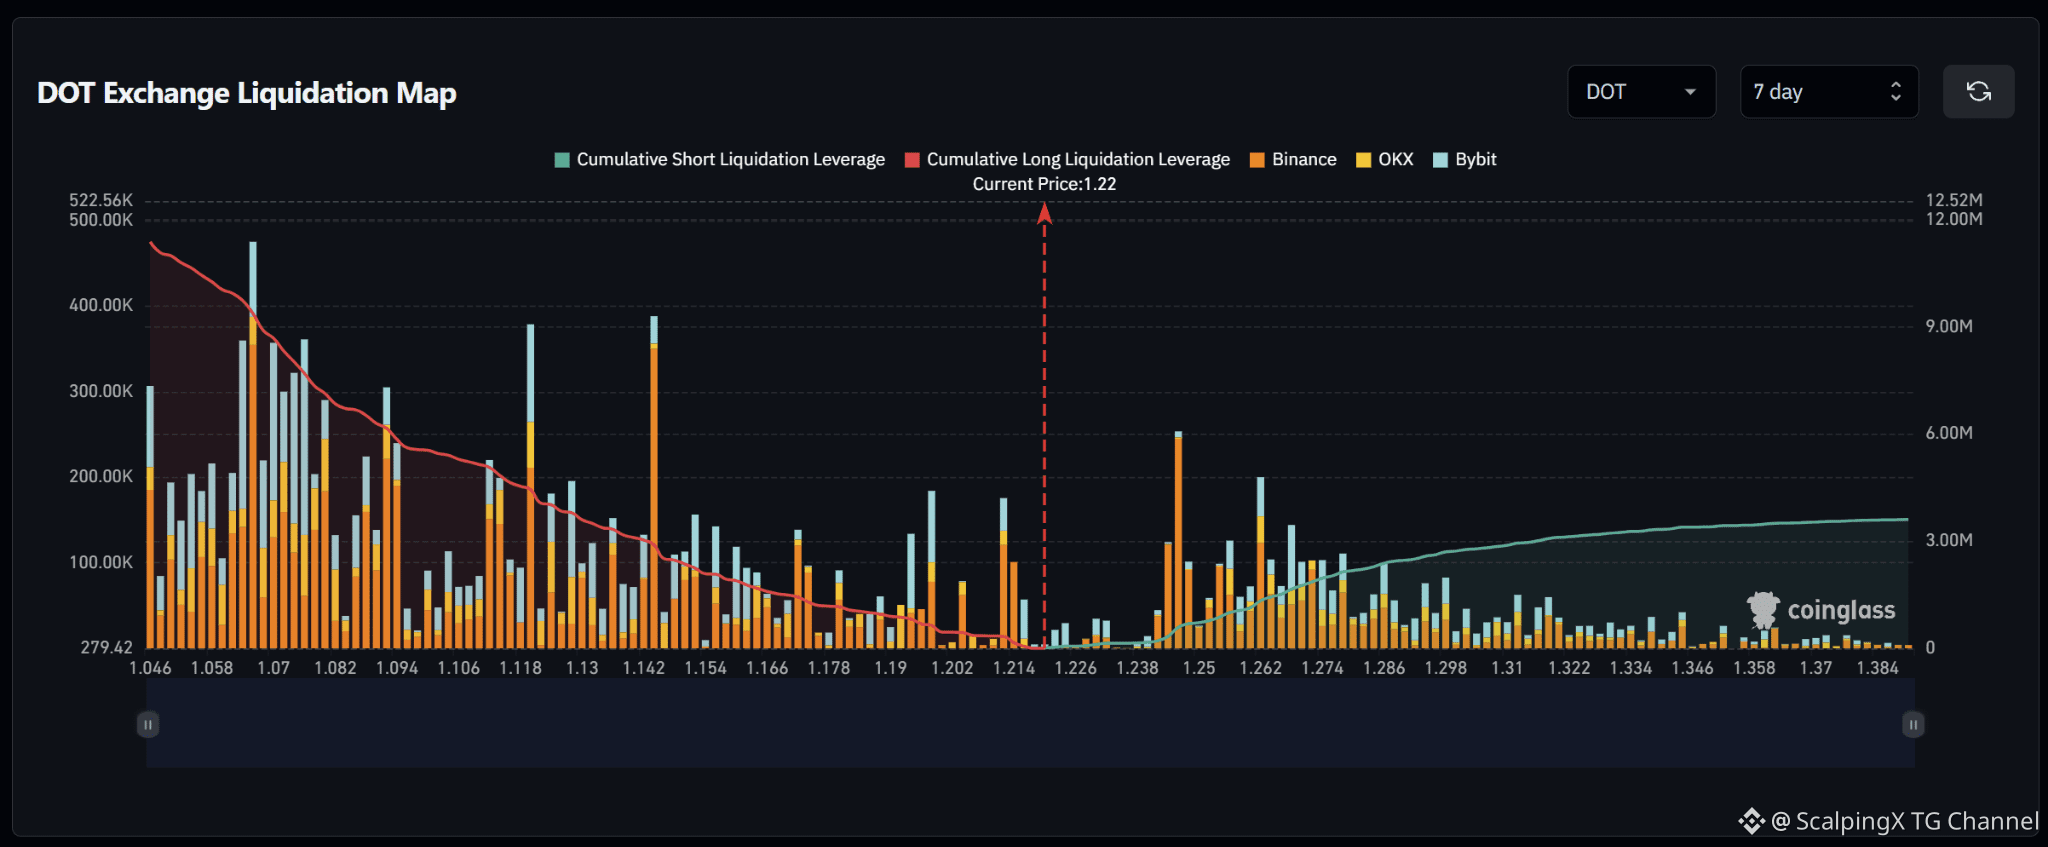
$DOT – Liquidation Map (7 Days) – Current Price 1.22 🔎 The 7-day liquidation map shows roughly 11.5–12 million USD in long liquidations below the current price, far exceeding approximately 3 million USD in short liquidations above. The liquidity structure therefore strongly favors the downside, with nearly four times more cumulative liquidity below the market. 📉 Below the market, long-liquidation liquidity is concentrated heavily across 1.06–1.15. The strongest cluster sits around 1.066–1.070 with a bar near 0.48 million USD; the 1.118–1.120 and 1.142–1.144 areas also contain bars around 0.38–0.39 million USD. Losing 1.214 would shift attention toward 1.202–1.190 and then 1.178–1.166. 📈 Above the market, short-liquidation liquidity is much thinner. The most notable cluster sits around 1.248–1.250 with a bar near 0.25 million USD, while 1.262 and 1.274 hold additional pockets around 0.10–0.20 million USD. Above 1.30, liquidity density gradually declines. 🧭 The broader setup clearly favors the downside because long-liquidation exposure below dominates. Losing 1.214 would increase the probability of a sweep toward 1.202–1.190, followed by 1.178–1.166. Breaking above 1.238 would instead expose 1.248–1.262 before attention shifts toward 1.274.
$DOT – Liquidation Map (7 Days) – Current Price 1.22 🔎 The 7-day liquidation map shows roughly 11.5–12 million USD in long liquidations below the current price, far exceeding approximately 3 million USD in short liquidations above. The liquidity structure therefore strongly favors the downside, with nearly four times more cumulative liquidity below the market. 📉 Below the market, long-liquidation liquidity is concentrated heavily across 1.06–1.15. The strongest cluster sits around 1.066–1.070 with a bar near 0.48 million USD; the 1.118–1.120 and 1.142–1.144 areas also contain bars around 0.38–0.39 million USD. Losing 1.214 would shift attention toward 1.202–1.190 and then 1.178–1.166. 📈 Above the market, short-liquidation liquidity is much thinner. The most notable cluster sits around 1.248–1.250 with a bar near 0.25 million USD, while 1.262 and 1.274 hold additional pockets around 0.10–0.20 million USD. Above 1.30, liquidity density gradually declines. 🧭 The broader setup clearly favors the downside because long-liquidation exposure below dominates. Losing 1.214 would increase the probability of a sweep toward 1.202–1.190, followed by 1.178–1.166. Breaking above 1.238 would instead expose 1.248–1.262 before attention shifts toward 1.274.
1
См. перевод
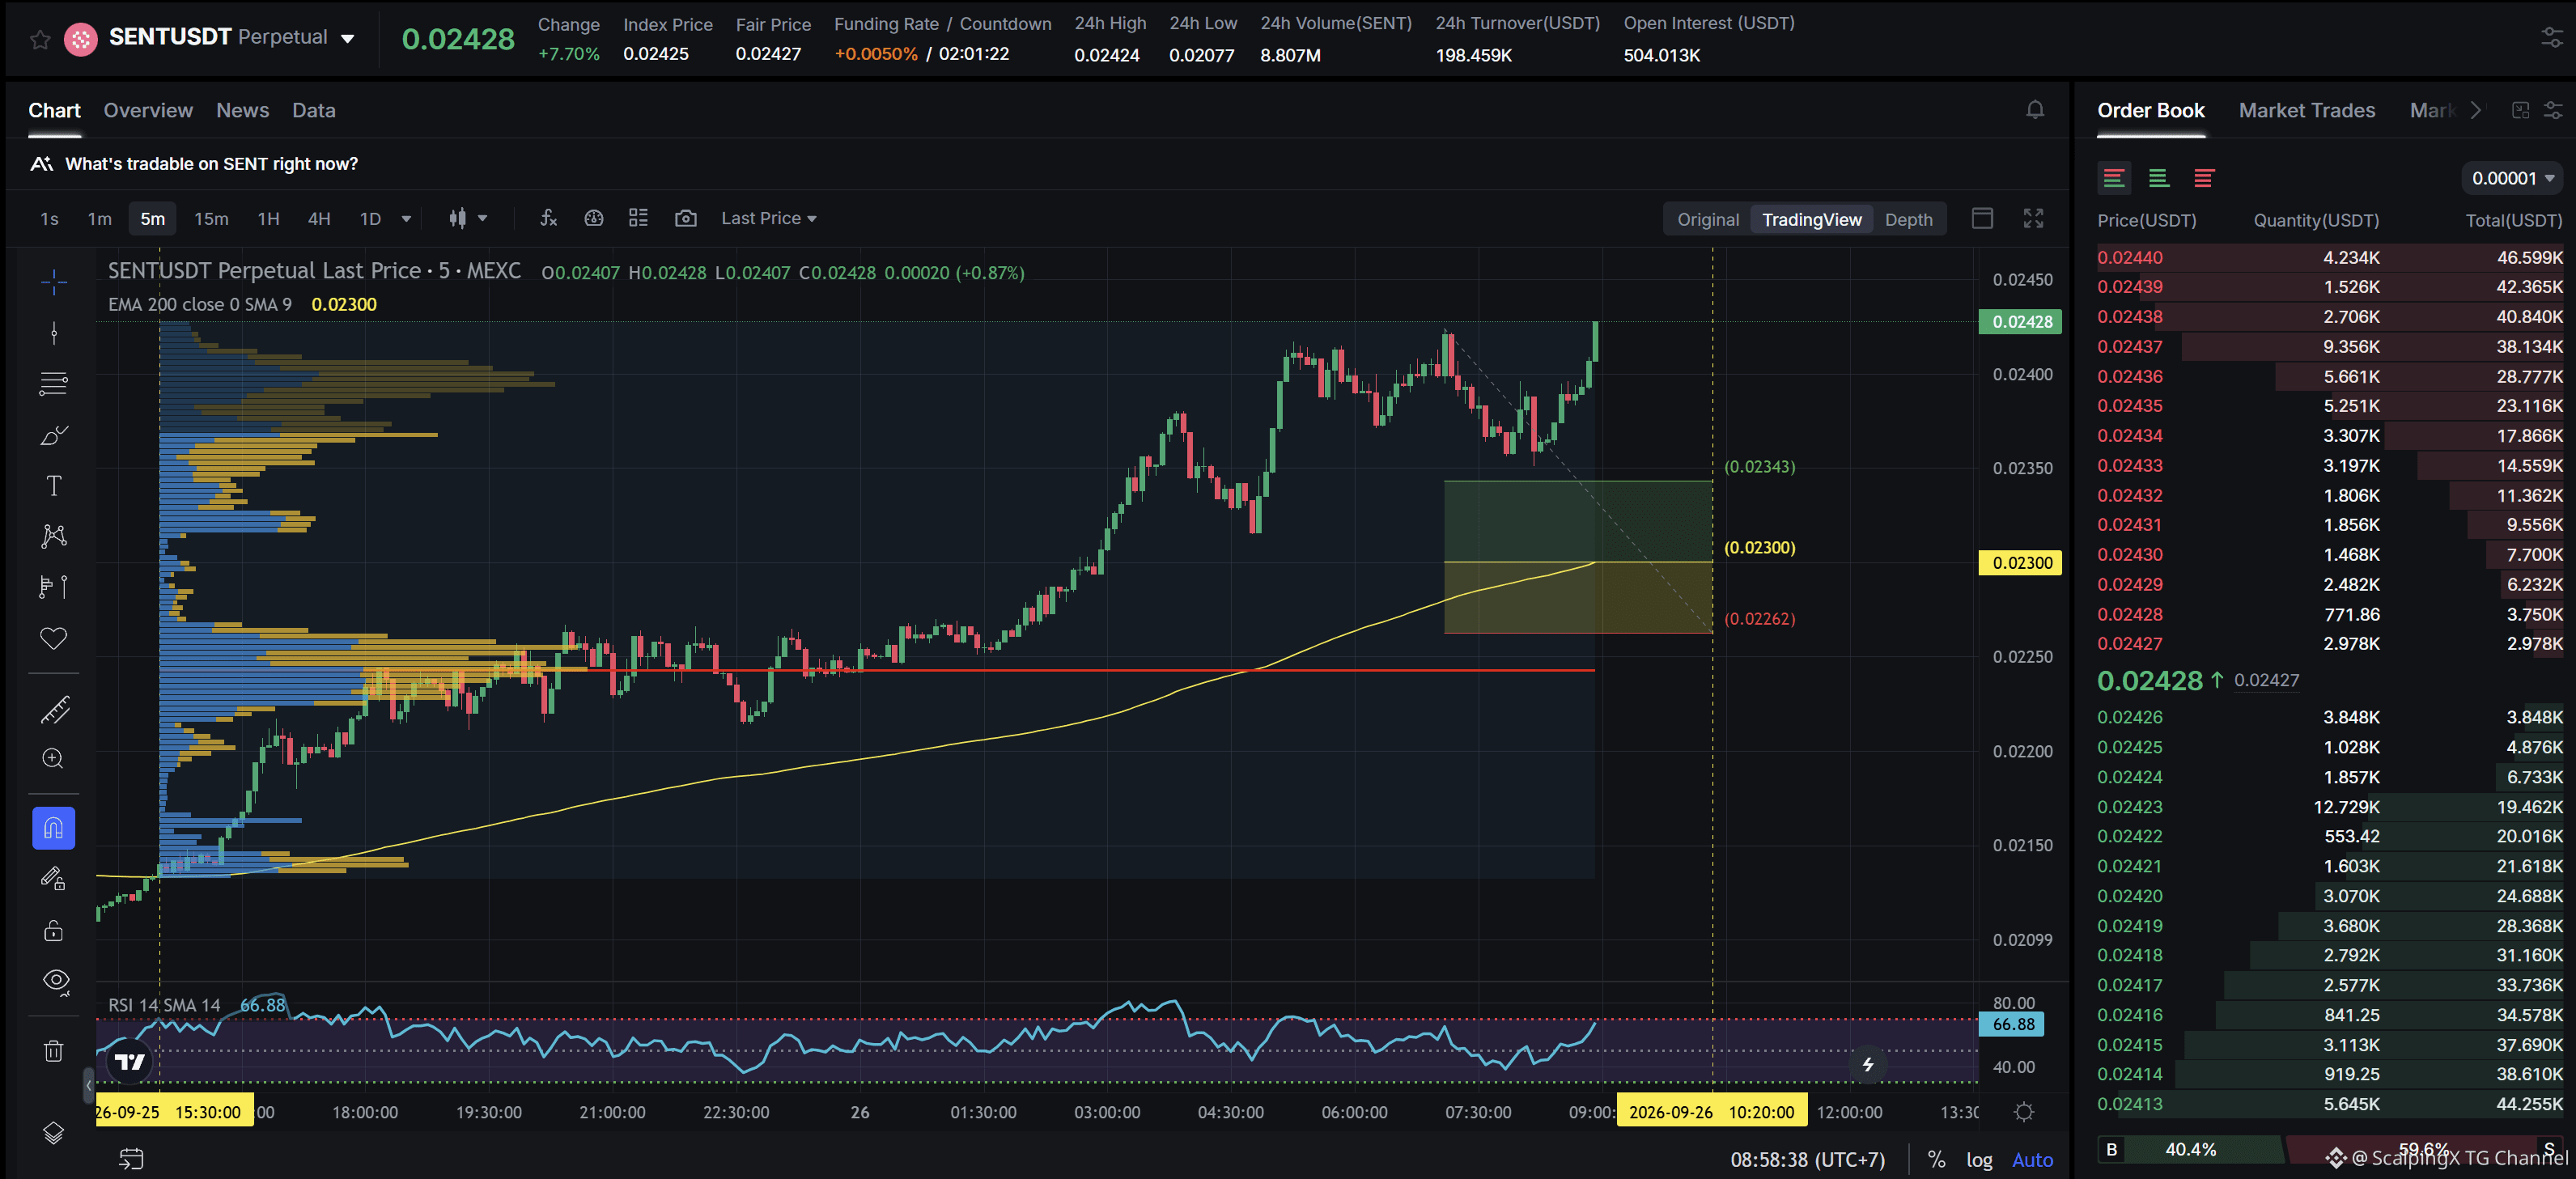
$SENT - Mcap 172.9M$ - 24h Sentiment +6.00 Bullish SC02 M5 - pending Long order. Entry lies within HVN + not affected by any weak zone, the current support zone is approximately 1.67% wide. The uptrend has lasted 17 hours 30 minutes, with a maximum recorded price increase of 13.91%. If price loses this support zone, the trend is highly likely to reverse downward.
$SENT - Mcap 172.9M$ - 24h Sentiment +6.00 Bullish SC02 M5 - pending Long order. Entry lies within HVN + not affected by any weak zone, the current support zone is approximately 1.67% wide. The uptrend has lasted 17 hours 30 minutes, with a maximum recorded price increase of 13.91%. If price loses this support zone, the trend is highly likely to reverse downward.
11
См. перевод
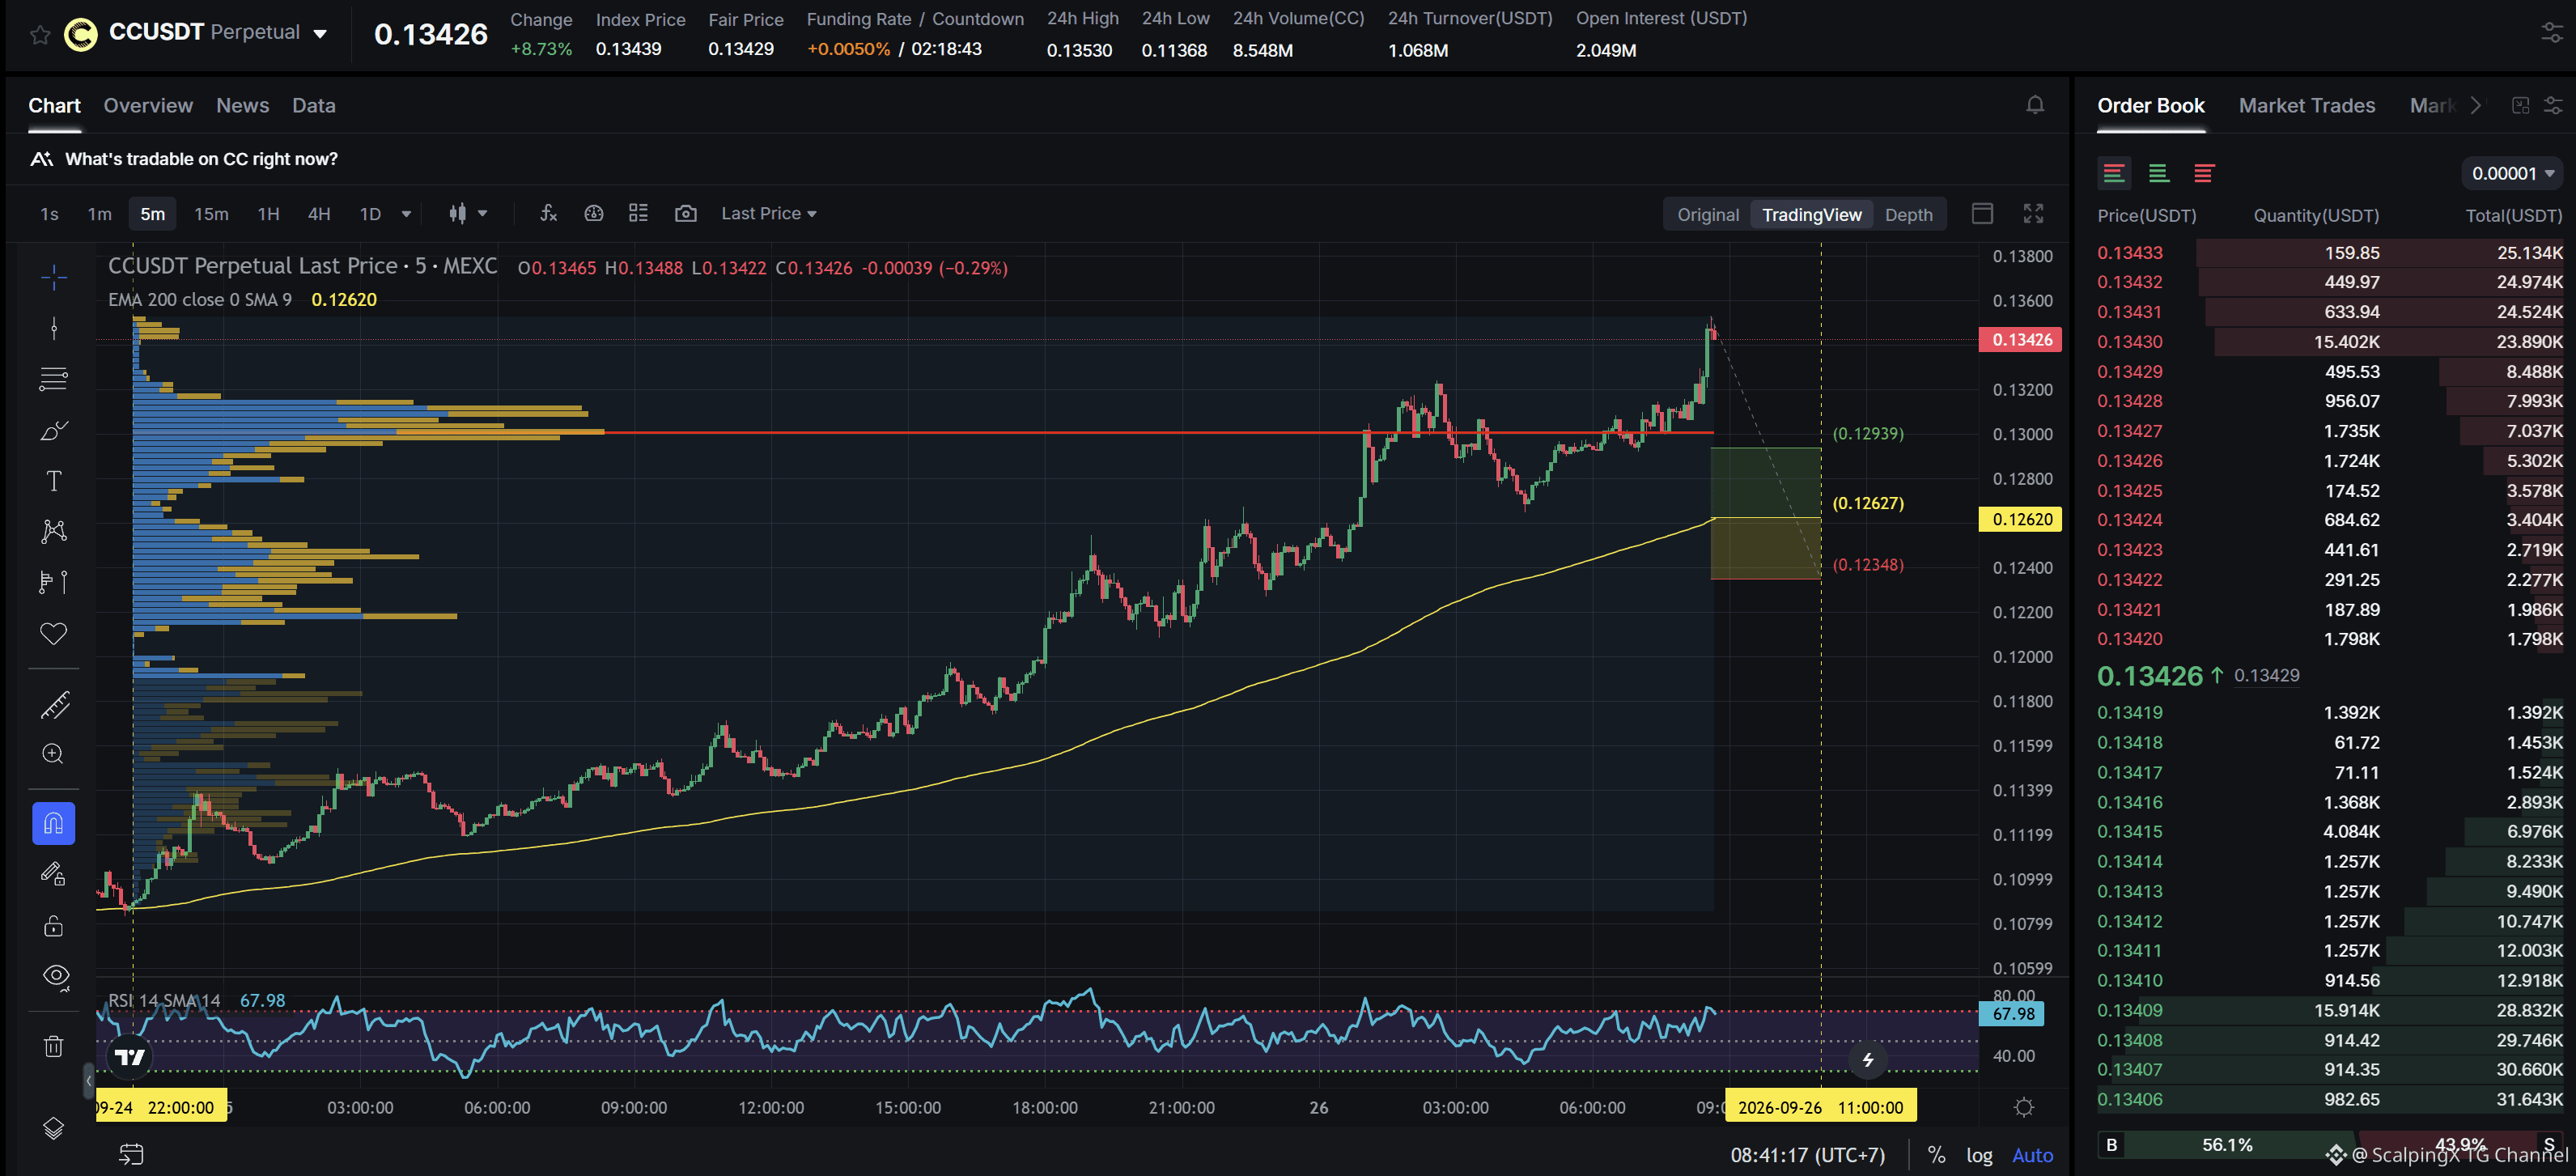
$CC - Mcap 5.33B$ - 24h Sentiment +4.67 Bullish SC02 M5 - pending Long order. Entry lies within HVN + not affected by any weak zone, the current support zone is approximately 2.17% wide. The uptrend has lasted 1 day 10 hours 40 minutes, with a maximum recorded price increase of 24.41%. If price loses this support zone, the trend is highly likely to reverse downward.
$CC - Mcap 5.33B$ - 24h Sentiment +4.67 Bullish SC02 M5 - pending Long order. Entry lies within HVN + not affected by any weak zone, the current support zone is approximately 2.17% wide. The uptrend has lasted 1 day 10 hours 40 minutes, with a maximum recorded price increase of 24.41%. If price loses this support zone, the trend is highly likely to reverse downward.
16
См. перевод
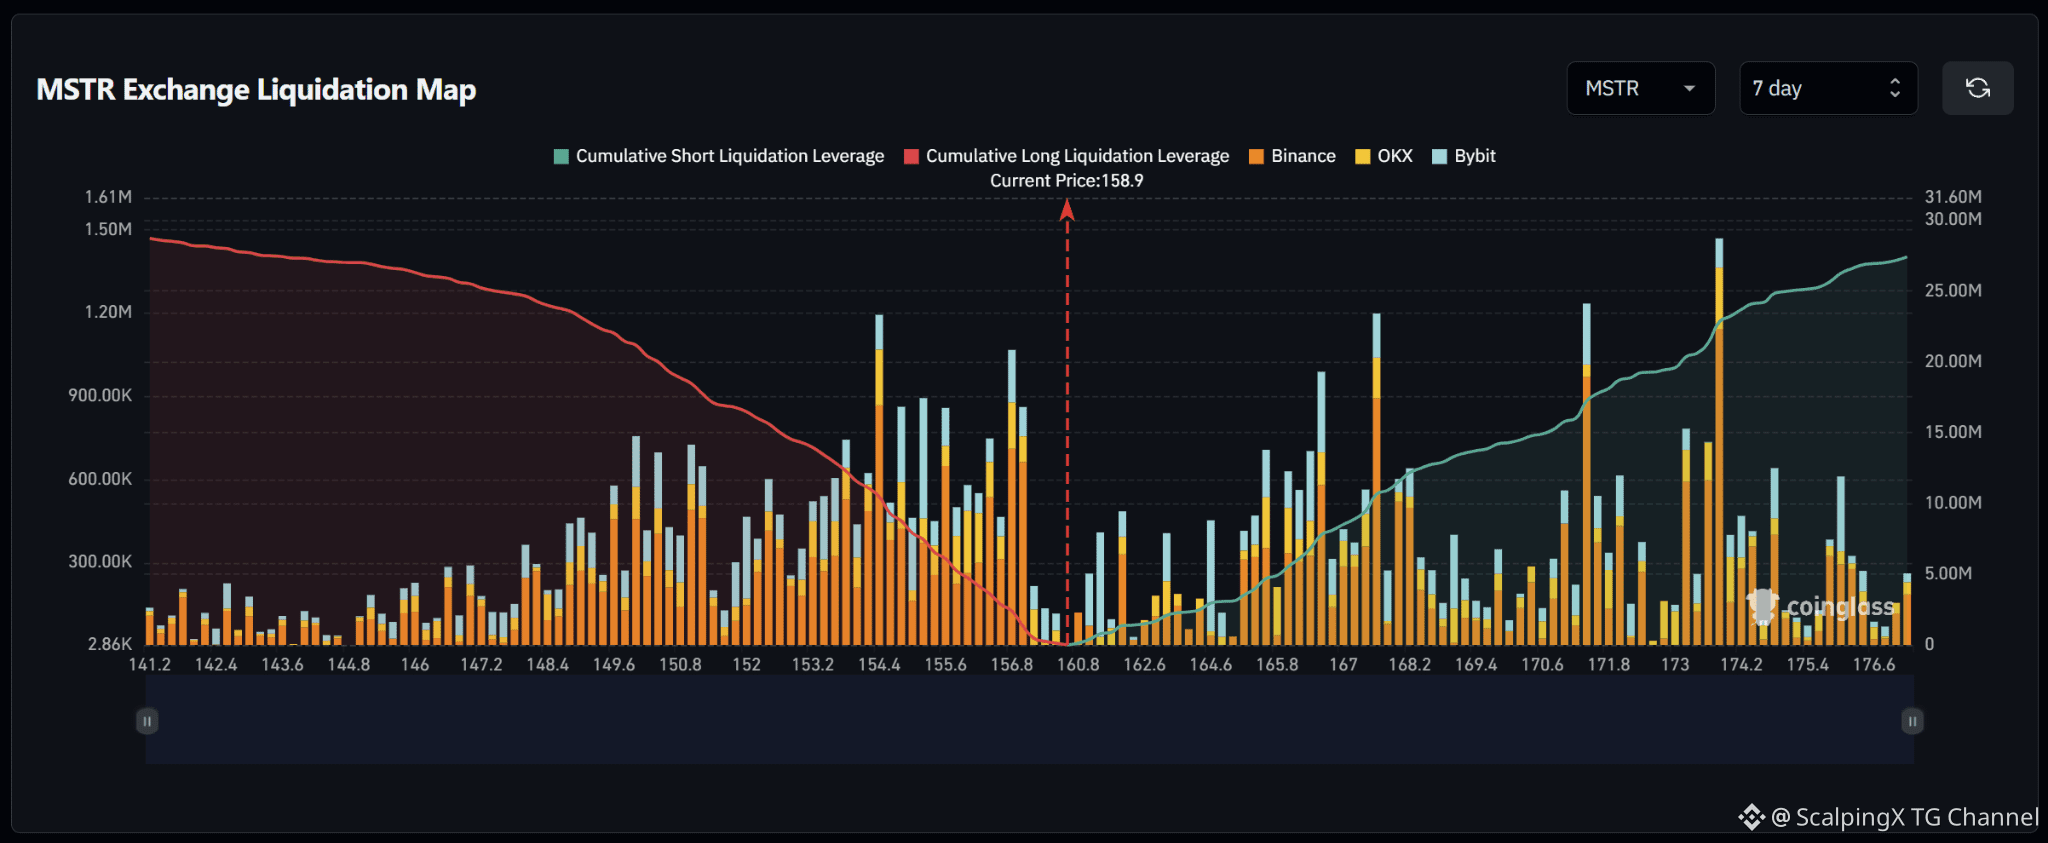
$MSTR – Liquidation Map (7 Days) – Current Price 158.9 🔎 The 7-day liquidation map shows roughly 28–29 million USD in long liquidations below the current price, slightly exceeding approximately 26–27 million USD in short liquidations above. The liquidity structure is therefore fairly balanced, with a mild downside tilt. 📉 Below the market, long-liquidation liquidity is concentrated heavily across 153–157. A major cluster sits around 154.4 with a bar close to 1.2 million USD; the 155–156 area contains several bars around 0.8–0.9 million USD, while 156.7–157.0 holds another cluster above 1 million USD. Losing 156.5 would shift attention toward 155–154 and then 152–150. 📈 Above the market, short-liquidation liquidity is distributed heavily across 165–174. Major clusters appear around 167–168 with a bar near 1.2 million USD, 171–172 with a bar above 1.2 million USD, and especially 173–174 with a bar close to 1.5 million USD. This is the most prominent liquidity zone above the market. 🧭 The broader setup is close to balanced but carries a mild downside tilt. Losing 156.5 would increase the probability of a sweep toward 155–154, followed by 152–150. Breaking above 162–164 would instead expose 167–168 and then 171–174.
$MSTR – Liquidation Map (7 Days) – Current Price 158.9 🔎 The 7-day liquidation map shows roughly 28–29 million USD in long liquidations below the current price, slightly exceeding approximately 26–27 million USD in short liquidations above. The liquidity structure is therefore fairly balanced, with a mild downside tilt. 📉 Below the market, long-liquidation liquidity is concentrated heavily across 153–157. A major cluster sits around 154.4 with a bar close to 1.2 million USD; the 155–156 area contains several bars around 0.8–0.9 million USD, while 156.7–157.0 holds another cluster above 1 million USD. Losing 156.5 would shift attention toward 155–154 and then 152–150. 📈 Above the market, short-liquidation liquidity is distributed heavily across 165–174. Major clusters appear around 167–168 with a bar near 1.2 million USD, 171–172 with a bar above 1.2 million USD, and especially 173–174 with a bar close to 1.5 million USD. This is the most prominent liquidity zone above the market. 🧭 The broader setup is close to balanced but carries a mild downside tilt. Losing 156.5 would increase the probability of a sweep toward 155–154, followed by 152–150. Breaking above 162–164 would instead expose 167–168 and then 171–174.
41
См. перевод
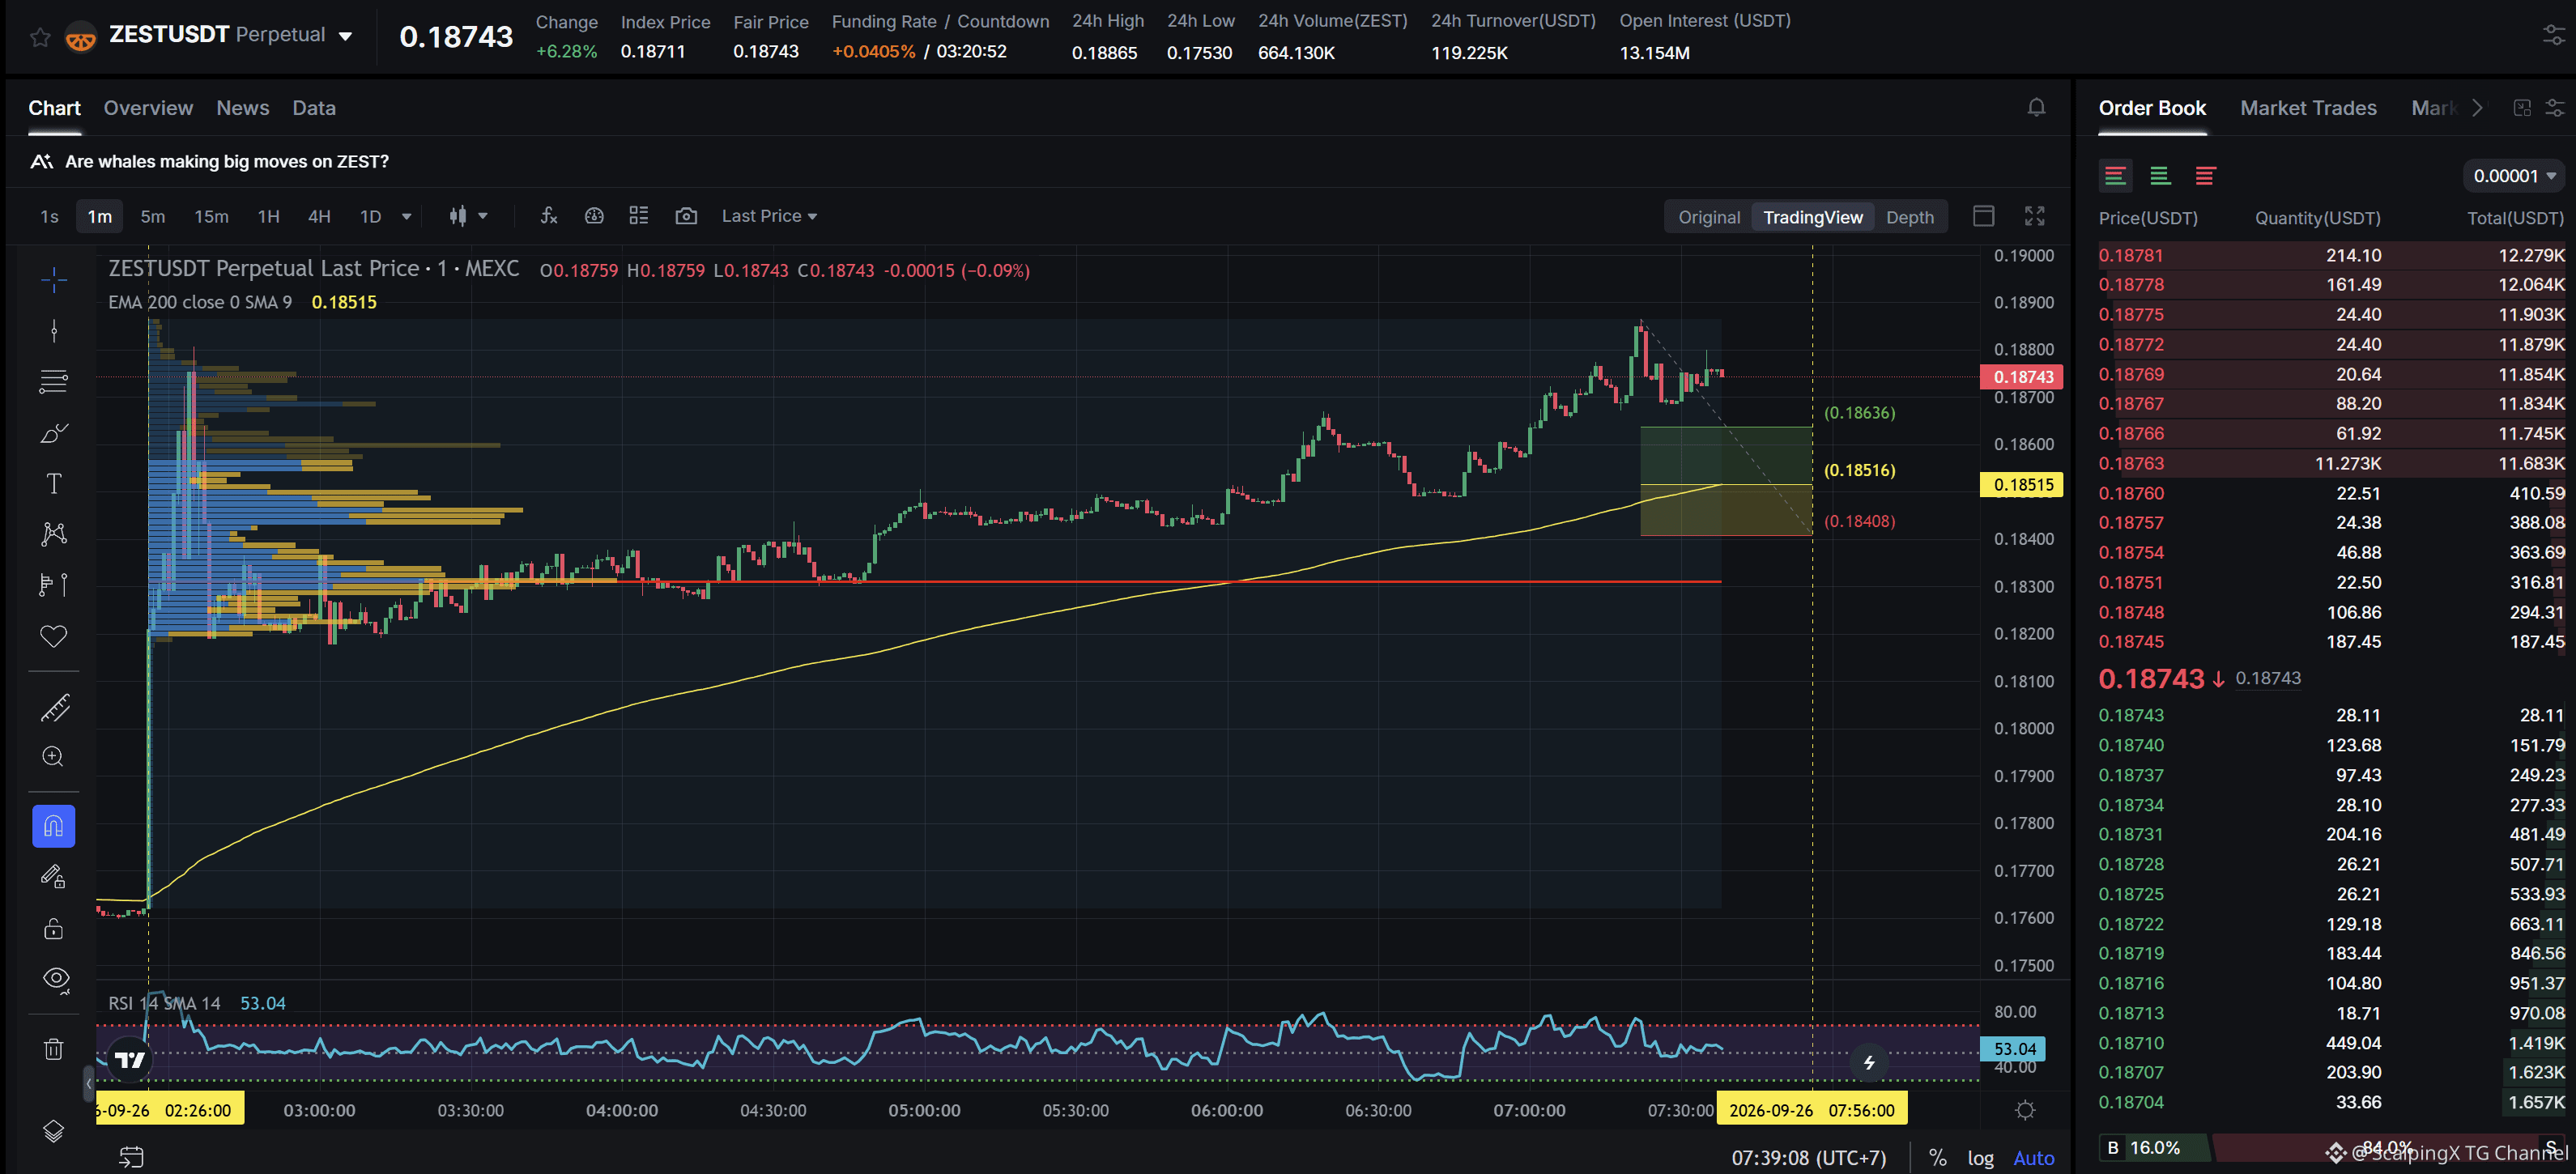
$ZEST - Mcap 27.34M$ - 24h Sentiment +6.00 Bullish SC02 M1 - pending Long order. Entry lies within HVN + not affected by any weak zone, the current support zone is approximately 0.57% wide. The uptrend has lasted 5 hours 14 minutes, with a maximum recorded price increase of 6.90%. If price loses this support zone, the trend is highly likely to reverse downward.
$ZEST - Mcap 27.34M$ - 24h Sentiment +6.00 Bullish SC02 M1 - pending Long order. Entry lies within HVN + not affected by any weak zone, the current support zone is approximately 0.57% wide. The uptrend has lasted 5 hours 14 minutes, with a maximum recorded price increase of 6.90%. If price loses this support zone, the trend is highly likely to reverse downward.
50
См. перевод
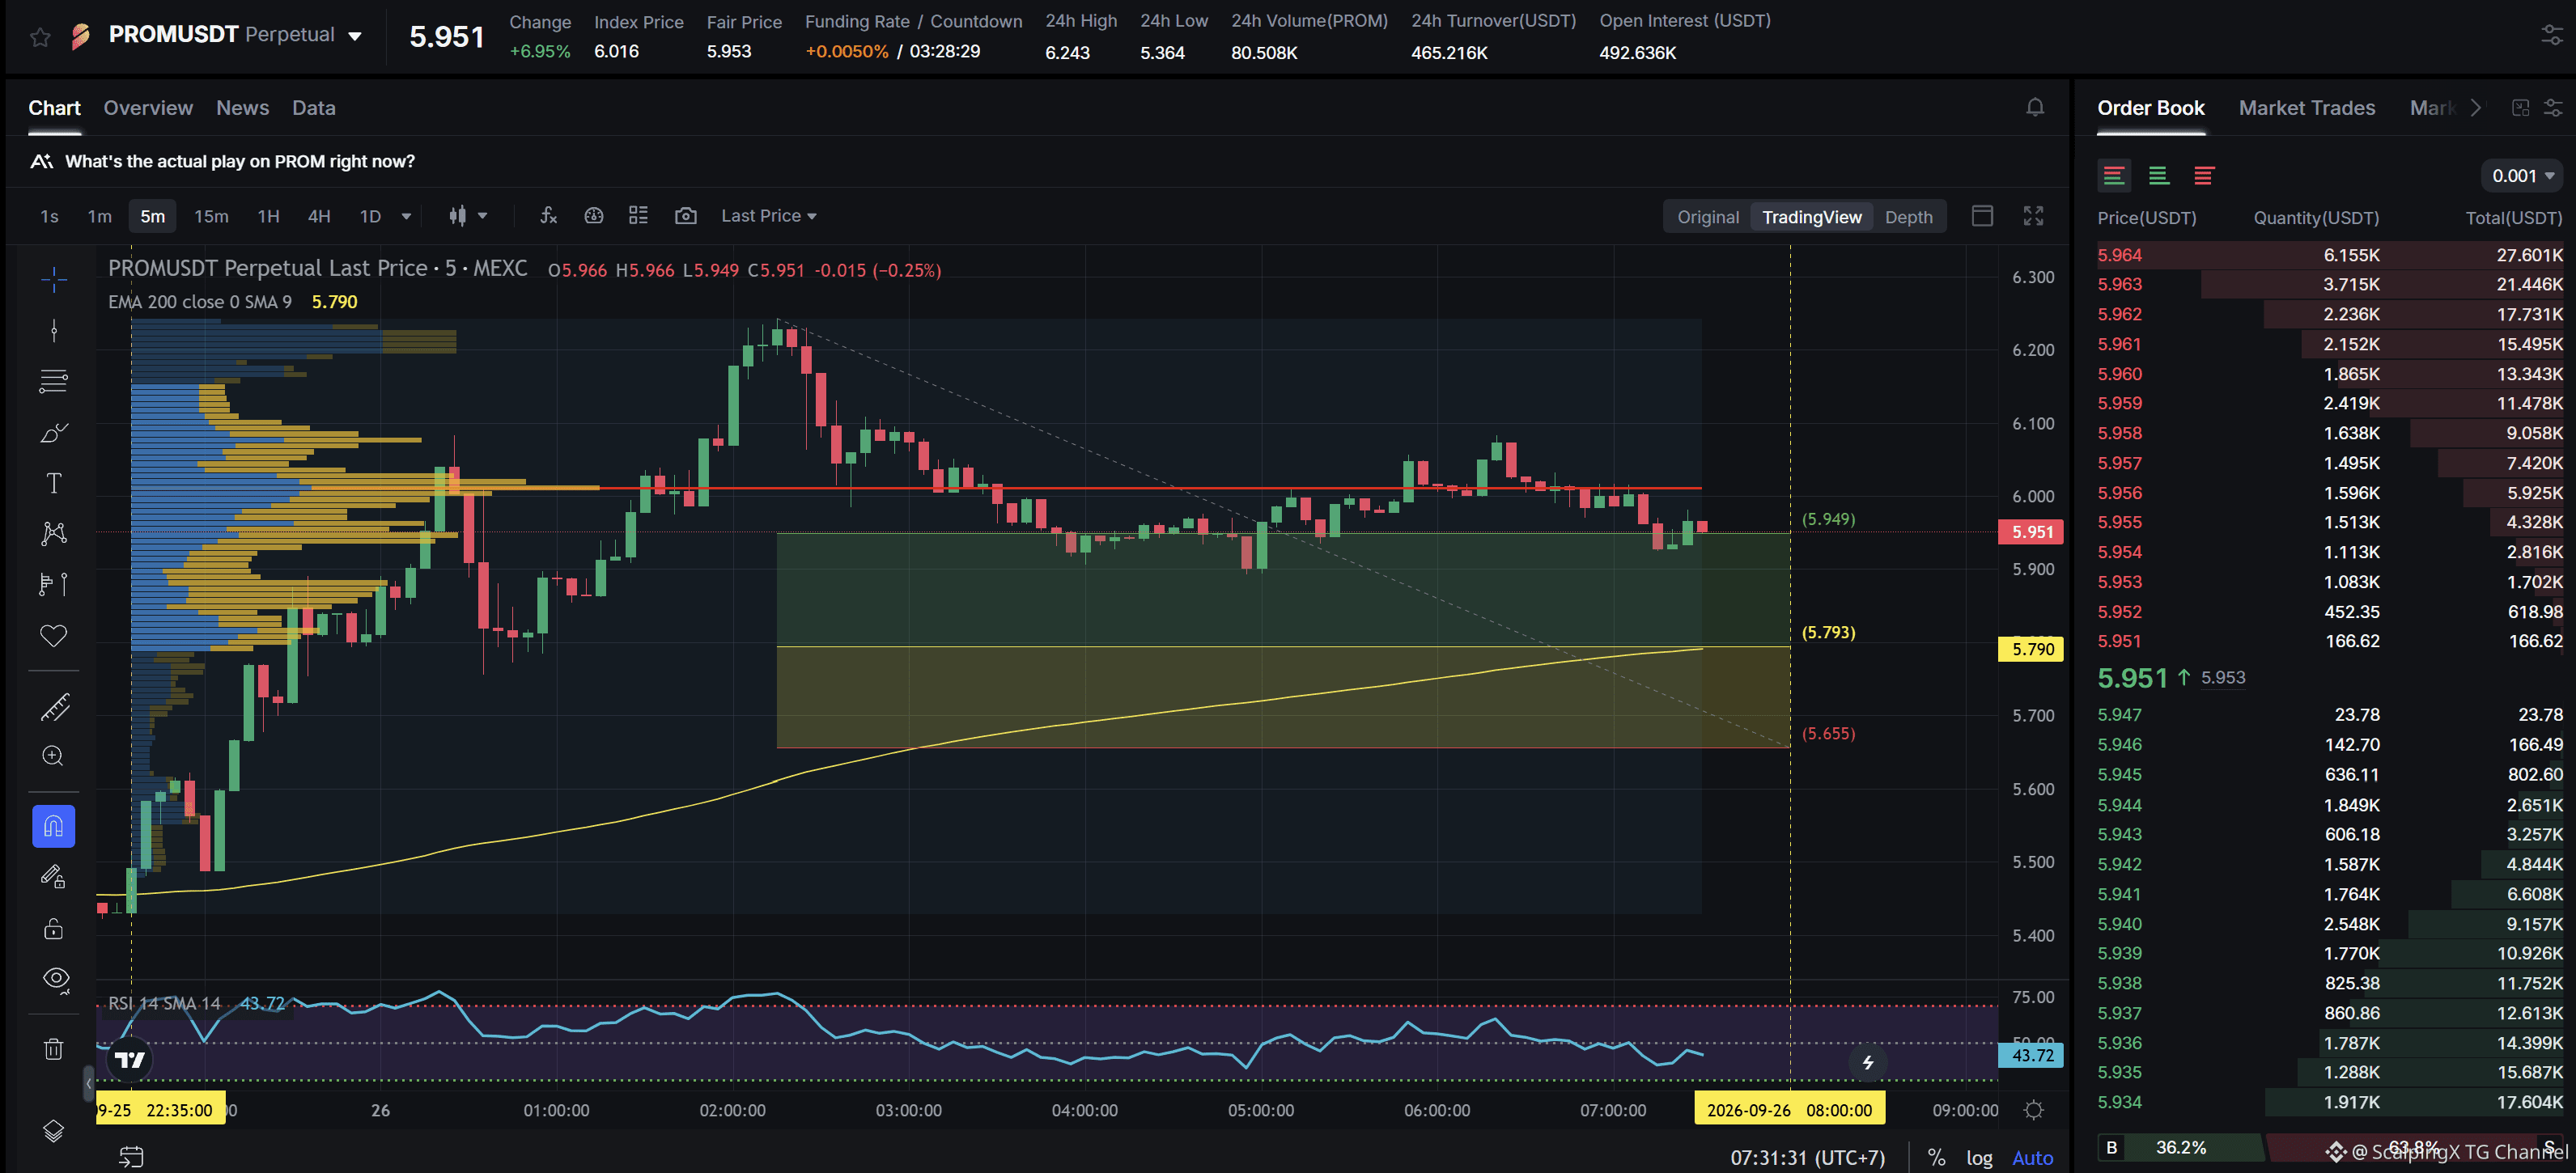
$PROM - Mcap 108.08M$ - 24h Sentiment +6.18 Bullish SC02 M5 - pending Long order. Entry lies within LVN + not affected by any weak zone, the current support zone is approximately 2.41% wide. The uptrend has lasted 8 hours 55 minutes, with a maximum recorded price increase of 14.39%. If price loses this support zone, the trend is highly likely to reverse downward.
$PROM - Mcap 108.08M$ - 24h Sentiment +6.18 Bullish SC02 M5 - pending Long order. Entry lies within LVN + not affected by any weak zone, the current support zone is approximately 2.41% wide. The uptrend has lasted 8 hours 55 minutes, with a maximum recorded price increase of 14.39%. If price loses this support zone, the trend is highly likely to reverse downward.
46
См. перевод
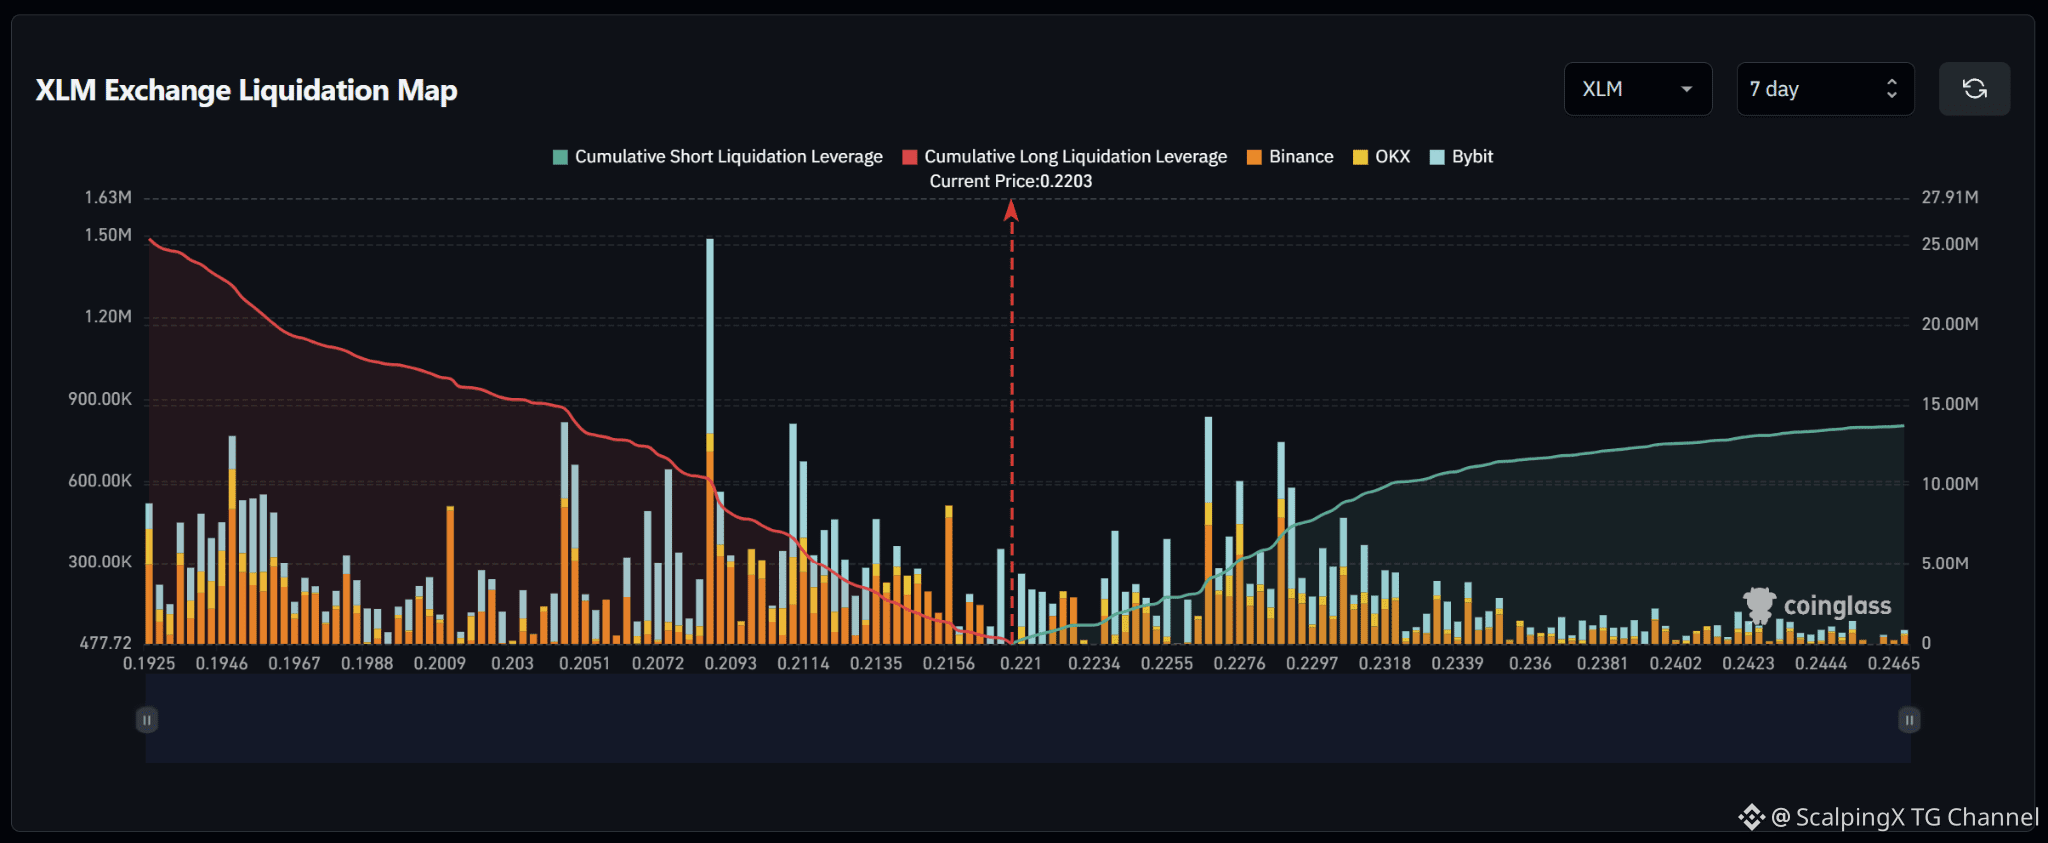
$XLM – Liquidation Map (7 Days) – Current Price 0.2203 🔎 The 7-day liquidation map shows roughly 25 million USD in long liquidations below the current price, significantly exceeding approximately 14 million USD in short liquidations above. The liquidity structure therefore favors the downside, with around 1.8 times more cumulative liquidity below the market. 📉 Below the market, long-liquidation liquidity is concentrated heavily across 0.205–0.214. The strongest cluster sits around 0.208–0.209 with a bar near 1.5 million USD; 0.211–0.212 also contains a bar around 0.8 million USD, while 0.204–0.205 holds another cluster above 0.8 million USD. Losing 0.216 would shift attention toward 0.214–0.211 and then 0.209–0.205. 📈 Above the market, short-liquidation liquidity is concentrated mainly across 0.225–0.231. The strongest cluster sits around 0.226–0.227 with a bar near 0.8 million USD, while 0.228–0.230 contains several bars around 0.6–0.75 million USD. Above 0.232, liquidity density declines noticeably. 🧭 The broader setup still favors the downside because long-liquidation exposure below is meaningfully larger. Losing 0.216 would increase the probability of a sweep toward 0.214–0.211, followed by 0.209–0.205. Breaking above 0.223 would instead expose 0.226–0.230 before price enters a thinner liquidity zone.
$XLM – Liquidation Map (7 Days) – Current Price 0.2203 🔎 The 7-day liquidation map shows roughly 25 million USD in long liquidations below the current price, significantly exceeding approximately 14 million USD in short liquidations above. The liquidity structure therefore favors the downside, with around 1.8 times more cumulative liquidity below the market. 📉 Below the market, long-liquidation liquidity is concentrated heavily across 0.205–0.214. The strongest cluster sits around 0.208–0.209 with a bar near 1.5 million USD; 0.211–0.212 also contains a bar around 0.8 million USD, while 0.204–0.205 holds another cluster above 0.8 million USD. Losing 0.216 would shift attention toward 0.214–0.211 and then 0.209–0.205. 📈 Above the market, short-liquidation liquidity is concentrated mainly across 0.225–0.231. The strongest cluster sits around 0.226–0.227 with a bar near 0.8 million USD, while 0.228–0.230 contains several bars around 0.6–0.75 million USD. Above 0.232, liquidity density declines noticeably. 🧭 The broader setup still favors the downside because long-liquidation exposure below is meaningfully larger. Losing 0.216 would increase the probability of a sweep toward 0.214–0.211, followed by 0.209–0.205. Breaking above 0.223 would instead expose 0.226–0.230 before price enters a thinner liquidity zone.
См. перевод
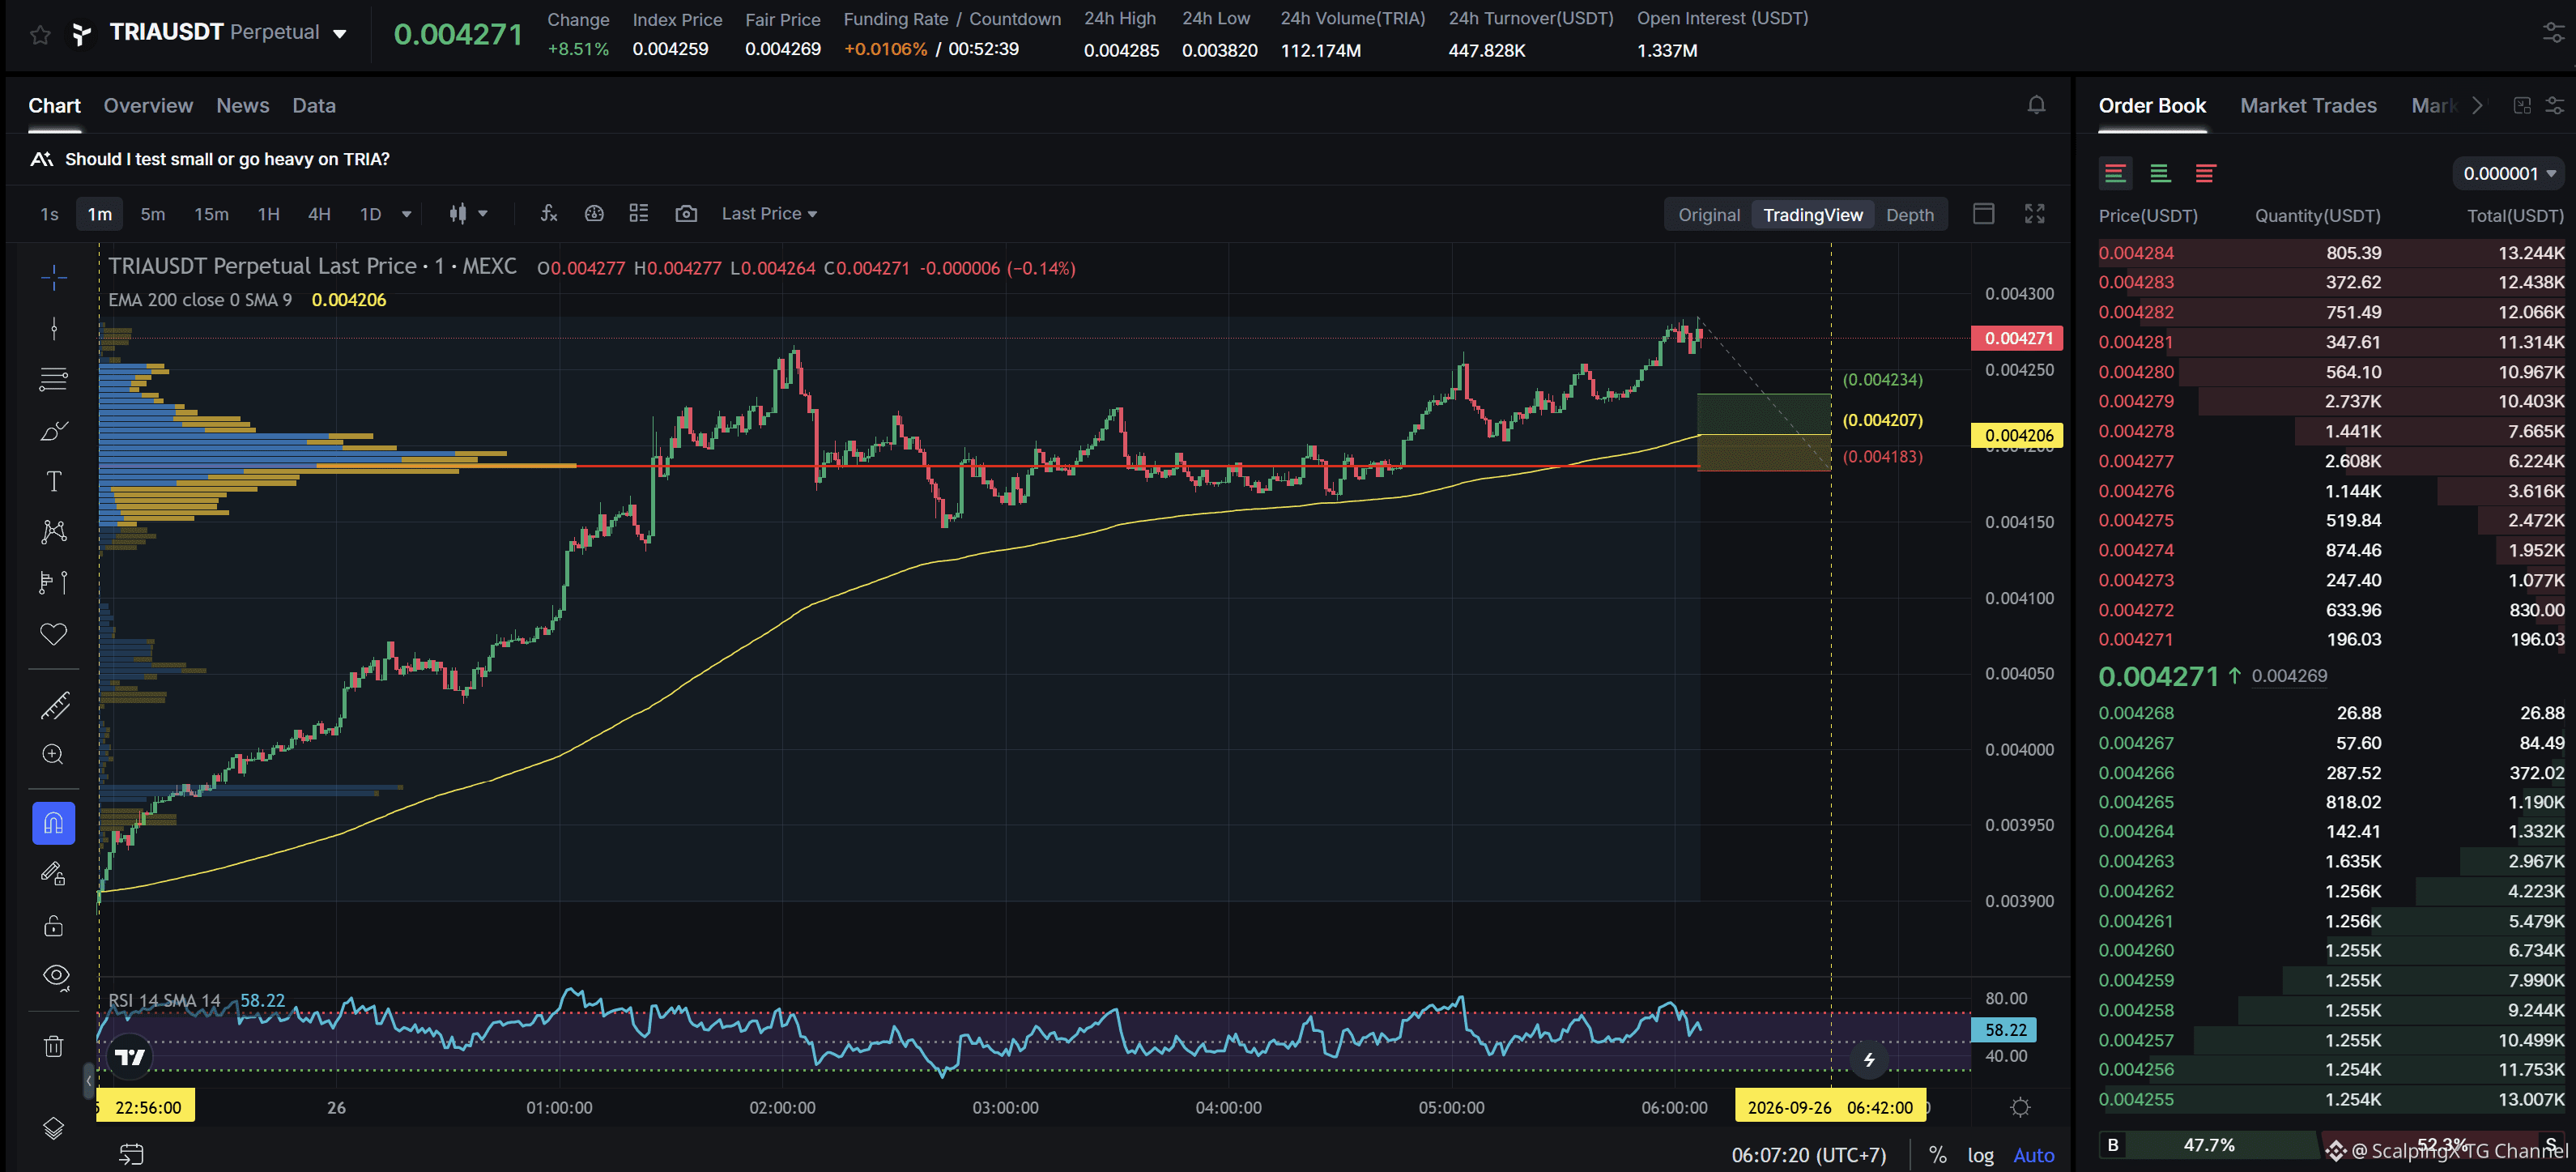
$TRIA - Mcap 9.12M$ - 24h Sentiment -8.00 Bearish SC02 M1 - pending Long order. Entry contains POC + not affected by any weak zone, the current support zone is approximately 0.58% wide. The uptrend has lasted 7 hours 12 minutes, with a maximum recorded price increase of 9.70%. If price loses this support zone, the trend is highly likely to reverse downward.
$TRIA - Mcap 9.12M$ - 24h Sentiment -8.00 Bearish SC02 M1 - pending Long order. Entry contains POC + not affected by any weak zone, the current support zone is approximately 0.58% wide. The uptrend has lasted 7 hours 12 minutes, with a maximum recorded price increase of 9.70%. If price loses this support zone, the trend is highly likely to reverse downward.
9
См. перевод
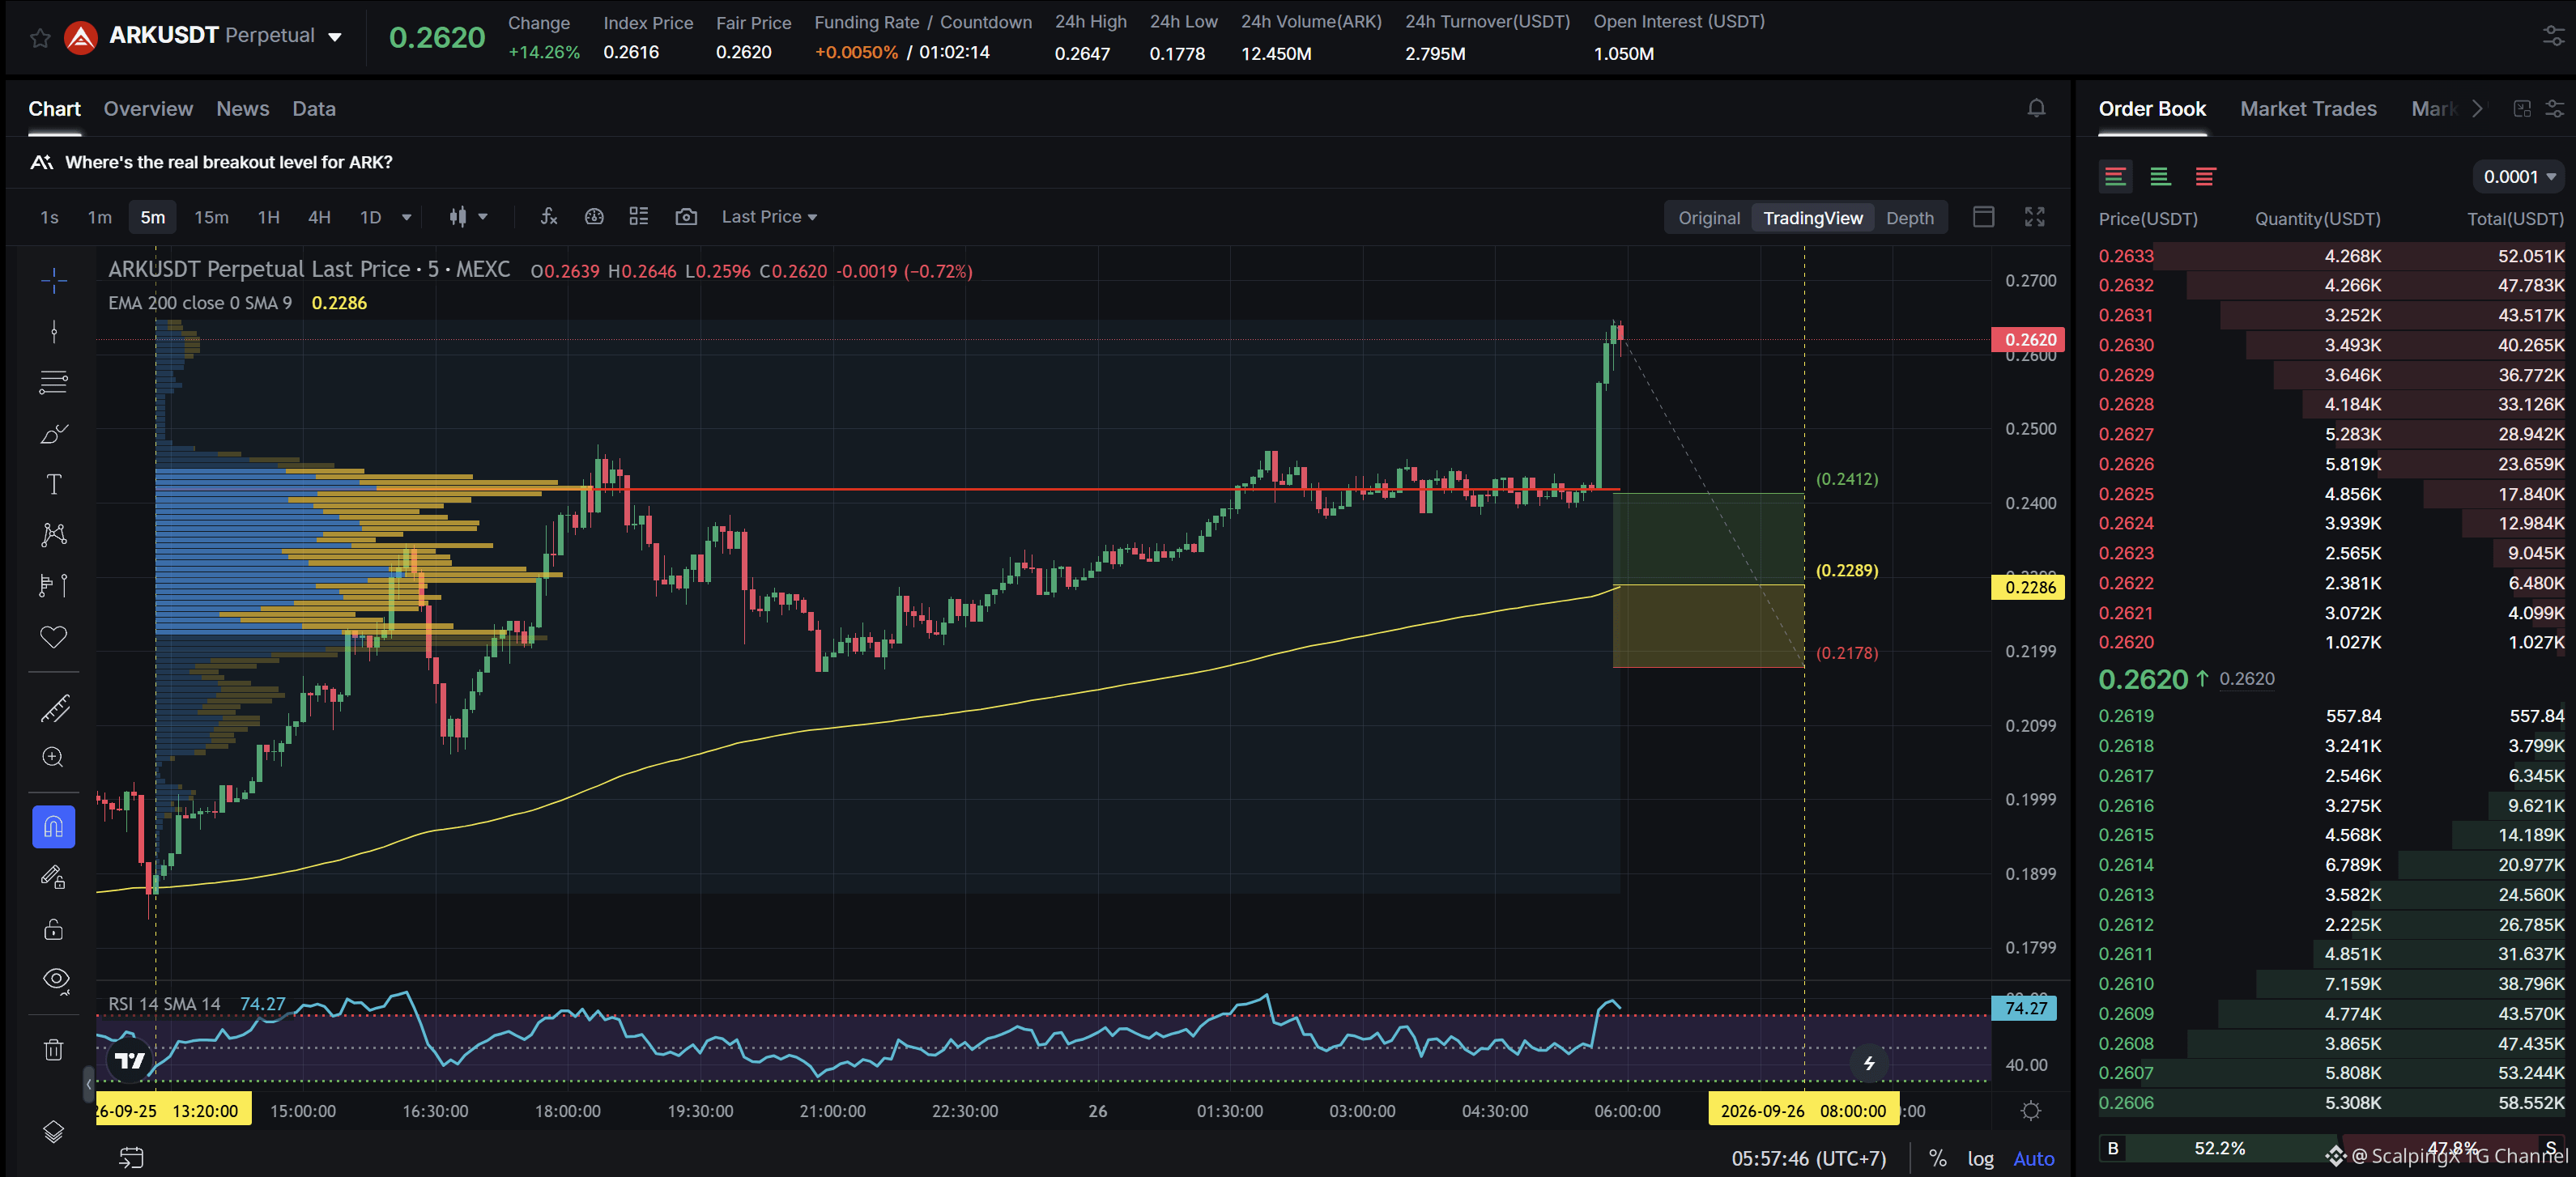
$ARK - Mcap 50.65M$ - 24h Sentiment +6.45 Bullish SC02 M5 - pending Long order. Entry lies within HVN + not affected by any weak zone, the current support zone is approximately 4.92% wide. The uptrend has lasted 16 hours 35 minutes, with a maximum recorded price increase of 40.73%. If price loses this support zone, the trend is highly likely to reverse downward.
$ARK - Mcap 50.65M$ - 24h Sentiment +6.45 Bullish SC02 M5 - pending Long order. Entry lies within HVN + not affected by any weak zone, the current support zone is approximately 4.92% wide. The uptrend has lasted 16 hours 35 minutes, with a maximum recorded price increase of 40.73%. If price loses this support zone, the trend is highly likely to reverse downward.
2
Microsoft перестраивает Copilot в единую платформу ИИ для рабочих процессов
🧩 Microsoft объединяет Copilot в одном приложении, построенном вокруг трех ключевых уровней — Home, Code и Autopilot — по мере того, как продукт выходит за рамки отдельного чат-бота и превращается в центральный интерфейс для цифровой работы.
💻 Home включает Chat, Cowork и Office прямо в Copilot, а Code позволяет пользователям создавать приложения, дашборды и автоматизации с помощью естественного языка. Autopilot ориентирован на облачные агенты, которые могут продолжать работу и координироваться через Teams или Outlook.
💰 Важный сдвиг — в коммерческой модели: Microsoft уходит от фиксированного ценообразования за пользователя к смешанному подходу, где применяется лицензирование и биллинг, зависящий от потребления. Более «тяжелые» нагрузки вроде Cowork, Code, Autopilot и моделей переднего края будут тарифицироваться по фактическому использованию.
📌 Большинство функций все еще внедряется поэтапно, поэтому в ближайшей перспективе эффект будет в первую очередь стратегическим и конкурентным. Вклад в выручку в дальнейшем будет зависеть от скорости развертывания и уровня принятия в компаниях.
#Microsoft
$MSFT
Microsoft перестраивает Copilot в единую платформу ИИ для рабочих процессов
🧩 Microsoft объединяет Copilot в одном приложении, построенном вокруг трех ключевых уровней — Home, Code и Autopilot — по мере того, как продукт выходит за рамки отдельного чат-бота и превращается в центральный интерфейс для цифровой работы.
💻 Home включает Chat, Cowork и Office прямо в Copilot, а Code позволяет пользователям создавать приложения, дашборды и автоматизации с помощью естественного языка. Autopilot ориентирован на облачные агенты, которые могут продолжать работу и координироваться через Teams или Outlook.
💰 Важный сдвиг — в коммерческой модели: Microsoft уходит от фиксированного ценообразования за пользователя к смешанному подходу, где применяется лицензирование и биллинг, зависящий от потребления. Более «тяжелые» нагрузки вроде Cowork, Code, Autopilot и моделей переднего края будут тарифицироваться по фактическому использованию.
📌 Большинство функций все еще внедряется поэтапно, поэтому в ближайшей перспективе эффект будет в первую очередь стратегическим и конкурентным. Вклад в выручку в дальнейшем будет зависеть от скорости развертывания и уровня принятия в компаниях.
#Microsoft
$MSFT
🧩 Microsoft объединяет Copilot в одном приложении, построенном вокруг трех ключевых уровней — Home, Code и Autopilot — по мере того, как продукт выходит за рамки отдельного чат-бота и превращается в центральный интерфейс для цифровой работы.
💻 Home включает Chat, Cowork и Office прямо в Copilot, а Code позволяет пользователям создавать приложения, дашборды и автоматизации с помощью естественного языка. Autopilot ориентирован на облачные агенты, которые могут продолжать работу и координироваться через Teams или Outlook.
💰 Важный сдвиг — в коммерческой модели: Microsoft уходит от фиксированного ценообразования за пользователя к смешанному подходу, где применяется лицензирование и биллинг, зависящий от потребления. Более «тяжелые» нагрузки вроде Cowork, Code, Autopilot и моделей переднего края будут тарифицироваться по фактическому использованию.
📌 Большинство функций все еще внедряется поэтапно, поэтому в ближайшей перспективе эффект будет в первую очередь стратегическим и конкурентным. Вклад в выручку в дальнейшем будет зависеть от скорости развертывания и уровня принятия в компаниях.
#Microsoft
$MSFT

23
См. перевод
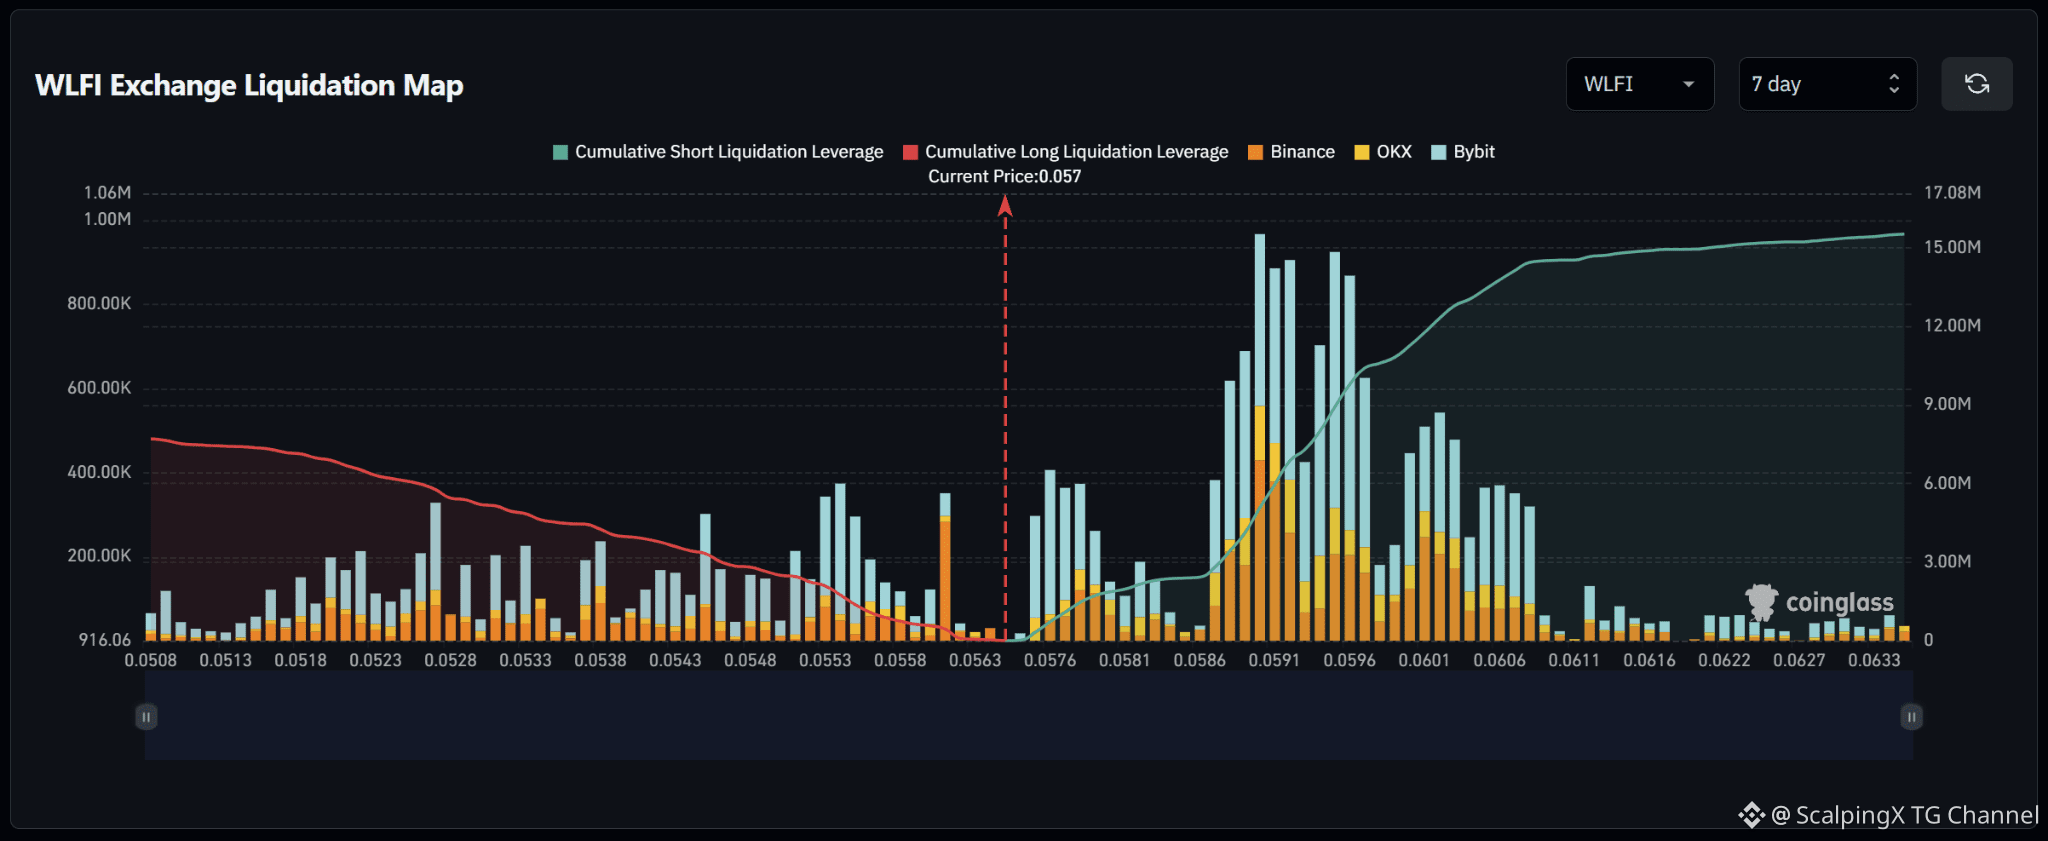
$WLFI – Liquidation Map (7 Days) – Current Price 0.057 🔎 The 7-day liquidation map shows roughly 15–16 million USD in short liquidations above the current price, significantly exceeding approximately 7–8 million USD in long liquidations below. The liquidity structure therefore clearly favors the upside, with around twice as much cumulative liquidity above the market. 📉 Below the market, long-liquidation liquidity is relatively dispersed. Notable clusters appear around 0.0552–0.0555 with a bar near 0.35–0.37 million USD, while the 0.0525–0.0545 area contains several smaller pockets around 0.15–0.30 million USD. Losing 0.0563 would shift attention toward 0.0555–0.0552 and then 0.0545–0.0538. 📈 Above the market, short-liquidation liquidity is heavily concentrated across 0.0586–0.0607. The strongest cluster sits around 0.0589–0.0596 with several bars near 0.7–0.95 million USD, while 0.0600–0.0604 also contains multiple bars around 0.45–0.55 million USD. This is currently the most prominent liquidity band on the map. 🧭 The broader setup clearly favors the upside because short-liquidation exposure above is roughly twice as large. Breaking above 0.0580 would expose 0.0589–0.0596; if momentum continues, 0.0600–0.0607 becomes the next major liquidity magnet. Losing 0.0563 would instead increase the probability of a sweep toward 0.0555–0.0552.
$WLFI – Liquidation Map (7 Days) – Current Price 0.057 🔎 The 7-day liquidation map shows roughly 15–16 million USD in short liquidations above the current price, significantly exceeding approximately 7–8 million USD in long liquidations below. The liquidity structure therefore clearly favors the upside, with around twice as much cumulative liquidity above the market. 📉 Below the market, long-liquidation liquidity is relatively dispersed. Notable clusters appear around 0.0552–0.0555 with a bar near 0.35–0.37 million USD, while the 0.0525–0.0545 area contains several smaller pockets around 0.15–0.30 million USD. Losing 0.0563 would shift attention toward 0.0555–0.0552 and then 0.0545–0.0538. 📈 Above the market, short-liquidation liquidity is heavily concentrated across 0.0586–0.0607. The strongest cluster sits around 0.0589–0.0596 with several bars near 0.7–0.95 million USD, while 0.0600–0.0604 also contains multiple bars around 0.45–0.55 million USD. This is currently the most prominent liquidity band on the map. 🧭 The broader setup clearly favors the upside because short-liquidation exposure above is roughly twice as large. Breaking above 0.0580 would expose 0.0589–0.0596; if momentum continues, 0.0600–0.0607 becomes the next major liquidity magnet. Losing 0.0563 would instead increase the probability of a sweep toward 0.0555–0.0552.
См. перевод
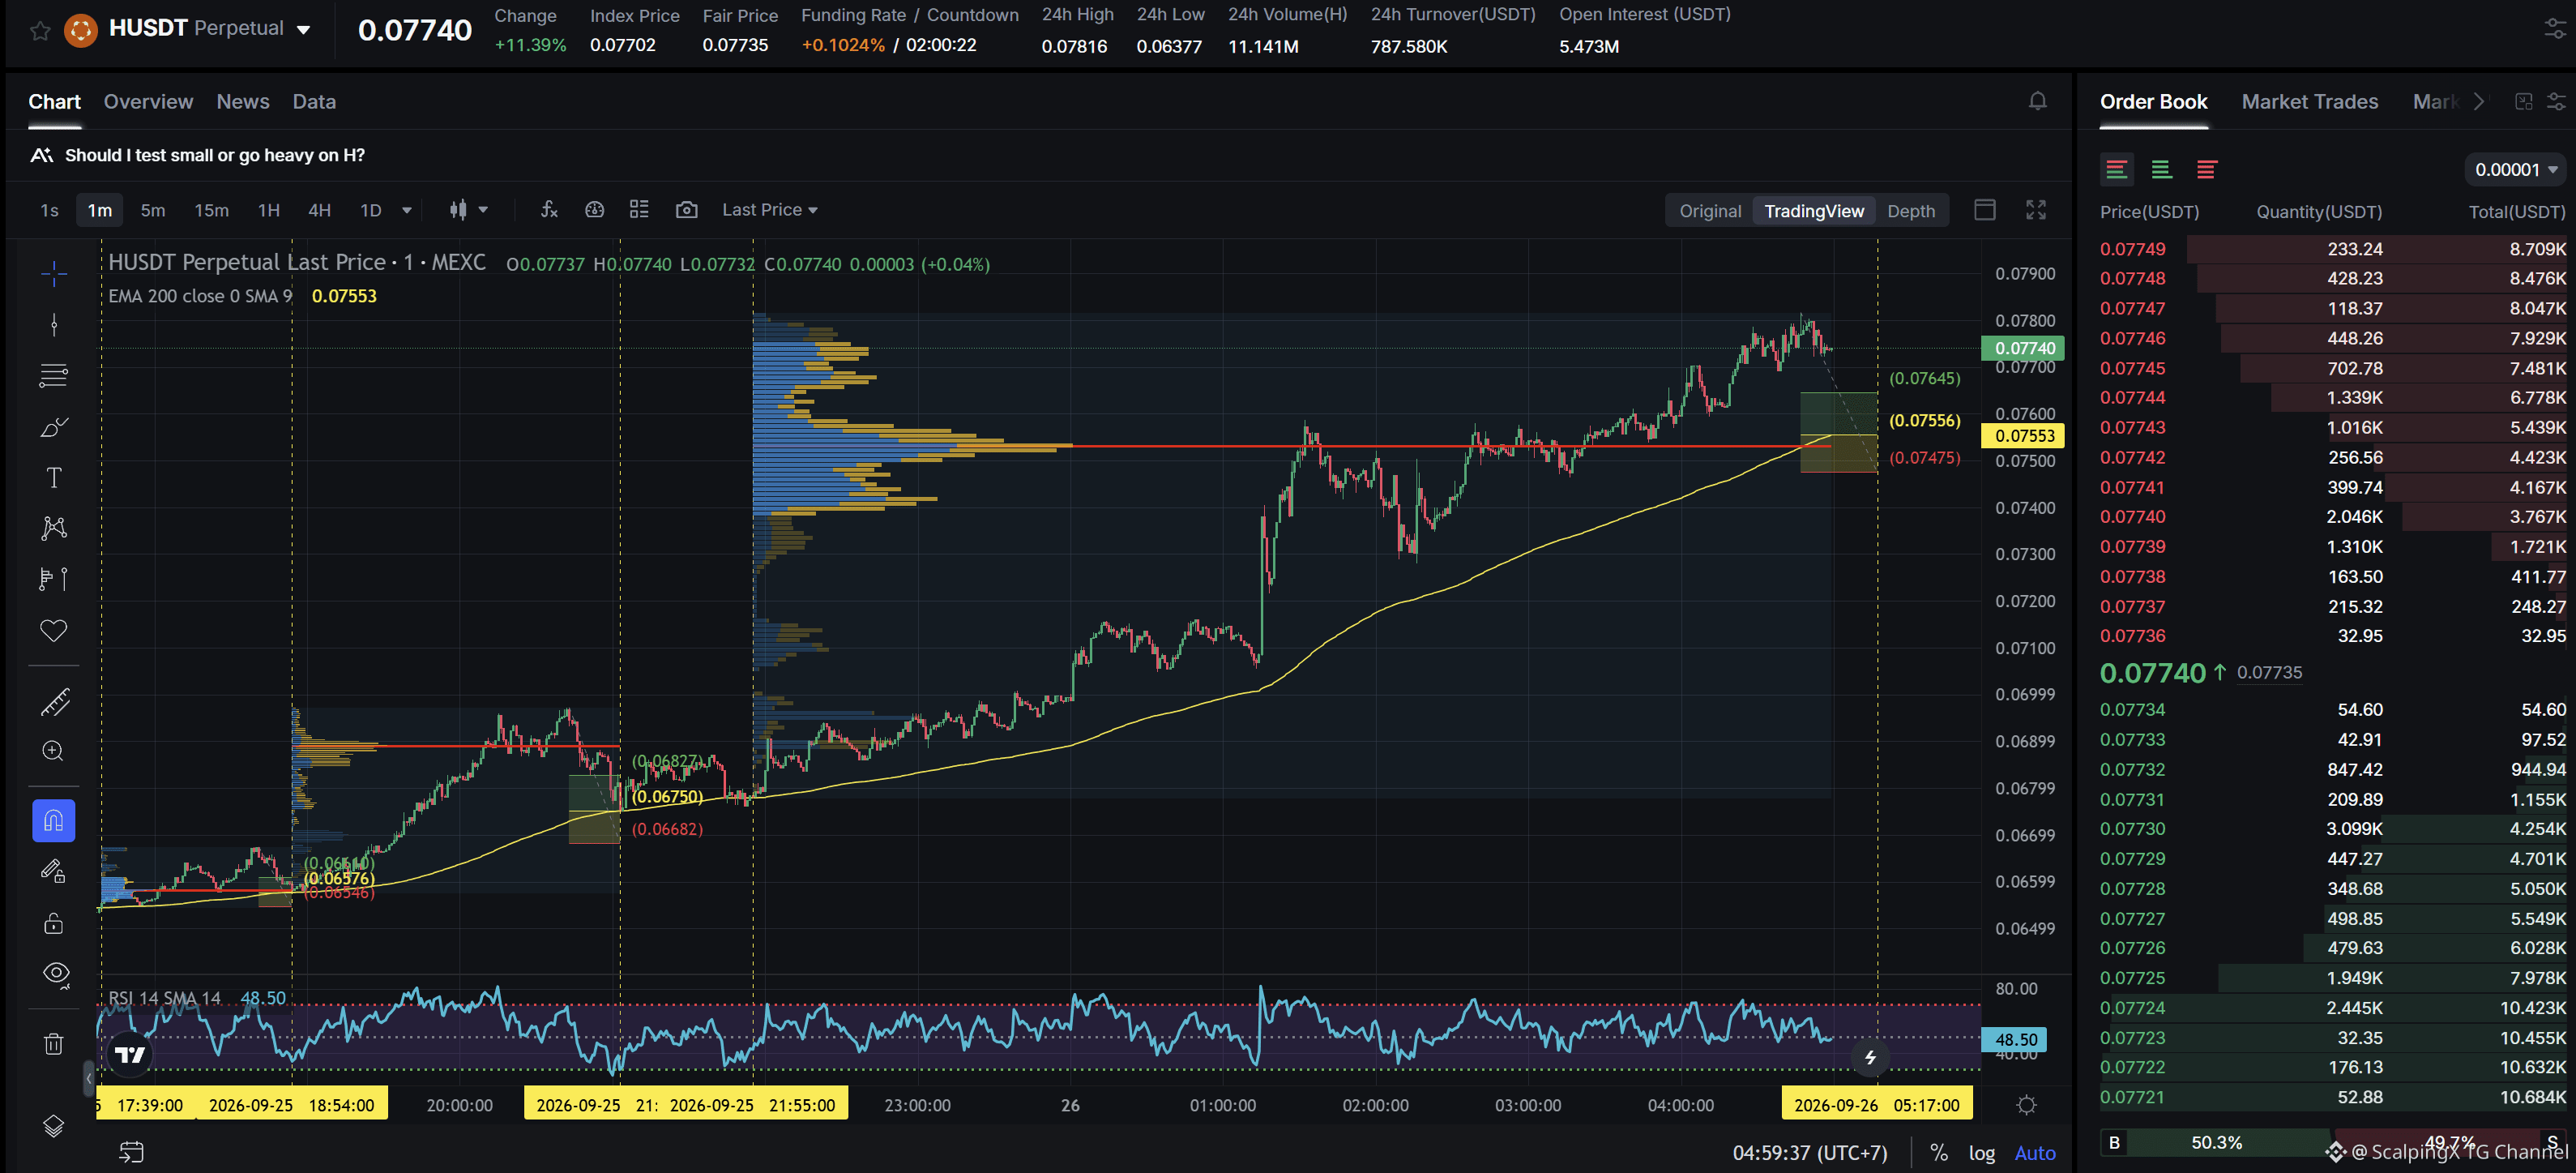
$H - Mcap 154.69M$ - 24h Sentiment +4.52 Bullish SC02 M1 - pending Long order. Entry contains POC + meets positive simplification with two consecutive previously highly profitable Long orders, the current support zone is approximately 1.09% wide. The uptrend has lasted 7 hours 7 minutes, with a maximum recorded price increase of 15.29%. If price loses this support zone, the trend is highly likely to reverse downward.
$H - Mcap 154.69M$ - 24h Sentiment +4.52 Bullish SC02 M1 - pending Long order. Entry contains POC + meets positive simplification with two consecutive previously highly profitable Long orders, the current support zone is approximately 1.09% wide. The uptrend has lasted 7 hours 7 minutes, with a maximum recorded price increase of 15.29%. If price loses this support zone, the trend is highly likely to reverse downward.
См. перевод
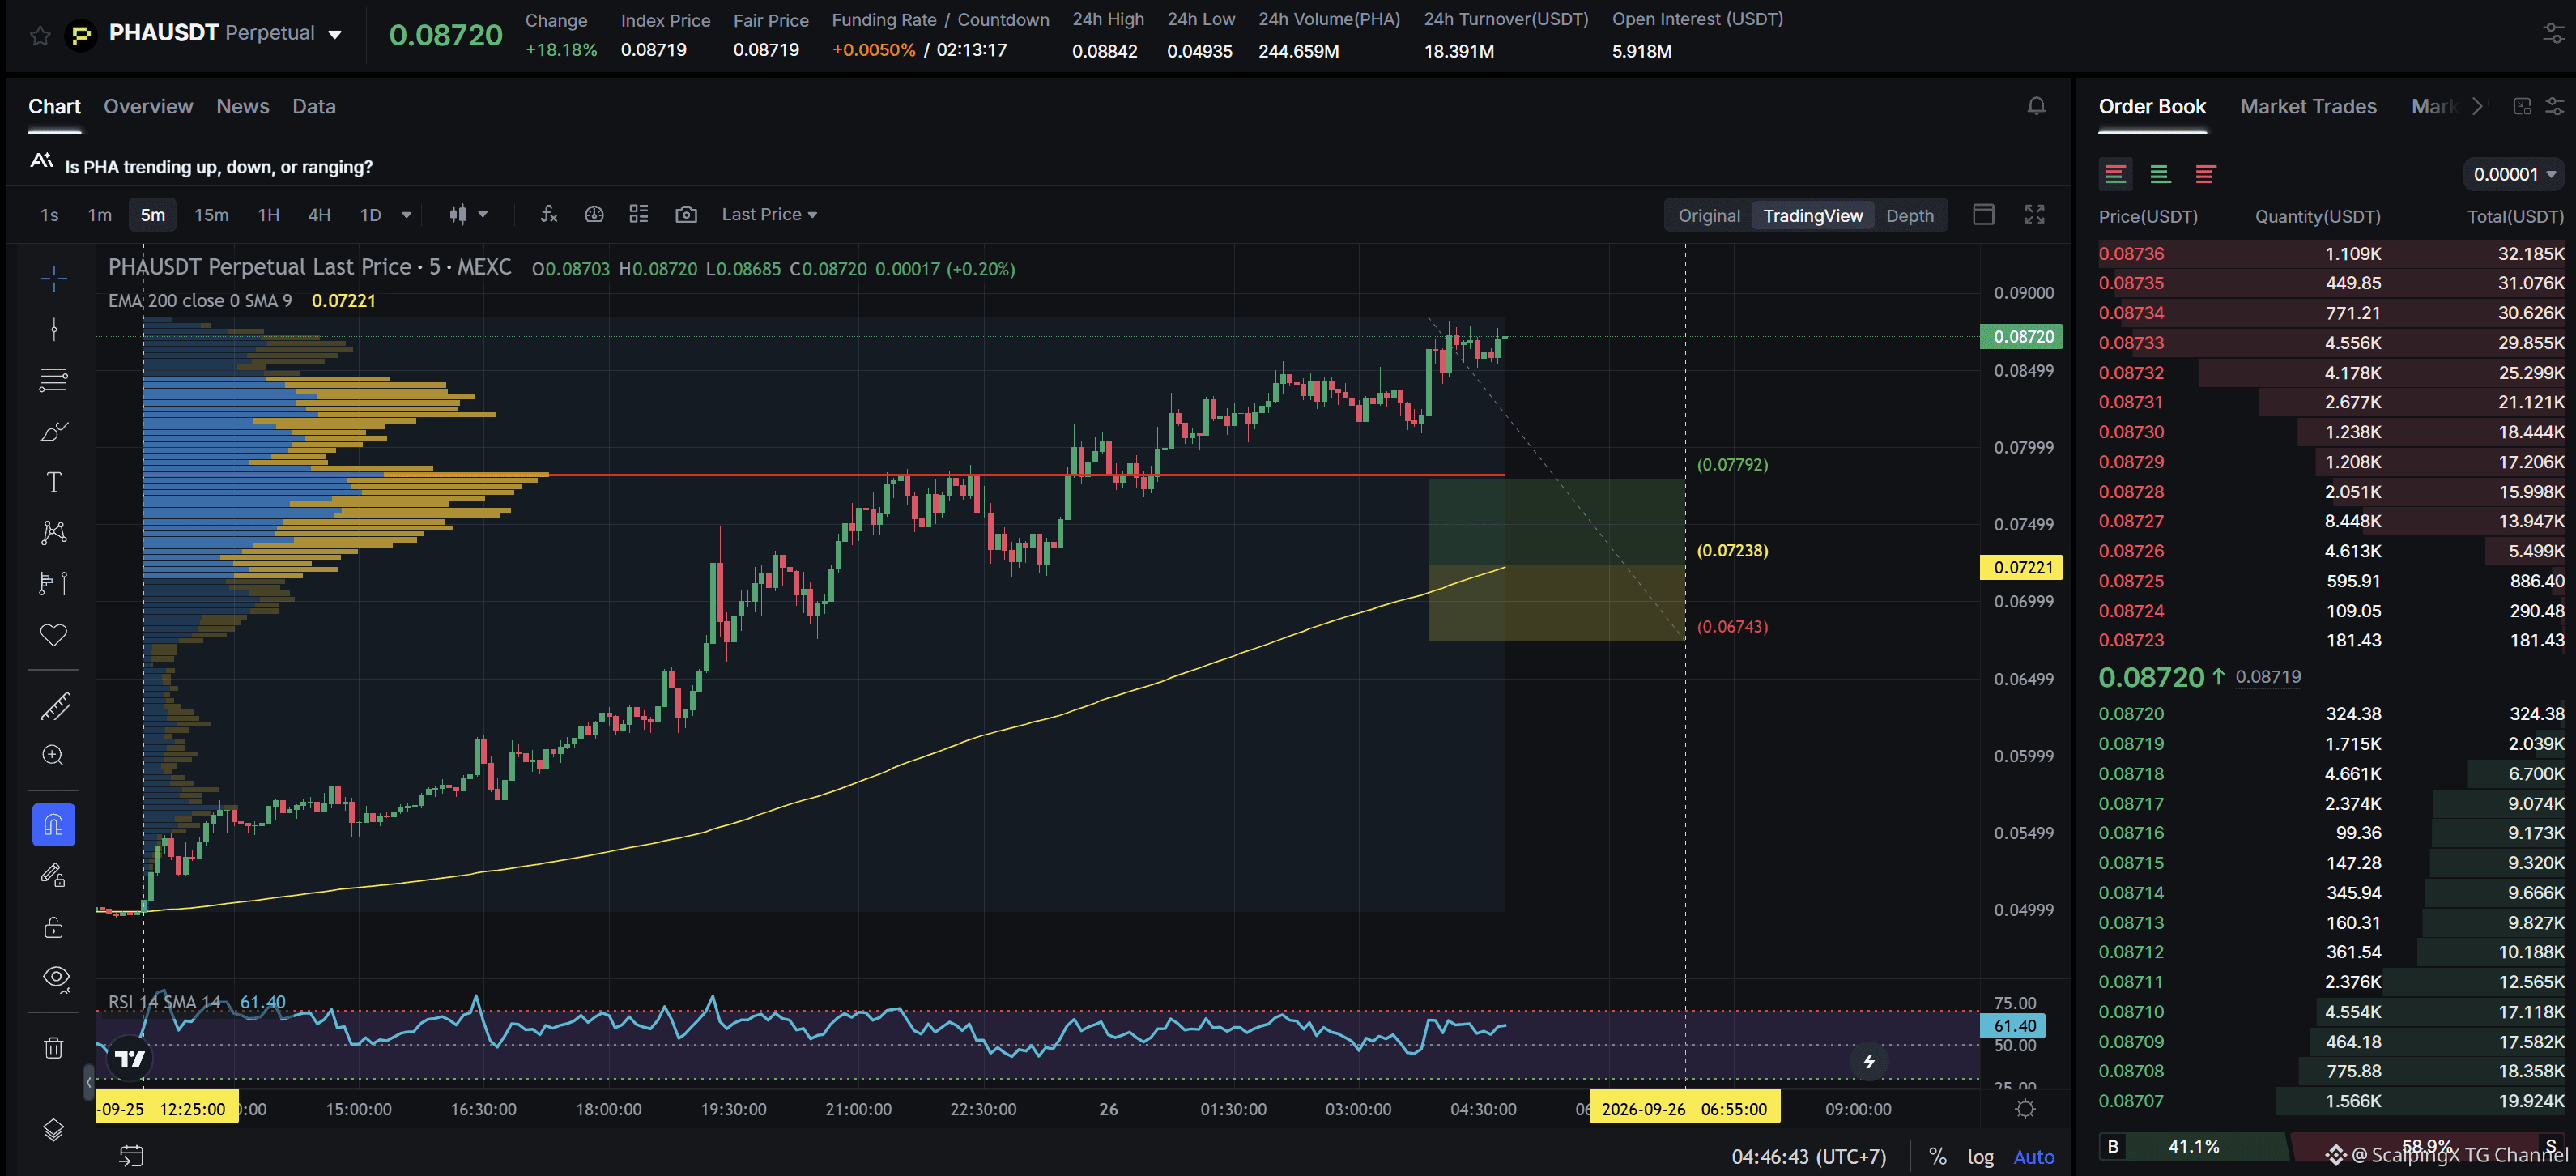
$PHA - Mcap 75.5M$ - 24h Sentiment +4.65 Bullish SC02 M5 - pending Long order. Entry lies within LVN + not affected by any weak zone, the current support zone is approximately 6.87% wide. The uptrend has lasted 16 hours 20 minutes, with a maximum recorded price increase of 79.55%. If price loses this support zone, the trend is highly likely to reverse downward.
$PHA - Mcap 75.5M$ - 24h Sentiment +4.65 Bullish SC02 M5 - pending Long order. Entry lies within LVN + not affected by any weak zone, the current support zone is approximately 6.87% wide. The uptrend has lasted 16 hours 20 minutes, with a maximum recorded price increase of 79.55%. If price loses this support zone, the trend is highly likely to reverse downward.
Настроения американских потребителей падают до минимума за четыре месяца на фоне сохраняющихся повышенных инфляционных ожиданий
📉 Финальный сентябрьский индекс потребительских настроений от Мичиганского университета составил 48,1 — немного выше предварительного 47,8 и ожиданий около 47,5–47,6, однако он все равно снизился на 7% по сравнению с августом.
🔎 Слабость была сосредоточена в прогнозах: Индекс ожиданий упал на 10,1% до 46,3, тогда как Текущие условия снизились лишь на 1,9%. Это указывает на то, что потребители больше обеспокоены будущими месяцами, чем текущей ситуацией.
🔥 Однолетние инфляционные ожидания удержались на уровне 4,6%, а показатель на пять лет вырос до 3,4%. Более высокие расходы на топливо и давление, связанное с торговлей, продолжают сказываться на настроениях, оставляя обеспокоенность по поводу роста высокой наряду с сохраняющимися ценовыми рисками.
🏦 Финальные данные не принесли нового негативного шока, поскольку ухудшение в основном уже было видно в предварительном релизе. Тем не менее слабые настроения в сочетании с повышенными инфляционными ожиданиями делают перспективы смягчения политики ФРС более сложными.
#USMacro
$ETH
Настроения американских потребителей падают до минимума за четыре месяца на фоне сохраняющихся повышенных инфляционных ожиданий
📉 Финальный сентябрьский индекс потребительских настроений от Мичиганского университета составил 48,1 — немного выше предварительного 47,8 и ожиданий около 47,5–47,6, однако он все равно снизился на 7% по сравнению с августом.
🔎 Слабость была сосредоточена в прогнозах: Индекс ожиданий упал на 10,1% до 46,3, тогда как Текущие условия снизились лишь на 1,9%. Это указывает на то, что потребители больше обеспокоены будущими месяцами, чем текущей ситуацией.
🔥 Однолетние инфляционные ожидания удержались на уровне 4,6%, а показатель на пять лет вырос до 3,4%. Более высокие расходы на топливо и давление, связанное с торговлей, продолжают сказываться на настроениях, оставляя обеспокоенность по поводу роста высокой наряду с сохраняющимися ценовыми рисками.
🏦 Финальные данные не принесли нового негативного шока, поскольку ухудшение в основном уже было видно в предварительном релизе. Тем не менее слабые настроения в сочетании с повышенными инфляционными ожиданиями делают перспективы смягчения политики ФРС более сложными.
#USMacro
$ETH
📉 Финальный сентябрьский индекс потребительских настроений от Мичиганского университета составил 48,1 — немного выше предварительного 47,8 и ожиданий около 47,5–47,6, однако он все равно снизился на 7% по сравнению с августом.
🔎 Слабость была сосредоточена в прогнозах: Индекс ожиданий упал на 10,1% до 46,3, тогда как Текущие условия снизились лишь на 1,9%. Это указывает на то, что потребители больше обеспокоены будущими месяцами, чем текущей ситуацией.
🔥 Однолетние инфляционные ожидания удержались на уровне 4,6%, а показатель на пять лет вырос до 3,4%. Более высокие расходы на топливо и давление, связанное с торговлей, продолжают сказываться на настроениях, оставляя обеспокоенность по поводу роста высокой наряду с сохраняющимися ценовыми рисками.
🏦 Финальные данные не принесли нового негативного шока, поскольку ухудшение в основном уже было видно в предварительном релизе. Тем не менее слабые настроения в сочетании с повышенными инфляционными ожиданиями делают перспективы смягчения политики ФРС более сложными.
#USMacro
$ETH

2
См. перевод
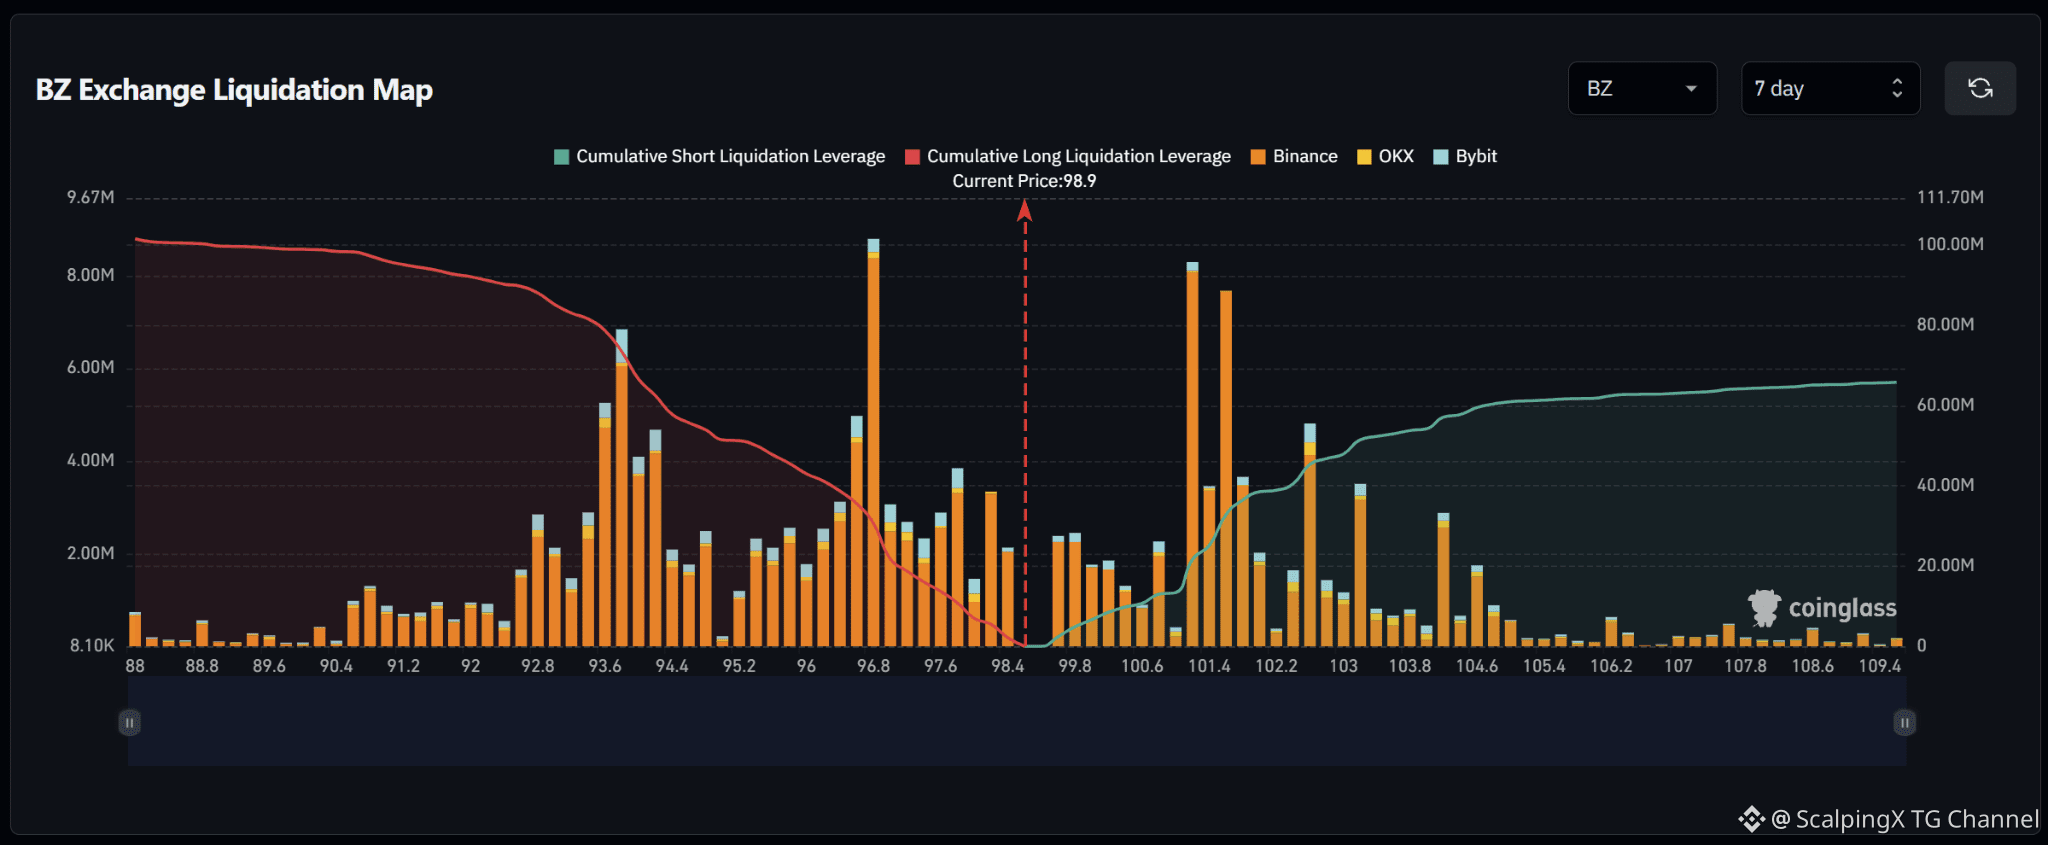
$BZ – Liquidation Map (7 Days) – Current Price 98.9 🔎 The 7-day liquidation map shows roughly 100 million USD in long liquidations below the current price, significantly exceeding approximately 65 million USD in short liquidations above. The liquidity structure therefore favors the downside, with around 1.5 times more cumulative liquidity below the market. 📉 Below the market, long-liquidation liquidity is concentrated heavily across 93.5–97.8. The strongest cluster sits around 96.7–96.9 with a bar close to 9 million USD; 93.5–94.2 also contains several bars around 4–7 million USD, while 97.5–97.8 holds another cluster near 4 million USD. Losing 98.4 would shift attention toward 97.8–96.7 and then 94.2–93.5. 📈 Above the market, short-liquidation liquidity is concentrated mainly across 101–103. The two strongest clusters sit around 101.2 and 101.6 with bars near 8 million USD, while 102.6–103.2 contains several pockets around 3–5 million USD. Further out, 104.2–104.6 still holds some notable liquidity. 🧭 The broader setup favors the downside because long-liquidation exposure below is larger. Losing 98.4 would increase the probability of a sweep toward 97.8–96.7, followed by 94.2–93.5. Breaking above 100.6 would instead expose 101.2–101.6 and then 102.6–103.2.
$BZ – Liquidation Map (7 Days) – Current Price 98.9 🔎 The 7-day liquidation map shows roughly 100 million USD in long liquidations below the current price, significantly exceeding approximately 65 million USD in short liquidations above. The liquidity structure therefore favors the downside, with around 1.5 times more cumulative liquidity below the market. 📉 Below the market, long-liquidation liquidity is concentrated heavily across 93.5–97.8. The strongest cluster sits around 96.7–96.9 with a bar close to 9 million USD; 93.5–94.2 also contains several bars around 4–7 million USD, while 97.5–97.8 holds another cluster near 4 million USD. Losing 98.4 would shift attention toward 97.8–96.7 and then 94.2–93.5. 📈 Above the market, short-liquidation liquidity is concentrated mainly across 101–103. The two strongest clusters sit around 101.2 and 101.6 with bars near 8 million USD, while 102.6–103.2 contains several pockets around 3–5 million USD. Further out, 104.2–104.6 still holds some notable liquidity. 🧭 The broader setup favors the downside because long-liquidation exposure below is larger. Losing 98.4 would increase the probability of a sweep toward 97.8–96.7, followed by 94.2–93.5. Breaking above 100.6 would instead expose 101.2–101.6 and then 102.6–103.2.
1
См. перевод
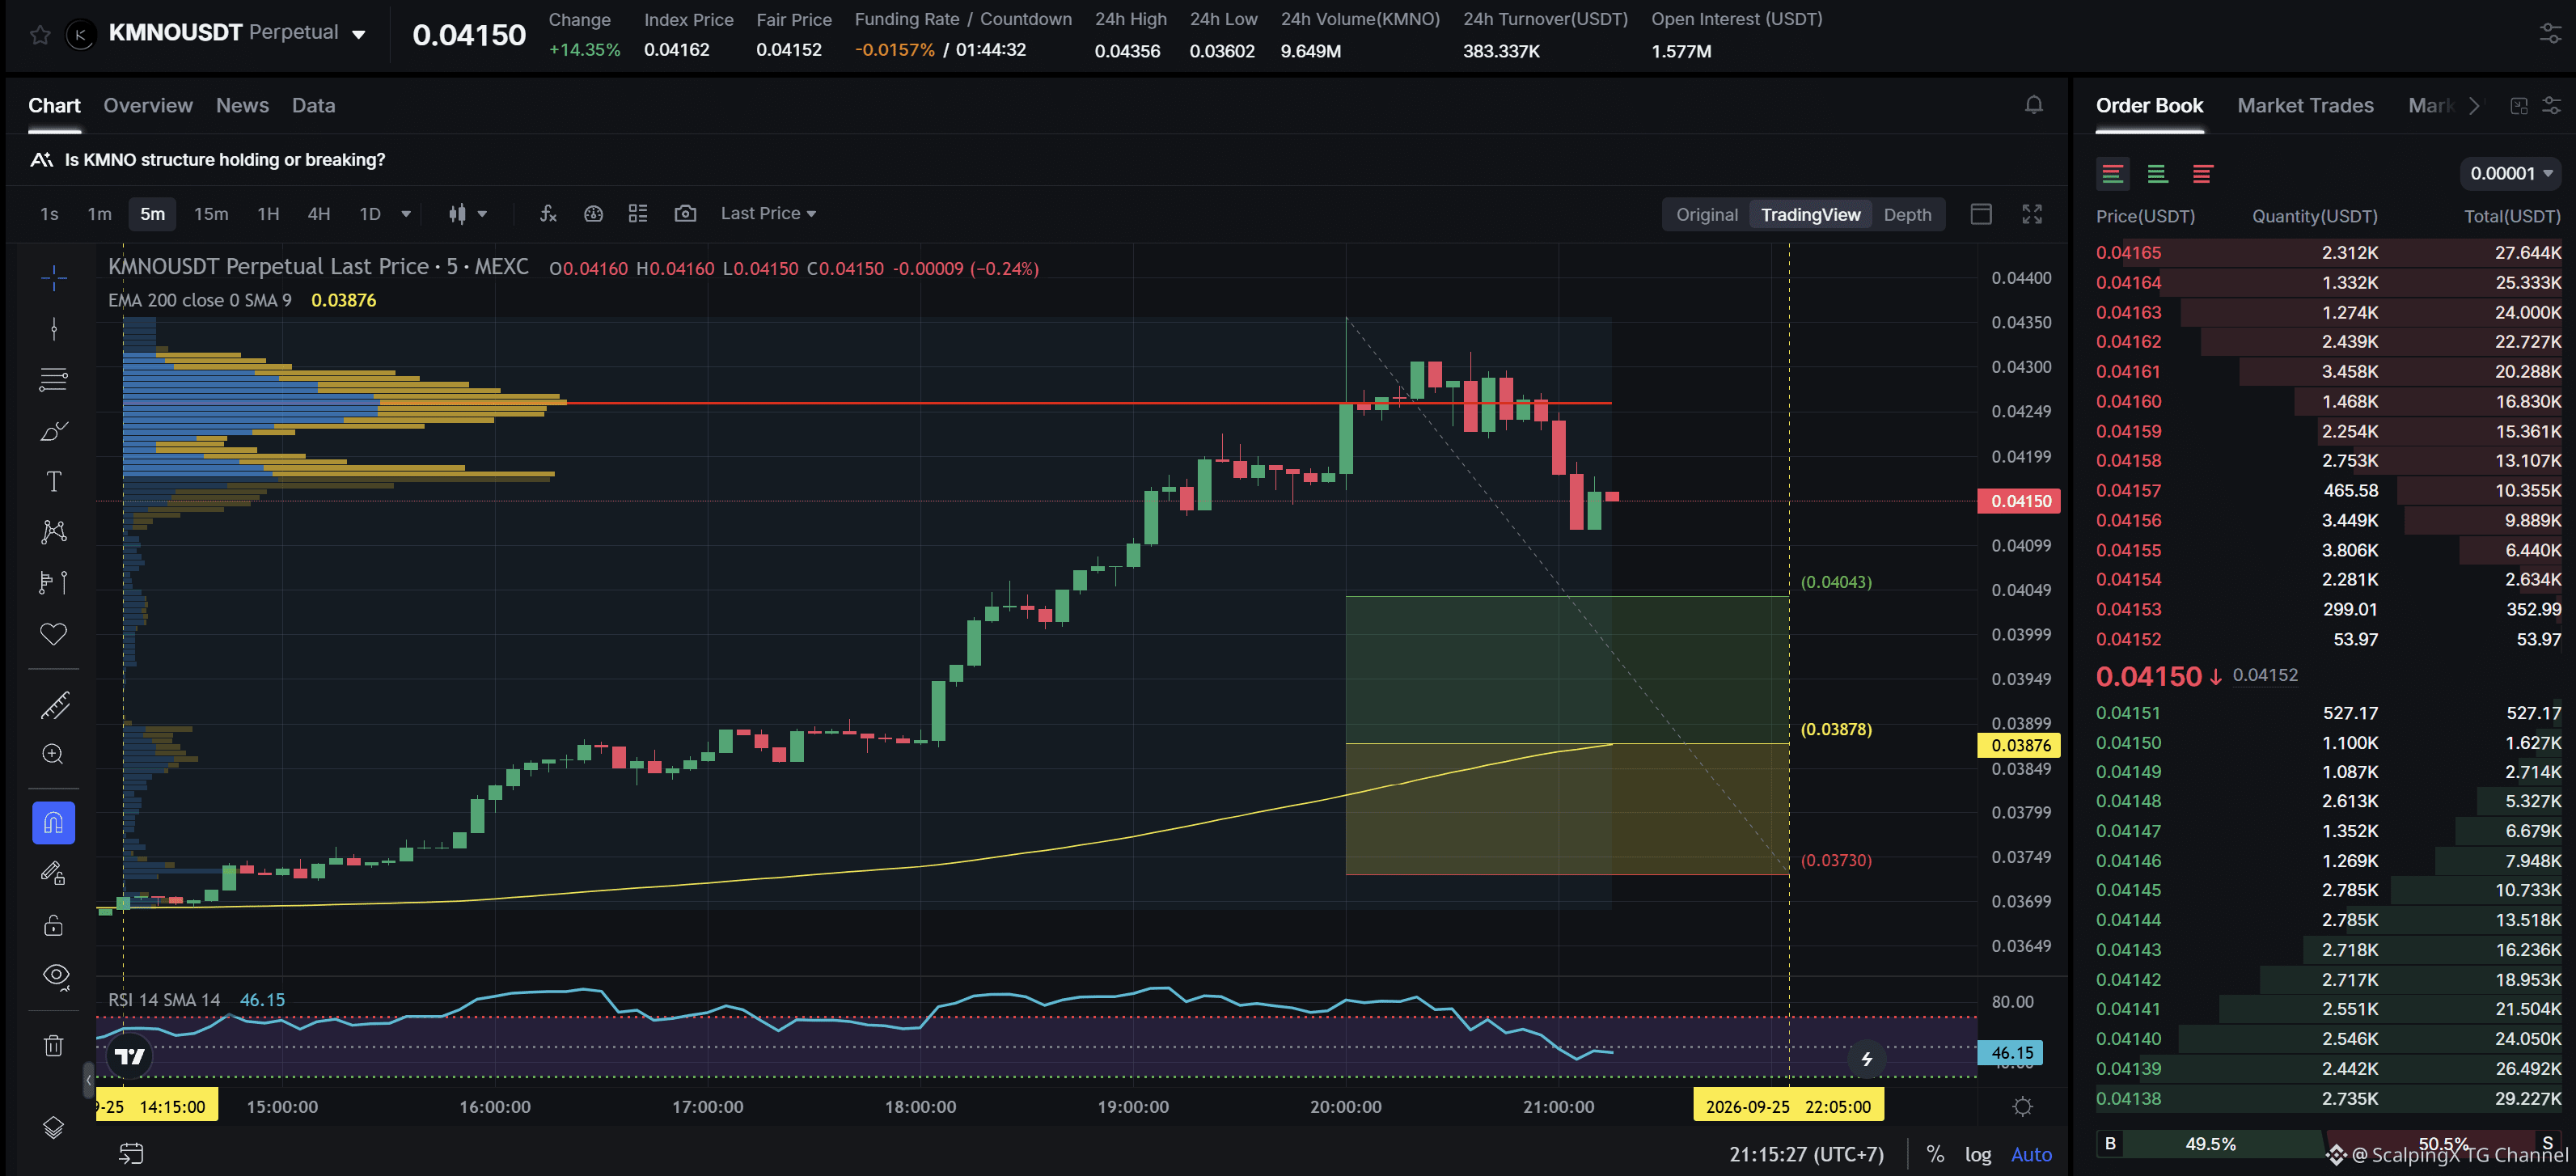
$KMNO - Mcap 235.4M$ - 24h Sentiment Neutral SC02 M5 - pending Long order. Entry lies within LVN + not affected by any weak zone, the current support zone is approximately 3.85% wide. The uptrend has lasted 7 hours, with a maximum recorded price increase of 17.91%. If price loses this support zone, the trend is highly likely to reverse downward.
$KMNO - Mcap 235.4M$ - 24h Sentiment Neutral SC02 M5 - pending Long order. Entry lies within LVN + not affected by any weak zone, the current support zone is approximately 3.85% wide. The uptrend has lasted 7 hours, with a maximum recorded price increase of 17.91%. If price loses this support zone, the trend is highly likely to reverse downward.
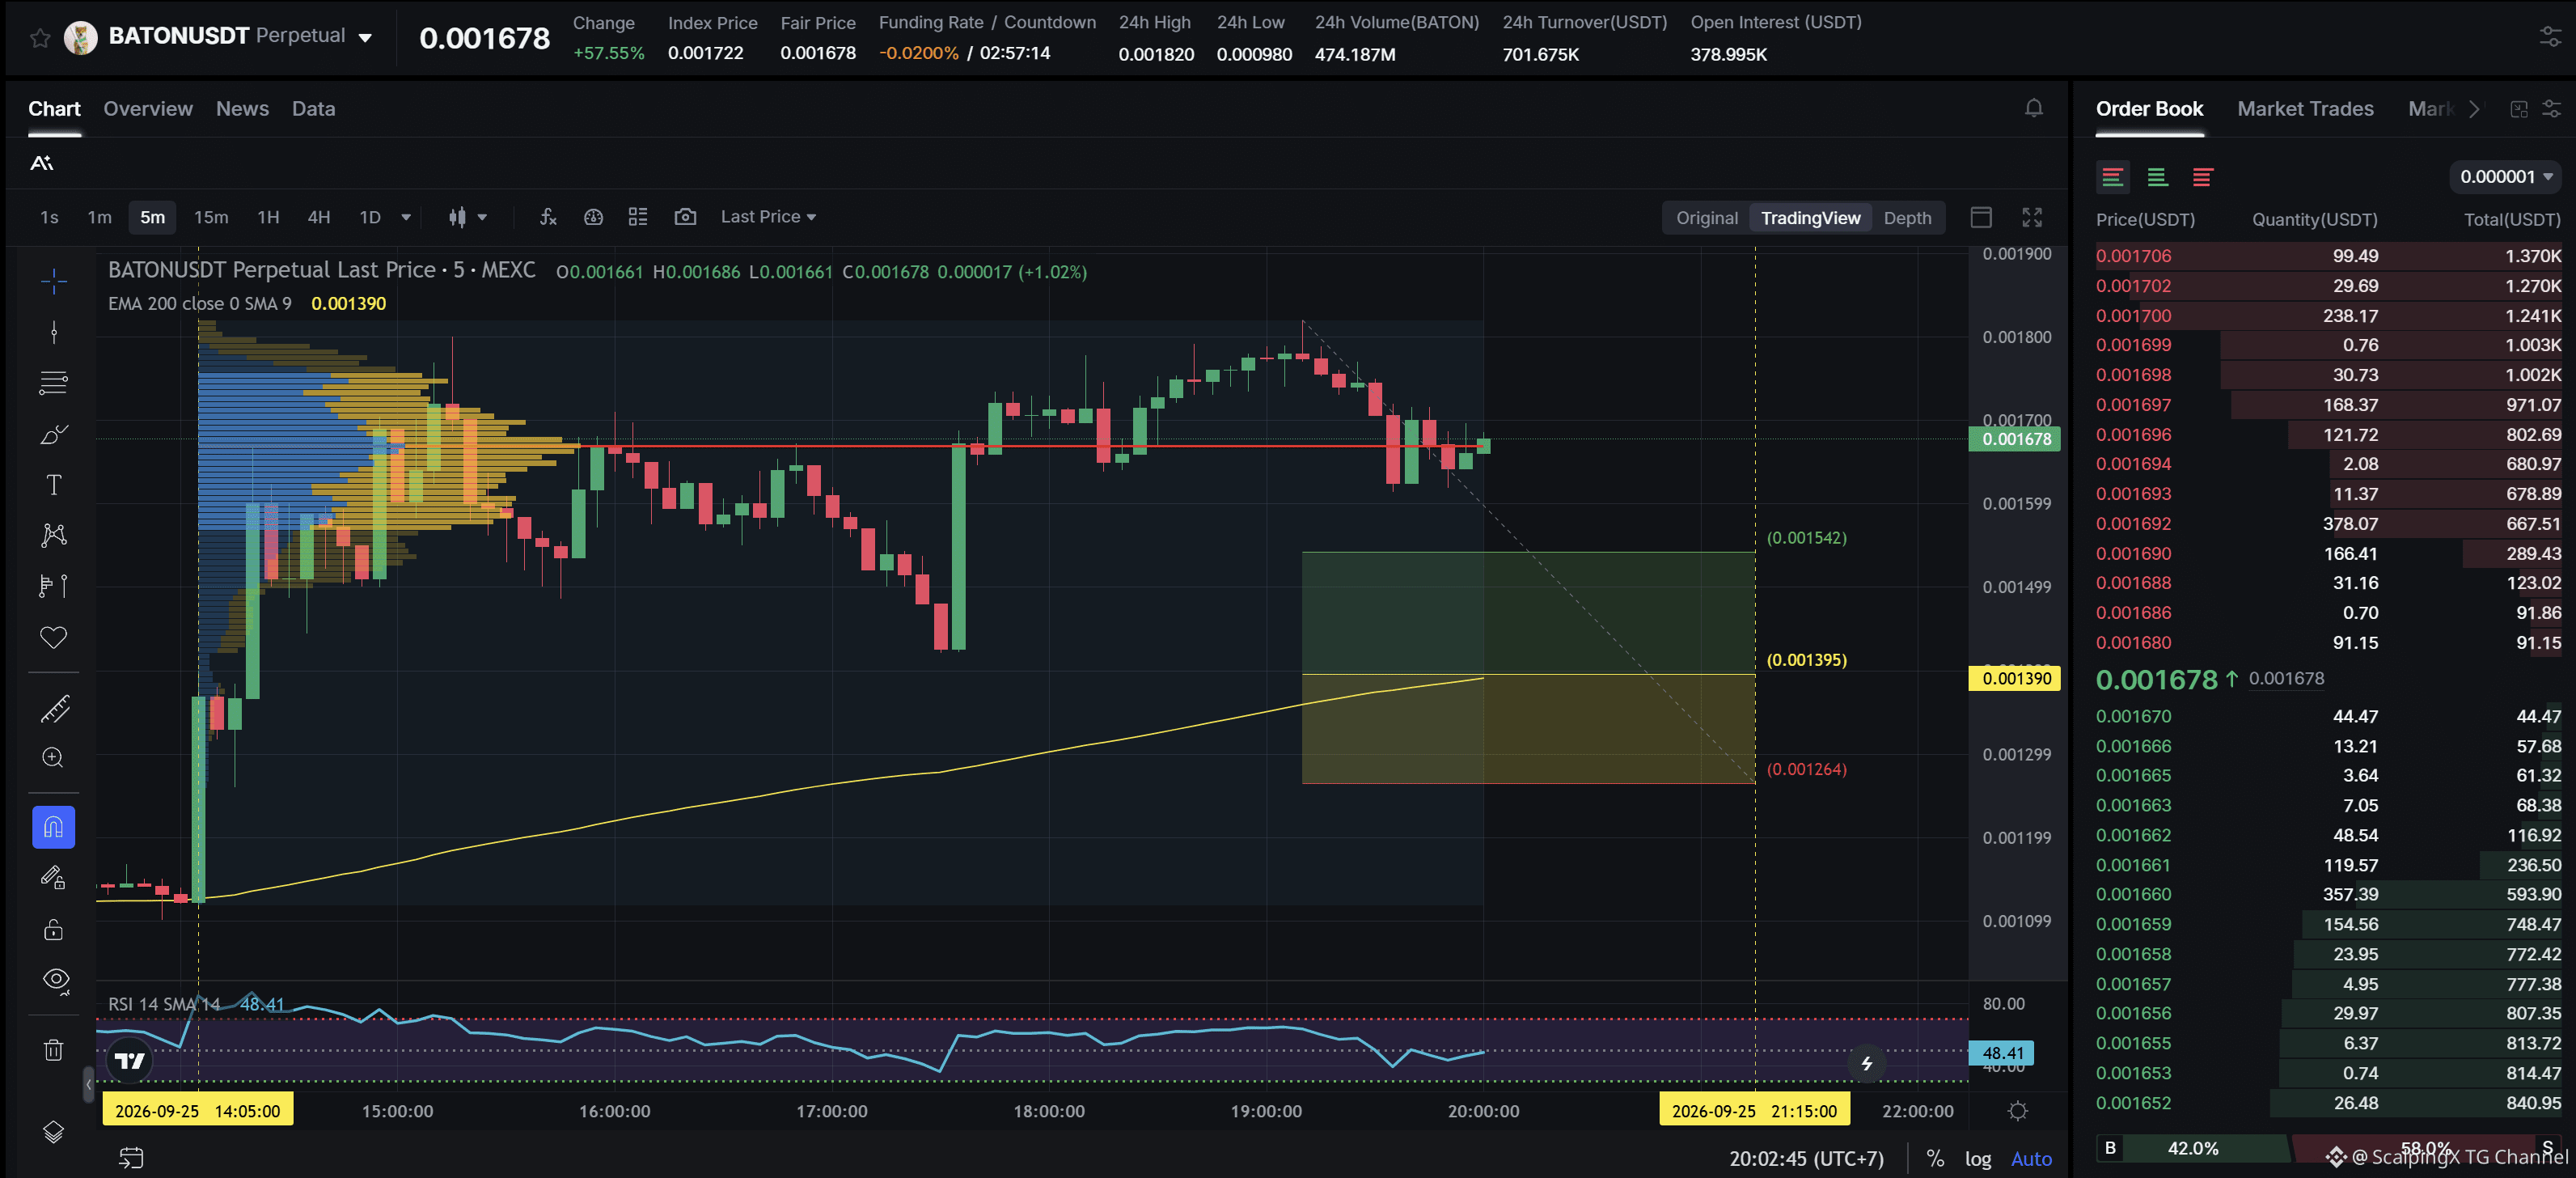
$BATON - FDV 1.7M$ SC02 M5 - ожидание длинного ордера. Точка входа находится в пределах LVN и не затрагивается никакой слабой зоной; текущая зона поддержки имеет ширину примерно 9.14%. Восходящий тренд длится 5 часов 55 минут, при этом зафиксированный максимальный рост цены составил 61.86%. Если цена потеряет эту зону поддержки, с высокой вероятностью произойдет разворот тренда вниз.
$BATON - FDV 1.7M$ SC02 M5 - ожидание длинного ордера. Точка входа находится в пределах LVN и не затрагивается никакой слабой зоной; текущая зона поддержки имеет ширину примерно 9.14%. Восходящий тренд длится 5 часов 55 минут, при этом зафиксированный максимальный рост цены составил 61.86%. Если цена потеряет эту зону поддержки, с высокой вероятностью произойдет разворот тренда вниз.
1
Хэyнг Сенг падает третью сессию подряд, закрываясь около двухмесячного минимума
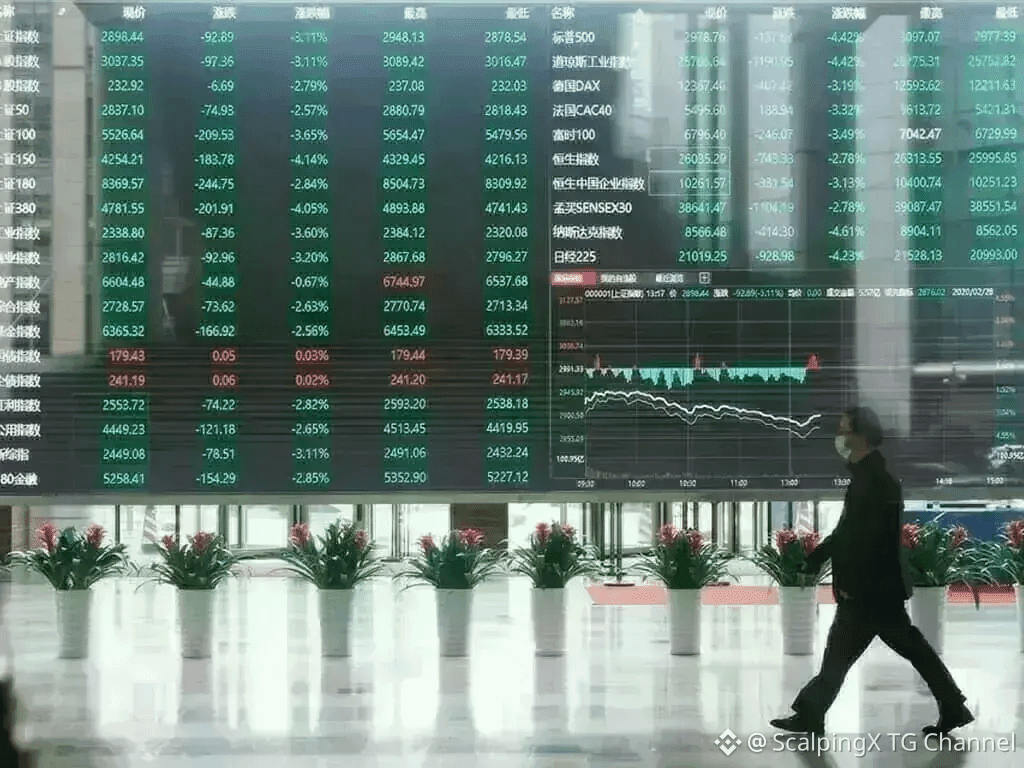
📉 Индекс Hang Seng закрылся 25 сентября на отметке 24 510,09, снизившись на 1,01%, зафиксировав третью подряд торговую сессию в минусе. Индекс Hang Seng Tech упал на 1,13% до 4 311,78: технологические и страховые акции продолжают оказывать давление на рынок.
📊 Внутридневно HSI снижался почти на 2% до 24 275,56, прежде чем частично отыграть потери во второй половине дня. Отскок указывает на то, что давление ранних продаж ослабло, однако индекс все равно завершил торги примерно на своем минимуме за последние около двух месяцев.
💧 Объем торгов на рынке составил лишь около 102,2 млрд гонконгских долларов, поскольку Stock Connect был закрыт, а рынки материкового Китая не работали из‑за праздника. Открытие материковых рынков 28 сентября станет следующим ключевым тестом того, сохраняется ли текущая тенденция к продажам.
#MarketInsights
$BNB
Хэyнг Сенг падает третью сессию подряд, закрываясь около двухмесячного минимума
📉 Индекс Hang Seng закрылся 25 сентября на отметке 24 510,09, снизившись на 1,01%, зафиксировав третью подряд торговую сессию в минусе. Индекс Hang Seng Tech упал на 1,13% до 4 311,78: технологические и страховые акции продолжают оказывать давление на рынок.
📊 Внутридневно HSI снижался почти на 2% до 24 275,56, прежде чем частично отыграть потери во второй половине дня. Отскок указывает на то, что давление ранних продаж ослабло, однако индекс все равно завершил торги примерно на своем минимуме за последние около двух месяцев.
💧 Объем торгов на рынке составил лишь около 102,2 млрд гонконгских долларов, поскольку Stock Connect был закрыт, а рынки материкового Китая не работали из‑за праздника. Открытие материковых рынков 28 сентября станет следующим ключевым тестом того, сохраняется ли текущая тенденция к продажам.
#MarketInsights
$BNB
📉 Индекс Hang Seng закрылся 25 сентября на отметке 24 510,09, снизившись на 1,01%, зафиксировав третью подряд торговую сессию в минусе. Индекс Hang Seng Tech упал на 1,13% до 4 311,78: технологические и страховые акции продолжают оказывать давление на рынок.
📊 Внутридневно HSI снижался почти на 2% до 24 275,56, прежде чем частично отыграть потери во второй половине дня. Отскок указывает на то, что давление ранних продаж ослабло, однако индекс все равно завершил торги примерно на своем минимуме за последние около двух месяцев.
💧 Объем торгов на рынке составил лишь около 102,2 млрд гонконгских долларов, поскольку Stock Connect был закрыт, а рынки материкового Китая не работали из‑за праздника. Открытие материковых рынков 28 сентября станет следующим ключевым тестом того, сохраняется ли текущая тенденция к продажам.
#MarketInsights
$BNB
2
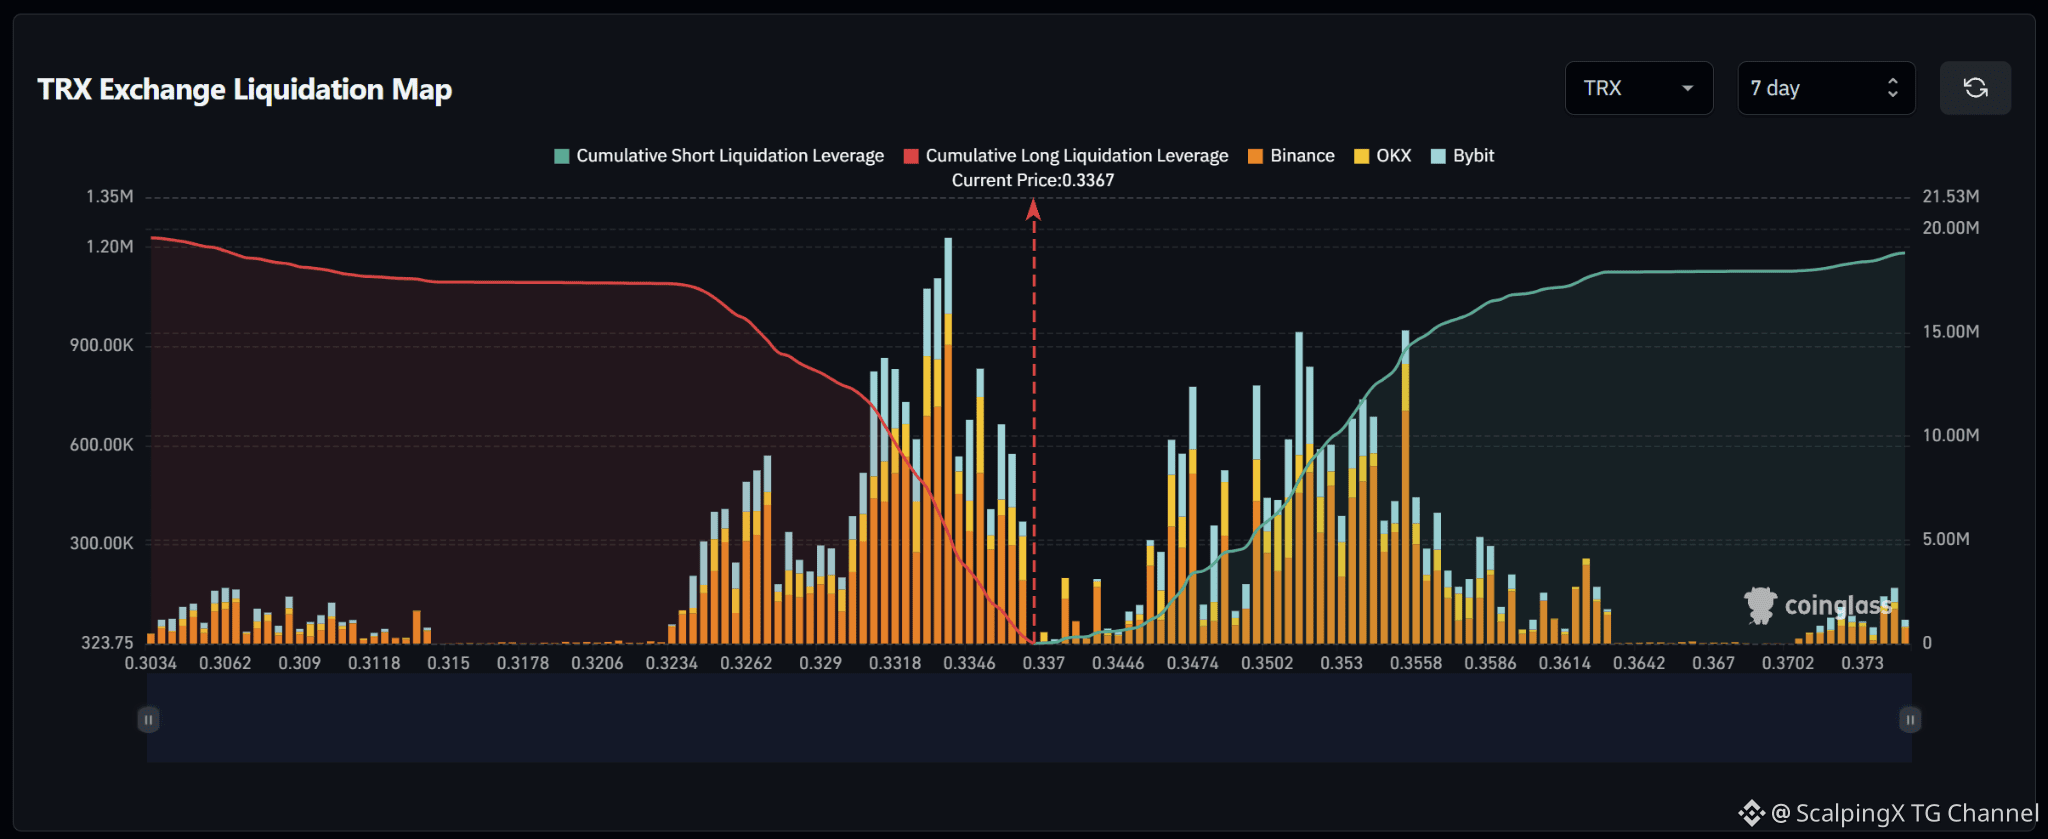
$TRX – Карта ликвидаций (7 дней) – Текущая цена 0.3367 🔎 Карта ликвидаций за 7 дней показывает относительно сбалансированную структуру: и длинные ликвидации ниже, и короткие ликвидации выше находятся примерно на уровне 19–20 млн долларов. Длинно-ликвидационная экспозиция лишь немного больше, поэтому карта имеет очень лёгкий перекос вниз, а не сильный дисбаланс по направлению. 📉 Под рынком ликвидность по длинным ликвидациям сосредоточена в основном в диапазоне 0.326–0.335. Самый сильный кластер находится около 0.333–0.334, где столбец превышает 1.2 млн долларов; при этом 0.331–0.333 также содержит несколько столбцов примерно на 0.8–1.1 млн долларов. Потеря уровня 0.331 сместит фокус на 0.329–0.326. 📈 Над рынком ликвидность по коротким ликвидациям сосредоточена главным образом в диапазоне 0.347–0.356. Заметные кластеры появляются около 0.351–0.353 и 0.355–0.356, при этом несколько столбцов расположены в районе 0.7–0.95 млн долларов. Выше 0.359 ликвидность заметно истончается. 🧭 В целом структура близка к балансу. Потеря 0.331 повысит вероятность срабатывания у 0.329–0.326. Пробой выше 0.347, напротив, откроет зону 0.351–0.356, прежде чем цена войдёт в участок с более тонкой ликвидностью.
$TRX – Карта ликвидаций (7 дней) – Текущая цена 0.3367 🔎 Карта ликвидаций за 7 дней показывает относительно сбалансированную структуру: и длинные ликвидации ниже, и короткие ликвидации выше находятся примерно на уровне 19–20 млн долларов. Длинно-ликвидационная экспозиция лишь немного больше, поэтому карта имеет очень лёгкий перекос вниз, а не сильный дисбаланс по направлению. 📉 Под рынком ликвидность по длинным ликвидациям сосредоточена в основном в диапазоне 0.326–0.335. Самый сильный кластер находится около 0.333–0.334, где столбец превышает 1.2 млн долларов; при этом 0.331–0.333 также содержит несколько столбцов примерно на 0.8–1.1 млн долларов. Потеря уровня 0.331 сместит фокус на 0.329–0.326. 📈 Над рынком ликвидность по коротким ликвидациям сосредоточена главным образом в диапазоне 0.347–0.356. Заметные кластеры появляются около 0.351–0.353 и 0.355–0.356, при этом несколько столбцов расположены в районе 0.7–0.95 млн долларов. Выше 0.359 ликвидность заметно истончается. 🧭 В целом структура близка к балансу. Потеря 0.331 повысит вероятность срабатывания у 0.329–0.326. Пробой выше 0.347, напротив, откроет зону 0.351–0.356, прежде чем цена войдёт в участок с более тонкой ликвидностью.
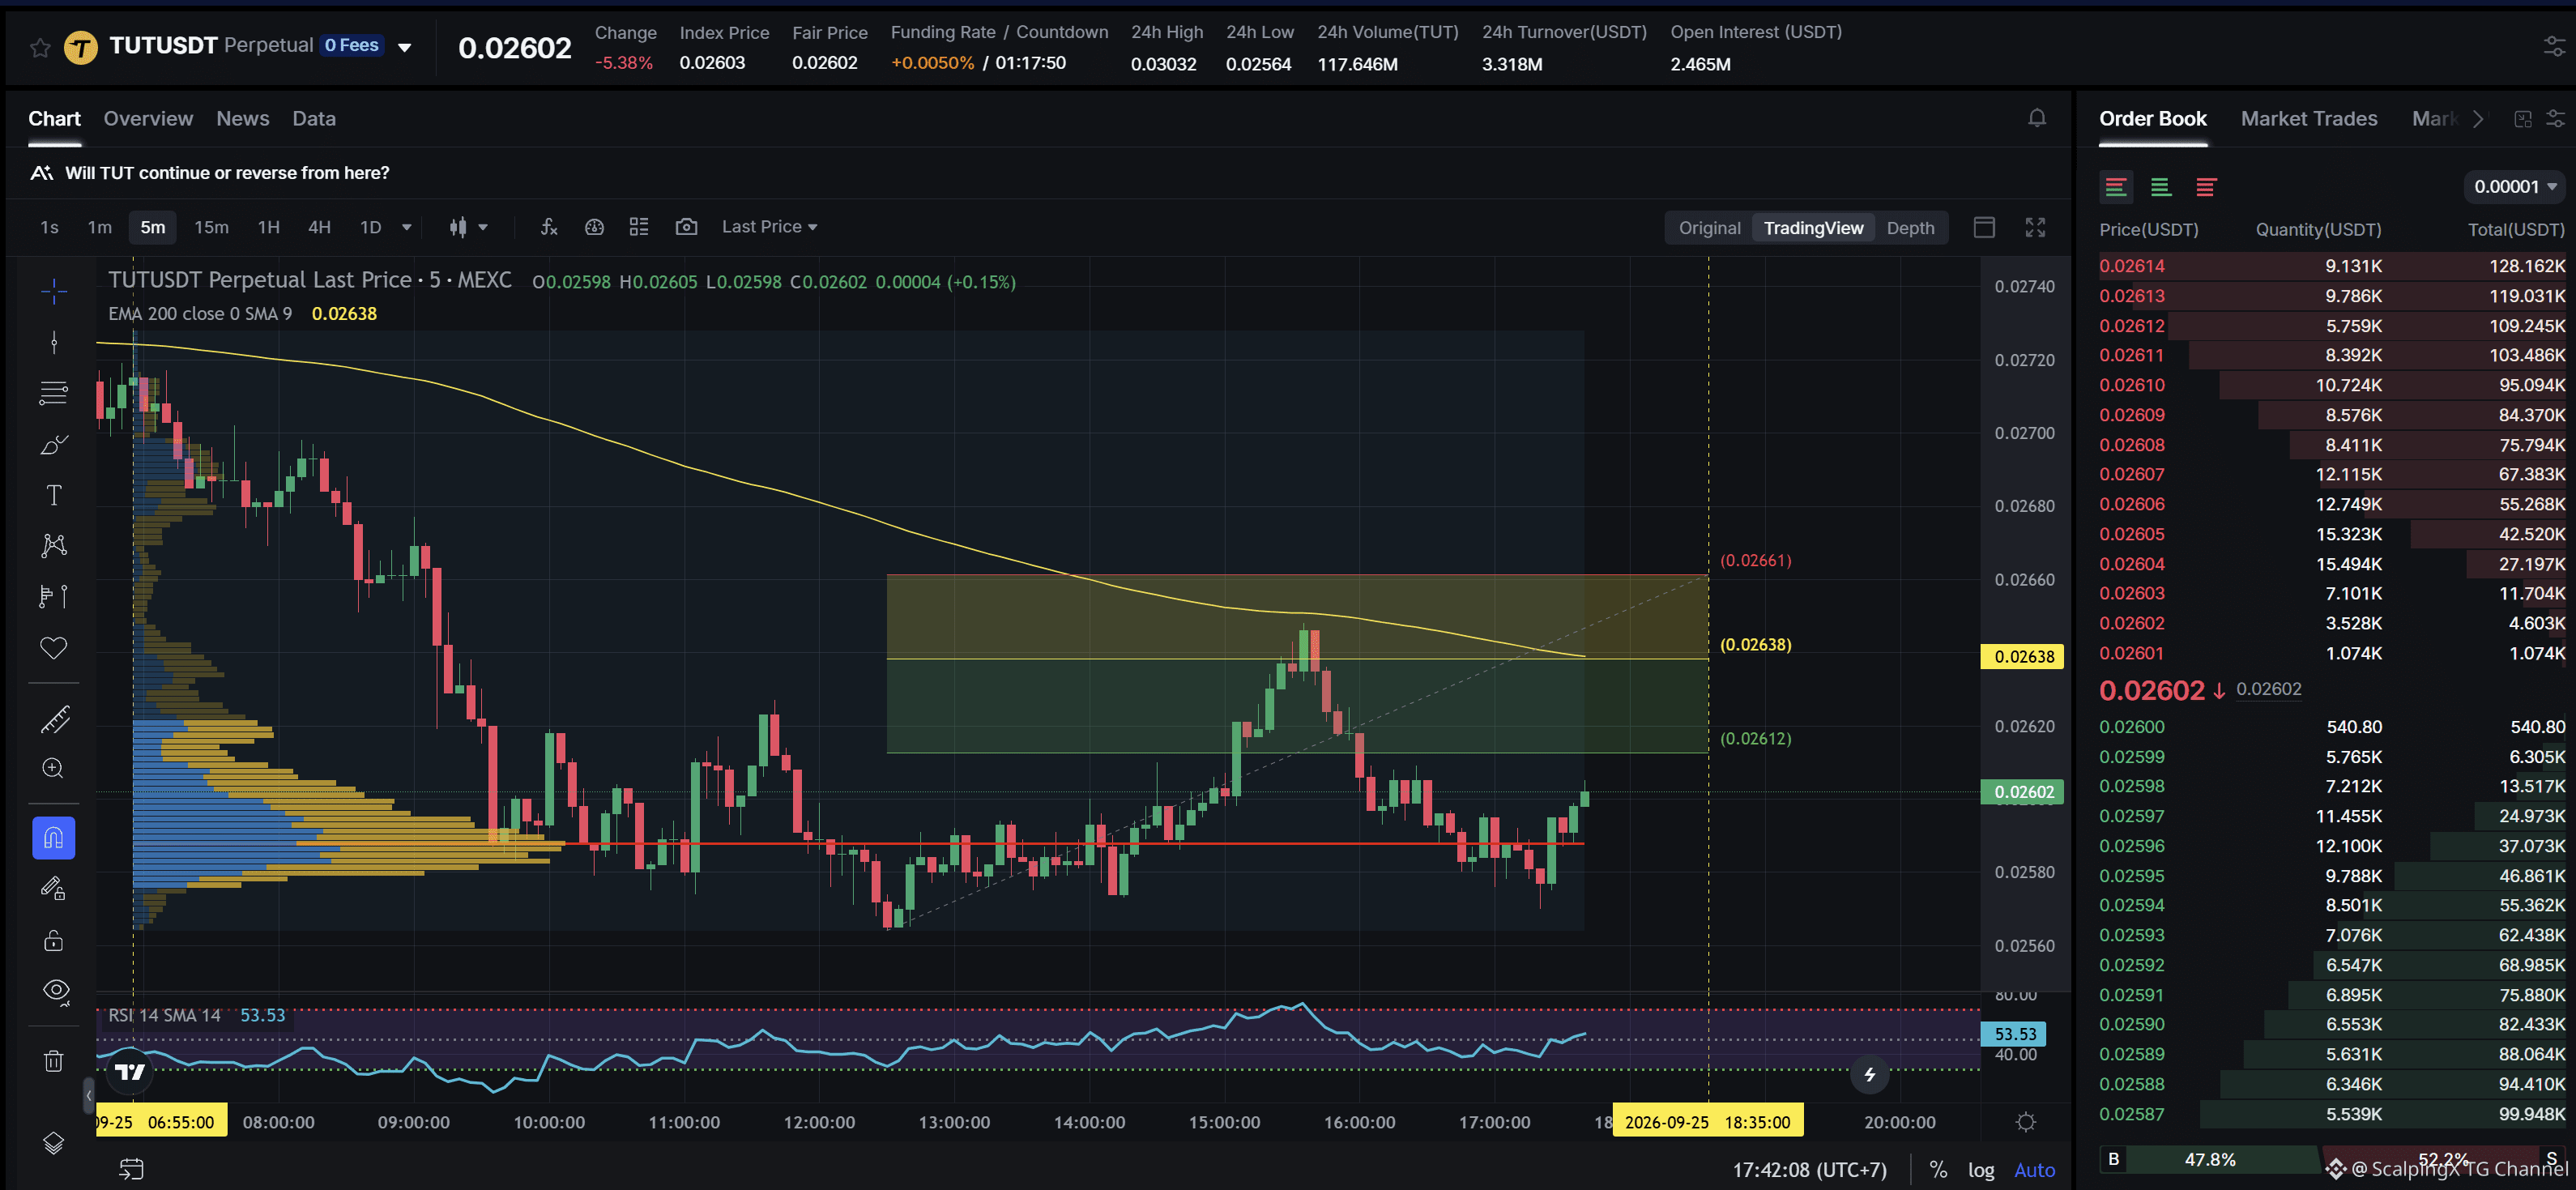
$TUT - Mcap 21.52M$ - 24ч Sentiment +4.01 Бычий SC02 M5 - ожидается Лимитный ордер. Вход находится внутри LVN и не затронут никакой слабой зоной; текущая зона сопротивления имеет ширину примерно 0.88%. Нисходящий тренд продолжается 10 часов 50 минут, при этом зафиксированное максимальное падение цены составило 5.93%. Если цена пробьет эту зону сопротивления вверх, с высокой вероятностью тренд развернется вверх.
$TUT - Mcap 21.52M$ - 24ч Sentiment +4.01 Бычий SC02 M5 - ожидается Лимитный ордер. Вход находится внутри LVN и не затронут никакой слабой зоной; текущая зона сопротивления имеет ширину примерно 0.88%. Нисходящий тренд продолжается 10 часов 50 минут, при этом зафиксированное максимальное падение цены составило 5.93%. Если цена пробьет эту зону сопротивления вверх, с высокой вероятностью тренд развернется вверх.
Войдите, чтобы посмотреть больше материала
Присоединяйтесь к пользователям криптовалют по всему миру на Binance Square
⚡️ Получайте новейшую и полезную информацию о криптоактивах.
💬 Нам доверяет крупнейшая в мире криптобиржа.
👍 Получите достоверные аналитические данные от верифицированных создателей контента.
Эл. почта/номер телефона