
asiftahsin
2.3k Публикации

asiftahsin
Отправить жалобу
Заблокировать пользователя
Share Crypto Related Market Analysis, Share Crypto Related knowledge for my follower(brother and Sister)
32 подписок(и/а)
335 подписчиков(а)
1.3K+ понравилось
Посты
Все
Цитирования
·
--
Статья
См. перевод
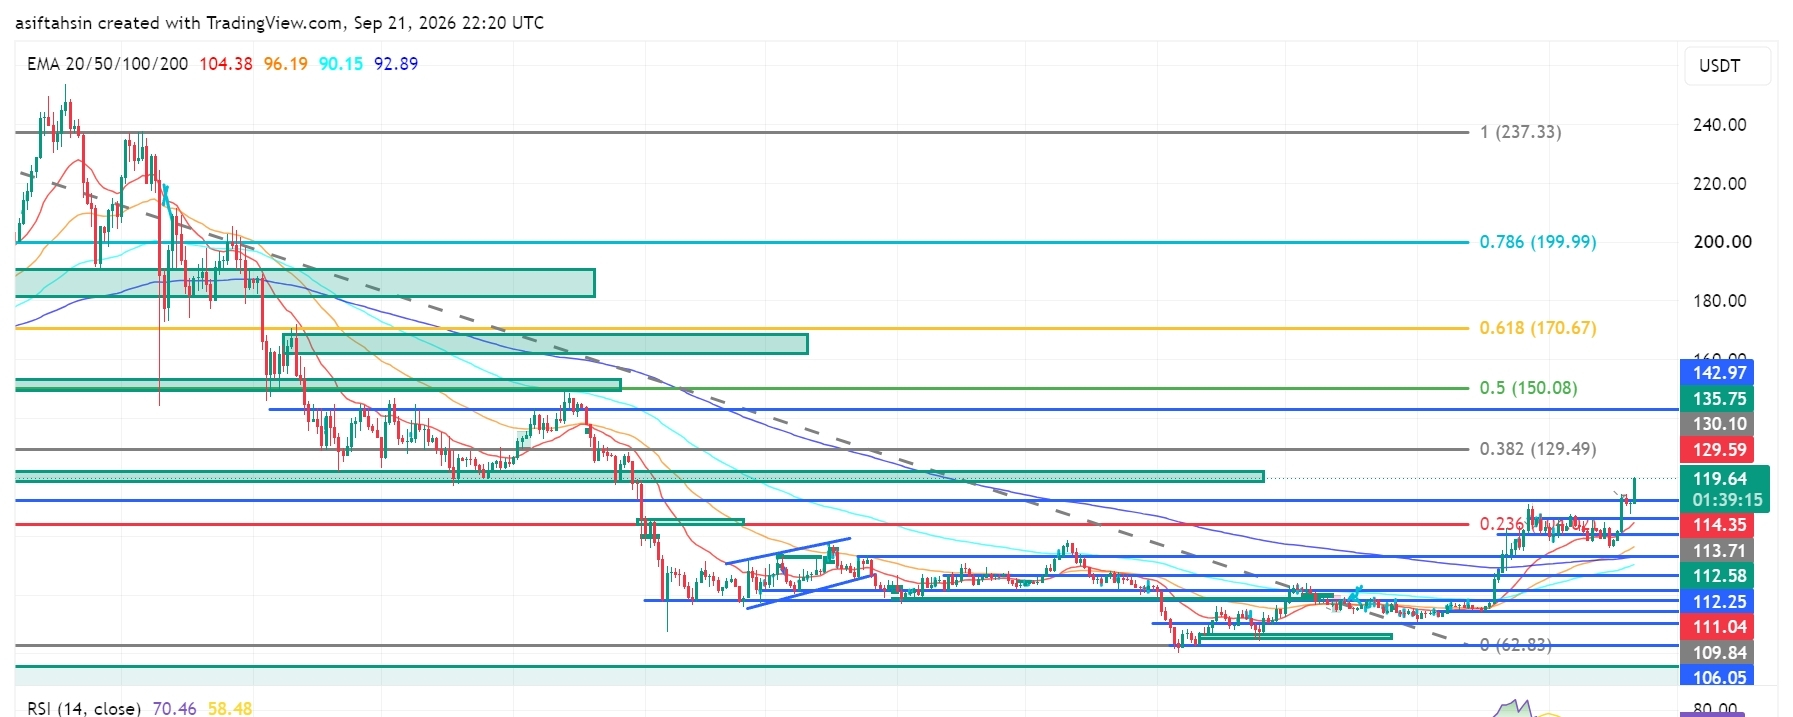
SOL Technical Outlook: Solana Pushes Toward $120 as Breakout Structure StrengthensSOL is currently trading around $119.61, holding well above the $112–$114 region after a strong recovery from the $104–$110 support zone.
The broader structure has improved significantly, with SOL reclaiming the $110–$114 area and now testing the $119–$120 resistance zone. A sustained breakout above this region would bring the higher Fibonacci levels back into focus.
📈 EMA Structure
20 EMA: $104.38
50 EMA: $96.19
100 EMA: $90.15
200 EMA: $92.89
SOL is trading significantly above all four major EMAs.
The 20 EMA remains above the 50 EMA, while the 50 EMA is also above the 200 EMA. This alignment reflects a strong recovery structure and improving medium-term trend.
The $104–$106 region is now an important deeper support zone, while the $110–$114 area has developed into a key structural support region after the recent breakout.
📐 Fibonacci Levels
0.236: $114.35
0.382: $129.49
0.5: $150.08
0.618: $170.67
0.786: $199.99
1.0: $237.33
SOL has reclaimed the 0.236 Fibonacci level around $114.35 and is now trading above it.
The next major Fibonacci resistance is $129.49, followed by $150.08.
🟢 Bullish Scenario
Immediate resistance is around:
$119.61 → $120
A clean breakout and sustained close above the $119–$120 zone could open the path toward:
$129.49 → $135.75 → $142.97 → $150.08
The $129.49 level is the next major Fibonacci resistance. A successful breakout and retest above $129.49 would strengthen the continuation structure and put the $150.08 level into focus.
Above $150.08, the higher Fibonacci references are:
$170.67 → $199.99 → $237.33
🔴 Pullback Scenario
Key support levels:
$114.35
$113.71
$112.58
$112.25
$111.04
$109.84
$106.05
$104.38
$96.19
$92.89
$90.15
The $111–$114 zone is particularly important.
A pullback into this area followed by a successful hold would keep the breakout structure constructive. Losing $109.84–$106.05 would indicate deeper consolidation, while a sustained move below the $104.38 20 EMA would significantly weaken the current recovery structure.
🧠 Market Structure & Liquidity
Liquidity Sweep → Accumulation → Higher Lows → Breakout → Expansion → Retest → Consolidation → Continuation
SOL has moved through several important structural phases, recovering from the June low around $62.83, building higher lows, reclaiming the $100 area, and then breaking above the previous $110–$114 resistance region.
The current move toward $120 represents another expansion phase, with $119–$120 acting as the immediate decision zone.
📊 RSI Momentum
RSI: 70.46
RSI MA: 58.48
RSI has moved above 70, showing strong bullish momentum but also entering an overbought region.
This does not automatically mean a reversal. However, after the recent expansion, SOL could experience short-term consolidation or a pullback before attempting another leg higher.
The key will be whether RSI can remain elevated while price holds the $114–$119 structure.
🎯 Key Levels
Resistance:
$119.61 → $120 → $129.49 → $135.75 → $142.97 → $150.08 → $170.67 → $199.99
Support:
$114.35 → $113.71 → $112.58 → $112.25 → $111.04 → $109.84 → $106.05 → $104.38
Major EMA Support:
$104.38 / $96.19 / $92.89 / $90.15
📌 Final Outlook
SOL has strengthened considerably after reclaiming the $110–$114 region and pushing toward $120.
The key battle now is $119–$120.
A sustained breakout above this zone could open the path toward $129.49, followed by $135.75–$142.97 and the major $150.08 Fibonacci level.
On the downside, $111–$114 is the first major retest zone. Holding this area would keep the breakout structure intact, while a deeper move below $106.05–$104.38 would weaken the current setup.
Bias: Recovery structure remains strong above $104.38. A sustained breakout above $119–$120 could open the path toward $129.49, with $150.08 as the next major Fibonacci objective.
$SOL
{future}(SOLUSDT)
SOL Technical Outlook: Solana Pushes Toward $120 as Breakout Structure Strengthens
SOL is currently trading around $119.61, holding well above the $112–$114 region after a strong recovery from the $104–$110 support zone.
The broader structure has improved significantly, with SOL reclaiming the $110–$114 area and now testing the $119–$120 resistance zone. A sustained breakout above this region would bring the higher Fibonacci levels back into focus.
📈 EMA Structure
20 EMA: $104.38
50 EMA: $96.19
100 EMA: $90.15
200 EMA: $92.89
SOL is trading significantly above all four major EMAs.
The 20 EMA remains above the 50 EMA, while the 50 EMA is also above the 200 EMA. This alignment reflects a strong recovery structure and improving medium-term trend.
The $104–$106 region is now an important deeper support zone, while the $110–$114 area has developed into a key structural support region after the recent breakout.
📐 Fibonacci Levels
0.236: $114.35
0.382: $129.49
0.5: $150.08
0.618: $170.67
0.786: $199.99
1.0: $237.33
SOL has reclaimed the 0.236 Fibonacci level around $114.35 and is now trading above it.
The next major Fibonacci resistance is $129.49, followed by $150.08.
🟢 Bullish Scenario
Immediate resistance is around:
$119.61 → $120
A clean breakout and sustained close above the $119–$120 zone could open the path toward:
$129.49 → $135.75 → $142.97 → $150.08
The $129.49 level is the next major Fibonacci resistance. A successful breakout and retest above $129.49 would strengthen the continuation structure and put the $150.08 level into focus.
Above $150.08, the higher Fibonacci references are:
$170.67 → $199.99 → $237.33
🔴 Pullback Scenario
Key support levels:
$114.35
$113.71
$112.58
$112.25
$111.04
$109.84
$106.05
$104.38
$96.19
$92.89
$90.15
The $111–$114 zone is particularly important.
A pullback into this area followed by a successful hold would keep the breakout structure constructive. Losing $109.84–$106.05 would indicate deeper consolidation, while a sustained move below the $104.38 20 EMA would significantly weaken the current recovery structure.
🧠 Market Structure & Liquidity
Liquidity Sweep → Accumulation → Higher Lows → Breakout → Expansion → Retest → Consolidation → Continuation
SOL has moved through several important structural phases, recovering from the June low around $62.83, building higher lows, reclaiming the $100 area, and then breaking above the previous $110–$114 resistance region.
The current move toward $120 represents another expansion phase, with $119–$120 acting as the immediate decision zone.
📊 RSI Momentum
RSI: 70.46
RSI MA: 58.48
RSI has moved above 70, showing strong bullish momentum but also entering an overbought region.
This does not automatically mean a reversal. However, after the recent expansion, SOL could experience short-term consolidation or a pullback before attempting another leg higher.
The key will be whether RSI can remain elevated while price holds the $114–$119 structure.
🎯 Key Levels
Resistance:
$119.61 → $120 → $129.49 → $135.75 → $142.97 → $150.08 → $170.67 → $199.99
Support:
$114.35 → $113.71 → $112.58 → $112.25 → $111.04 → $109.84 → $106.05 → $104.38
Major EMA Support:
$104.38 / $96.19 / $92.89 / $90.15
📌 Final Outlook
SOL has strengthened considerably after reclaiming the $110–$114 region and pushing toward $120.
The key battle now is $119–$120.
A sustained breakout above this zone could open the path toward $129.49, followed by $135.75–$142.97 and the major $150.08 Fibonacci level.
On the downside, $111–$114 is the first major retest zone. Holding this area would keep the breakout structure intact, while a deeper move below $106.05–$104.38 would weaken the current setup.
Bias: Recovery structure remains strong above $104.38. A sustained breakout above $119–$120 could open the path toward $129.49, with $150.08 as the next major Fibonacci objective.
$SOL
The broader structure has improved significantly, with SOL reclaiming the $110–$114 area and now testing the $119–$120 resistance zone. A sustained breakout above this region would bring the higher Fibonacci levels back into focus.
📈 EMA Structure
20 EMA: $104.38
50 EMA: $96.19
100 EMA: $90.15
200 EMA: $92.89
SOL is trading significantly above all four major EMAs.
The 20 EMA remains above the 50 EMA, while the 50 EMA is also above the 200 EMA. This alignment reflects a strong recovery structure and improving medium-term trend.
The $104–$106 region is now an important deeper support zone, while the $110–$114 area has developed into a key structural support region after the recent breakout.
📐 Fibonacci Levels
0.236: $114.35
0.382: $129.49
0.5: $150.08
0.618: $170.67
0.786: $199.99
1.0: $237.33
SOL has reclaimed the 0.236 Fibonacci level around $114.35 and is now trading above it.
The next major Fibonacci resistance is $129.49, followed by $150.08.
🟢 Bullish Scenario
Immediate resistance is around:
$119.61 → $120
A clean breakout and sustained close above the $119–$120 zone could open the path toward:
$129.49 → $135.75 → $142.97 → $150.08
The $129.49 level is the next major Fibonacci resistance. A successful breakout and retest above $129.49 would strengthen the continuation structure and put the $150.08 level into focus.
Above $150.08, the higher Fibonacci references are:
$170.67 → $199.99 → $237.33
🔴 Pullback Scenario
Key support levels:
$114.35
$113.71
$112.58
$112.25
$111.04
$109.84
$106.05
$104.38
$96.19
$92.89
$90.15
The $111–$114 zone is particularly important.
A pullback into this area followed by a successful hold would keep the breakout structure constructive. Losing $109.84–$106.05 would indicate deeper consolidation, while a sustained move below the $104.38 20 EMA would significantly weaken the current recovery structure.
🧠 Market Structure & Liquidity
Liquidity Sweep → Accumulation → Higher Lows → Breakout → Expansion → Retest → Consolidation → Continuation
SOL has moved through several important structural phases, recovering from the June low around $62.83, building higher lows, reclaiming the $100 area, and then breaking above the previous $110–$114 resistance region.
The current move toward $120 represents another expansion phase, with $119–$120 acting as the immediate decision zone.
📊 RSI Momentum
RSI: 70.46
RSI MA: 58.48
RSI has moved above 70, showing strong bullish momentum but also entering an overbought region.
This does not automatically mean a reversal. However, after the recent expansion, SOL could experience short-term consolidation or a pullback before attempting another leg higher.
The key will be whether RSI can remain elevated while price holds the $114–$119 structure.
🎯 Key Levels
Resistance:
$119.61 → $120 → $129.49 → $135.75 → $142.97 → $150.08 → $170.67 → $199.99
Support:
$114.35 → $113.71 → $112.58 → $112.25 → $111.04 → $109.84 → $106.05 → $104.38
Major EMA Support:
$104.38 / $96.19 / $92.89 / $90.15
📌 Final Outlook
SOL has strengthened considerably after reclaiming the $110–$114 region and pushing toward $120.
The key battle now is $119–$120.
A sustained breakout above this zone could open the path toward $129.49, followed by $135.75–$142.97 and the major $150.08 Fibonacci level.
On the downside, $111–$114 is the first major retest zone. Holding this area would keep the breakout structure intact, while a deeper move below $106.05–$104.38 would weaken the current setup.
Bias: Recovery structure remains strong above $104.38. A sustained breakout above $119–$120 could open the path toward $129.49, with $150.08 as the next major Fibonacci objective.
$SOL
35
·
--
Статья
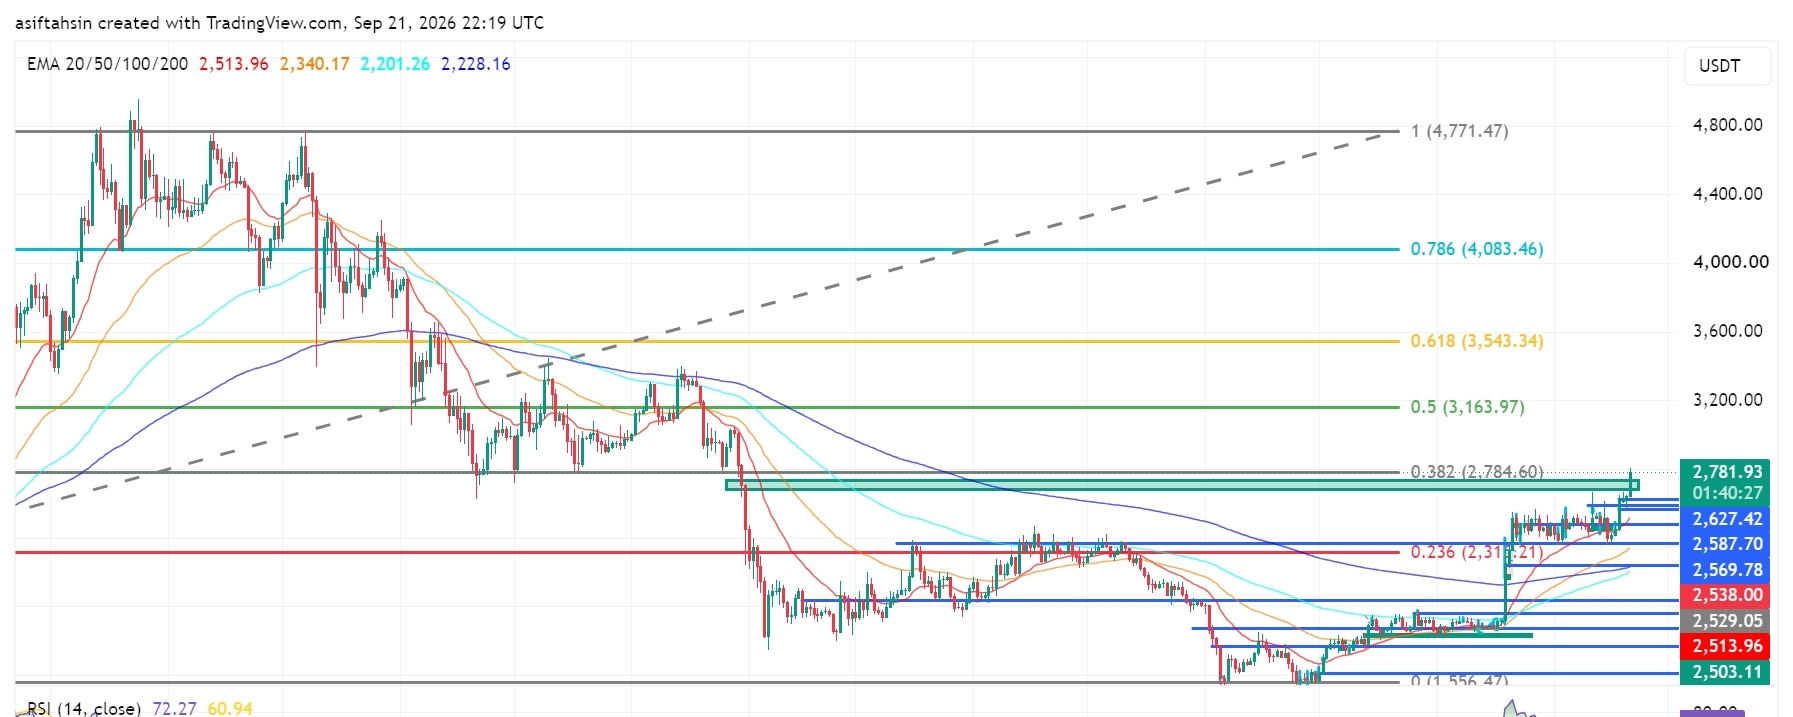
Технический прогноз по ETH: Ethereum возвращает $2,78K, а структура пробоя усиливаетсяСейчас ETH торгуется около $2,781.93, вплотную подходя к ключевому уровню Фибоначчи $2,784.60 после сильного восстановления из зоны $2,475–$2,500.
В более широкей структуре произошли заметные улучшения: ETH вернул диапазон $2,500–$2,600 и пробил прежний диапазон консолидации. Устойчивый пробой выше $2,784.60 выведет на первый план более высокие уровни Фибоначчи.
📈 Структура EMA
20 EMA: $2,513.96
50 EMA: $2,340.17
100 EMA: $2,201.26
200 EMA: $2,228.16
ETH торгуется значительно выше всех четырех ключевых EMA.
Технический прогноз по ETH: Ethereum возвращает $2,78K, а структура пробоя усиливается
Сейчас ETH торгуется около $2,781.93, вплотную подходя к ключевому уровню Фибоначчи $2,784.60 после сильного восстановления из зоны $2,475–$2,500.
В более широкей структуре произошли заметные улучшения: ETH вернул диапазон $2,500–$2,600 и пробил прежний диапазон консолидации. Устойчивый пробой выше $2,784.60 выведет на первый план более высокие уровни Фибоначчи.
📈 Структура EMA
20 EMA: $2,513.96
50 EMA: $2,340.17
100 EMA: $2,201.26
200 EMA: $2,228.16
ETH торгуется значительно выше всех четырех ключевых EMA.
В более широкей структуре произошли заметные улучшения: ETH вернул диапазон $2,500–$2,600 и пробил прежний диапазон консолидации. Устойчивый пробой выше $2,784.60 выведет на первый план более высокие уровни Фибоначчи.
📈 Структура EMA
20 EMA: $2,513.96
50 EMA: $2,340.17
100 EMA: $2,201.26
200 EMA: $2,228.16
ETH торгуется значительно выше всех четырех ключевых EMA.
58
·
--
Статья
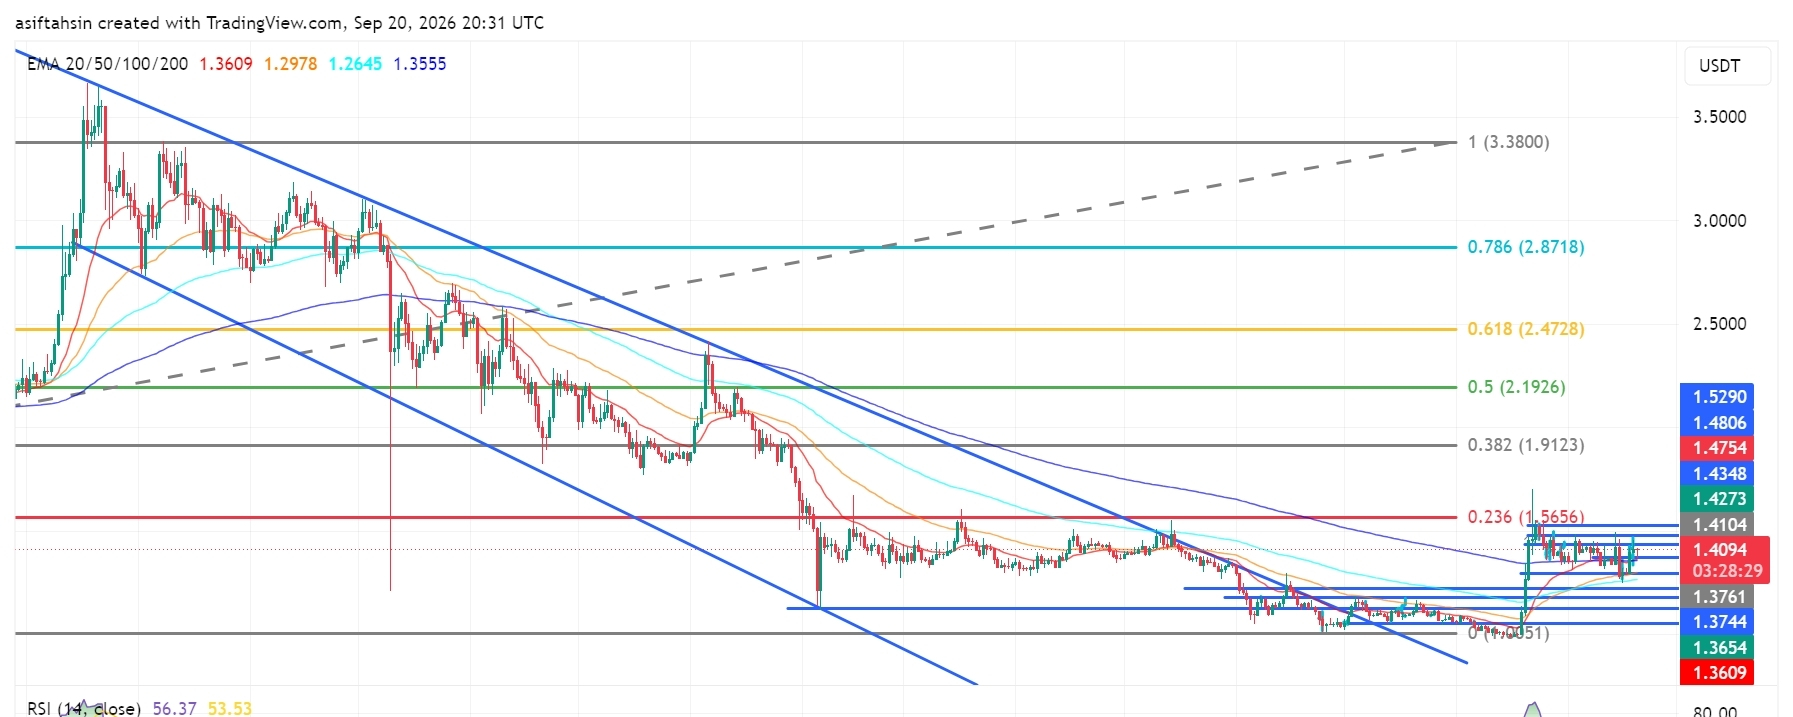
Технический прогноз по XRP: XRP удерживается выше $1,40, поскольку структура восстановления укрепляетсяТехнический прогноз по XRP: XRP удерживается выше $1,40, поскольку структура восстановления укрепляется
Сейчас XRP торгуется около $1,41, удерживаясь выше области $1,37–$1,40 после недавнего восстановления от зоны поддержки $1,25–$1,30.
В более широкой структуре стало лучше: цена вернула себе область $1,40 и снова движется к ключевой зоне сопротивления $1,41–$1,48. Устойчивое движение через эту область вернёт в фокус более высокие уровни Фибоначчи.
Недавние рыночные комментарии также отметили область $1,40 как важный уровень сопротивления/возврата, однако краткосрочный импульс по-прежнему чувствителен вблизи этой зоны.
Технический прогноз по XRP: XRP удерживается выше $1,40, поскольку структура восстановления укрепляется
Технический прогноз по XRP: XRP удерживается выше $1,40, поскольку структура восстановления укрепляется
Сейчас XRP торгуется около $1,41, удерживаясь выше области $1,37–$1,40 после недавнего восстановления от зоны поддержки $1,25–$1,30.
В более широкой структуре стало лучше: цена вернула себе область $1,40 и снова движется к ключевой зоне сопротивления $1,41–$1,48. Устойчивое движение через эту область вернёт в фокус более высокие уровни Фибоначчи.
Недавние рыночные комментарии также отметили область $1,40 как важный уровень сопротивления/возврата, однако краткосрочный импульс по-прежнему чувствителен вблизи этой зоны.
Сейчас XRP торгуется около $1,41, удерживаясь выше области $1,37–$1,40 после недавнего восстановления от зоны поддержки $1,25–$1,30.
В более широкой структуре стало лучше: цена вернула себе область $1,40 и снова движется к ключевой зоне сопротивления $1,41–$1,48. Устойчивое движение через эту область вернёт в фокус более высокие уровни Фибоначчи.
Недавние рыночные комментарии также отметили область $1,40 как важный уровень сопротивления/возврата, однако краткосрочный импульс по-прежнему чувствителен вблизи этой зоны.
2
1.2k
·
--
Статья
См. перевод
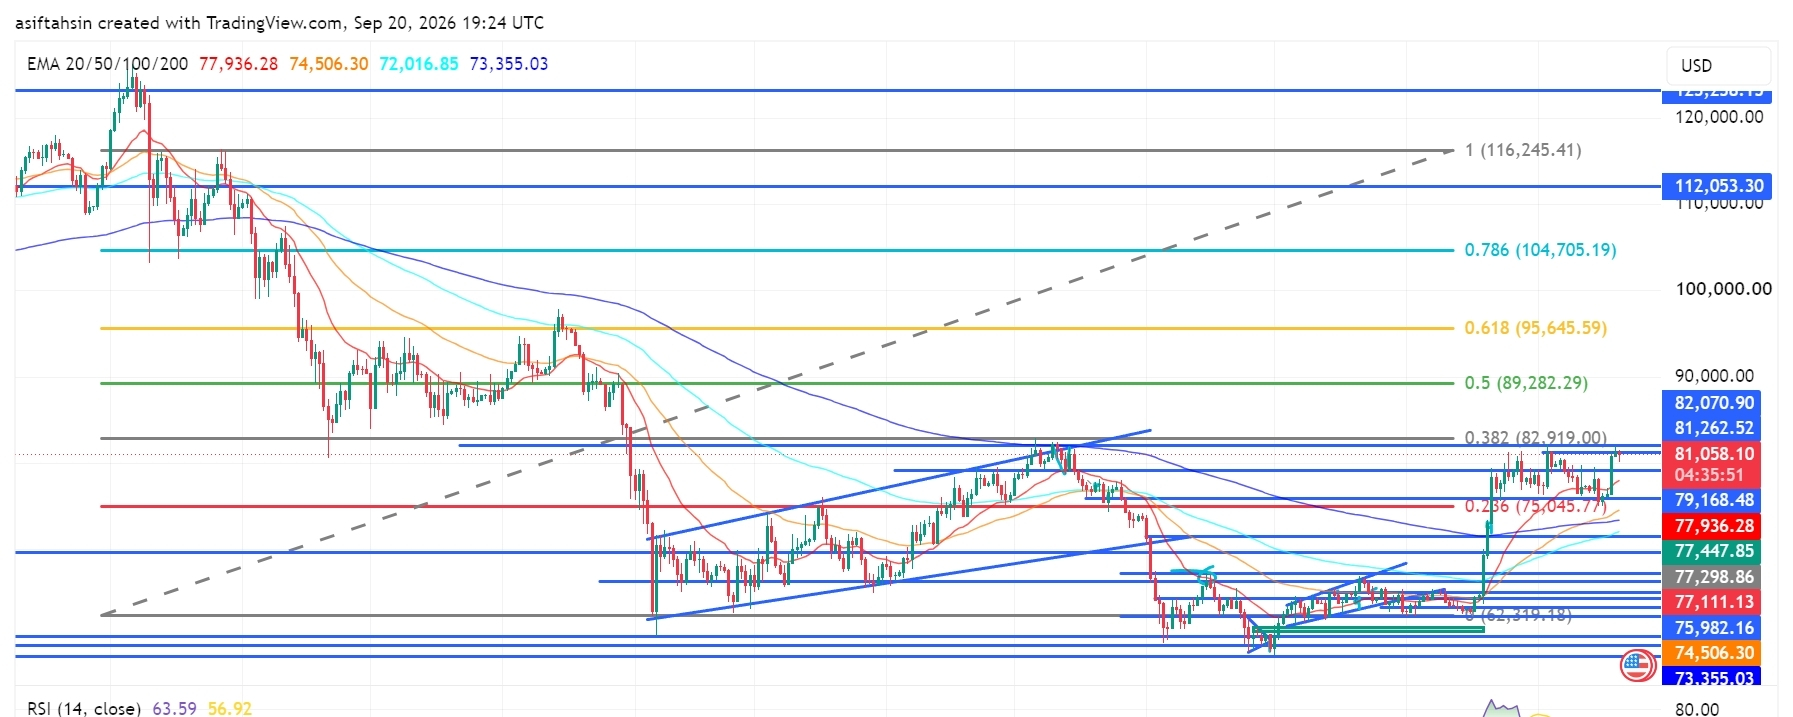
BTC Technical Outlook: Bitcoin Reclaims $81K as Recovery Structure StrengthensBTC is currently trading around $81,058, holding above the $79K–$80K region after the recent recovery from the $72K–$75K support area.
The broader structure has improved, with price reclaiming the $80K area and moving back toward the major $81.26K–$82.92K resistance zone. A sustained move through this area would put the higher Fibonacci levels back into focus.
📈 EMA Structure
20 EMA: $77,936.12
50 EMA: $74,506.24
100 EMA: $72,016.82
200 EMA: $73,355.02
BTC is currently trading well above the 20 EMA at $77,936.
The recovery above the 50 EMA at $74,506, 100 EMA at $72,016, and 200 EMA at $73,355 keeps the broader recovery structure constructive.
The 20 EMA remains above the longer-term EMA levels, showing improving short-term structure.
The $77.9K area remains an important dynamic support during any short-term pullback.
📐 Fibonacci Levels
Key Fibonacci levels:
0.236: $75,045.77
0.382: $82,919.00
0.5: $89,282.29
0.618: $95,645.59
0.786: $104,705.19
1.0: $116,245.41
BTC is currently trading above the 0.236 Fibonacci level at $75,045.77.
The next major Fibonacci reference is $82,919 — 0.382 Fib.
A sustained move above the $81K–$82.9K resistance area could bring $89,282 into focus, followed by $95,645.
🟢 Bullish Scenario
BTC has recovered strongly from the lower support structure and is now consolidating around $80K–$81K.
Immediate resistance:
$81,262.52
$82,070.90
$82,919.00 — 0.382 Fibonacci
$89,282.29 — 0.5 Fibonacci
$95,645.59 — 0.618 Fibonacci
A clean breakout and sustained close above $82K–$82.92K would provide stronger confirmation of continued recovery.
🎯 Target 1: $82,070.90
🎯 Target 2: $82,919.00 — 0.382 Fibonacci
🎯 Target 3: $89,282.29 — 0.5 Fibonacci
🎯 Target 4: $95,645.59 — 0.618 Fibonacci
🎯 Target 5: $104,705.19 — 0.786 Fibonacci
🎯 Target 6: $112,053.30
🎯 Target 7: $116,245.41 — 1.0 Fibonacci
A confirmed move through the $82.92K zone could strengthen the medium-term recovery structure and bring the $89K–$95K region into focus.
🔴 Pullback Scenario
After the recent expansion from the $75K region toward $81K, a retest of the breakout area would be normal.
Key supports:
$79,168.48
$77,936.12 — 20 EMA
$77,447.85
$77,298.86
$77,111.13
$75,982.16
$75,045.77 — 0.236 Fibonacci
$74,506.24 — 50 EMA
$73,355.02 — 200 EMA
$72,016.82 — 100 EMA
The $77K–$79K zone is particularly important.
If BTC continues to hold this area during a pullback, the current recovery structure remains active.
A sustained loss of $75,045 would weaken the current structure and bring the lower EMA support region back into focus.
🧠 Market Structure & Liquidity
BTC has formed a recovery structure after sweeping liquidity around the $72K–$75K region.
The recent move produced a strong recovery through $75K, followed by a breakout toward $80K–$81K.
BTC is now moving through an important:
Liquidity Sweep → Accumulation → Higher Lows → Breakout → Expansion → Retest → Consolidation → Continuation
structure.
The major upside liquidity and resistance are concentrated around the $81.26K–$82.92K region.
A decisive move through this area would place $89,282 as the next major Fibonacci reference.
📊 RSI Momentum
RSI (14): 63.59
RSI MA: 56.92
RSI has moved above the neutral 50 level and remains firmly in positive territory after the recent expansion.
The current reading around 63.59 shows stronger short-term momentum while remaining below the traditional 70 overbought threshold.
A sustained RSI above 60 would keep momentum supportive, while a move back below 50 would indicate increasing short-term weakness.
🎯 Key Levels
🔴 Major Resistance:
$81,262.52 → $82,070.90 → $82,919.00 → $89,282.29 → $95,645.59
🟢 Major Support:
$79,168.48 → $77,936.12 → $77,447.85 → $77,298.86 → $77,111.13 → $75,982.16 → $75,045.77
📉 Dynamic EMA Support:
$77,936.12 — 20 EMA | $74,506.24 — 50 EMA | $73,355.02 — 200 EMA | $72,016.82 — 100 EMA
🚀 Upside References:
$82,919 → $89,282 → $95,645 → $104,705 → $112,053 → $116,245
📌 Final Outlook
BTC's broader structure has strengthened after the recent recovery, with price now holding around $81K and above the major $75K–$79K support structure.
The $77K–$79K area is now an important short-term support region, while $81.26K–$82.92K remains the immediate major resistance zone.
A confirmed move above $82,919 could open the path toward $89,282, followed by $95,645 and $104,705.
However, rejection from the upper resistance area followed by a sustained loss of $75,045 would weaken the current recovery structure and bring the lower support zones back into focus.
Bias: 🟢 Recovery structure intact above $75,045. A sustained move above $82,919 could open the path toward $89,282, with $95,645 as the next major Fibonacci reference.
$BTC
{future}(BTCUSDT)
BTC Technical Outlook: Bitcoin Reclaims $81K as Recovery Structure Strengthens
BTC is currently trading around $81,058, holding above the $79K–$80K region after the recent recovery from the $72K–$75K support area.
The broader structure has improved, with price reclaiming the $80K area and moving back toward the major $81.26K–$82.92K resistance zone. A sustained move through this area would put the higher Fibonacci levels back into focus.
📈 EMA Structure
20 EMA: $77,936.12
50 EMA: $74,506.24
100 EMA: $72,016.82
200 EMA: $73,355.02
BTC is currently trading well above the 20 EMA at $77,936.
The recovery above the 50 EMA at $74,506, 100 EMA at $72,016, and 200 EMA at $73,355 keeps the broader recovery structure constructive.
The 20 EMA remains above the longer-term EMA levels, showing improving short-term structure.
The $77.9K area remains an important dynamic support during any short-term pullback.
📐 Fibonacci Levels
Key Fibonacci levels:
0.236: $75,045.77
0.382: $82,919.00
0.5: $89,282.29
0.618: $95,645.59
0.786: $104,705.19
1.0: $116,245.41
BTC is currently trading above the 0.236 Fibonacci level at $75,045.77.
The next major Fibonacci reference is $82,919 — 0.382 Fib.
A sustained move above the $81K–$82.9K resistance area could bring $89,282 into focus, followed by $95,645.
🟢 Bullish Scenario
BTC has recovered strongly from the lower support structure and is now consolidating around $80K–$81K.
Immediate resistance:
$81,262.52
$82,070.90
$82,919.00 — 0.382 Fibonacci
$89,282.29 — 0.5 Fibonacci
$95,645.59 — 0.618 Fibonacci
A clean breakout and sustained close above $82K–$82.92K would provide stronger confirmation of continued recovery.
🎯 Target 1: $82,070.90
🎯 Target 2: $82,919.00 — 0.382 Fibonacci
🎯 Target 3: $89,282.29 — 0.5 Fibonacci
🎯 Target 4: $95,645.59 — 0.618 Fibonacci
🎯 Target 5: $104,705.19 — 0.786 Fibonacci
🎯 Target 6: $112,053.30
🎯 Target 7: $116,245.41 — 1.0 Fibonacci
A confirmed move through the $82.92K zone could strengthen the medium-term recovery structure and bring the $89K–$95K region into focus.
🔴 Pullback Scenario
After the recent expansion from the $75K region toward $81K, a retest of the breakout area would be normal.
Key supports:
$79,168.48
$77,936.12 — 20 EMA
$77,447.85
$77,298.86
$77,111.13
$75,982.16
$75,045.77 — 0.236 Fibonacci
$74,506.24 — 50 EMA
$73,355.02 — 200 EMA
$72,016.82 — 100 EMA
The $77K–$79K zone is particularly important.
If BTC continues to hold this area during a pullback, the current recovery structure remains active.
A sustained loss of $75,045 would weaken the current structure and bring the lower EMA support region back into focus.
🧠 Market Structure & Liquidity
BTC has formed a recovery structure after sweeping liquidity around the $72K–$75K region.
The recent move produced a strong recovery through $75K, followed by a breakout toward $80K–$81K.
BTC is now moving through an important:
Liquidity Sweep → Accumulation → Higher Lows → Breakout → Expansion → Retest → Consolidation → Continuation
structure.
The major upside liquidity and resistance are concentrated around the $81.26K–$82.92K region.
A decisive move through this area would place $89,282 as the next major Fibonacci reference.
📊 RSI Momentum
RSI (14): 63.59
RSI MA: 56.92
RSI has moved above the neutral 50 level and remains firmly in positive territory after the recent expansion.
The current reading around 63.59 shows stronger short-term momentum while remaining below the traditional 70 overbought threshold.
A sustained RSI above 60 would keep momentum supportive, while a move back below 50 would indicate increasing short-term weakness.
🎯 Key Levels
🔴 Major Resistance:
$81,262.52 → $82,070.90 → $82,919.00 → $89,282.29 → $95,645.59
🟢 Major Support:
$79,168.48 → $77,936.12 → $77,447.85 → $77,298.86 → $77,111.13 → $75,982.16 → $75,045.77
📉 Dynamic EMA Support:
$77,936.12 — 20 EMA | $74,506.24 — 50 EMA | $73,355.02 — 200 EMA | $72,016.82 — 100 EMA
🚀 Upside References:
$82,919 → $89,282 → $95,645 → $104,705 → $112,053 → $116,245
📌 Final Outlook
BTC's broader structure has strengthened after the recent recovery, with price now holding around $81K and above the major $75K–$79K support structure.
The $77K–$79K area is now an important short-term support region, while $81.26K–$82.92K remains the immediate major resistance zone.
A confirmed move above $82,919 could open the path toward $89,282, followed by $95,645 and $104,705.
However, rejection from the upper resistance area followed by a sustained loss of $75,045 would weaken the current recovery structure and bring the lower support zones back into focus.
Bias: 🟢 Recovery structure intact above $75,045. A sustained move above $82,919 could open the path toward $89,282, with $95,645 as the next major Fibonacci reference.
$BTC
The broader structure has improved, with price reclaiming the $80K area and moving back toward the major $81.26K–$82.92K resistance zone. A sustained move through this area would put the higher Fibonacci levels back into focus.
📈 EMA Structure
20 EMA: $77,936.12
50 EMA: $74,506.24
100 EMA: $72,016.82
200 EMA: $73,355.02
BTC is currently trading well above the 20 EMA at $77,936.
The recovery above the 50 EMA at $74,506, 100 EMA at $72,016, and 200 EMA at $73,355 keeps the broader recovery structure constructive.
The 20 EMA remains above the longer-term EMA levels, showing improving short-term structure.
The $77.9K area remains an important dynamic support during any short-term pullback.
📐 Fibonacci Levels
Key Fibonacci levels:
0.236: $75,045.77
0.382: $82,919.00
0.5: $89,282.29
0.618: $95,645.59
0.786: $104,705.19
1.0: $116,245.41
BTC is currently trading above the 0.236 Fibonacci level at $75,045.77.
The next major Fibonacci reference is $82,919 — 0.382 Fib.
A sustained move above the $81K–$82.9K resistance area could bring $89,282 into focus, followed by $95,645.
🟢 Bullish Scenario
BTC has recovered strongly from the lower support structure and is now consolidating around $80K–$81K.
Immediate resistance:
$81,262.52
$82,070.90
$82,919.00 — 0.382 Fibonacci
$89,282.29 — 0.5 Fibonacci
$95,645.59 — 0.618 Fibonacci
A clean breakout and sustained close above $82K–$82.92K would provide stronger confirmation of continued recovery.
🎯 Target 1: $82,070.90
🎯 Target 2: $82,919.00 — 0.382 Fibonacci
🎯 Target 3: $89,282.29 — 0.5 Fibonacci
🎯 Target 4: $95,645.59 — 0.618 Fibonacci
🎯 Target 5: $104,705.19 — 0.786 Fibonacci
🎯 Target 6: $112,053.30
🎯 Target 7: $116,245.41 — 1.0 Fibonacci
A confirmed move through the $82.92K zone could strengthen the medium-term recovery structure and bring the $89K–$95K region into focus.
🔴 Pullback Scenario
After the recent expansion from the $75K region toward $81K, a retest of the breakout area would be normal.
Key supports:
$79,168.48
$77,936.12 — 20 EMA
$77,447.85
$77,298.86
$77,111.13
$75,982.16
$75,045.77 — 0.236 Fibonacci
$74,506.24 — 50 EMA
$73,355.02 — 200 EMA
$72,016.82 — 100 EMA
The $77K–$79K zone is particularly important.
If BTC continues to hold this area during a pullback, the current recovery structure remains active.
A sustained loss of $75,045 would weaken the current structure and bring the lower EMA support region back into focus.
🧠 Market Structure & Liquidity
BTC has formed a recovery structure after sweeping liquidity around the $72K–$75K region.
The recent move produced a strong recovery through $75K, followed by a breakout toward $80K–$81K.
BTC is now moving through an important:
Liquidity Sweep → Accumulation → Higher Lows → Breakout → Expansion → Retest → Consolidation → Continuation
structure.
The major upside liquidity and resistance are concentrated around the $81.26K–$82.92K region.
A decisive move through this area would place $89,282 as the next major Fibonacci reference.
📊 RSI Momentum
RSI (14): 63.59
RSI MA: 56.92
RSI has moved above the neutral 50 level and remains firmly in positive territory after the recent expansion.
The current reading around 63.59 shows stronger short-term momentum while remaining below the traditional 70 overbought threshold.
A sustained RSI above 60 would keep momentum supportive, while a move back below 50 would indicate increasing short-term weakness.
🎯 Key Levels
🔴 Major Resistance:
$81,262.52 → $82,070.90 → $82,919.00 → $89,282.29 → $95,645.59
🟢 Major Support:
$79,168.48 → $77,936.12 → $77,447.85 → $77,298.86 → $77,111.13 → $75,982.16 → $75,045.77
📉 Dynamic EMA Support:
$77,936.12 — 20 EMA | $74,506.24 — 50 EMA | $73,355.02 — 200 EMA | $72,016.82 — 100 EMA
🚀 Upside References:
$82,919 → $89,282 → $95,645 → $104,705 → $112,053 → $116,245
📌 Final Outlook
BTC's broader structure has strengthened after the recent recovery, with price now holding around $81K and above the major $75K–$79K support structure.
The $77K–$79K area is now an important short-term support region, while $81.26K–$82.92K remains the immediate major resistance zone.
A confirmed move above $82,919 could open the path toward $89,282, followed by $95,645 and $104,705.
However, rejection from the upper resistance area followed by a sustained loss of $75,045 would weaken the current recovery structure and bring the lower support zones back into focus.
Bias: 🟢 Recovery structure intact above $75,045. A sustained move above $82,919 could open the path toward $89,282, with $95,645 as the next major Fibonacci reference.
$BTC
43
·
--
Статья
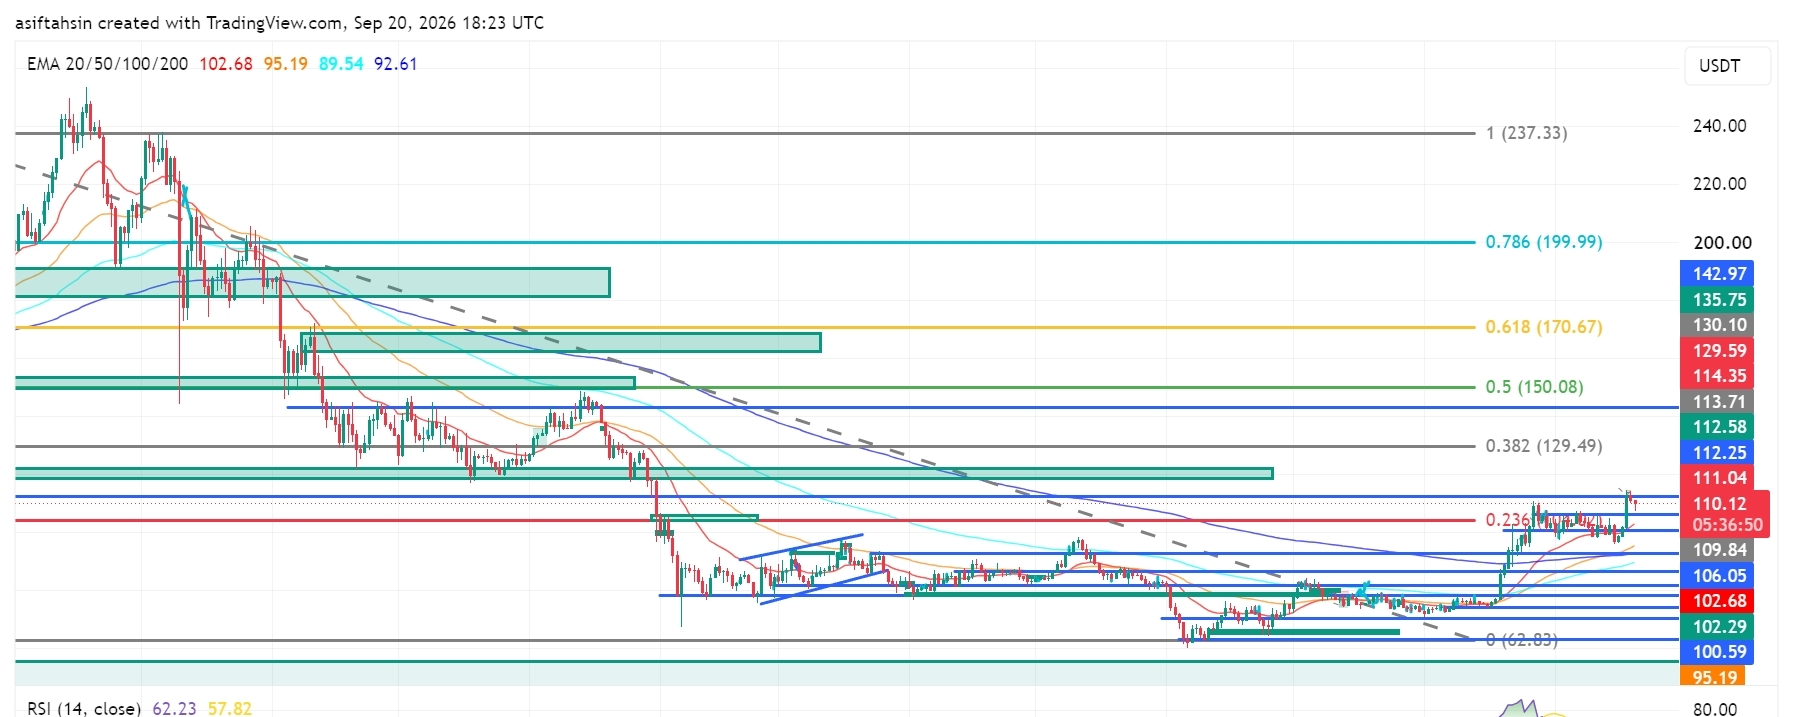
Технический прогноз по SOL: Solana возвращает $110, поскольку структура восстановления усиливаетсяСейчас SOL торгуется около $110.1, удерживаясь выше диапазона $106–$109 после недавнего восстановления от зоны поддержки $92–$100.
Более широкая структура улучшилась: цена вернула уровень $100 и движется обратно к ключевой зоне сопротивления $111–$114. Устойчивое движение через эту область снова поставит в фокус более высокие уровни Фибоначчи.
📈 Структура EMA
20 EMA: $102.68
50 EMA: $95.19
100 EMA: $89.54
200 EMA: $92.61
Сейчас SOL торгуется значительно выше 20 EMA на $102.68.
Восстановление выше 50 EMA на $95.19, 100 EMA на $89.54 и 200 EMA на $92.61 сохраняет конструктивным более широкую структуру восстановления.
Технический прогноз по SOL: Solana возвращает $110, поскольку структура восстановления усиливается
Сейчас SOL торгуется около $110.1, удерживаясь выше диапазона $106–$109 после недавнего восстановления от зоны поддержки $92–$100.
Более широкая структура улучшилась: цена вернула уровень $100 и движется обратно к ключевой зоне сопротивления $111–$114. Устойчивое движение через эту область снова поставит в фокус более высокие уровни Фибоначчи.
📈 Структура EMA
20 EMA: $102.68
50 EMA: $95.19
100 EMA: $89.54
200 EMA: $92.61
Сейчас SOL торгуется значительно выше 20 EMA на $102.68.
Восстановление выше 50 EMA на $95.19, 100 EMA на $89.54 и 200 EMA на $92.61 сохраняет конструктивным более широкую структуру восстановления.
Более широкая структура улучшилась: цена вернула уровень $100 и движется обратно к ключевой зоне сопротивления $111–$114. Устойчивое движение через эту область снова поставит в фокус более высокие уровни Фибоначчи.
📈 Структура EMA
20 EMA: $102.68
50 EMA: $95.19
100 EMA: $89.54
200 EMA: $92.61
Сейчас SOL торгуется значительно выше 20 EMA на $102.68.
Восстановление выше 50 EMA на $95.19, 100 EMA на $89.54 и 200 EMA на $92.61 сохраняет конструктивным более широкую структуру восстановления.
1.1k
·
--
Статья
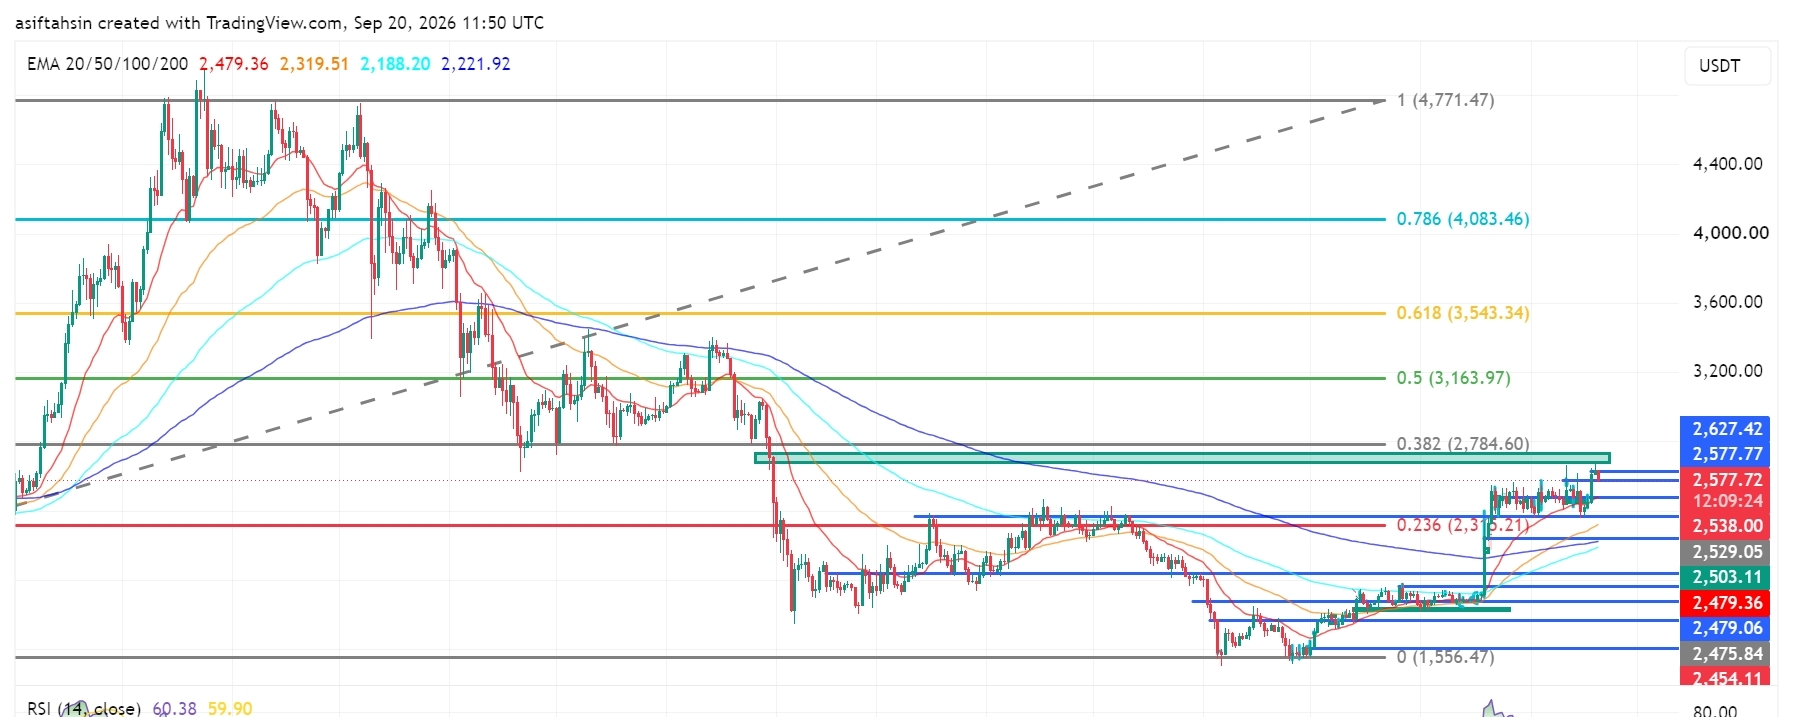
Технический обзор ETH: Ethereum удерживается около $2,58K по мере продолжения восстановленияСейчас ETH торгуется около $2,577, удерживаясь выше зоны поддержки $2,500–$2,540 после недавнего восстановления от зоны спроса $2,280–$2,360.
Более широкая восстановительная структура остаётся конструктивной: сейчас цена приближается к важной зоне сопротивления $2,627–$2,785. Уровень $2,784.60 — ключевая отметка 0.382 Фибоначчи на графике.
📈 Структура EMA
20 EMA: $2,479.36
50 EMA: $2,319.51
100 EMA: $2,188.20
200 EMA: $2,221.92
Сейчас ETH торгуется хорошо выше 20 EMA на $2,479.36.
Восстановление выше 50 EMA на $2,319.51, 100 EMA на $2,188.20 и 200 EMA на $2,221.92 сохраняет более широкую восстановительную структуру конструктивной.
Технический обзор ETH: Ethereum удерживается около $2,58K по мере продолжения восстановления
Сейчас ETH торгуется около $2,577, удерживаясь выше зоны поддержки $2,500–$2,540 после недавнего восстановления от зоны спроса $2,280–$2,360.
Более широкая восстановительная структура остаётся конструктивной: сейчас цена приближается к важной зоне сопротивления $2,627–$2,785. Уровень $2,784.60 — ключевая отметка 0.382 Фибоначчи на графике.
📈 Структура EMA
20 EMA: $2,479.36
50 EMA: $2,319.51
100 EMA: $2,188.20
200 EMA: $2,221.92
Сейчас ETH торгуется хорошо выше 20 EMA на $2,479.36.
Восстановление выше 50 EMA на $2,319.51, 100 EMA на $2,188.20 и 200 EMA на $2,221.92 сохраняет более широкую восстановительную структуру конструктивной.
Более широкая восстановительная структура остаётся конструктивной: сейчас цена приближается к важной зоне сопротивления $2,627–$2,785. Уровень $2,784.60 — ключевая отметка 0.382 Фибоначчи на графике.
📈 Структура EMA
20 EMA: $2,479.36
50 EMA: $2,319.51
100 EMA: $2,188.20
200 EMA: $2,221.92
Сейчас ETH торгуется хорошо выше 20 EMA на $2,479.36.
Восстановление выше 50 EMA на $2,319.51, 100 EMA на $2,188.20 и 200 EMA на $2,221.92 сохраняет более широкую восстановительную структуру конструктивной.
65
·
--
Статья
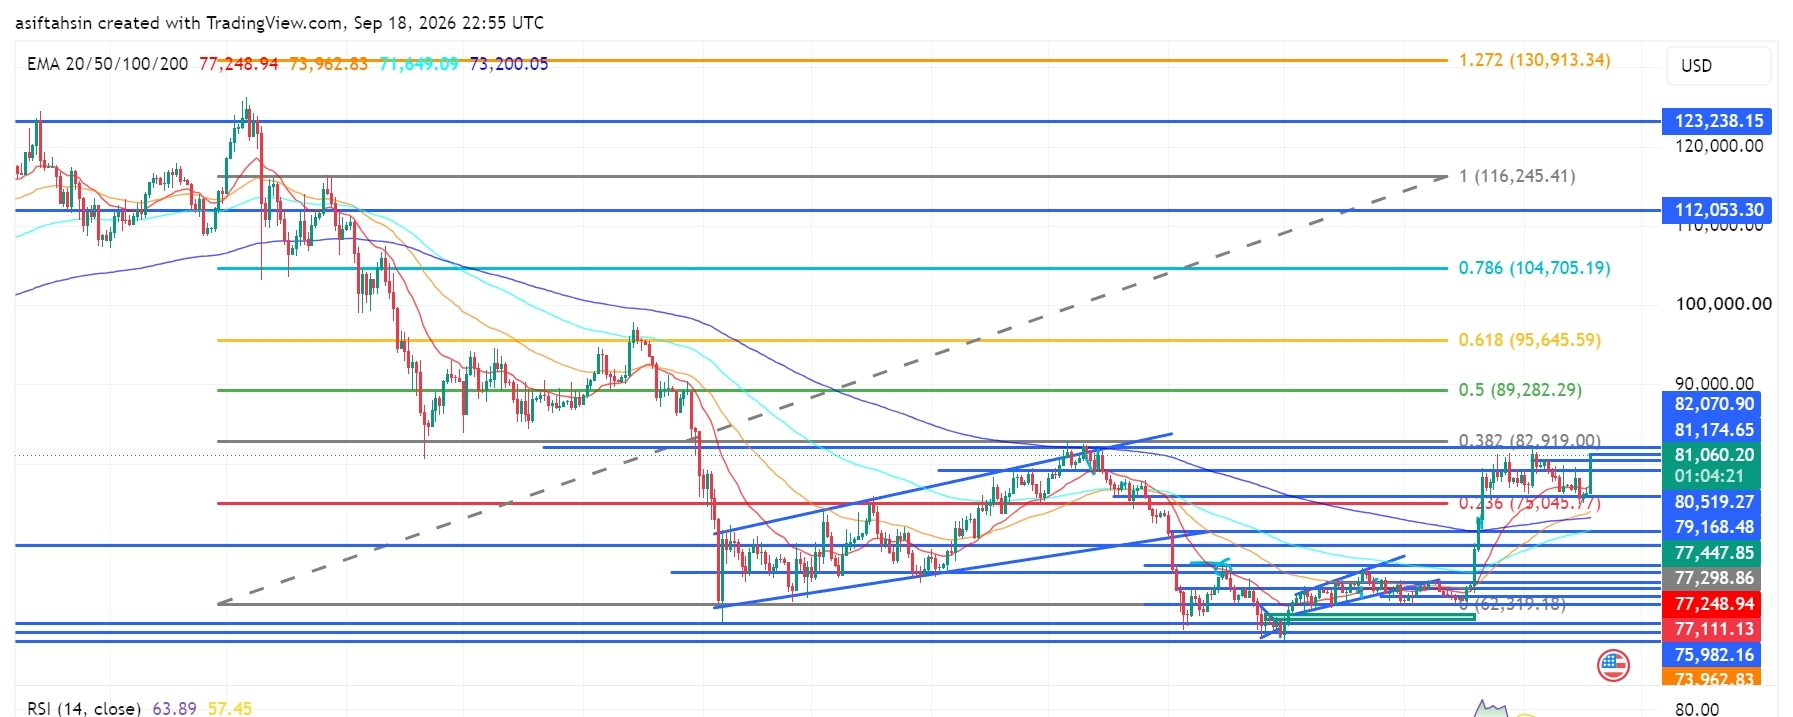
Технический обзор BTC: Биткоин возвращает $81K по мере укрепления структуры восстановленияВ настоящее время BTC торгуется около $81,060, удерживаясь выше диапазона $79,000–$80,000 после недавнего восстановления от зоны спроса $73,000–$76,000.
Общая структура улучшилась: цена вернула область $80K и снова движется к ключевой зоне сопротивления $82,070–$82,919. Устойчивое движение через эту область вернет в фокус более высокие уровни Фибоначчи.
📈 Структура EMA
20 EMA: $77,248.95
50 EMA: $73,962.83
100 EMA: $71,649.09
200 EMA: $73,200.05
В настоящее время BTC торгуется значительно выше 20 EMA на уровне $77,248.95.
Технический обзор BTC: Биткоин возвращает $81K по мере укрепления структуры восстановления
В настоящее время BTC торгуется около $81,060, удерживаясь выше диапазона $79,000–$80,000 после недавнего восстановления от зоны спроса $73,000–$76,000.
Общая структура улучшилась: цена вернула область $80K и снова движется к ключевой зоне сопротивления $82,070–$82,919. Устойчивое движение через эту область вернет в фокус более высокие уровни Фибоначчи.
📈 Структура EMA
20 EMA: $77,248.95
50 EMA: $73,962.83
100 EMA: $71,649.09
200 EMA: $73,200.05
В настоящее время BTC торгуется значительно выше 20 EMA на уровне $77,248.95.
Общая структура улучшилась: цена вернула область $80K и снова движется к ключевой зоне сопротивления $82,070–$82,919. Устойчивое движение через эту область вернет в фокус более высокие уровни Фибоначчи.
📈 Структура EMA
20 EMA: $77,248.95
50 EMA: $73,962.83
100 EMA: $71,649.09
200 EMA: $73,200.05
В настоящее время BTC торгуется значительно выше 20 EMA на уровне $77,248.95.
12
·
--
Статья
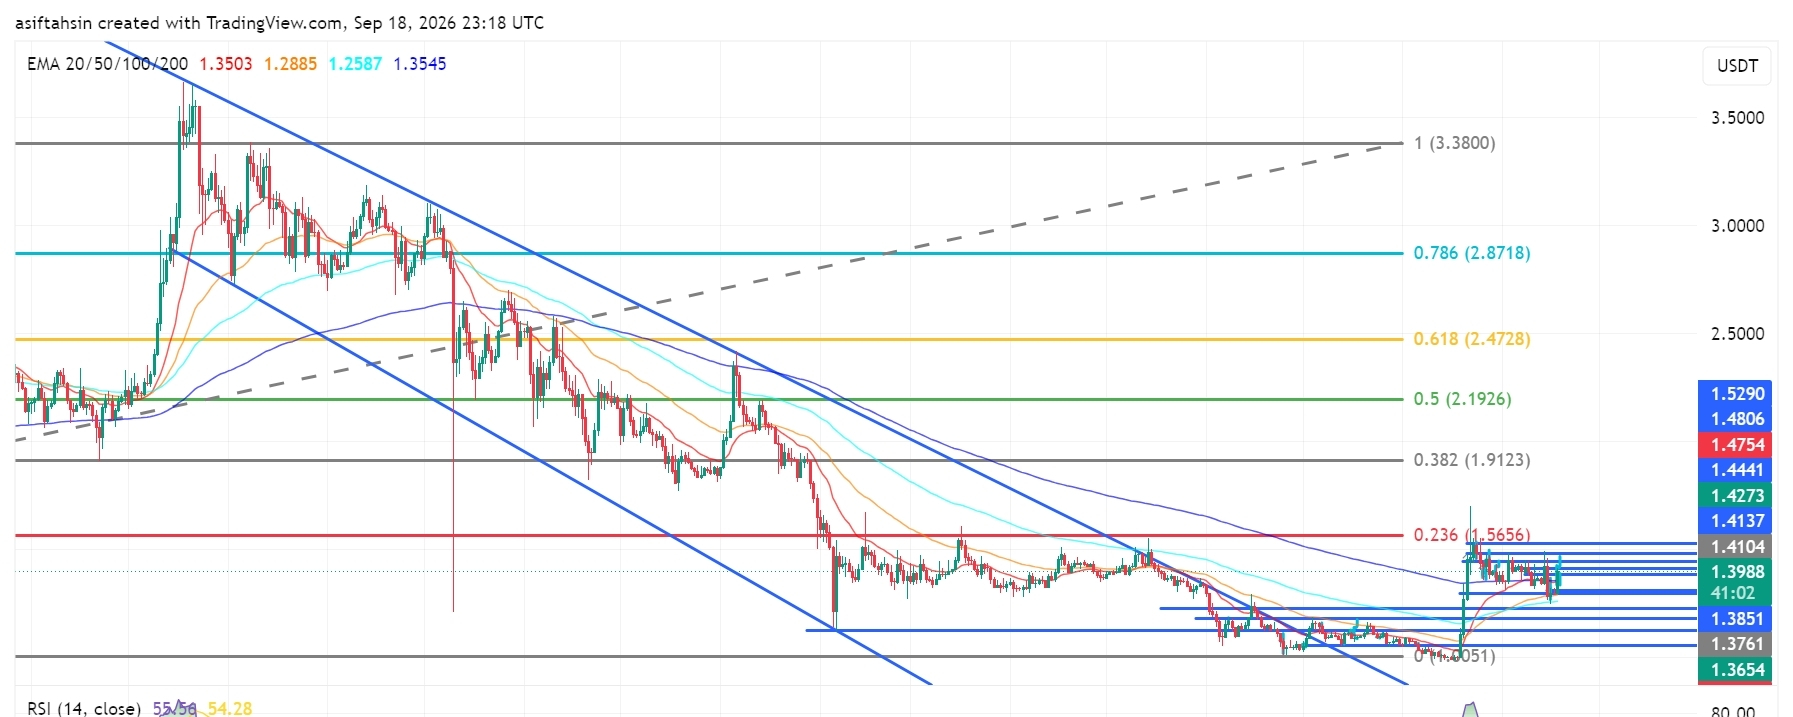
Технический обзор XRP: XRP держится около $1.40, пока быки защищают пробойВ настоящее время XRP торгуется около $1.40, консолидируясь после сильного восстановления от минимумов августа и резкого пробоя из предыдущей нисходящей структуры.
Более широкая структура значительно улучшилась: XRP торгуется выше 20, 50 и 100 EMA. Однако сейчас цена сталкивается с важным кластером сопротивления в районе $1.41–$1.43. Быкам нужен чистый пробой выше этой зоны, чтобы подтвердить следующее расширение вверх.
📈 Структура EMA
20 EMA: $1.3503
50 EMA: $1.2885
100 EMA: $1.2586
200 EMA: $1.3545
XRP в настоящее время торгуется выше всех четырех основных EMA, сохраняя восстановительную структуру конструктивной.
Технический обзор XRP: XRP держится около $1.40, пока быки защищают пробой
В настоящее время XRP торгуется около $1.40, консолидируясь после сильного восстановления от минимумов августа и резкого пробоя из предыдущей нисходящей структуры.
Более широкая структура значительно улучшилась: XRP торгуется выше 20, 50 и 100 EMA. Однако сейчас цена сталкивается с важным кластером сопротивления в районе $1.41–$1.43. Быкам нужен чистый пробой выше этой зоны, чтобы подтвердить следующее расширение вверх.
📈 Структура EMA
20 EMA: $1.3503
50 EMA: $1.2885
100 EMA: $1.2586
200 EMA: $1.3545
XRP в настоящее время торгуется выше всех четырех основных EMA, сохраняя восстановительную структуру конструктивной.
Более широкая структура значительно улучшилась: XRP торгуется выше 20, 50 и 100 EMA. Однако сейчас цена сталкивается с важным кластером сопротивления в районе $1.41–$1.43. Быкам нужен чистый пробой выше этой зоны, чтобы подтвердить следующее расширение вверх.
📈 Структура EMA
20 EMA: $1.3503
50 EMA: $1.2885
100 EMA: $1.2586
200 EMA: $1.3545
XRP в настоящее время торгуется выше всех четырех основных EMA, сохраняя восстановительную структуру конструктивной.
276
·
--
Статья
См. перевод
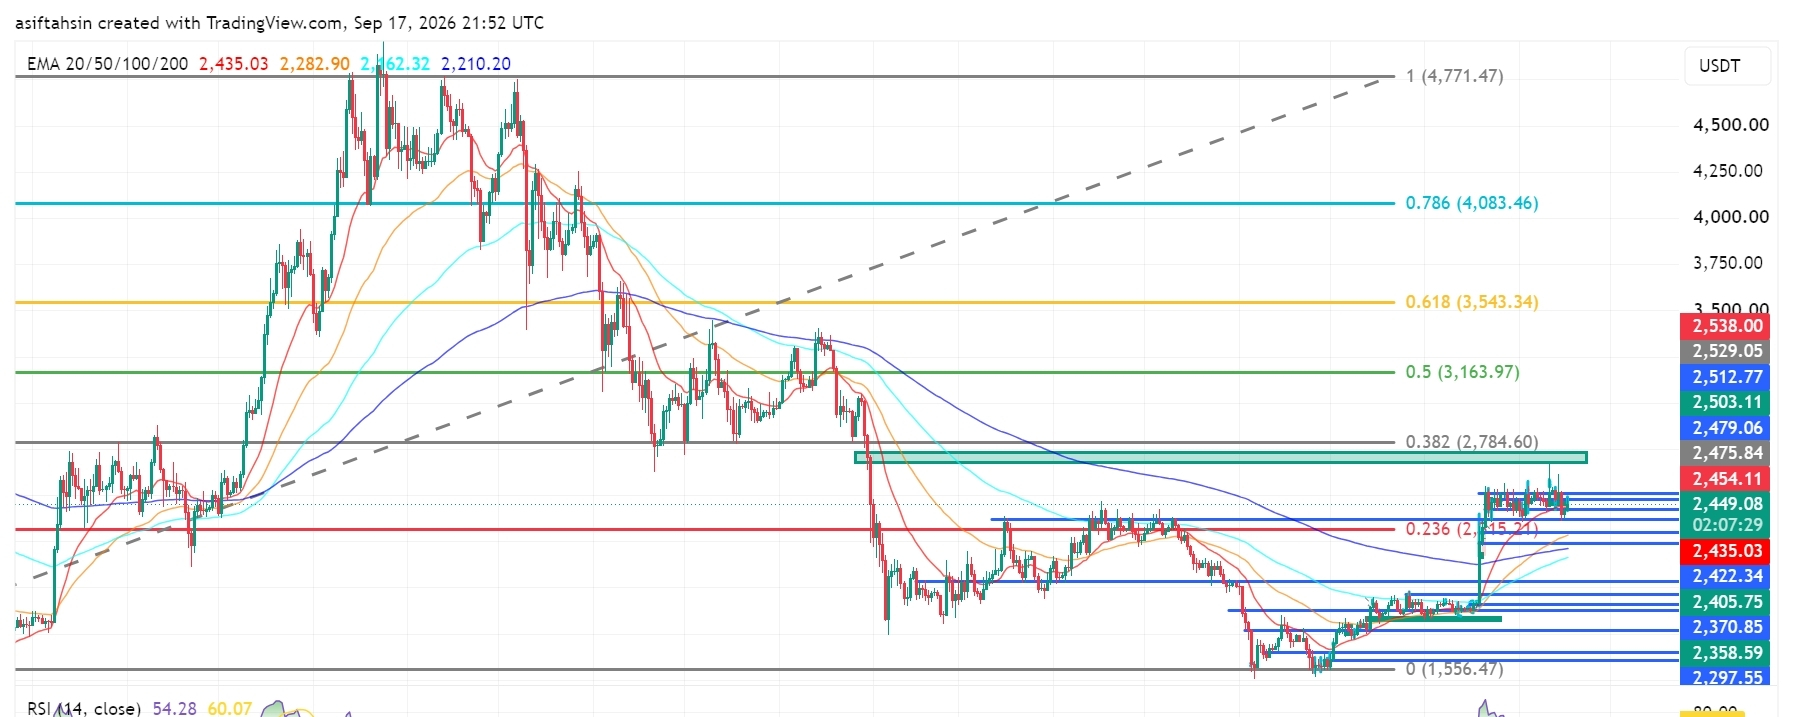
ETH Technical Outlook: Ethereum Holds Above $2.4K as Recovery Structure BuildsETH is currently trading around $2,450, holding above the $2,405–$2,435 support area after the recent recovery from the $2,300–$2,360 demand zone.
The broader structure is improving, but ETH is now consolidating below the $2,475–$2,538 resistance cluster. The next major chart area is around $2,784.60, which aligns with the 0.382 Fibonacci level.
📈 EMA Structure
20 EMA: $2,435.06
50 EMA: $2,282.92
100 EMA: $2,162.32
200 EMA: $2,210.20
ETH is currently trading above the 20 EMA at $2,435.06.
The recovery above the 50 EMA at $2,282.92, 100 EMA at $2,162.32, and 200 EMA at $2,210.20 keeps the broader recovery structure constructive.
A sustained hold above the 20 EMA would support short-term momentum, while losing the $2,210–$2,283 area would weaken the current structure.
📐 Fibonacci Levels
Key Fibonacci levels:
0.236: $2,315.21
0.382: $2,784.60
0.5: $3,163.97
0.618: $3,543.34
0.786: $4,083.46
1.0: $4,771.47
ETH is currently holding well above the 0.236 Fibonacci level at $2,315.21.
The next major Fibonacci resistance is $2,784.60 — 0.382 Fib.
A sustained move through the $2,475–$2,538 resistance structure could place the $2,784.60 region into focus.
🟢 Bullish Scenario
ETH is consolidating after the recent recovery and is currently holding above the $2,435 area.
Immediate resistance:
$2,454.11
$2,475.84
$2,479.06
$2,503.11
$2,512.77
$2,529.05
$2,538.00
$2,784.60 — 0.382 Fibonacci
A clean breakout and sustained close above the $2,529–$2,538 zone would provide stronger confirmation of continued recovery.
🎯 Target 1: $2,475.84
🎯 Target 2: $2,503.11
🎯 Target 3: $2,529.05
🎯 Target 4: $2,538.00
🎯 Target 5: $2,784.60 — 0.382 Fibonacci
🎯 Target 6: $3,163.97 — 0.5 Fibonacci
A confirmed move above $2,538 could strengthen the medium-term recovery structure and bring the $2,784–$3,164 region into focus.
🔴 Pullback Scenario
After the recent recovery, a retest of the breakout area would be normal.
Key supports:
$2,449.37
$2,435.06 — 20 EMA
$2,422.34
$2,405.75
$2,370.85
$2,358.59
$2,297.55
$2,282.92 — 50 EMA
$2,210.20 — 200 EMA
The $2,405–$2,435 zone is particularly important.
If ETH continues to hold this area during a pullback, the current recovery structure remains active.
A sustained loss of $2,282.92 would weaken the broader structure and could expose the $2,210–$2,162 area.
🧠 Market Structure & Liquidity
ETH has formed a clear recovery structure after sweeping liquidity around the $2,280–$2,360 region.
The recent move produced a strong recovery followed by a breakout above the previous consolidation area.
ETH is now moving through an important:
Recovery → Breakout → Retest → Consolidation
structure.
The major upside liquidity is concentrated around $2,475–$2,538. A decisive move through this zone would place $2,784.60 as the next major Fibonacci reference.
📊 RSI Momentum
RSI (14): 54.28
RSI remains above the neutral 50 level after the recent recovery.
The current reading shows moderately positive momentum, while the RSI signal line is around 60.07.
A sustained RSI move above 55–60 would indicate improving momentum toward the upper resistance area.
A move back below 50 would indicate increasing short-term momentum weakness.
🎯 Key Levels
🔴 Major Resistance: $2,454.11 → $2,475.84 → $2,503.11 → $2,529.05 → $2,538.00
🟢 Major Support: $2,435.06 → $2,422.34 → $2,405.75 → $2,370.85 → $2,358.59
📉 Dynamic EMA Support: $2,435.06 — 20 EMA | $2,282.92 — 50 EMA | $2,210.20 — 200 EMA | $2,162.32 — 100 EMA
🚀 Upside References: $2,538 → $2,784.60 → $3,163.97 → $3,543.34
📌 Final Outlook
ETH's broader structure remains constructive after the recent recovery, with price holding above the $2,405–$2,435 area.
The $2,405–$2,435 zone is now an important short-term support region. As long as ETH maintains this area, the current recovery structure remains active.
The immediate battle is around $2,475–$2,538. A confirmed move above $2,538 could open the path toward $2,784.60, followed by $3,163.97.
However, rejection from resistance followed by a sustained loss of $2,282.92 would weaken the broader structure and increase the possibility of a deeper retracement toward the $2,210–$2,162 area.
Bias: 🟢 Recovery structure intact above $2,282.92. A breakout above $2,538 could open the path toward $2,784.60, with $3,163.97 as the next major Fibonacci reference.
$ETH
{future}(ETHUSDT)
ETH Technical Outlook: Ethereum Holds Above $2.4K as Recovery Structure Builds
ETH is currently trading around $2,450, holding above the $2,405–$2,435 support area after the recent recovery from the $2,300–$2,360 demand zone.
The broader structure is improving, but ETH is now consolidating below the $2,475–$2,538 resistance cluster. The next major chart area is around $2,784.60, which aligns with the 0.382 Fibonacci level.
📈 EMA Structure
20 EMA: $2,435.06
50 EMA: $2,282.92
100 EMA: $2,162.32
200 EMA: $2,210.20
ETH is currently trading above the 20 EMA at $2,435.06.
The recovery above the 50 EMA at $2,282.92, 100 EMA at $2,162.32, and 200 EMA at $2,210.20 keeps the broader recovery structure constructive.
A sustained hold above the 20 EMA would support short-term momentum, while losing the $2,210–$2,283 area would weaken the current structure.
📐 Fibonacci Levels
Key Fibonacci levels:
0.236: $2,315.21
0.382: $2,784.60
0.5: $3,163.97
0.618: $3,543.34
0.786: $4,083.46
1.0: $4,771.47
ETH is currently holding well above the 0.236 Fibonacci level at $2,315.21.
The next major Fibonacci resistance is $2,784.60 — 0.382 Fib.
A sustained move through the $2,475–$2,538 resistance structure could place the $2,784.60 region into focus.
🟢 Bullish Scenario
ETH is consolidating after the recent recovery and is currently holding above the $2,435 area.
Immediate resistance:
$2,454.11
$2,475.84
$2,479.06
$2,503.11
$2,512.77
$2,529.05
$2,538.00
$2,784.60 — 0.382 Fibonacci
A clean breakout and sustained close above the $2,529–$2,538 zone would provide stronger confirmation of continued recovery.
🎯 Target 1: $2,475.84
🎯 Target 2: $2,503.11
🎯 Target 3: $2,529.05
🎯 Target 4: $2,538.00
🎯 Target 5: $2,784.60 — 0.382 Fibonacci
🎯 Target 6: $3,163.97 — 0.5 Fibonacci
A confirmed move above $2,538 could strengthen the medium-term recovery structure and bring the $2,784–$3,164 region into focus.
🔴 Pullback Scenario
After the recent recovery, a retest of the breakout area would be normal.
Key supports:
$2,449.37
$2,435.06 — 20 EMA
$2,422.34
$2,405.75
$2,370.85
$2,358.59
$2,297.55
$2,282.92 — 50 EMA
$2,210.20 — 200 EMA
The $2,405–$2,435 zone is particularly important.
If ETH continues to hold this area during a pullback, the current recovery structure remains active.
A sustained loss of $2,282.92 would weaken the broader structure and could expose the $2,210–$2,162 area.
🧠 Market Structure & Liquidity
ETH has formed a clear recovery structure after sweeping liquidity around the $2,280–$2,360 region.
The recent move produced a strong recovery followed by a breakout above the previous consolidation area.
ETH is now moving through an important:
Recovery → Breakout → Retest → Consolidation
structure.
The major upside liquidity is concentrated around $2,475–$2,538. A decisive move through this zone would place $2,784.60 as the next major Fibonacci reference.
📊 RSI Momentum
RSI (14): 54.28
RSI remains above the neutral 50 level after the recent recovery.
The current reading shows moderately positive momentum, while the RSI signal line is around 60.07.
A sustained RSI move above 55–60 would indicate improving momentum toward the upper resistance area.
A move back below 50 would indicate increasing short-term momentum weakness.
🎯 Key Levels
🔴 Major Resistance: $2,454.11 → $2,475.84 → $2,503.11 → $2,529.05 → $2,538.00
🟢 Major Support: $2,435.06 → $2,422.34 → $2,405.75 → $2,370.85 → $2,358.59
📉 Dynamic EMA Support: $2,435.06 — 20 EMA | $2,282.92 — 50 EMA | $2,210.20 — 200 EMA | $2,162.32 — 100 EMA
🚀 Upside References: $2,538 → $2,784.60 → $3,163.97 → $3,543.34
📌 Final Outlook
ETH's broader structure remains constructive after the recent recovery, with price holding above the $2,405–$2,435 area.
The $2,405–$2,435 zone is now an important short-term support region. As long as ETH maintains this area, the current recovery structure remains active.
The immediate battle is around $2,475–$2,538. A confirmed move above $2,538 could open the path toward $2,784.60, followed by $3,163.97.
However, rejection from resistance followed by a sustained loss of $2,282.92 would weaken the broader structure and increase the possibility of a deeper retracement toward the $2,210–$2,162 area.
Bias: 🟢 Recovery structure intact above $2,282.92. A breakout above $2,538 could open the path toward $2,784.60, with $3,163.97 as the next major Fibonacci reference.
$ETH
The broader structure is improving, but ETH is now consolidating below the $2,475–$2,538 resistance cluster. The next major chart area is around $2,784.60, which aligns with the 0.382 Fibonacci level.
📈 EMA Structure
20 EMA: $2,435.06
50 EMA: $2,282.92
100 EMA: $2,162.32
200 EMA: $2,210.20
ETH is currently trading above the 20 EMA at $2,435.06.
The recovery above the 50 EMA at $2,282.92, 100 EMA at $2,162.32, and 200 EMA at $2,210.20 keeps the broader recovery structure constructive.
A sustained hold above the 20 EMA would support short-term momentum, while losing the $2,210–$2,283 area would weaken the current structure.
📐 Fibonacci Levels
Key Fibonacci levels:
0.236: $2,315.21
0.382: $2,784.60
0.5: $3,163.97
0.618: $3,543.34
0.786: $4,083.46
1.0: $4,771.47
ETH is currently holding well above the 0.236 Fibonacci level at $2,315.21.
The next major Fibonacci resistance is $2,784.60 — 0.382 Fib.
A sustained move through the $2,475–$2,538 resistance structure could place the $2,784.60 region into focus.
🟢 Bullish Scenario
ETH is consolidating after the recent recovery and is currently holding above the $2,435 area.
Immediate resistance:
$2,454.11
$2,475.84
$2,479.06
$2,503.11
$2,512.77
$2,529.05
$2,538.00
$2,784.60 — 0.382 Fibonacci
A clean breakout and sustained close above the $2,529–$2,538 zone would provide stronger confirmation of continued recovery.
🎯 Target 1: $2,475.84
🎯 Target 2: $2,503.11
🎯 Target 3: $2,529.05
🎯 Target 4: $2,538.00
🎯 Target 5: $2,784.60 — 0.382 Fibonacci
🎯 Target 6: $3,163.97 — 0.5 Fibonacci
A confirmed move above $2,538 could strengthen the medium-term recovery structure and bring the $2,784–$3,164 region into focus.
🔴 Pullback Scenario
After the recent recovery, a retest of the breakout area would be normal.
Key supports:
$2,449.37
$2,435.06 — 20 EMA
$2,422.34
$2,405.75
$2,370.85
$2,358.59
$2,297.55
$2,282.92 — 50 EMA
$2,210.20 — 200 EMA
The $2,405–$2,435 zone is particularly important.
If ETH continues to hold this area during a pullback, the current recovery structure remains active.
A sustained loss of $2,282.92 would weaken the broader structure and could expose the $2,210–$2,162 area.
🧠 Market Structure & Liquidity
ETH has formed a clear recovery structure after sweeping liquidity around the $2,280–$2,360 region.
The recent move produced a strong recovery followed by a breakout above the previous consolidation area.
ETH is now moving through an important:
Recovery → Breakout → Retest → Consolidation
structure.
The major upside liquidity is concentrated around $2,475–$2,538. A decisive move through this zone would place $2,784.60 as the next major Fibonacci reference.
📊 RSI Momentum
RSI (14): 54.28
RSI remains above the neutral 50 level after the recent recovery.
The current reading shows moderately positive momentum, while the RSI signal line is around 60.07.
A sustained RSI move above 55–60 would indicate improving momentum toward the upper resistance area.
A move back below 50 would indicate increasing short-term momentum weakness.
🎯 Key Levels
🔴 Major Resistance: $2,454.11 → $2,475.84 → $2,503.11 → $2,529.05 → $2,538.00
🟢 Major Support: $2,435.06 → $2,422.34 → $2,405.75 → $2,370.85 → $2,358.59
📉 Dynamic EMA Support: $2,435.06 — 20 EMA | $2,282.92 — 50 EMA | $2,210.20 — 200 EMA | $2,162.32 — 100 EMA
🚀 Upside References: $2,538 → $2,784.60 → $3,163.97 → $3,543.34
📌 Final Outlook
ETH's broader structure remains constructive after the recent recovery, with price holding above the $2,405–$2,435 area.
The $2,405–$2,435 zone is now an important short-term support region. As long as ETH maintains this area, the current recovery structure remains active.
The immediate battle is around $2,475–$2,538. A confirmed move above $2,538 could open the path toward $2,784.60, followed by $3,163.97.
However, rejection from resistance followed by a sustained loss of $2,282.92 would weaken the broader structure and increase the possibility of a deeper retracement toward the $2,210–$2,162 area.
Bias: 🟢 Recovery structure intact above $2,282.92. A breakout above $2,538 could open the path toward $2,784.60, with $3,163.97 as the next major Fibonacci reference.
$ETH
75
·
--
Статья
См. перевод
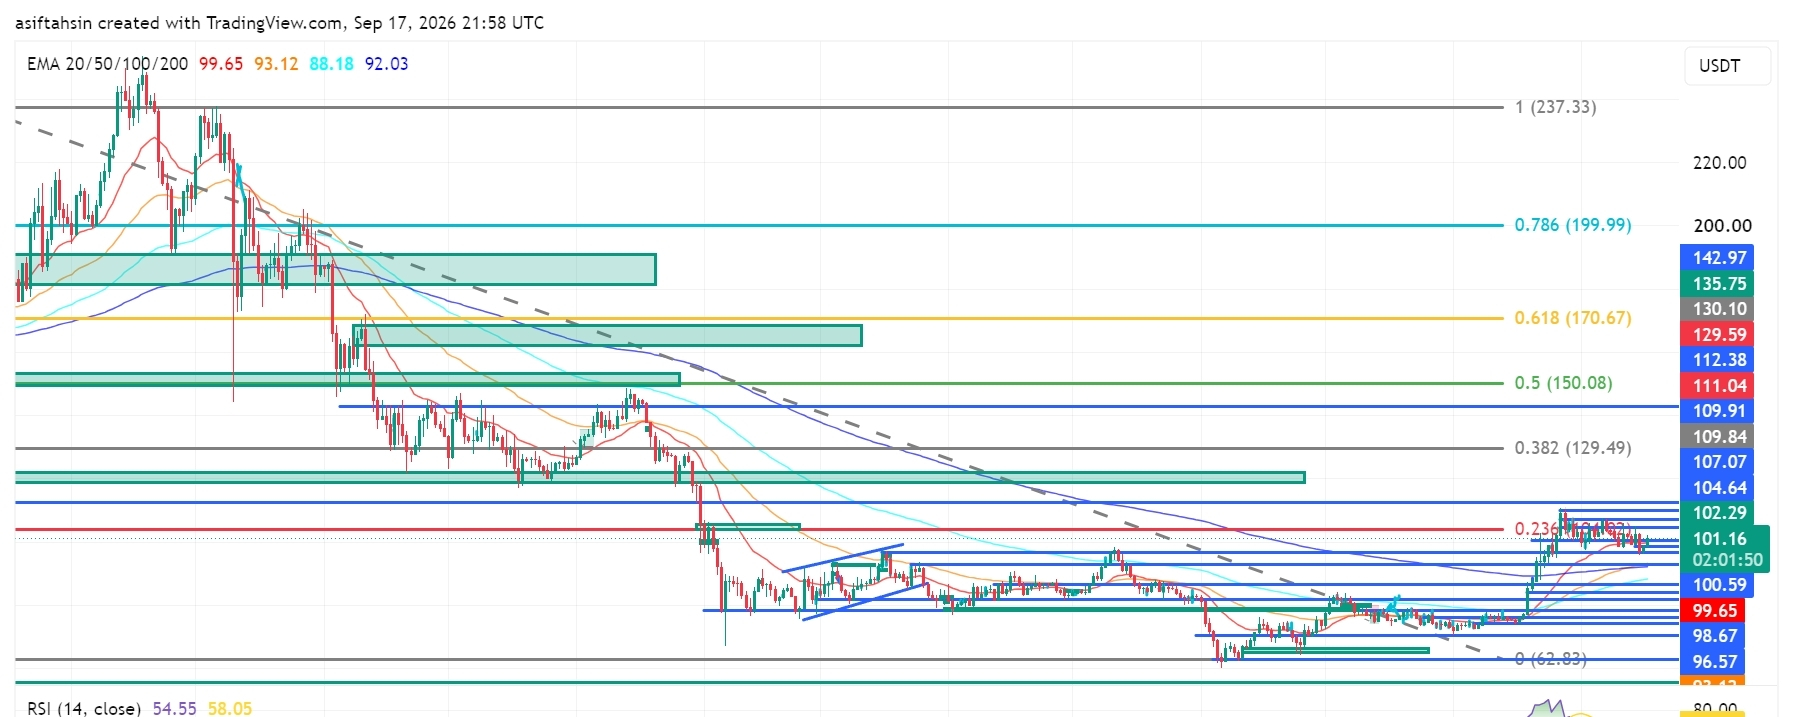
SOL Technical Outlook: Solana Holds Above $100 as Bulls Defend the RecoverySOL is currently trading around $101.16, holding above the $99–$100 breakout zone after the recent bullish expansion from the $92–$94 demand area.
The broader recovery structure remains constructive, but SOL is now consolidating below the $102.29–$107.07 resistance cluster. Bulls need to reclaim this area and break the $109.91–$112.38 zone for the next major upside expansion.
📈 EMA Structure
- 20 EMA: $99.65
- 50 EMA: $93.12
- 100 EMA: $88.18
- 200 EMA: $92.03
SOL is currently trading above the 20 EMA at $99.65.
The recovery above the 50 EMA at $93.12 and 200 EMA at $92.03 keeps the broader recovery structure intact.
A sustained hold above the 20 EMA would support short-term momentum, while losing the $93.12–$92.03 area would weaken the current structure.
📐 Fibonacci Levels
Key Fibonacci levels:
- 0.236: $104.64
- 0.382: $129.49
- 0.5: $150.08
- 0.618: $170.67
- 0.786: $199.99
- 1.0: $237.33
SOL is currently trading below the 0.236 Fibonacci level at $104.64.
The next major Fibonacci resistance is $129.49 — 0.382 Fib.
A sustained breakout through the $104–$112 resistance structure could open the path toward the $129.49 region.
🟢 Bullish Scenario
SOL is consolidating after the recent recovery and is currently maintaining acceptance above the $100 area.
Immediate resistance:
- $102.29
- $104.64 — 0.236 Fibonacci
- $107.07
- $109.84
- $109.91
- $111.04
- $112.38
A clean breakout and sustained close above $111.04–$112.38 would provide stronger confirmation of bullish continuation.
🎯 Target 1: $104.64
🎯 Target 2: $107.07
🎯 Target 3: $109.91
🎯 Target 4: $112.38
🎯 Target 5: $129.49 — 0.382 Fibonacci
🎯 Target 6: $150.08 — 0.5 Fibonacci
A confirmed breakout above the $111–$112 zone could strengthen the medium-term recovery structure and potentially accelerate SOL toward the $129–$150 region.
🔴 Pullback Scenario
After the recent bullish expansion, a retest of the breakout area would be normal.
Key supports:
- $100.59
- $99.65 — 20 EMA
- $98.67
- $96.57
- $93.12 — 50 EMA
- $92.94
- $92.03 — 200 EMA
- $88.18 — 100 EMA
The $96–$100 zone is particularly important.
If SOL continues to hold this area during a pullback, the current recovery structure remains active.
A sustained loss of $92.03 would weaken the current structure and could expose the $88.18 support zone.
🧠 Market Structure & Liquidity
SOL has formed a clear recovery structure after sweeping liquidity around the $92–$94 demand region.
The recent move produced a market-structure shift followed by a breakout and higher-low formation.
SOL is now moving through an important:
Breakout → Retest → Consolidation → Continuation
structure.
The major upside liquidity is concentrated around $102–$112. A decisive breakout above this zone would place $129.49 as the next major Fibonacci reference.
📊 RSI Momentum
RSI (14): 54.55
RSI remains above the neutral 50 level after cooling from the recent bullish expansion.
The current reading shows moderately positive momentum without reaching an extreme zone.
A sustained RSI move above 55–60 would indicate improving momentum toward the upper resistance area.
A move back below 50 would indicate increasing short-term momentum weakness.
🎯 Key Levels
🔴 Major Resistance: $102.29 → $104.64 → $107.07 → $109.91 → $111.04 → $112.38
🟢 Major Support: $100.59 → $99.65 → $98.67 → $96.57 → $93.12 → $92.03
📉 Dynamic EMA Support: $99.65 — 20 EMA | $93.12 — 50 EMA | $92.03 — 200 EMA | $88.18 — 100 EMA
🚀 Upside Targets: $112.38 → $129.49 → $150.08 → $170.67
📌 Final Outlook
SOL's broader structure remains constructive after the recent breakout, with price holding above the $99–$100 region.
The $96–$100 area is now an important short-term support region. As long as SOL maintains this area, the current recovery structure remains active.
The immediate battle is around $102–$112. A confirmed breakout above $112.38 could open the path toward $129.49, followed by $150.08 and potentially $170.67.
However, rejection from resistance followed by a sustained loss of $92.03 would weaken the current structure and increase the possibility of a deeper retracement toward the $88.18 area.
Bias: 🟢 Recovery structure intact above $92.03. A breakout above $112.38 could open the path toward $129.49, with $150.08 as the next major Fibonacci target.
$SOL
{future}(SOLUSDT)
SOL Technical Outlook: Solana Holds Above $100 as Bulls Defend the Recovery
SOL is currently trading around $101.16, holding above the $99–$100 breakout zone after the recent bullish expansion from the $92–$94 demand area.
The broader recovery structure remains constructive, but SOL is now consolidating below the $102.29–$107.07 resistance cluster. Bulls need to reclaim this area and break the $109.91–$112.38 zone for the next major upside expansion.
📈 EMA Structure
- 20 EMA: $99.65
- 50 EMA: $93.12
- 100 EMA: $88.18
- 200 EMA: $92.03
SOL is currently trading above the 20 EMA at $99.65.
The recovery above the 50 EMA at $93.12 and 200 EMA at $92.03 keeps the broader recovery structure intact.
A sustained hold above the 20 EMA would support short-term momentum, while losing the $93.12–$92.03 area would weaken the current structure.
📐 Fibonacci Levels
Key Fibonacci levels:
- 0.236: $104.64
- 0.382: $129.49
- 0.5: $150.08
- 0.618: $170.67
- 0.786: $199.99
- 1.0: $237.33
SOL is currently trading below the 0.236 Fibonacci level at $104.64.
The next major Fibonacci resistance is $129.49 — 0.382 Fib.
A sustained breakout through the $104–$112 resistance structure could open the path toward the $129.49 region.
🟢 Bullish Scenario
SOL is consolidating after the recent recovery and is currently maintaining acceptance above the $100 area.
Immediate resistance:
- $102.29
- $104.64 — 0.236 Fibonacci
- $107.07
- $109.84
- $109.91
- $111.04
- $112.38
A clean breakout and sustained close above $111.04–$112.38 would provide stronger confirmation of bullish continuation.
🎯 Target 1: $104.64
🎯 Target 2: $107.07
🎯 Target 3: $109.91
🎯 Target 4: $112.38
🎯 Target 5: $129.49 — 0.382 Fibonacci
🎯 Target 6: $150.08 — 0.5 Fibonacci
A confirmed breakout above the $111–$112 zone could strengthen the medium-term recovery structure and potentially accelerate SOL toward the $129–$150 region.
🔴 Pullback Scenario
After the recent bullish expansion, a retest of the breakout area would be normal.
Key supports:
- $100.59
- $99.65 — 20 EMA
- $98.67
- $96.57
- $93.12 — 50 EMA
- $92.94
- $92.03 — 200 EMA
- $88.18 — 100 EMA
The $96–$100 zone is particularly important.
If SOL continues to hold this area during a pullback, the current recovery structure remains active.
A sustained loss of $92.03 would weaken the current structure and could expose the $88.18 support zone.
🧠 Market Structure & Liquidity
SOL has formed a clear recovery structure after sweeping liquidity around the $92–$94 demand region.
The recent move produced a market-structure shift followed by a breakout and higher-low formation.
SOL is now moving through an important:
Breakout → Retest → Consolidation → Continuation
structure.
The major upside liquidity is concentrated around $102–$112. A decisive breakout above this zone would place $129.49 as the next major Fibonacci reference.
📊 RSI Momentum
RSI (14): 54.55
RSI remains above the neutral 50 level after cooling from the recent bullish expansion.
The current reading shows moderately positive momentum without reaching an extreme zone.
A sustained RSI move above 55–60 would indicate improving momentum toward the upper resistance area.
A move back below 50 would indicate increasing short-term momentum weakness.
🎯 Key Levels
🔴 Major Resistance: $102.29 → $104.64 → $107.07 → $109.91 → $111.04 → $112.38
🟢 Major Support: $100.59 → $99.65 → $98.67 → $96.57 → $93.12 → $92.03
📉 Dynamic EMA Support: $99.65 — 20 EMA | $93.12 — 50 EMA | $92.03 — 200 EMA | $88.18 — 100 EMA
🚀 Upside Targets: $112.38 → $129.49 → $150.08 → $170.67
📌 Final Outlook
SOL's broader structure remains constructive after the recent breakout, with price holding above the $99–$100 region.
The $96–$100 area is now an important short-term support region. As long as SOL maintains this area, the current recovery structure remains active.
The immediate battle is around $102–$112. A confirmed breakout above $112.38 could open the path toward $129.49, followed by $150.08 and potentially $170.67.
However, rejection from resistance followed by a sustained loss of $92.03 would weaken the current structure and increase the possibility of a deeper retracement toward the $88.18 area.
Bias: 🟢 Recovery structure intact above $92.03. A breakout above $112.38 could open the path toward $129.49, with $150.08 as the next major Fibonacci target.
$SOL
The broader recovery structure remains constructive, but SOL is now consolidating below the $102.29–$107.07 resistance cluster. Bulls need to reclaim this area and break the $109.91–$112.38 zone for the next major upside expansion.
📈 EMA Structure
- 20 EMA: $99.65
- 50 EMA: $93.12
- 100 EMA: $88.18
- 200 EMA: $92.03
SOL is currently trading above the 20 EMA at $99.65.
The recovery above the 50 EMA at $93.12 and 200 EMA at $92.03 keeps the broader recovery structure intact.
A sustained hold above the 20 EMA would support short-term momentum, while losing the $93.12–$92.03 area would weaken the current structure.
📐 Fibonacci Levels
Key Fibonacci levels:
- 0.236: $104.64
- 0.382: $129.49
- 0.5: $150.08
- 0.618: $170.67
- 0.786: $199.99
- 1.0: $237.33
SOL is currently trading below the 0.236 Fibonacci level at $104.64.
The next major Fibonacci resistance is $129.49 — 0.382 Fib.
A sustained breakout through the $104–$112 resistance structure could open the path toward the $129.49 region.
🟢 Bullish Scenario
SOL is consolidating after the recent recovery and is currently maintaining acceptance above the $100 area.
Immediate resistance:
- $102.29
- $104.64 — 0.236 Fibonacci
- $107.07
- $109.84
- $109.91
- $111.04
- $112.38
A clean breakout and sustained close above $111.04–$112.38 would provide stronger confirmation of bullish continuation.
🎯 Target 1: $104.64
🎯 Target 2: $107.07
🎯 Target 3: $109.91
🎯 Target 4: $112.38
🎯 Target 5: $129.49 — 0.382 Fibonacci
🎯 Target 6: $150.08 — 0.5 Fibonacci
A confirmed breakout above the $111–$112 zone could strengthen the medium-term recovery structure and potentially accelerate SOL toward the $129–$150 region.
🔴 Pullback Scenario
After the recent bullish expansion, a retest of the breakout area would be normal.
Key supports:
- $100.59
- $99.65 — 20 EMA
- $98.67
- $96.57
- $93.12 — 50 EMA
- $92.94
- $92.03 — 200 EMA
- $88.18 — 100 EMA
The $96–$100 zone is particularly important.
If SOL continues to hold this area during a pullback, the current recovery structure remains active.
A sustained loss of $92.03 would weaken the current structure and could expose the $88.18 support zone.
🧠 Market Structure & Liquidity
SOL has formed a clear recovery structure after sweeping liquidity around the $92–$94 demand region.
The recent move produced a market-structure shift followed by a breakout and higher-low formation.
SOL is now moving through an important:
Breakout → Retest → Consolidation → Continuation
structure.
The major upside liquidity is concentrated around $102–$112. A decisive breakout above this zone would place $129.49 as the next major Fibonacci reference.
📊 RSI Momentum
RSI (14): 54.55
RSI remains above the neutral 50 level after cooling from the recent bullish expansion.
The current reading shows moderately positive momentum without reaching an extreme zone.
A sustained RSI move above 55–60 would indicate improving momentum toward the upper resistance area.
A move back below 50 would indicate increasing short-term momentum weakness.
🎯 Key Levels
🔴 Major Resistance: $102.29 → $104.64 → $107.07 → $109.91 → $111.04 → $112.38
🟢 Major Support: $100.59 → $99.65 → $98.67 → $96.57 → $93.12 → $92.03
📉 Dynamic EMA Support: $99.65 — 20 EMA | $93.12 — 50 EMA | $92.03 — 200 EMA | $88.18 — 100 EMA
🚀 Upside Targets: $112.38 → $129.49 → $150.08 → $170.67
📌 Final Outlook
SOL's broader structure remains constructive after the recent breakout, with price holding above the $99–$100 region.
The $96–$100 area is now an important short-term support region. As long as SOL maintains this area, the current recovery structure remains active.
The immediate battle is around $102–$112. A confirmed breakout above $112.38 could open the path toward $129.49, followed by $150.08 and potentially $170.67.
However, rejection from resistance followed by a sustained loss of $92.03 would weaken the current structure and increase the possibility of a deeper retracement toward the $88.18 area.
Bias: 🟢 Recovery structure intact above $92.03. A breakout above $112.38 could open the path toward $129.49, with $150.08 as the next major Fibonacci target.
$SOL
73
·
--
Статья
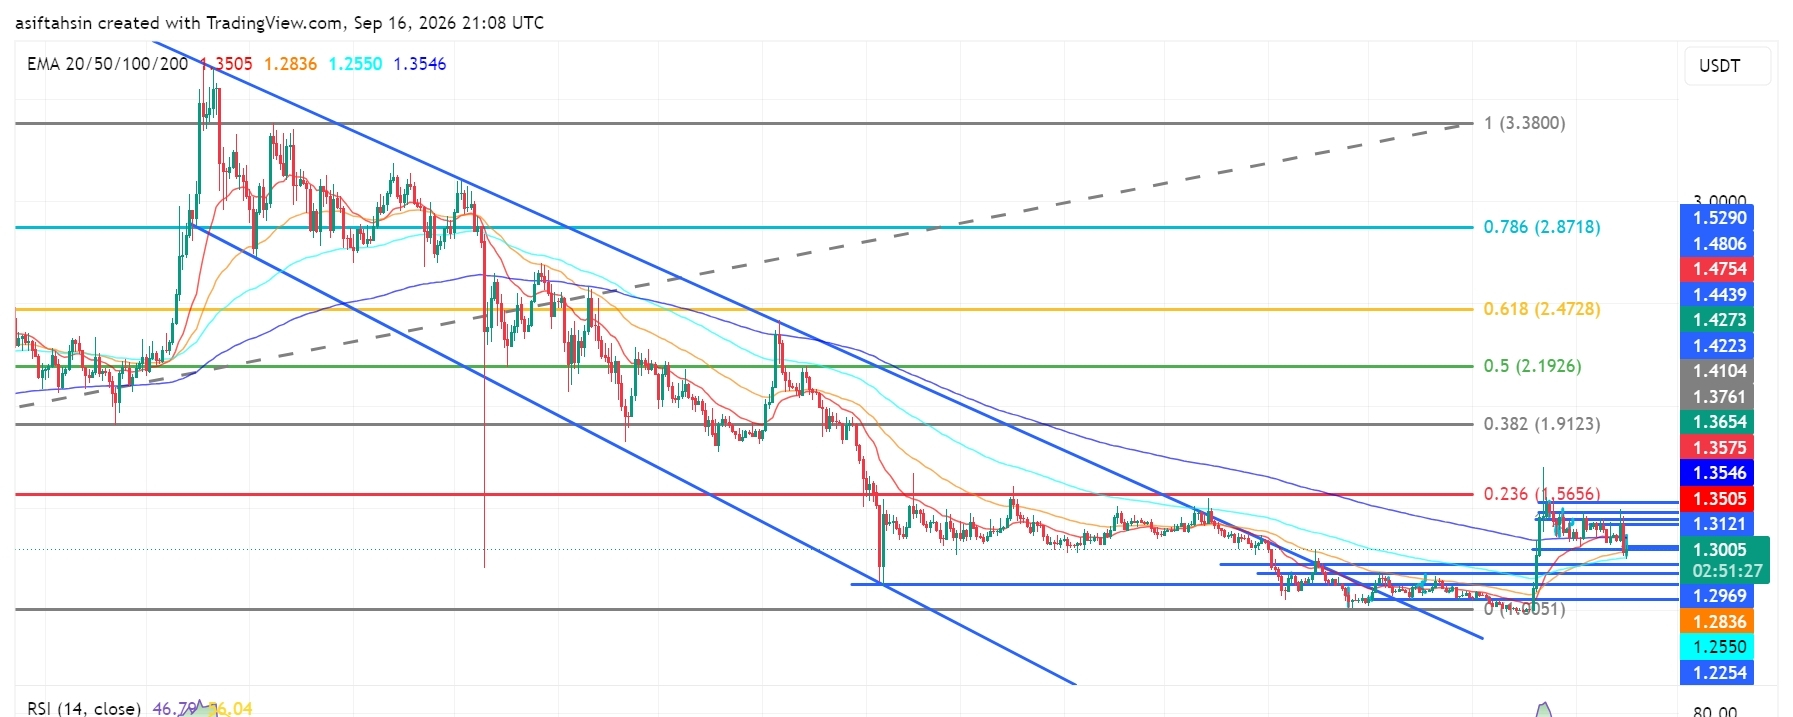
Технический обзор XRP: XRP консолидируется около $1.30 после резкого откатаXRP торгуется около $1.30 на графике после резкого отката от диапазона $1.35–$1.43. Цена вернулась к области пробоя, в то время как более широкий график по-прежнему находится в фазе восстановления после зоны $1.20–$1.25. Текущий импульс нейтральный: RSI ниже 50.
📈 Структура EMA
20 EMA: $1.3505
50 EMA: $1.2836
100 EMA: $1.2550
200 EMA: $1.3546
Сейчас XRP находится ниже 20 EMA и 200 EMA, при этом 50 и 100 EMA остаются ниже цены. Возврат области $1.35 улучшит краткосрочную структуру.
Технический обзор XRP: XRP консолидируется около $1.30 после резкого отката
XRP торгуется около $1.30 на графике после резкого отката от диапазона $1.35–$1.43. Цена вернулась к области пробоя, в то время как более широкий график по-прежнему находится в фазе восстановления после зоны $1.20–$1.25. Текущий импульс нейтральный: RSI ниже 50.
📈 Структура EMA
20 EMA: $1.3505
50 EMA: $1.2836
100 EMA: $1.2550
200 EMA: $1.3546
Сейчас XRP находится ниже 20 EMA и 200 EMA, при этом 50 и 100 EMA остаются ниже цены. Возврат области $1.35 улучшит краткосрочную структуру.
📈 Структура EMA
20 EMA: $1.3505
50 EMA: $1.2836
100 EMA: $1.2550
200 EMA: $1.3546
Сейчас XRP находится ниже 20 EMA и 200 EMA, при этом 50 и 100 EMA остаются ниже цены. Возврат области $1.35 улучшит краткосрочную структуру.
1
3
788
·
--
Статья
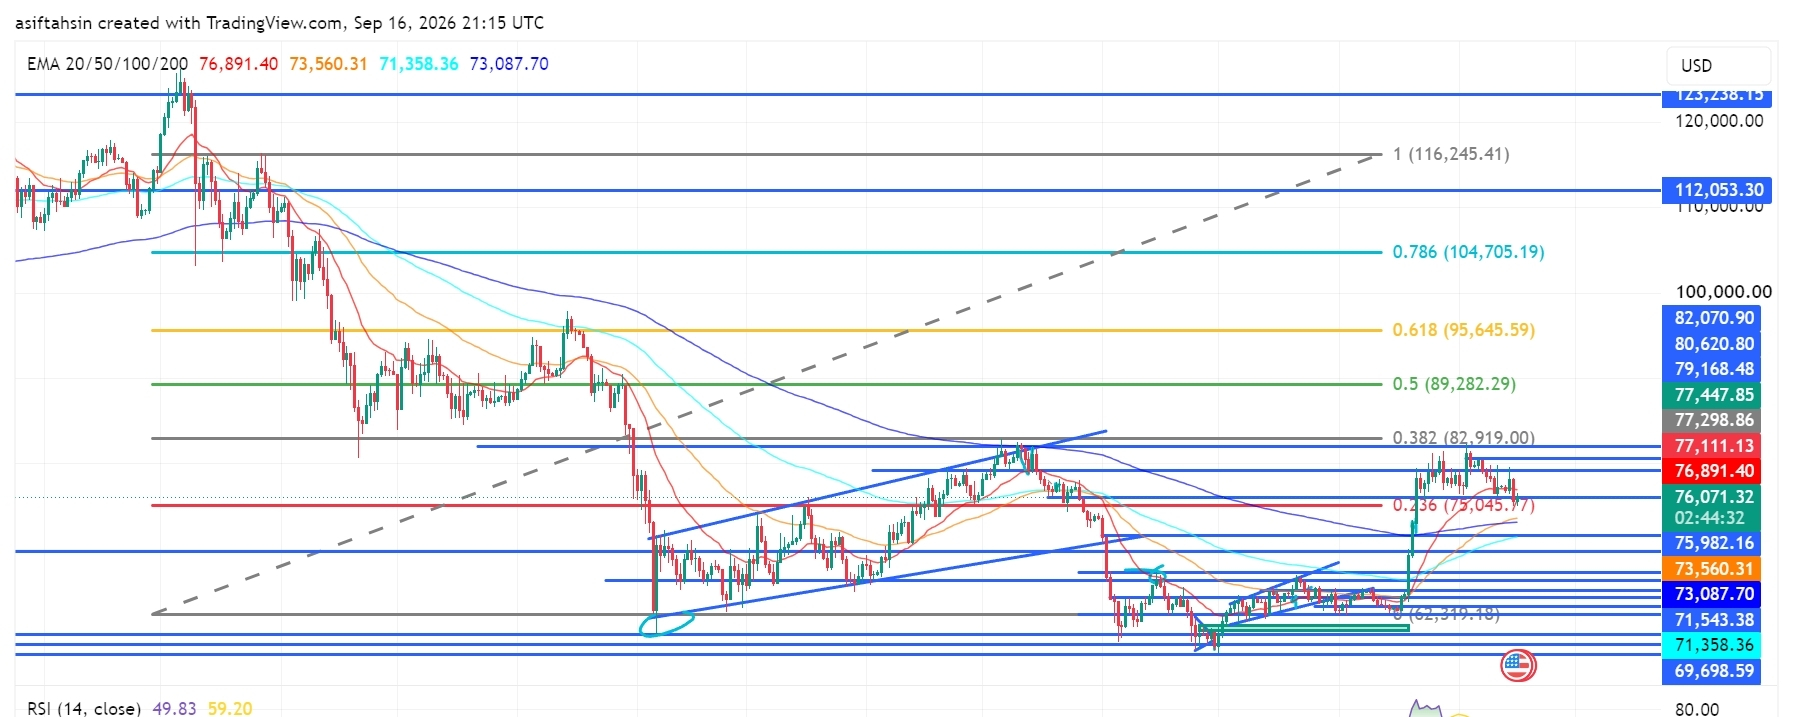
Технический обзор BTC: Биткоин консолидируется ниже $77K, пока быки защищают восстановлениеБиткоин торгуется около $76,9K, консолидируясь после недавнего восстановления от зоны спроса $69K–$71K. Цена остается выше ключевой зоны поддержки $75K, но импульс ослаб, поскольку BTC с трудом удерживается ниже диапазона сопротивления $77,1K–$82,9K. Следующий пробой или нисходящий пробой должен определить краткосрочное направление.
📈 Структура EMA
20 EMA: $76,891
50 EMA: $73,560
100 EMA: $71,358
200 EMA: $73,088
Сейчас BTC находится примерно на уровне 20 EMA, при этом 50/100/200 EMA остаются ниже цены. Удержание выше $75K сохраняет более широкую восстановительную структуру, но потеря 20 EMA может привести к более глубокому повторному тестированию.
Технический обзор BTC: Биткоин консолидируется ниже $77K, пока быки защищают восстановление
Биткоин торгуется около $76,9K, консолидируясь после недавнего восстановления от зоны спроса $69K–$71K. Цена остается выше ключевой зоны поддержки $75K, но импульс ослаб, поскольку BTC с трудом удерживается ниже диапазона сопротивления $77,1K–$82,9K. Следующий пробой или нисходящий пробой должен определить краткосрочное направление.
📈 Структура EMA
20 EMA: $76,891
50 EMA: $73,560
100 EMA: $71,358
200 EMA: $73,088
Сейчас BTC находится примерно на уровне 20 EMA, при этом 50/100/200 EMA остаются ниже цены. Удержание выше $75K сохраняет более широкую восстановительную структуру, но потеря 20 EMA может привести к более глубокому повторному тестированию.
📈 Структура EMA
20 EMA: $76,891
50 EMA: $73,560
100 EMA: $71,358
200 EMA: $73,088
Сейчас BTC находится примерно на уровне 20 EMA, при этом 50/100/200 EMA остаются ниже цены. Удержание выше $75K сохраняет более широкую восстановительную структуру, но потеря 20 EMA может привести к более глубокому повторному тестированию.
61
·
--
Статья
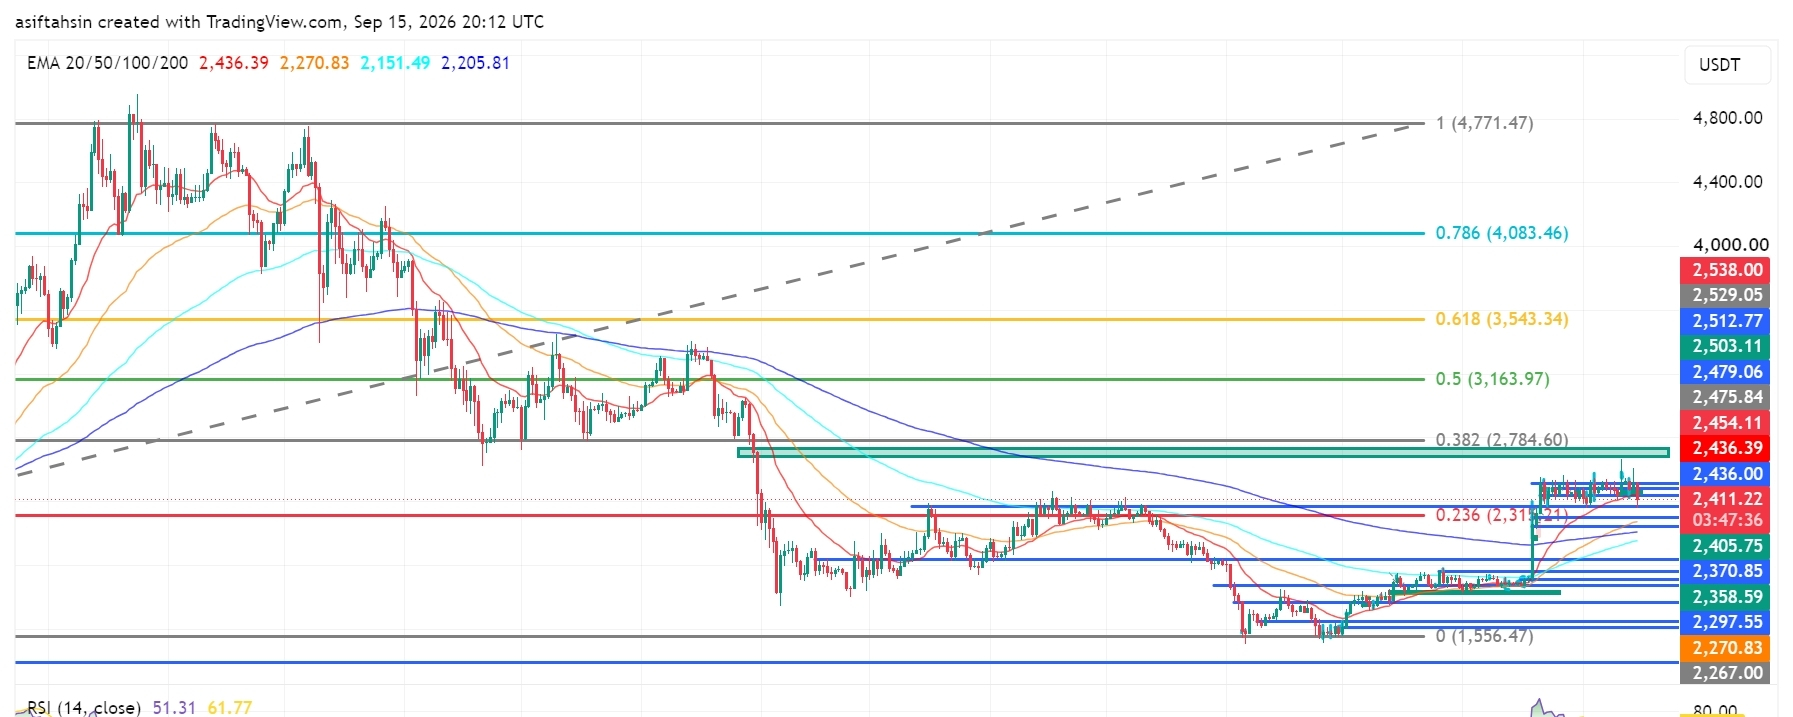
Технический обзор SOL: Solana удерживается около $100, пока быки защищают пробойВ настоящее время SOL торгуется около $99.6, удерживаясь рядом с зоной пробоя $99–$100 после недавнего бычьего расширения от зоны спроса $92–$94.
Более широкая структура восстановления сохраняет конструктивный настрой, но SOL теперь консолидируется ниже кластера сопротивления $100.59–$104.64. Быкам нужно вернуть этот уровень и пробить зону $107.07–$109.91, чтобы запустить следующее крупное расширение вверх.
📈 Структура EMA
20 EMA: $99.62
50 EMA: $92.58
100 EMA: $87.71
200 EMA: $91.88
Сейчас SOL тестирует 20 EMA на $99.62.
Технический обзор SOL: Solana удерживается около $100, пока быки защищают пробой
В настоящее время SOL торгуется около $99.6, удерживаясь рядом с зоной пробоя $99–$100 после недавнего бычьего расширения от зоны спроса $92–$94.
Более широкая структура восстановления сохраняет конструктивный настрой, но SOL теперь консолидируется ниже кластера сопротивления $100.59–$104.64. Быкам нужно вернуть этот уровень и пробить зону $107.07–$109.91, чтобы запустить следующее крупное расширение вверх.
📈 Структура EMA
20 EMA: $99.62
50 EMA: $92.58
100 EMA: $87.71
200 EMA: $91.88
Сейчас SOL тестирует 20 EMA на $99.62.
Более широкая структура восстановления сохраняет конструктивный настрой, но SOL теперь консолидируется ниже кластера сопротивления $100.59–$104.64. Быкам нужно вернуть этот уровень и пробить зону $107.07–$109.91, чтобы запустить следующее крупное расширение вверх.
📈 Структура EMA
20 EMA: $99.62
50 EMA: $92.58
100 EMA: $87.71
200 EMA: $91.88
Сейчас SOL тестирует 20 EMA на $99.62.
62
·
--
Статья
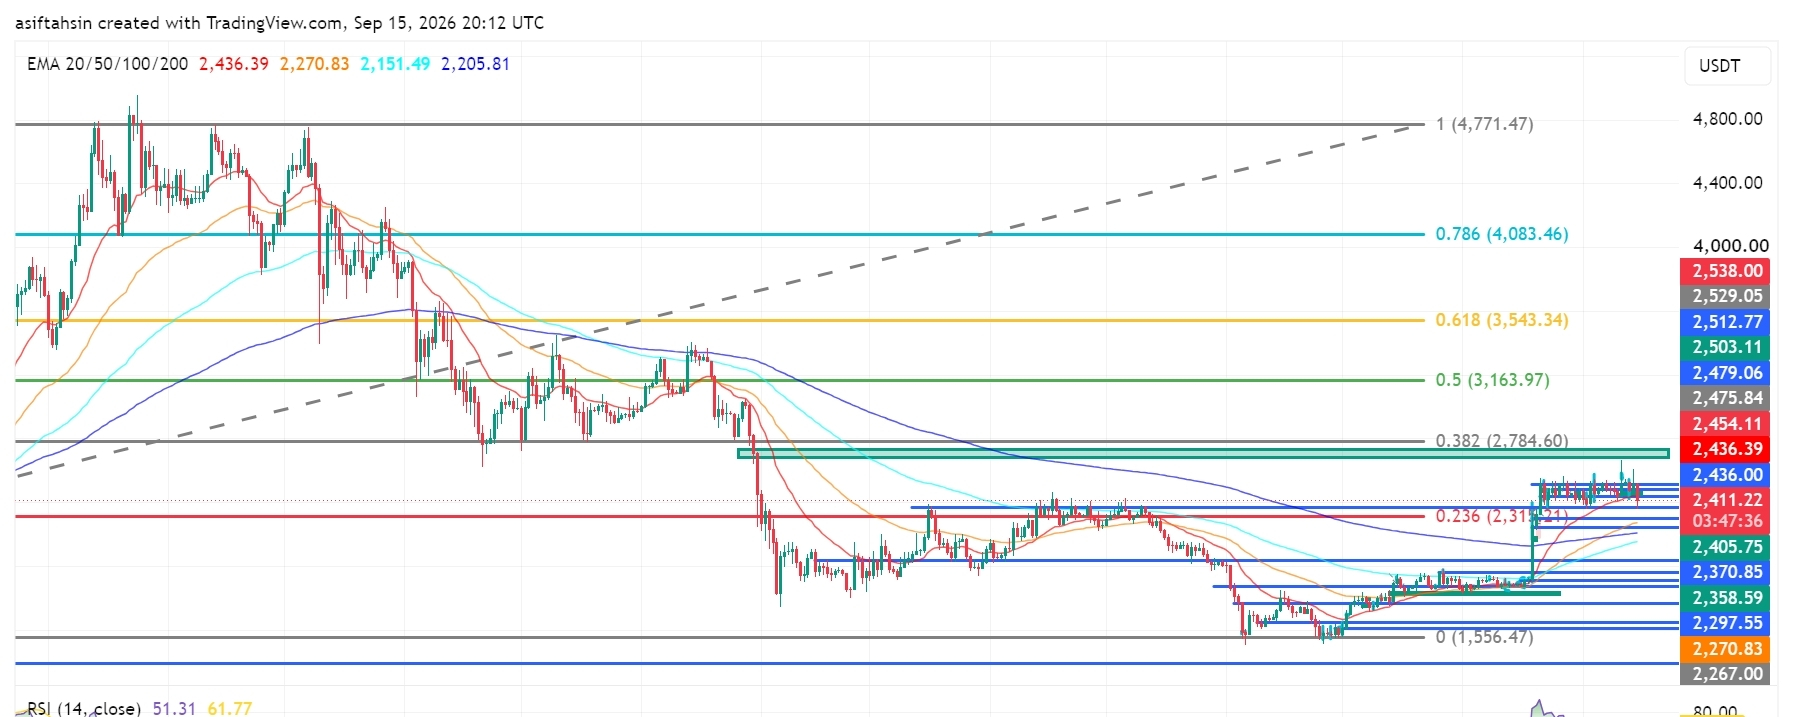
Технический обзор по ETH: Ethereum удерживает $2.4K, пока быки защищают восстановлениеВ настоящее время ETH торгуется около $2.41K, удерживаясь выше зоны поддержки $2.40K–$2.41K после недавнего восстановления от зоны спроса $2.27K–$2.30K.
Более широкая структура восстановления остается позитивной, но сейчас ETH консолидируется ниже кластера сопротивления $2.436K–$2.454K. Бычьим силам нужно вернуть этот уровень и пробить $2,538 для следующего крупного расширения вверх.
📈 Структура EMA
20 EMA: $2,436.39
50 EMA: $2,270.83
100 EMA: $2,151.49
200 EMA: $2,205.81
ETH по-прежнему находится выше 50-, 100- и 200 EMA.
20 EMA на уровне $2,436.39 сейчас является ключевым краткосрочным уровнем сопротивления. Устойчивый возврат выше этого уровня укрепит бычью структуру восстановления.
Технический обзор по ETH: Ethereum удерживает $2.4K, пока быки защищают восстановление
В настоящее время ETH торгуется около $2.41K, удерживаясь выше зоны поддержки $2.40K–$2.41K после недавнего восстановления от зоны спроса $2.27K–$2.30K.
Более широкая структура восстановления остается позитивной, но сейчас ETH консолидируется ниже кластера сопротивления $2.436K–$2.454K. Бычьим силам нужно вернуть этот уровень и пробить $2,538 для следующего крупного расширения вверх.
📈 Структура EMA
20 EMA: $2,436.39
50 EMA: $2,270.83
100 EMA: $2,151.49
200 EMA: $2,205.81
ETH по-прежнему находится выше 50-, 100- и 200 EMA.
20 EMA на уровне $2,436.39 сейчас является ключевым краткосрочным уровнем сопротивления. Устойчивый возврат выше этого уровня укрепит бычью структуру восстановления.
Более широкая структура восстановления остается позитивной, но сейчас ETH консолидируется ниже кластера сопротивления $2.436K–$2.454K. Бычьим силам нужно вернуть этот уровень и пробить $2,538 для следующего крупного расширения вверх.
📈 Структура EMA
20 EMA: $2,436.39
50 EMA: $2,270.83
100 EMA: $2,151.49
200 EMA: $2,205.81
ETH по-прежнему находится выше 50-, 100- и 200 EMA.
20 EMA на уровне $2,436.39 сейчас является ключевым краткосрочным уровнем сопротивления. Устойчивый возврат выше этого уровня укрепит бычью структуру восстановления.
63
·
--
Статья
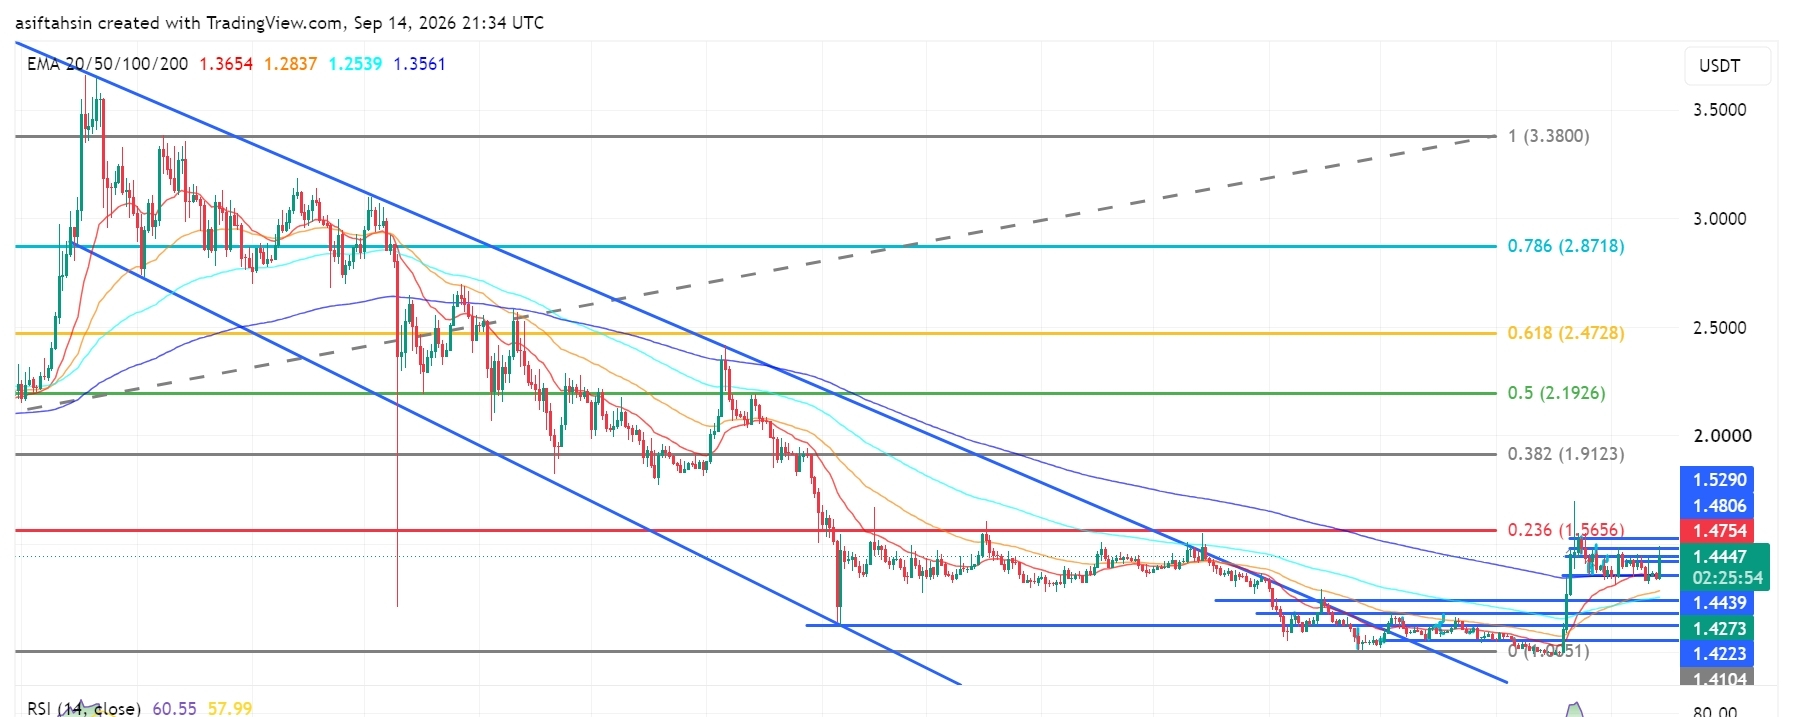
Технический прогноз по XRP: XRP удерживается выше $1.40, быки нацелены на $1.56XRP в настоящее время торгуется около $1.44, консолидируясь выше важного психологического уровня $1.40 после сильного восстановления от минимумов июня—июля.
Более широкий структура значительно улучшилась: теперь XRP торгуется выше всех четырех основных EMA. Однако цена приближается к ключевому кластеру сопротивления в районе $1.475–$1.53. Бычьим силам нужен чистый пробой выше этой зоны, чтобы открыть путь к сопротивлению Фибоначчи $1.5656.
📈 Структура EMA
20 EMA: $1.3653
50 EMA: $1.2837
100 EMA: $1.2539
200 EMA: $1.3561
Технический прогноз по XRP: XRP удерживается выше $1.40, быки нацелены на $1.56
XRP в настоящее время торгуется около $1.44, консолидируясь выше важного психологического уровня $1.40 после сильного восстановления от минимумов июня—июля.
Более широкий структура значительно улучшилась: теперь XRP торгуется выше всех четырех основных EMA. Однако цена приближается к ключевому кластеру сопротивления в районе $1.475–$1.53. Бычьим силам нужен чистый пробой выше этой зоны, чтобы открыть путь к сопротивлению Фибоначчи $1.5656.
📈 Структура EMA
20 EMA: $1.3653
50 EMA: $1.2837
100 EMA: $1.2539
200 EMA: $1.3561
Более широкий структура значительно улучшилась: теперь XRP торгуется выше всех четырех основных EMA. Однако цена приближается к ключевому кластеру сопротивления в районе $1.475–$1.53. Бычьим силам нужен чистый пробой выше этой зоны, чтобы открыть путь к сопротивлению Фибоначчи $1.5656.
📈 Структура EMA
20 EMA: $1.3653
50 EMA: $1.2837
100 EMA: $1.2539
200 EMA: $1.3561
2
1
1.2k
·
--
Статья
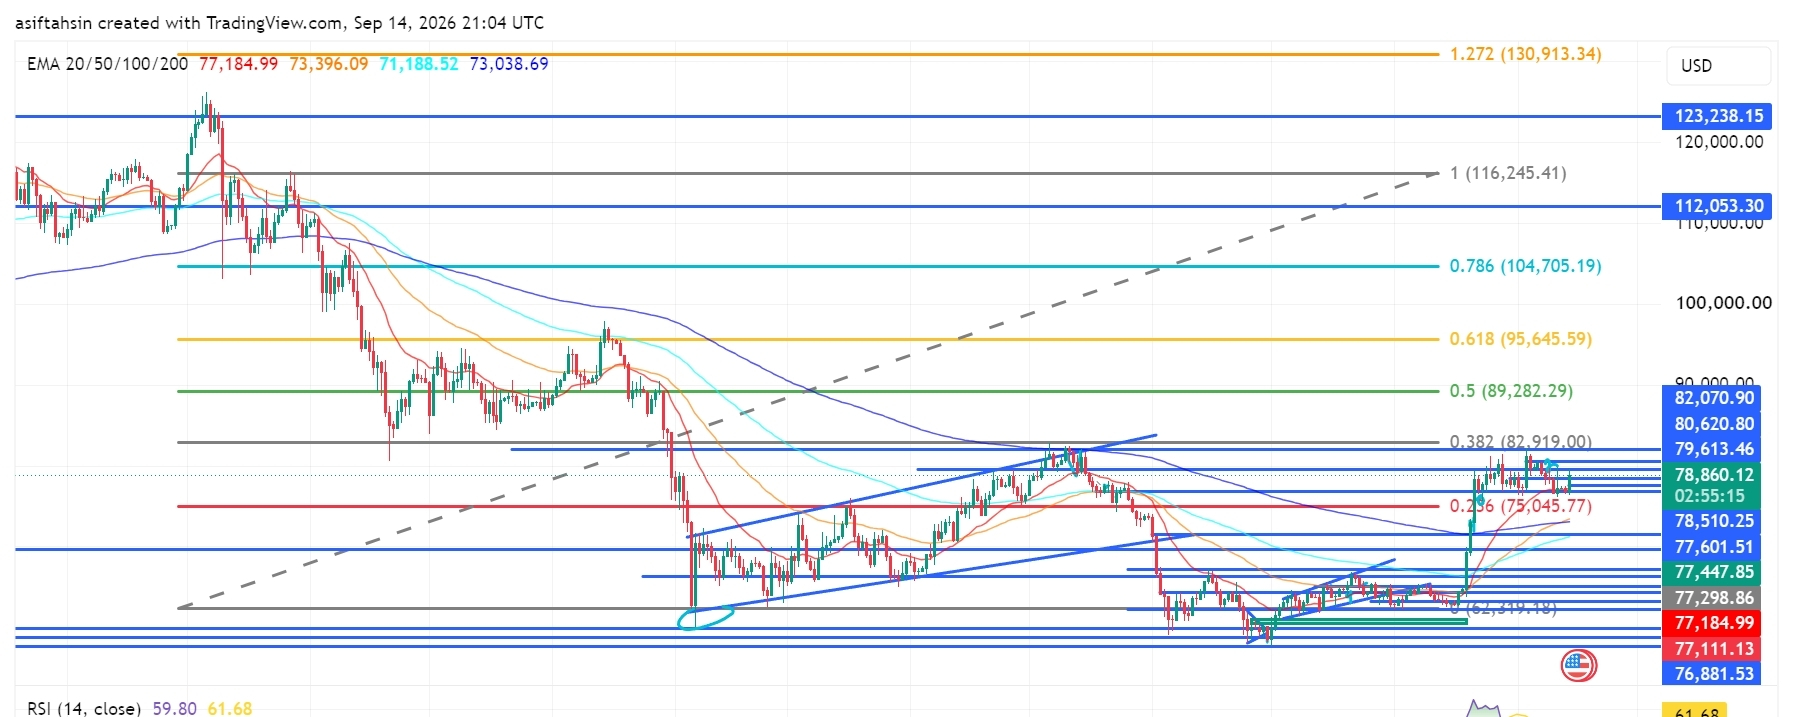
Технический обзор Bitcoin (BTC): BTC удерживает $78K, а быки нацелены на сопротивление $80K–$83KСейчас BTC торгуется примерно на $78,860, консолидируясь выше уровня $78K после сильного восстановления с июньских минимумов.
Более широкая структура остается конструктивной: BTC торгуется выше всех четырех ключевых EMA. Однако цена сейчас приближается к значительному кластеру сопротивления в районе $79,613–$82,070. Быкам нужно четкое пробитие выше этой зоны, чтобы открыть путь к сопротивлению по Фибоначчи $82,919 и, возможно, к более высоким уровням.
📈 Структура EMA
20 EMA: $77,182.98
50 EMA: $73,395.26
100 EMA: $71,188.10
Технический обзор Bitcoin (BTC): BTC удерживает $78K, а быки нацелены на сопротивление $80K–$83K
Сейчас BTC торгуется примерно на $78,860, консолидируясь выше уровня $78K после сильного восстановления с июньских минимумов.
Более широкая структура остается конструктивной: BTC торгуется выше всех четырех ключевых EMA. Однако цена сейчас приближается к значительному кластеру сопротивления в районе $79,613–$82,070. Быкам нужно четкое пробитие выше этой зоны, чтобы открыть путь к сопротивлению по Фибоначчи $82,919 и, возможно, к более высоким уровням.
📈 Структура EMA
20 EMA: $77,182.98
50 EMA: $73,395.26
100 EMA: $71,188.10
Более широкая структура остается конструктивной: BTC торгуется выше всех четырех ключевых EMA. Однако цена сейчас приближается к значительному кластеру сопротивления в районе $79,613–$82,070. Быкам нужно четкое пробитие выше этой зоны, чтобы открыть путь к сопротивлению по Фибоначчи $82,919 и, возможно, к более высоким уровням.
📈 Структура EMA
20 EMA: $77,182.98
50 EMA: $73,395.26
100 EMA: $71,188.10
69
·
--
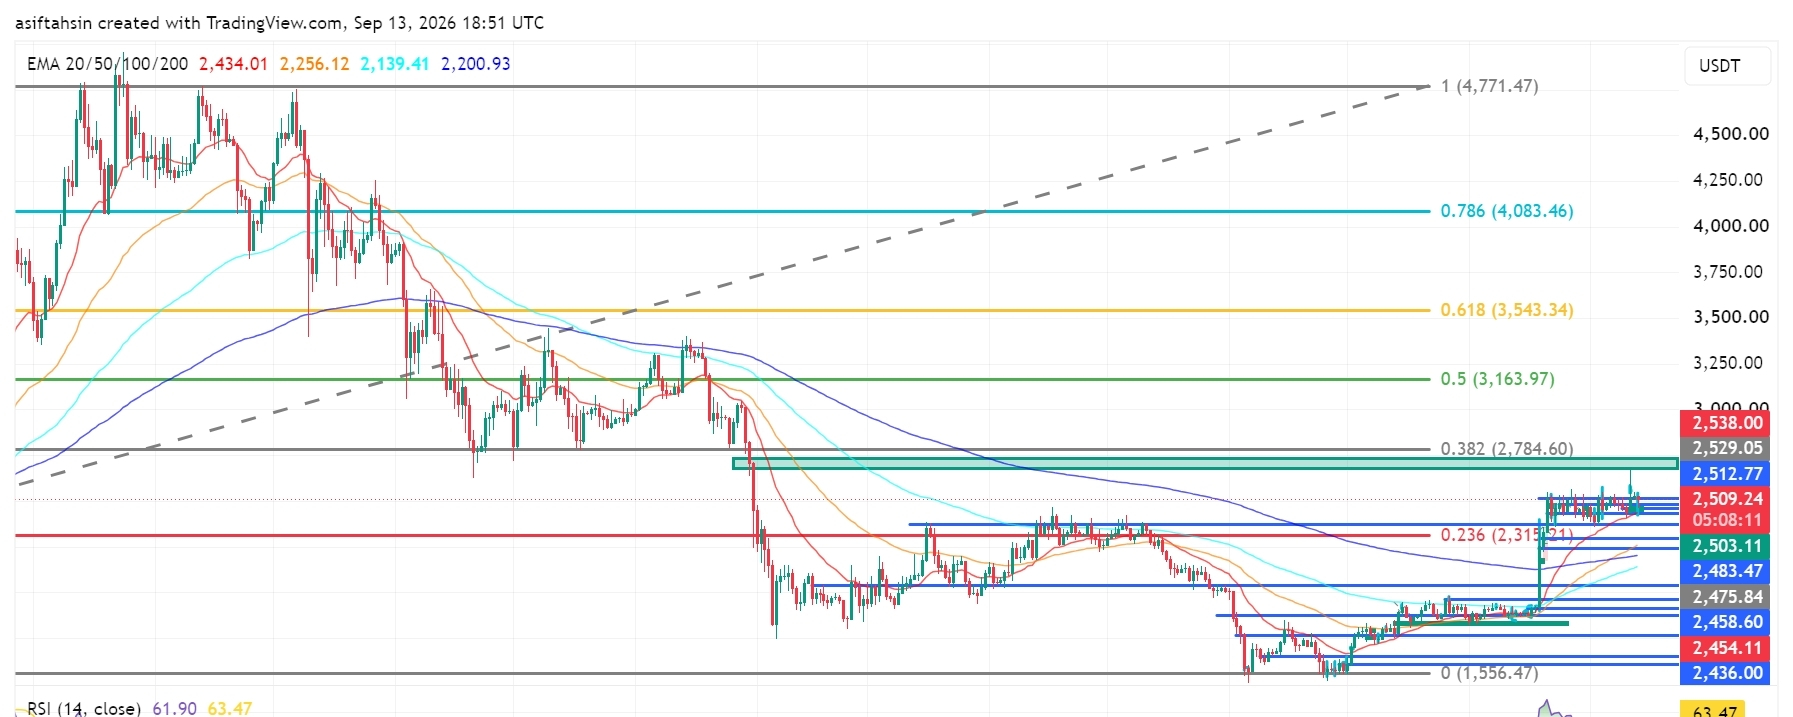
Статья
Технический обзор Solana (SOL): SOL удерживается выше $100, а быки нацелены на более высокие уровни сопротивленияСейчас SOL торгуется около $101.25, консолидируясь выше психологического уровня $100 после сильного восстановления от минимумов июня.
Более широкая структура показывает признаки улучшения: теперь SOL торгуется выше всех четырех основных EMA. Однако цена сталкивается со значительным кластером сопротивления в районе $102.29–$104.64. Бычьим силам нужен уверенный пробой выше этой зоны, чтобы открыть путь к области $107–$109 и сопротивлению по Фибоначчи на уровне $129.49.
📈 Структура EMA
20 EMA: $99.76
50 EMA: $92.04
100 EMA: $87.25
Технический обзор Solana (SOL): SOL удерживается выше $100, а быки нацелены на более высокие уровни сопротивления
Сейчас SOL торгуется около $101.25, консолидируясь выше психологического уровня $100 после сильного восстановления от минимумов июня.
Более широкая структура показывает признаки улучшения: теперь SOL торгуется выше всех четырех основных EMA. Однако цена сталкивается со значительным кластером сопротивления в районе $102.29–$104.64. Бычьим силам нужен уверенный пробой выше этой зоны, чтобы открыть путь к области $107–$109 и сопротивлению по Фибоначчи на уровне $129.49.
📈 Структура EMA
20 EMA: $99.76
50 EMA: $92.04
100 EMA: $87.25
Более широкая структура показывает признаки улучшения: теперь SOL торгуется выше всех четырех основных EMA. Однако цена сталкивается со значительным кластером сопротивления в районе $102.29–$104.64. Бычьим силам нужен уверенный пробой выше этой зоны, чтобы открыть путь к области $107–$109 и сопротивлению по Фибоначчи на уровне $129.49.
📈 Структура EMA
20 EMA: $99.76
50 EMA: $92.04
100 EMA: $87.25
61
·
--
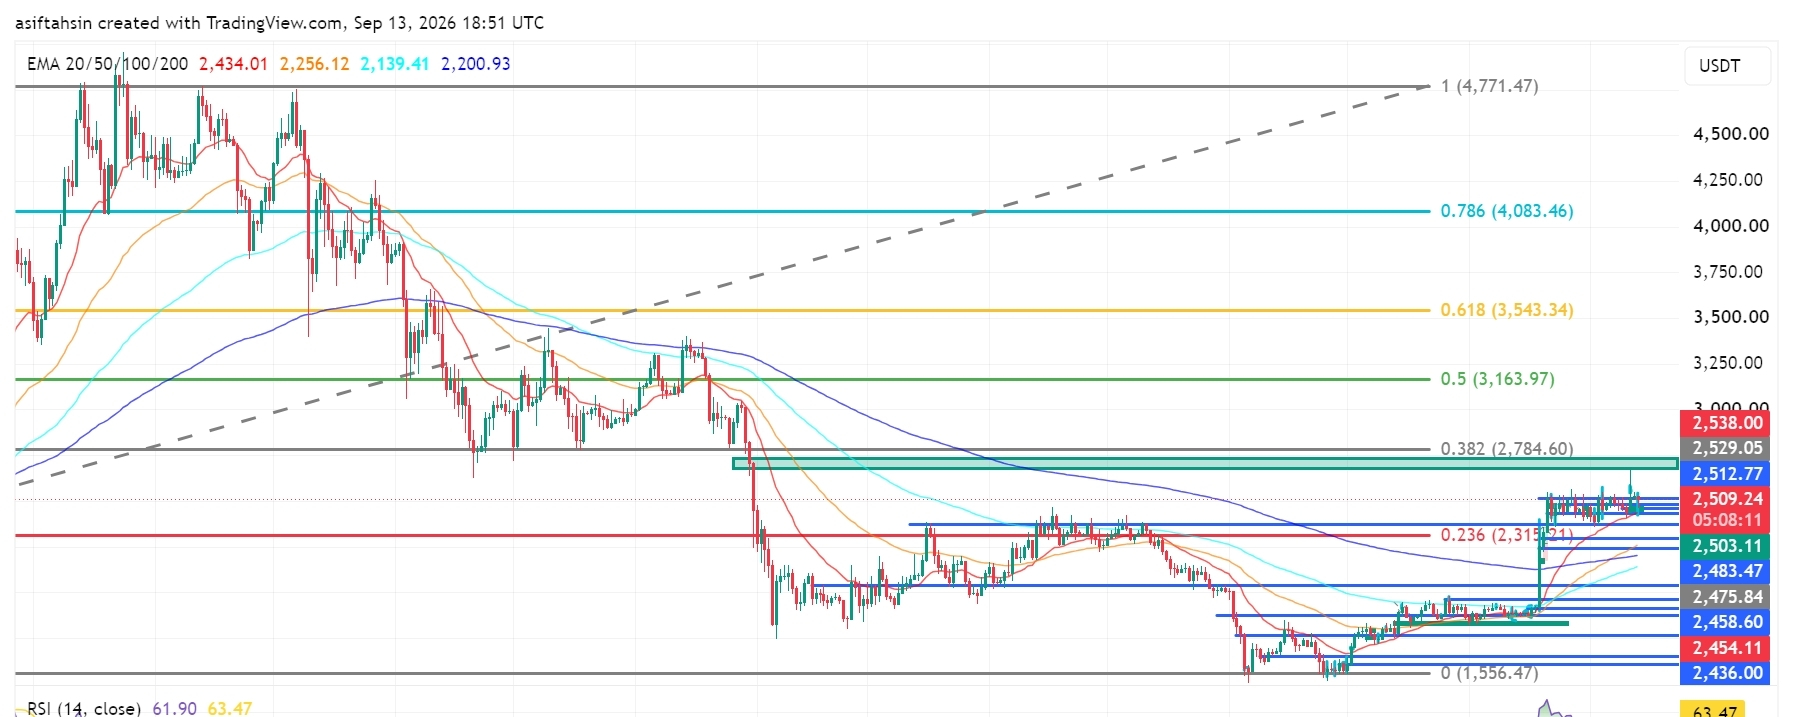
Статья
Технический прогноз по ETH: Ethereum удерживает уровень $2.5K, а быки нацелены на более высокое сопротивлениеВ настоящее время ETH торгуется около $2,509, консолидируясь выше психологического уровня $2,500 после сильного восстановления от минимумов июня.
В целом структура остается позитивной: ETH торгуется значительно выше всех четырех ключевых EMA. Однако сейчас цена приближается к заметному кластеру сопротивлений в районе $2,512–$2,538. Быкам нужно уверенное пробитие выше этой зоны, чтобы открыть путь к сопротивлению Фибоначчи на уровне $2,784.
📈 Структура EMA
20 EMA: $2,434.01
50 EMA: $2,256.12
100 EMA: $2,139.41
200 EMA: $2,200.93
Технический прогноз по ETH: Ethereum удерживает уровень $2.5K, а быки нацелены на более высокое сопротивление
В настоящее время ETH торгуется около $2,509, консолидируясь выше психологического уровня $2,500 после сильного восстановления от минимумов июня.
В целом структура остается позитивной: ETH торгуется значительно выше всех четырех ключевых EMA. Однако сейчас цена приближается к заметному кластеру сопротивлений в районе $2,512–$2,538. Быкам нужно уверенное пробитие выше этой зоны, чтобы открыть путь к сопротивлению Фибоначчи на уровне $2,784.
📈 Структура EMA
20 EMA: $2,434.01
50 EMA: $2,256.12
100 EMA: $2,139.41
200 EMA: $2,200.93
В целом структура остается позитивной: ETH торгуется значительно выше всех четырех ключевых EMA. Однако сейчас цена приближается к заметному кластеру сопротивлений в районе $2,512–$2,538. Быкам нужно уверенное пробитие выше этой зоны, чтобы открыть путь к сопротивлению Фибоначчи на уровне $2,784.
📈 Структура EMA
20 EMA: $2,434.01
50 EMA: $2,256.12
100 EMA: $2,139.41
200 EMA: $2,200.93
83
·
--
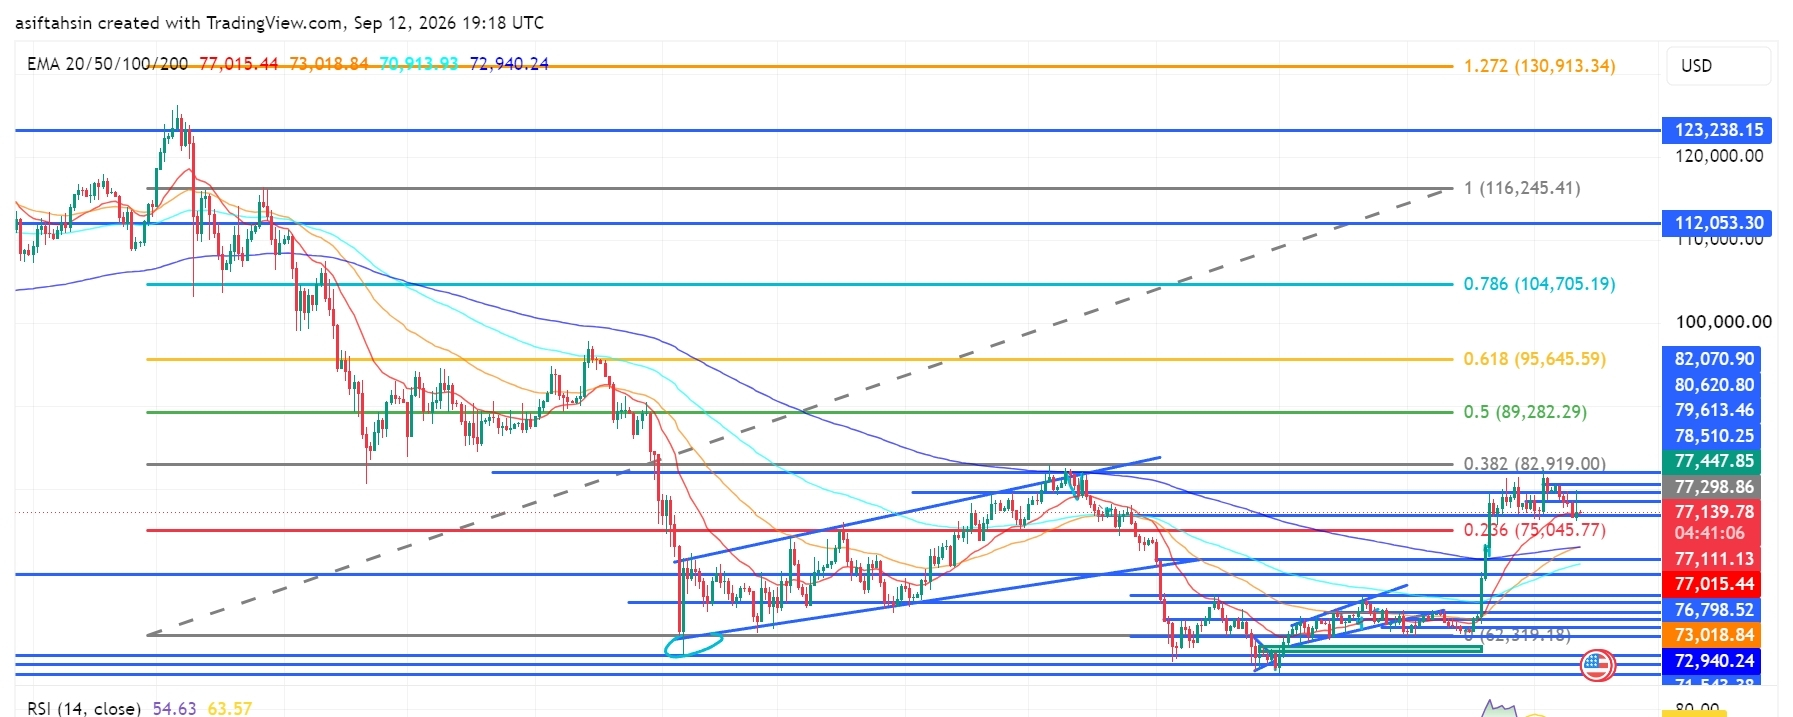
Статья
Технический обзор BTC: Биткоин удерживает уровень выше $77K, поскольку быки защищают пробойСейчас BTC торгуется примерно по $77,1K, консолидируясь выше зоны пробоя $75K–$77K после недавнего бычьего восстановления.
Более широкая структура остается конструктивной, но BTC сталкивается с сильным сопротивлением в районе $77,4K–$82,9K. Быкам нужно вернуть этот кластер сопротивления и пробить уровень Фибоначчи $82,919, чтобы открыть следующее крупное расширение вверх.
📈 Структура EMA
20 EMA: $77,015.44
50 EMA: $73,018.84
100 EMA: $70,913.93
200 EMA: $72,940.24
Сейчас BTC удерживается чуть выше 20 EMA, при этом оставаясь выше 50, 100 и 200 EMA.
Технический обзор BTC: Биткоин удерживает уровень выше $77K, поскольку быки защищают пробой
Сейчас BTC торгуется примерно по $77,1K, консолидируясь выше зоны пробоя $75K–$77K после недавнего бычьего восстановления.
Более широкая структура остается конструктивной, но BTC сталкивается с сильным сопротивлением в районе $77,4K–$82,9K. Быкам нужно вернуть этот кластер сопротивления и пробить уровень Фибоначчи $82,919, чтобы открыть следующее крупное расширение вверх.
📈 Структура EMA
20 EMA: $77,015.44
50 EMA: $73,018.84
100 EMA: $70,913.93
200 EMA: $72,940.24
Сейчас BTC удерживается чуть выше 20 EMA, при этом оставаясь выше 50, 100 и 200 EMA.
Более широкая структура остается конструктивной, но BTC сталкивается с сильным сопротивлением в районе $77,4K–$82,9K. Быкам нужно вернуть этот кластер сопротивления и пробить уровень Фибоначчи $82,919, чтобы открыть следующее крупное расширение вверх.
📈 Структура EMA
20 EMA: $77,015.44
50 EMA: $73,018.84
100 EMA: $70,913.93
200 EMA: $72,940.24
Сейчас BTC удерживается чуть выше 20 EMA, при этом оставаясь выше 50, 100 и 200 EMA.
37
Войдите, чтобы посмотреть больше материала
Присоединяйтесь к пользователям криптовалют по всему миру на Binance Square
⚡️ Получайте новейшую и полезную информацию о криптоактивах.
💬 Нам доверяет крупнейшая в мире криптобиржа.
👍 Получите достоверные аналитические данные от верифицированных создателей контента.
Эл. почта/номер телефона
В тренде
AIStocksWhatNext
Просмотров: 97,871
1,254 обсуждают
Поделись и выиграй награду за трафик в нашей кампании с трендовым хэштегом
✨Тема: Какие ещё инвестиционные возможности остаются, пока акции ИИ продолжают расти?
👉Как принять участие:
Опубликуйте короткий пост или статью с хэштегом #AIStocksWhatNext
Расскажите, вы бычьей или медвежьей позиции придерживаетесь, и опубликуйте свои холдинги или сделки по акциям ИИ — использование виджета для трейда может повысить вашу соответствие требованиям.
Вы также можете усилить пост, поделившись данными или графиками, и избегая изображений, сгенерированных ИИ.
✍️Создайте контент, опираясь на приведённые ниже ракурсы:
- Nvidia говорит, что продажи чипов удвоятся в следующем году, а ведущие компании в сфере ИИ продолжают бить рекорды по выручке — затраты на вычисления за этим стоят просто колоссальные. Спрос на ИИ действительно растёт? И как долго это может продолжаться? Акции ИИ растут по всему рынку. Это реальный прорыв или просто краткосрочный отскок?
- Лидеры отрасли призывают замедлить развитие ИИ, а Трамп планирует создать «AI Force» («ИИ-Силу»), утверждая, что ИИ может составить 25% ВВП США в будущем. На чьей вы стороне? Будет ли поддержка на уровне штатов долгосрочной победой для акций ИИ?
- Покупаете ли вы акции ИИ? Поделитесь своей сделкой/холдингами по темам ИИ с помощью нашего виджета для обмена трейдами.
⏰Период кампании:
- 2026-09-22 7:00 - 2026-09-24 4:00 UTC
🎁Награда:
- Квалифицированные посты, которые соответствуют указанным выше правилам и содержат более 100 слов, будут рассмотрены и могут получить случайный бонус к трафику в размере 500–3 000 просмотров. Если ваш пост будет выбран, вы получите уведомление от вашего секретаря ленты.
- Получите шанс, чтобы вашу статью разместили на Binance Square Official
Нужны идеи для поста? Перейдите на страницу темы #AIStocksWhatNext или Square Guide on How to Post for Better Reach.
Binance Square Official
·Лайков: 203
·Просмотров: 324.4k
fomcотслеживание
Просмотров: 38,678
322 обсуждают
ПротоколFOMC
Просмотров: 27,901
112 обсуждают