
CryptoOG 1
408 Публикации

CryptoOG 1
Отправить жалобу
Заблокировать пользователя
Crypto Expert 📈 || Web3 Alpha 📊 || Moderator 🖥
0 подписок(и/а)
2 подписчиков(а)
18 понравилось
Посты
·
--
См. перевод
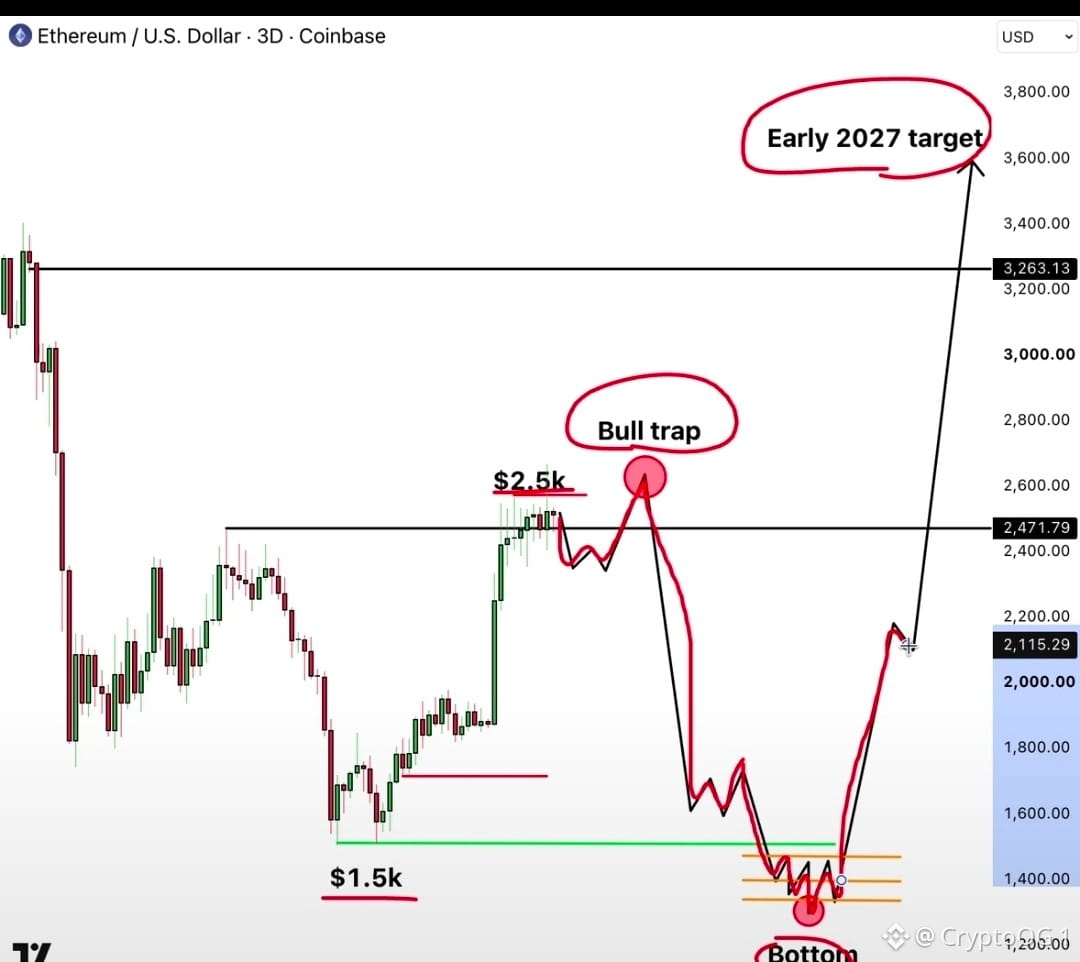
My $ETH roadmap for 2026-2027: 1. Final bull trap around $2,670 2. Drop to $1,800 then $1,500 3. Bottom forms, accumulation begins 4. Break above $1,600 confirms bull run 5. Rally above $3,250 by Q2-Q3 2027 Bottom expected November-December 2026 Turn notifications on next call is loading
My $ETH roadmap for 2026-2027: 1. Final bull trap around $2,670 2. Drop to $1,800 then $1,500 3. Bottom forms, accumulation begins 4. Break above $1,600 confirms bull run 5. Rally above $3,250 by Q2-Q3 2027 Bottom expected November-December 2026 Turn notifications on next call is loading
59
·
--
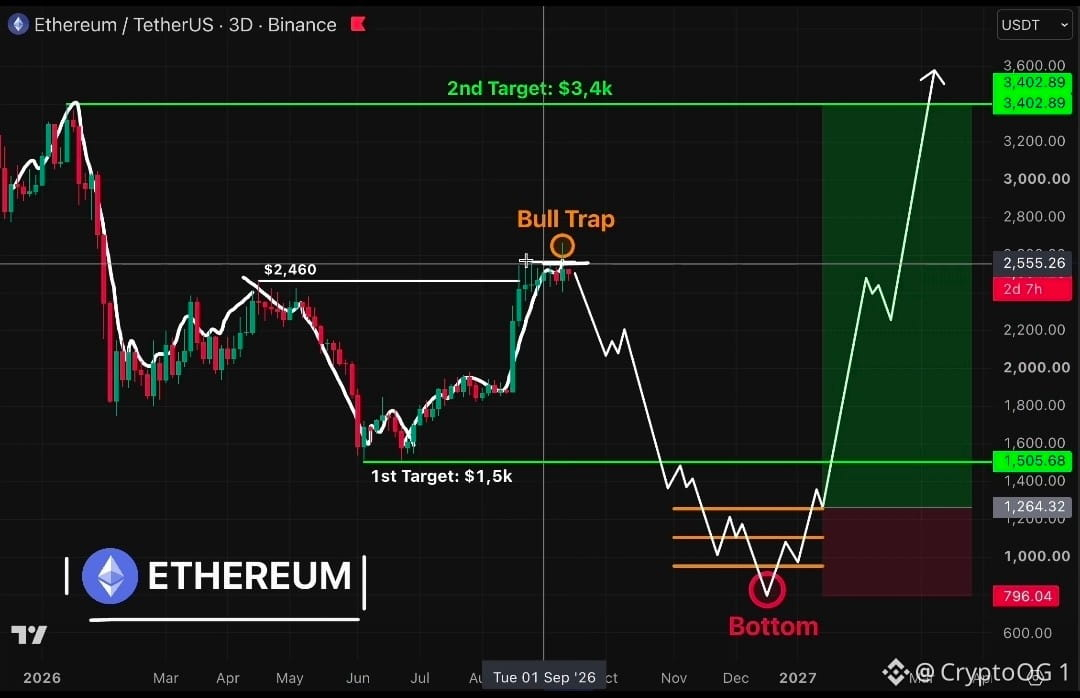
🚨 ФИНАЛЬНАЯ БЫЧЬЯ ЛОВУШКА ПО $ETH ГОТОВА Все кричат про Бычий раунд после пробоя $2,660 Я вижу, как в этой зоне формируется ловушка... Следующий шаг может полностью стереть месяцы прибыли Вот мой план по рынку: $2,670 → финальная бычья ловушка ✅ $1,800 → первый крупный слив $1,500 → зона капитуляции Ноябрь–Декабрь → дно цикла Возврат к $1,600 → начинается бычий раунд $3,250+ → цель на Q2–Q3 2027 Многие совершают ошибку, покупая самый первый слив Я подожду последнего движения, прежде чем сформируется дно, а потом начну покупать... И когда я начну покупать ETH, я выложу это здесь ДО того, как восстановление станет очевидным Включите уведомления & сохраните этот пост в закладки... Вы точно не хотите пропустить мой следующий сигнал, когда движение уже будет отыграно
🚨 ФИНАЛЬНАЯ БЫЧЬЯ ЛОВУШКА ПО $ETH ГОТОВА Все кричат про Бычий раунд после пробоя $2,660 Я вижу, как в этой зоне формируется ловушка... Следующий шаг может полностью стереть месяцы прибыли Вот мой план по рынку: $2,670 → финальная бычья ловушка ✅ $1,800 → первый крупный слив $1,500 → зона капитуляции Ноябрь–Декабрь → дно цикла Возврат к $1,600 → начинается бычий раунд $3,250+ → цель на Q2–Q3 2027 Многие совершают ошибку, покупая самый первый слив Я подожду последнего движения, прежде чем сформируется дно, а потом начну покупать... И когда я начну покупать ETH, я выложу это здесь ДО того, как восстановление станет очевидным Включите уведомления & сохраните этот пост в закладки... Вы точно не хотите пропустить мой следующий сигнал, когда движение уже будет отыграно
37
·
--
См. перевод
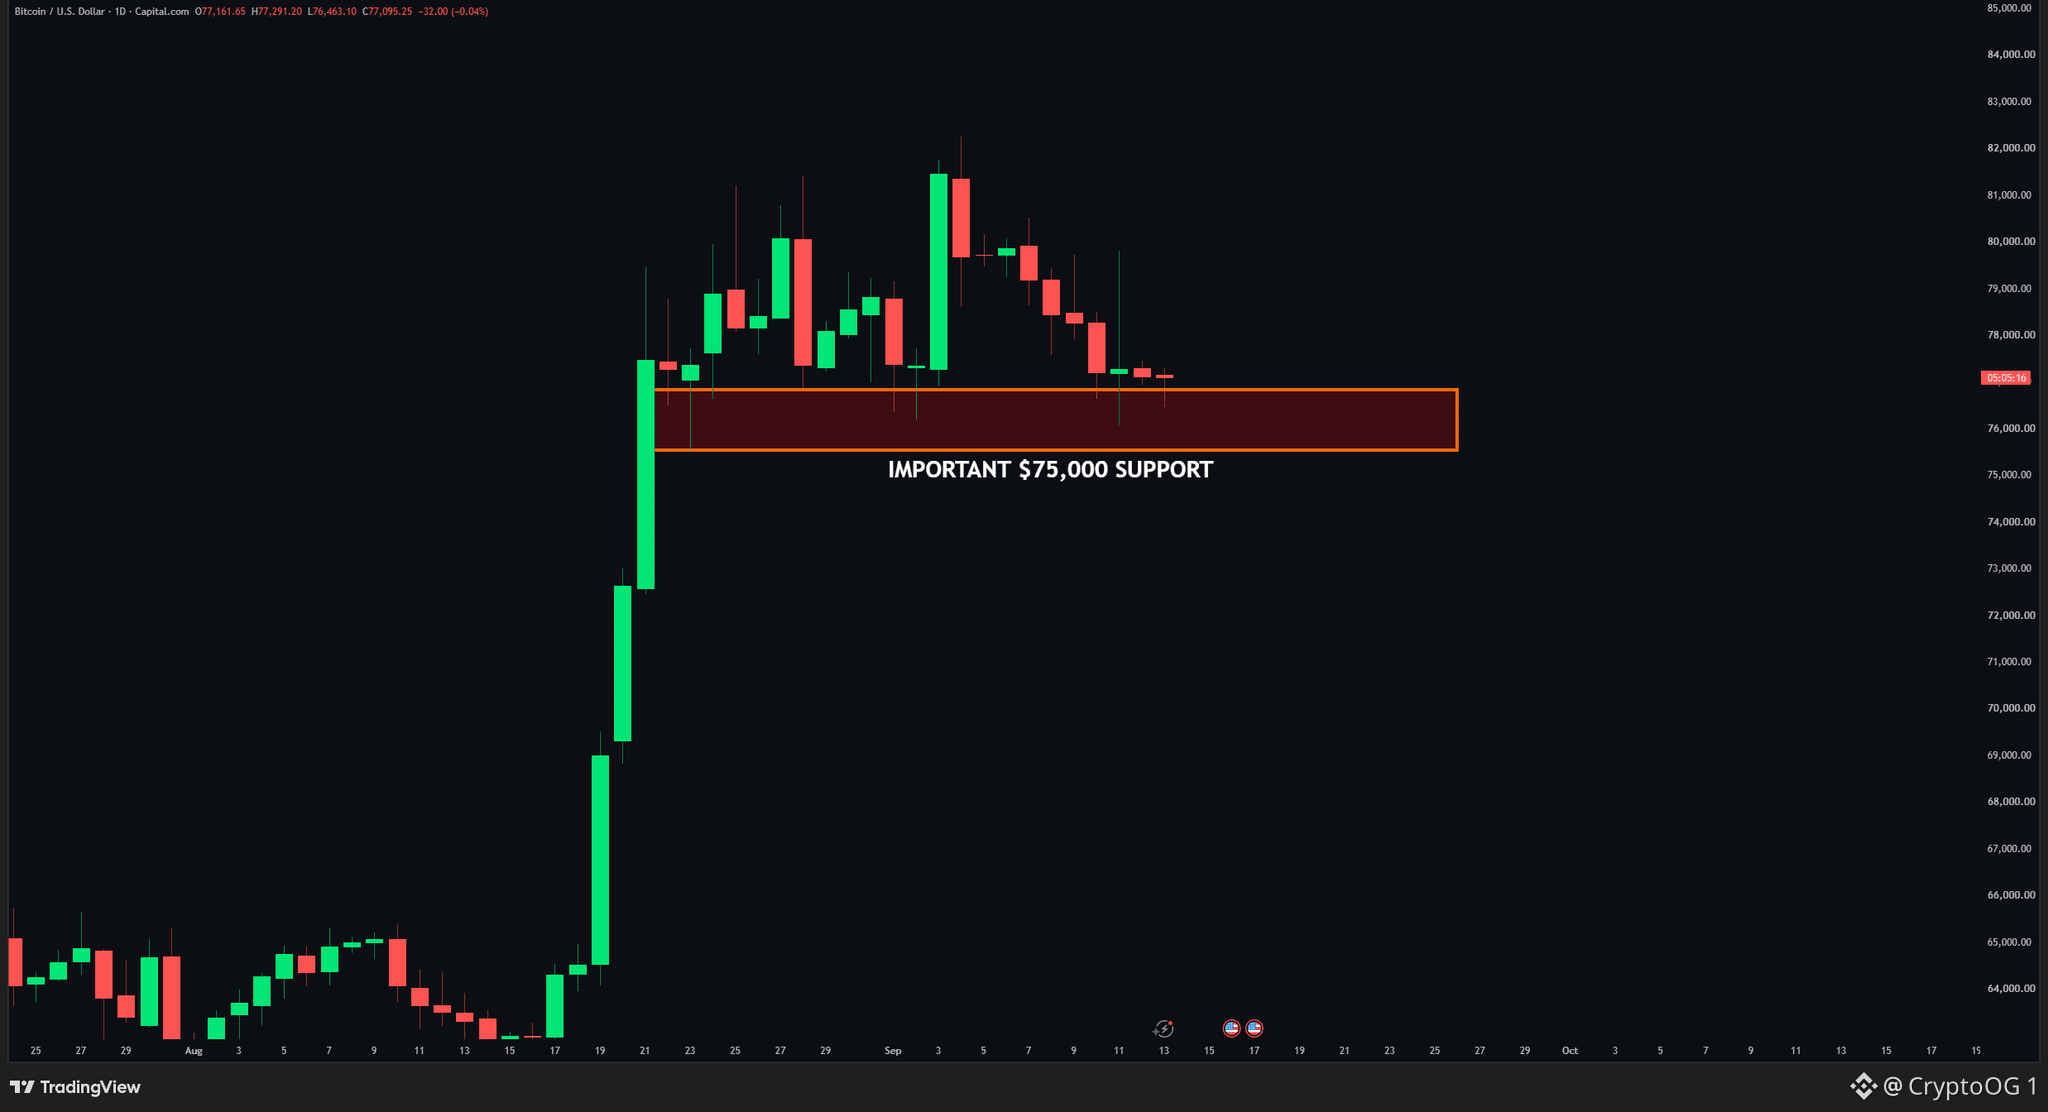
$BTC IS APPROACHING THE $75K DECISION ZONE. 👀 After the strong breakout, BTC has been grinding lower and is now coming back toward the $75,000 support zone. This level is extremely important: HOLD $75K → bullish structure remains intact 🚀 LOSE $75K → deeper correction likely 🔻 We’ve already seen multiple reactions from this area, which makes the current test even more important. BTC doesn’t need to go straight up from here. It just needs to defend $75K. $75K = the line in the sand. 👀
$BTC IS APPROACHING THE $75K DECISION ZONE. 👀 After the strong breakout, BTC has been grinding lower and is now coming back toward the $75,000 support zone. This level is extremely important: HOLD $75K → bullish structure remains intact 🚀 LOSE $75K → deeper correction likely 🔻 We’ve already seen multiple reactions from this area, which makes the current test even more important. BTC doesn’t need to go straight up from here. It just needs to defend $75K. $75K = the line in the sand. 👀
49
·
--
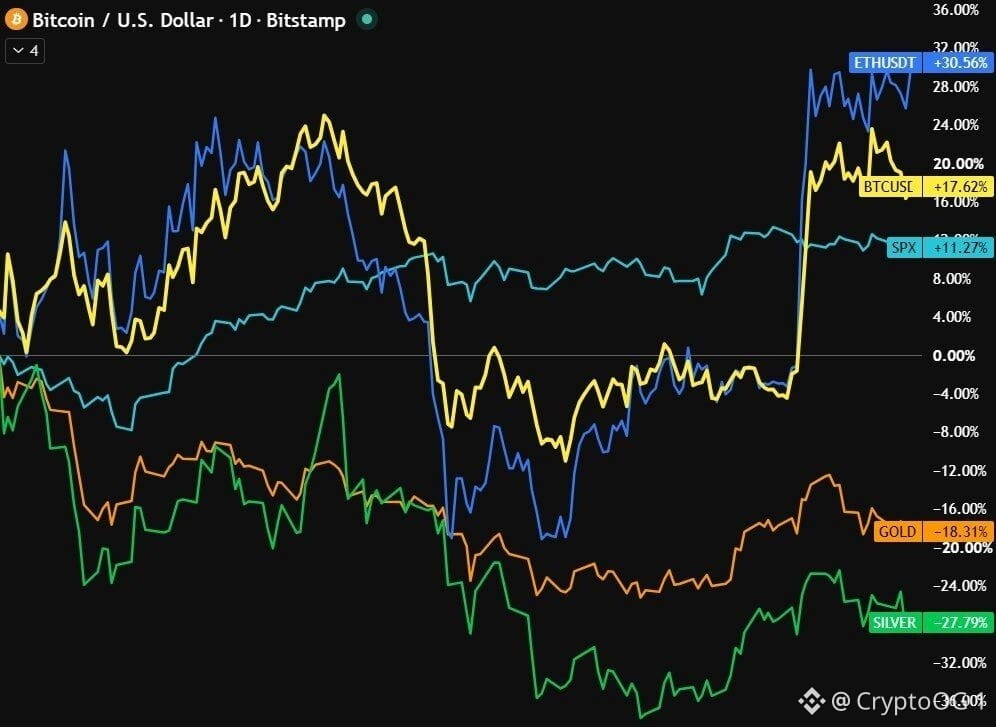
🚨 ИНТЕРЕСНО: если бы было вложено $10K, когда началась война США и Ирана, это стоило бы: $ETH: $13,056 $BTC: $11,762 S&P 500: $11,270 Золото: $8,200 Серебро: $7,310
🚨 ИНТЕРЕСНО: если бы было вложено $10K, когда началась война США и Ирана, это стоило бы: $ETH: $13,056 $BTC: $11,762 S&P 500: $11,270 Золото: $8,200 Серебро: $7,310
81
·
--
См. перевод
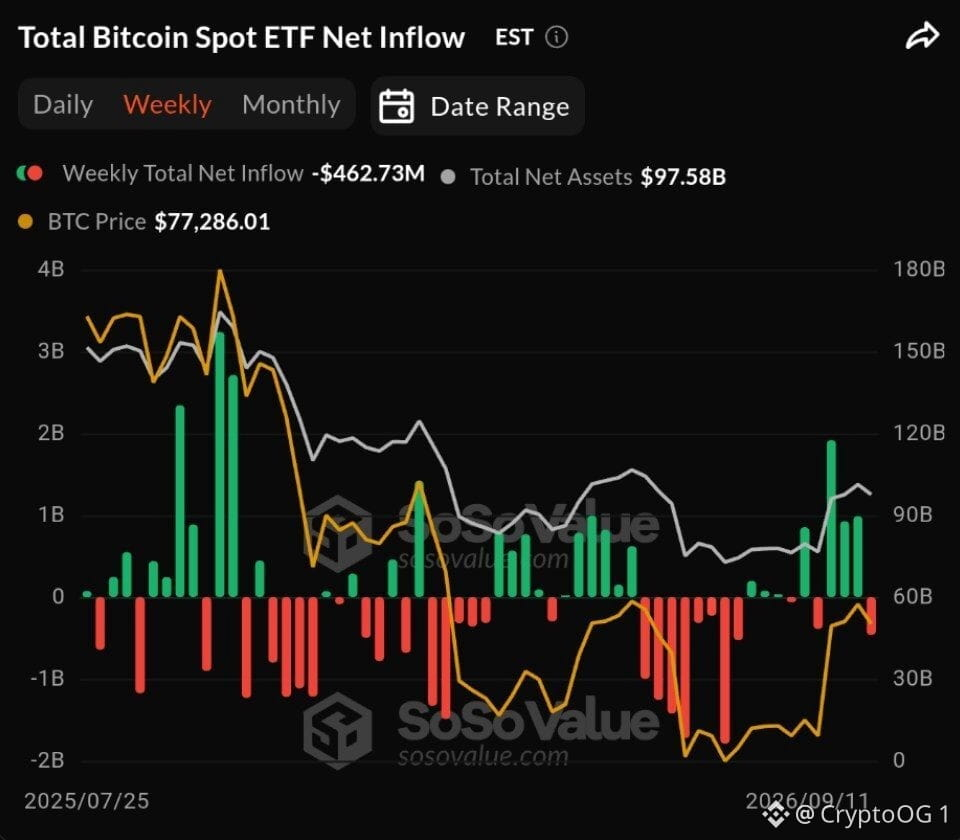
🚨 ETFS: The $BTC ETFs failed to see a 4th week of net inflows with almost every day this week seeing another net outflow.
🚨 ETFS: The $BTC ETFs failed to see a 4th week of net inflows with almost every day this week seeing another net outflow.
29
·
--
См. перевод
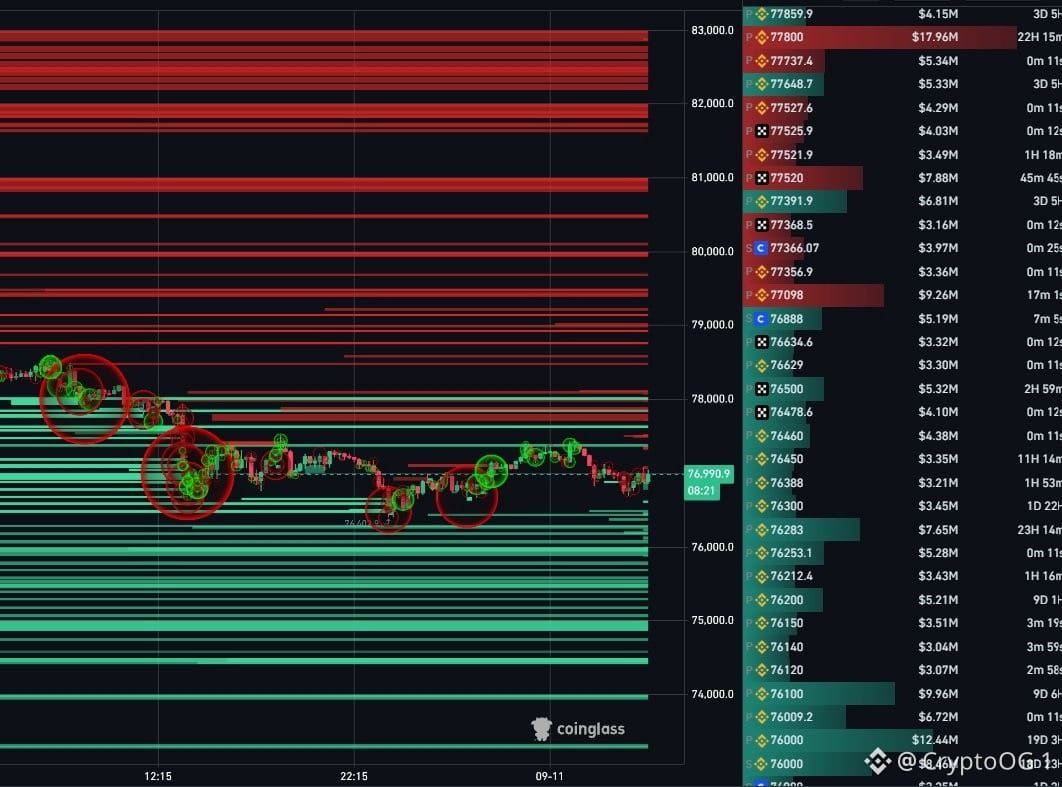
This is genuinely insane. $BTC dumped to $76,400 liquidating $910M in the past 24 hours! But here’s the important part: Bitcoin now has roughly $2.5B liquidity below between $74,000 - $76,500 and $5.8B above between $77,500 - $82,000. This means the HTF liquidity imbalance has now flipped heavily towards the upside, which market makers could target next. On the LTF, the largest liquidity magnets are at $76,000 - $76,400 below and $77,500 - $77,900 above, making these the 'likely' levels to sweep today. Whales have stacked some very large bids between $74,000 - $76,500 below, while the first major sell wall sits around $78,000. Above that, liquidity becomes much thinner until the larger $81,000-$83,000 area. This means a clean reclaim of $78,000 could open the door to a strong recovery. Meanwhile, spot demand is still extremely weak and Coinbase Premium has dropped heavily negative, while OI has cooled and futures traders are only starting to buy again. This means leverage has been flushed, but real spot demand still hasn’t returned strongly enough for me to trust the bounce yet. So to make things simple for you: - Lose $78,000 → deeper downside played out ✅ - $76,400 and $77,500 are the two LTF magnet zones - $5.8B above now creates a major HTF liquidity imbalance - Reclaim $78,000 and I favour a stronger recovery. Lose $76,000 and $74,000 - $75,000 becomes the next zone I’ll post any changes to my positioning and the key levels I’m watching in the free Telegram (link in bio). #BTC Price Analysis#
This is genuinely insane. $BTC dumped to $76,400 liquidating $910M in the past 24 hours! But here’s the important part: Bitcoin now has roughly $2.5B liquidity below between $74,000 - $76,500 and $5.8B above between $77,500 - $82,000. This means the HTF liquidity imbalance has now flipped heavily towards the upside, which market makers could target next. On the LTF, the largest liquidity magnets are at $76,000 - $76,400 below and $77,500 - $77,900 above, making these the 'likely' levels to sweep today. Whales have stacked some very large bids between $74,000 - $76,500 below, while the first major sell wall sits around $78,000. Above that, liquidity becomes much thinner until the larger $81,000-$83,000 area. This means a clean reclaim of $78,000 could open the door to a strong recovery. Meanwhile, spot demand is still extremely weak and Coinbase Premium has dropped heavily negative, while OI has cooled and futures traders are only starting to buy again. This means leverage has been flushed, but real spot demand still hasn’t returned strongly enough for me to trust the bounce yet. So to make things simple for you: - Lose $78,000 → deeper downside played out ✅ - $76,400 and $77,500 are the two LTF magnet zones - $5.8B above now creates a major HTF liquidity imbalance - Reclaim $78,000 and I favour a stronger recovery. Lose $76,000 and $74,000 - $75,000 becomes the next zone I’ll post any changes to my positioning and the key levels I’m watching in the free Telegram (link in bio). #BTC Price Analysis#
38
·
--
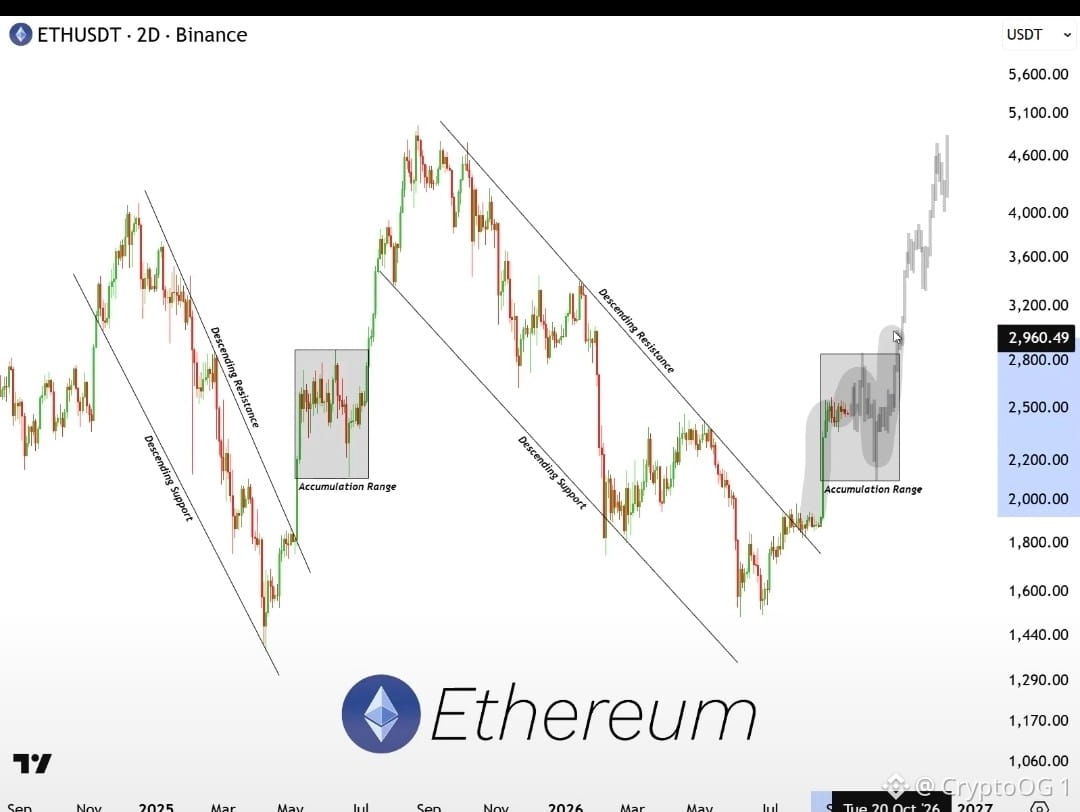
🚨 #ЭФИРЕУМ ВСКОРЕ ВЕРНЕТСЯ К $3 000, И я не думаю, что это займет месяцы. Моя цель ясна: $3 000 менее чем за 30 дней. Структура, которую формирует $ETH, явно указывает на разворот медвежьего тренда и начало бычьего рынка. Медвежий рынок уже закончился. Накопление уже позади. Теперь начинается фаза роста. 📈 ETH → $3 000 до ноября. И это только начало. ЭФИРЕУМ ВЕРНУЛСЯ. 🦇
🚨 #ЭФИРЕУМ ВСКОРЕ ВЕРНЕТСЯ К $3 000, И я не думаю, что это займет месяцы. Моя цель ясна: $3 000 менее чем за 30 дней. Структура, которую формирует $ETH, явно указывает на разворот медвежьего тренда и начало бычьего рынка. Медвежий рынок уже закончился. Накопление уже позади. Теперь начинается фаза роста. 📈 ETH → $3 000 до ноября. И это только начало. ЭФИРЕУМ ВЕРНУЛСЯ. 🦇
50
·
--
См. перевод
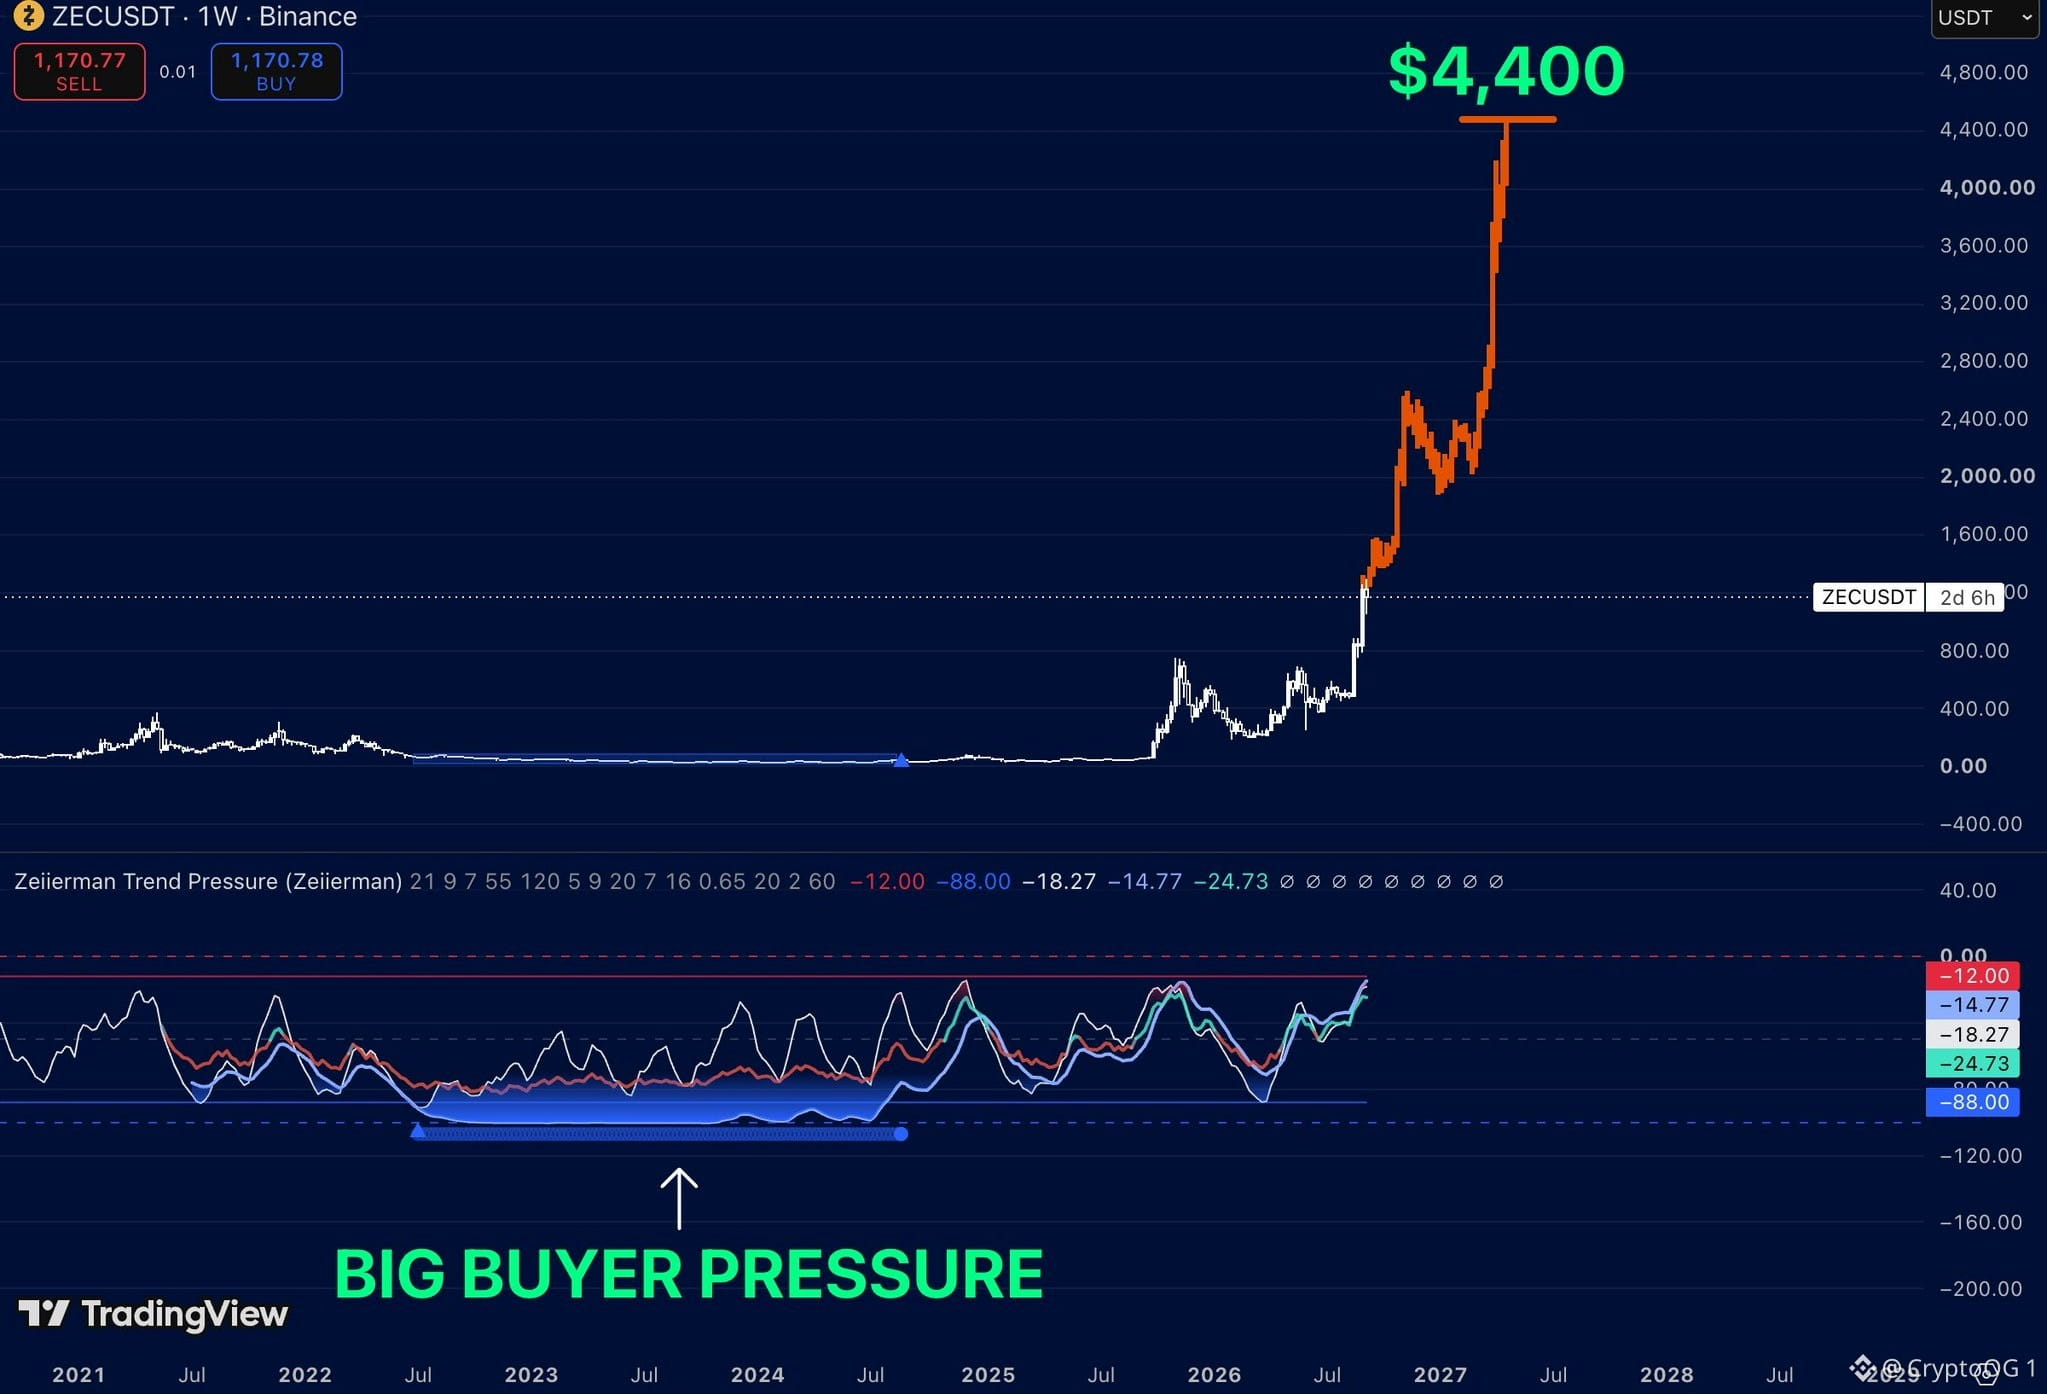
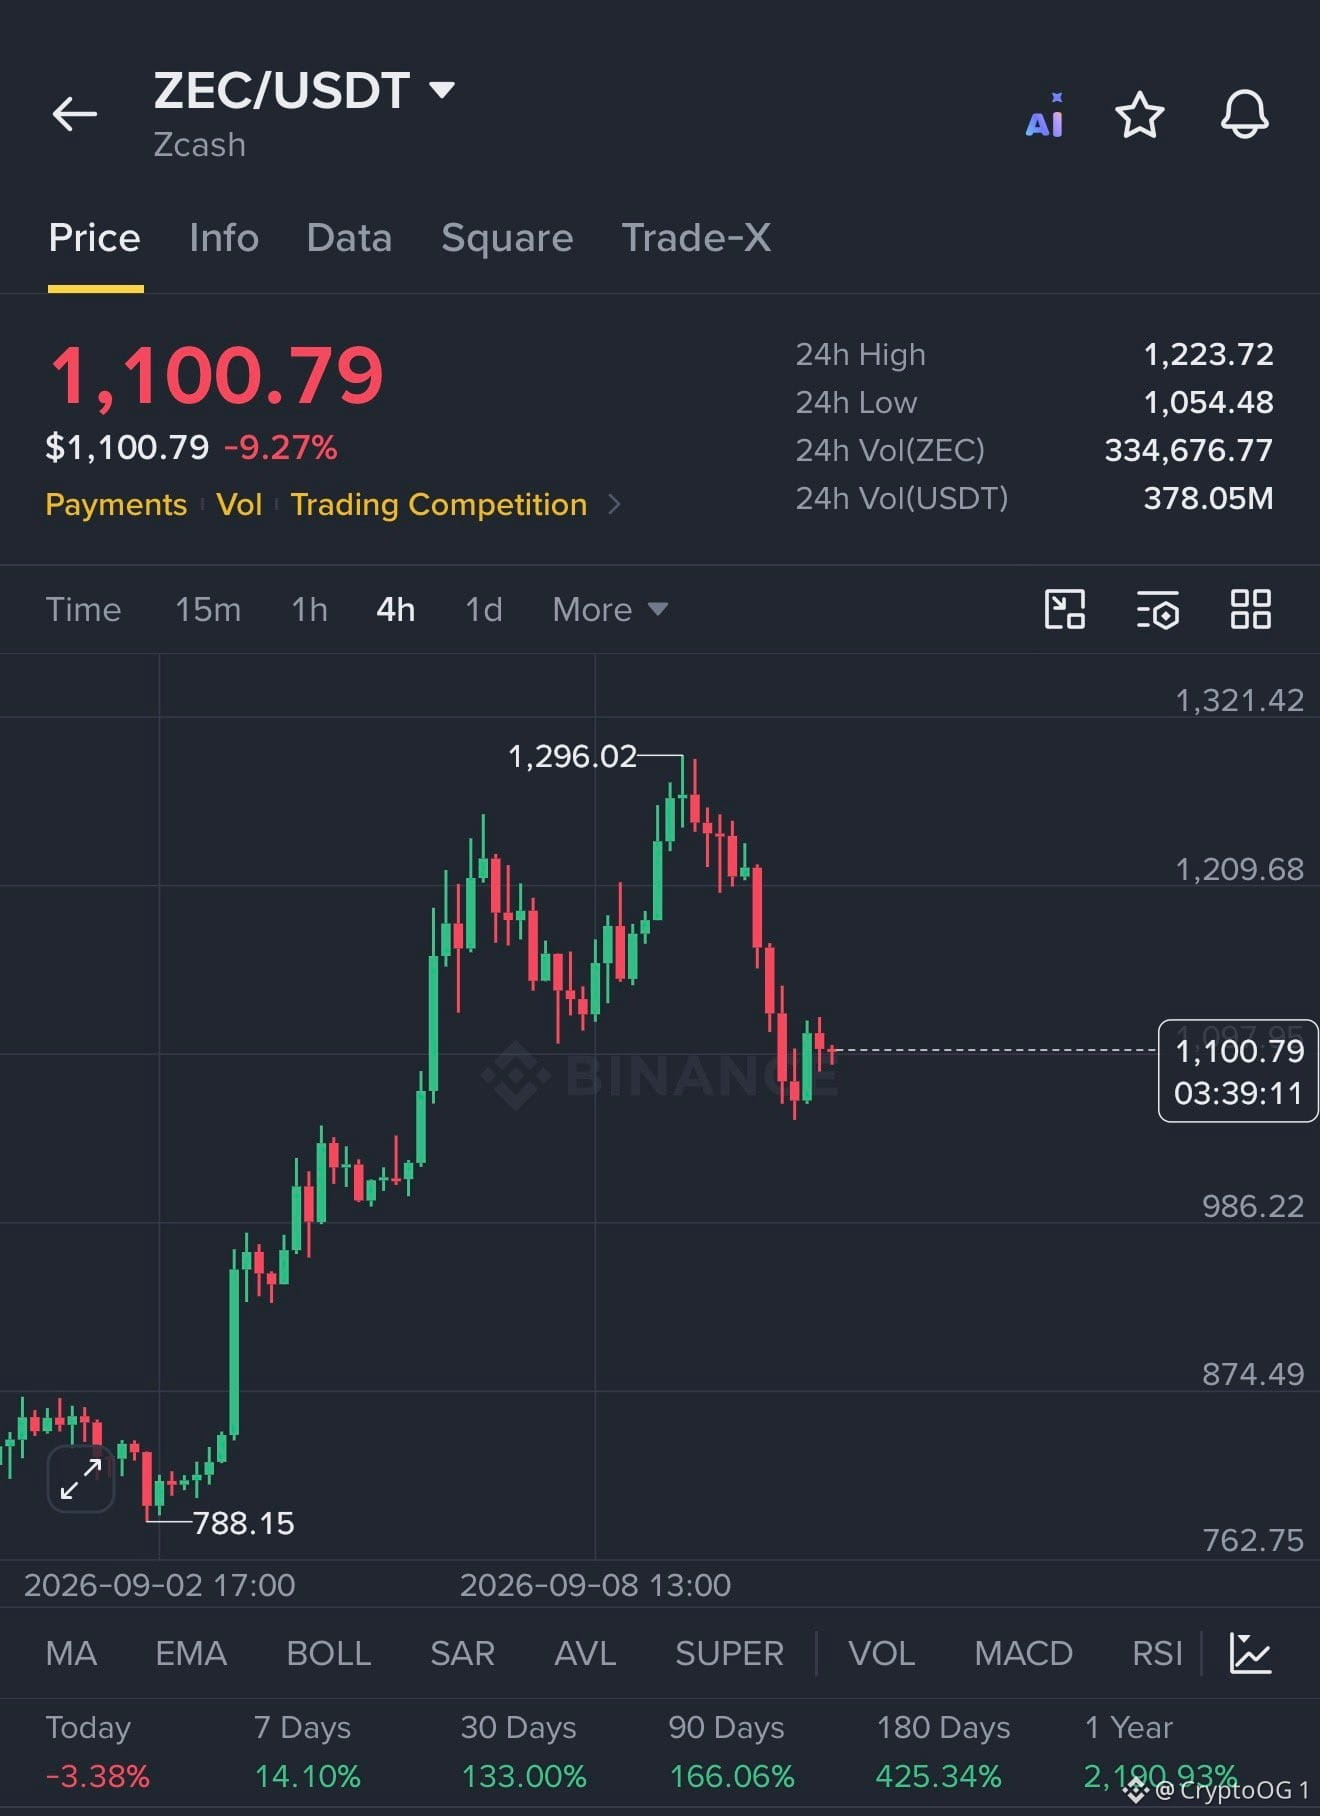
$ZEC is doing something most people will only notice when it’s too late. For years, price was basically dead. Flat structure. No attention. No excitement. But underneath that, buyer pressure was building for an absurd amount of time. And now $ZEC is finally expanding out of that base. The move to $1,100+ might look huge. On the macro chart, it could still be the beginning. My next major target: $4,400. This is what years of compression can look like when they finally unwind.
$ZEC is doing something most people will only notice when it’s too late. For years, price was basically dead. Flat structure. No attention. No excitement. But underneath that, buyer pressure was building for an absurd amount of time. And now $ZEC is finally expanding out of that base. The move to $1,100+ might look huge. On the macro chart, it could still be the beginning. My next major target: $4,400. This is what years of compression can look like when they finally unwind.
·
--
См. перевод
I woke up this morning and saw 10 missed calls from my Chinese friend that $ZEC is crashing. I panicked and quickly opened my Binance app, expecting to see $ZEC at $600 since the last time I saw it was at $1,230. As I opened my app, I saw ZEC above $1,100, and I was confused. Where is the dump? We need to learn how these crypto markets work. We have ups and downs. Even $BTC did not just go from $300 to $120,000 - there were ups and downs. Ups and downs are all part of the market. Your bags won't always be up. Learn and understand this so you can stop panicking.
I woke up this morning and saw 10 missed calls from my Chinese friend that $ZEC is crashing. I panicked and quickly opened my Binance app, expecting to see $ZEC at $600 since the last time I saw it was at $1,230. As I opened my app, I saw ZEC above $1,100, and I was confused. Where is the dump? We need to learn how these crypto markets work. We have ups and downs. Even $BTC did not just go from $300 to $120,000 - there were ups and downs. Ups and downs are all part of the market. Your bags won't always be up. Learn and understand this so you can stop panicking.
25
·
--
См. перевод
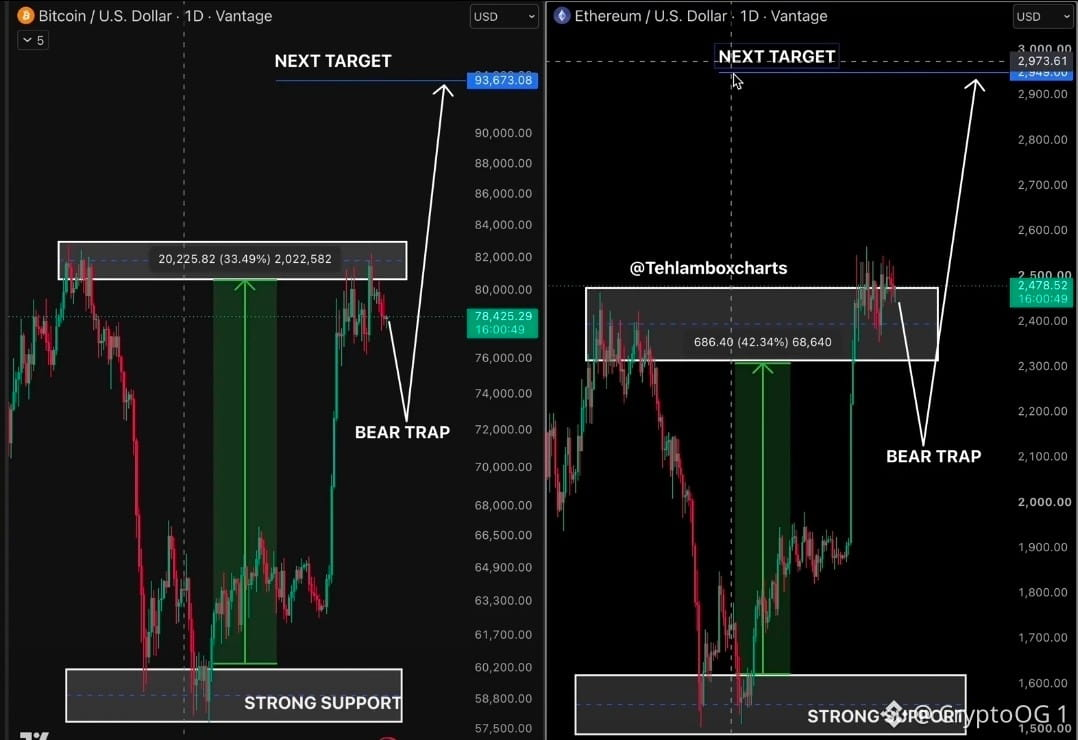
$BTC and $ETH are committing the same petty crime Both were rejected Both pulled back Both are currently sitting on strong resistance But the charts are calling for a potential bear trap then → BTC target: 93.6 thousand dollars → ETH target: 2.95 thousand dollars Bears came for the dip Could become exit liquidity I'll share everything openly and clearly Follow, turn on notifications.
$BTC and $ETH are committing the same petty crime Both were rejected Both pulled back Both are currently sitting on strong resistance But the charts are calling for a potential bear trap then → BTC target: 93.6 thousand dollars → ETH target: 2.95 thousand dollars Bears came for the dip Could become exit liquidity I'll share everything openly and clearly Follow, turn on notifications.
24
·
--
См. перевод
Based on historical data…… The “1,064/365 Bitcoin $BTC Cycle Theory” claims: * Bitcoin rises for approximately 1,064 days from a major bottom to a cycle top. * It then declines for roughly 364–365 days. * Bitcoin reportedly peaked around October 6, 2025. #BTC Price Analysis# * Adding 364–365 days points to approximately October 5–6, 2026 as the theoretical bottom. * So technically starting October, the market will experience a massive shift.
Based on historical data…… The “1,064/365 Bitcoin $BTC Cycle Theory” claims: * Bitcoin rises for approximately 1,064 days from a major bottom to a cycle top. * It then declines for roughly 364–365 days. * Bitcoin reportedly peaked around October 6, 2025. #BTC Price Analysis# * Adding 364–365 days points to approximately October 5–6, 2026 as the theoretical bottom. * So technically starting October, the market will experience a massive shift.

35
·
--
🚨 БИТКОИН $BTC СКОРО ПОВТОРИТ ТО ЖЕ ДВИЖЕНИЕ, КОТОРОЕ РАЗДАВИЛО ВСЕХ В 2022 Бычья ловушка, о которой я предупреждал, сработала на 79 000 долларов. А теперь посмотри, что произошло в 2022. Если эта схема продолжит повторяться, Биткоин будет двигаться к 57 000 долларов в течение ближайших 30 дней. Не в 2027. Не «со временем». 30 ДНЕЙ Эта схема почти идентична. Бычья ловушка → распределение → падение → капитуляция Сделай закладку на этот твит. Вернись, когда Биткоин будет торговаться ниже 60 000 долларов. В 2022 году я публично указал дно на 17 000 долларов. В 2025 году я указал пик на 126 000 долларов. И когда я начну снова покупать этот рынок, я поделюсь этим здесь ПРЕЖДЕ, чем толпа поймет, что дно уже наступило. Подпишись и включи уведомления. Ты не захочешь пропустить мой следующий пост. Напиши после того, как движение уже произойдет.
🚨 БИТКОИН $BTC СКОРО ПОВТОРИТ ТО ЖЕ ДВИЖЕНИЕ, КОТОРОЕ РАЗДАВИЛО ВСЕХ В 2022 Бычья ловушка, о которой я предупреждал, сработала на 79 000 долларов. А теперь посмотри, что произошло в 2022. Если эта схема продолжит повторяться, Биткоин будет двигаться к 57 000 долларов в течение ближайших 30 дней. Не в 2027. Не «со временем». 30 ДНЕЙ Эта схема почти идентична. Бычья ловушка → распределение → падение → капитуляция Сделай закладку на этот твит. Вернись, когда Биткоин будет торговаться ниже 60 000 долларов. В 2022 году я публично указал дно на 17 000 долларов. В 2025 году я указал пик на 126 000 долларов. И когда я начну снова покупать этот рынок, я поделюсь этим здесь ПРЕЖДЕ, чем толпа поймет, что дно уже наступило. Подпишись и включи уведомления. Ты не захочешь пропустить мой следующий пост. Напиши после того, как движение уже произойдет.

43
·
--
См. перевод
#ADA /USDT forming a clear triangle pattern 👀📐 Price is compressing around $0.20–$0.23, showing a tight battle between buyers and sellers. A breakout above $0.23 could trigger the next expansion move toward $0.32 📈🔥 Momentum is building as the range gets tighter. Bulls are waiting for the breakout. $ADA #ADA
#ADA /USDT forming a clear triangle pattern 👀📐 Price is compressing around $0.20–$0.23, showing a tight battle between buyers and sellers. A breakout above $0.23 could trigger the next expansion move toward $0.32 📈🔥 Momentum is building as the range gets tighter. Bulls are waiting for the breakout. $ADA #ADA

49
·
--
См. перевод
🚨 BITCOIN HAS 26 DAYS LEFT This cycle has NEVER failed Buy $BTC 365 days after the top Sell $BTC 1,065 days after the bottom Three cycles Three perfect hits Zero exceptions We’re now on day 339 of 365 That leaves exactly 26 days for Bitcoin to print its cycle bottom If the low comes, the 4 year cycle survives again If it doesn’t, one of Bitcoin’s most reliable patterns is officially DEAD Save this chart The next 26 days decide everything
🚨 BITCOIN HAS 26 DAYS LEFT This cycle has NEVER failed Buy $BTC 365 days after the top Sell $BTC 1,065 days after the bottom Three cycles Three perfect hits Zero exceptions We’re now on day 339 of 365 That leaves exactly 26 days for Bitcoin to print its cycle bottom If the low comes, the 4 year cycle survives again If it doesn’t, one of Bitcoin’s most reliable patterns is officially DEAD Save this chart The next 26 days decide everything
·
--
См. перевод
$ETH showed some strength today, while the rest of the crypto market remained weak. We’re now rejecting the first key resistance at $2,475. That’s not a good sign heading into tomorrow’s CPI report. A stronger-than-expected inflation print could put further pressure on ETH and risk assets.
$ETH showed some strength today, while the rest of the crypto market remained weak. We’re now rejecting the first key resistance at $2,475. That’s not a good sign heading into tomorrow’s CPI report. A stronger-than-expected inflation print could put further pressure on ETH and risk assets.

15
·
--
🚨 ДВА СТАБИЛЬКОИНА КОНТРОЛИРУЮТ $258 МИЛЛИАРДОВ $USDT : $183.4B $USDC : $74.5B Вместе они контролируют $258 МИЛЛИАРДОВ+, больше, чем все остальные стейблкоины вместе взятые. И незаметно занимают #6 : 🇺🇸 стейблкоин, связанный с Трампом, World Liberty Financial: $4.3B, теперь больше, чем у PayPal. Стейблкоины становятся огромной частью глобальной финансовой системы. Насколько большим может стать этот рынок? 👀🚀
🚨 ДВА СТАБИЛЬКОИНА КОНТРОЛИРУЮТ $258 МИЛЛИАРДОВ $USDT : $183.4B $USDC : $74.5B Вместе они контролируют $258 МИЛЛИАРДОВ+, больше, чем все остальные стейблкоины вместе взятые. И незаметно занимают #6 : 🇺🇸 стейблкоин, связанный с Трампом, World Liberty Financial: $4.3B, теперь больше, чем у PayPal. Стейблкоины становятся огромной частью глобальной финансовой системы. Насколько большим может стать этот рынок? 👀🚀

39
·
--
$XRP ВСЁ ЕЩЁ СОХРАНЯЕТ ТУ ЖЕ СХЕМУ. 👀 XRP провёл месяцы, зажатый внутри диапазона $1.32–$1.56, с интенсивным тестированием нижней границы. Затем мы получили то движение, которое хотели: Ликвидность ниже была сметена ✅ Масштабное расширение ✅ Диапазон возвращён ✅ Идёт ретест ✅ Но осталось одно важное ценовое место: $1.55–$1.56 = КЛЮЧЕВОЕ СОПРОТИВЛЕНИЕ. XRP пока ЕГО НЕ ПРОБИЛ. Чёткий пробой + удержание выше верхней границы диапазона откроют путь к: $1.70 → $1.80 → $2.00 🎯 Так что схема простая: ДЕРЖАТЬ ДИАПАЗОН → ПРОБИТЬ $1.56 → ЦЕЛЬ $2. 🚀 Ликвидность ниже уже была забрана. Теперь ждём, сможет ли XRP наконец забрать ликвидность выше. 👀🔥
$XRP ВСЁ ЕЩЁ СОХРАНЯЕТ ТУ ЖЕ СХЕМУ. 👀 XRP провёл месяцы, зажатый внутри диапазона $1.32–$1.56, с интенсивным тестированием нижней границы. Затем мы получили то движение, которое хотели: Ликвидность ниже была сметена ✅ Масштабное расширение ✅ Диапазон возвращён ✅ Идёт ретест ✅ Но осталось одно важное ценовое место: $1.55–$1.56 = КЛЮЧЕВОЕ СОПРОТИВЛЕНИЕ. XRP пока ЕГО НЕ ПРОБИЛ. Чёткий пробой + удержание выше верхней границы диапазона откроют путь к: $1.70 → $1.80 → $2.00 🎯 Так что схема простая: ДЕРЖАТЬ ДИАПАЗОН → ПРОБИТЬ $1.56 → ЦЕЛЬ $2. 🚀 Ликвидность ниже уже была забрана. Теперь ждём, сможет ли XRP наконец забрать ликвидность выше. 👀🔥

51
·
--
См. перевод
🚨 #Bitcoin Price Prediction: What is Bitcoins next move?# IS ABOUT TO REPEAT THE SAME MOVE THAT DESTROYED EVERYONE IN 2022 The bull trap I warned about just played out at $79K Now look at what happened NEXT in 2022 If this structure keeps repeating, $BTC is heading to $48,000 within the next 30 days Not in 2027 Not “eventually” 30 DAYS The setup is almost identical Bull trap → distribution → breakdown → capitulation Bookmark this tweet Come back when Bitcoin is trading below $50K I publicly called the $17K bottom in 2022 I called the $126K top in 2025 And when I start buying this market again, I’ll post it here BEFORE the crowd realizes the bottom is in Follow and turn notifications on You don’t want to find my next call after the move already happened.
🚨 #Bitcoin Price Prediction: What is Bitcoins next move?# IS ABOUT TO REPEAT THE SAME MOVE THAT DESTROYED EVERYONE IN 2022 The bull trap I warned about just played out at $79K Now look at what happened NEXT in 2022 If this structure keeps repeating, $BTC is heading to $48,000 within the next 30 days Not in 2027 Not “eventually” 30 DAYS The setup is almost identical Bull trap → distribution → breakdown → capitulation Bookmark this tweet Come back when Bitcoin is trading below $50K I publicly called the $17K bottom in 2022 I called the $126K top in 2025 And when I start buying this market again, I’ll post it here BEFORE the crowd realizes the bottom is in Follow and turn notifications on You don’t want to find my next call after the move already happened.

·
--
См. перевод
It's time to think about the 2028 halving and what it could mean for $BTC price. As of now, only 1.6 years until the next halving. After prior halvings: - 2012: ~100x rally over 12 months - 2016: ~30x rally over 18 months - 2020: ~8x rally over 18 months #BTC Price Analysis# The halving has been the quadrennial heartbeat of Bitcoin's marketing and monetization. But in 2024, something different happened. The pattern of halving --> bull market was already established enough that people front-ran the halving. For the first time, we had a new all-time-high before the halving. - 2024: ~4x in 18 months BEFORE halving, ~2x rally over 18 months after halving So what will happen this cycle? Nobody really knows, but I think the precedent has been established to front-run the halving. That's the game theory now. If the same pattern plays out this cycle, the next 1.6 years could be the most explosive time for BTC. Repeating the prior cycle would look like: - 4x over 1.6 years: $58k (recent bottom) --> $232k at April 2028 halving - 2x over 18 months after halving: $232k --> $464k in 2H 2029 BTC could certainly deliver diminishing returns vs the prior cycle (as it has tended to do), but at some point that trend breaks to the upside. The key point for now is that people are likely to front-run the halving. And that could make the next 1.6 years the most exciting part of this Bitcoin cycle.
It's time to think about the 2028 halving and what it could mean for $BTC price. As of now, only 1.6 years until the next halving. After prior halvings: - 2012: ~100x rally over 12 months - 2016: ~30x rally over 18 months - 2020: ~8x rally over 18 months #BTC Price Analysis# The halving has been the quadrennial heartbeat of Bitcoin's marketing and monetization. But in 2024, something different happened. The pattern of halving --> bull market was already established enough that people front-ran the halving. For the first time, we had a new all-time-high before the halving. - 2024: ~4x in 18 months BEFORE halving, ~2x rally over 18 months after halving So what will happen this cycle? Nobody really knows, but I think the precedent has been established to front-run the halving. That's the game theory now. If the same pattern plays out this cycle, the next 1.6 years could be the most explosive time for BTC. Repeating the prior cycle would look like: - 4x over 1.6 years: $58k (recent bottom) --> $232k at April 2028 halving - 2x over 18 months after halving: $232k --> $464k in 2H 2029 BTC could certainly deliver diminishing returns vs the prior cycle (as it has tended to do), but at some point that trend breaks to the upside. The key point for now is that people are likely to front-run the halving. And that could make the next 1.6 years the most exciting part of this Bitcoin cycle.

·
--
См. перевод
$XRP IS BACK AT THE MAKE-OR-BREAK ZONE. 👀 XRP spent months consolidating between $1.32–$1.56, with repeated tests of the lower boundary. Then came the move: Liquidity below swept ✅ Massive expansion ✅ Range reclaimed ✅ Retest holding ✅ Now XRP is approaching the $1.55–$1.56 key resistance. This is the level that decides everything: BREAK & HOLD → $1.80 → $2.00 🎯 REJECT → back into the range. The setup is there. Now XRP just needs to clear the range high. $2 is the next major target if the breakout confirms. 🚀
$XRP IS BACK AT THE MAKE-OR-BREAK ZONE. 👀 XRP spent months consolidating between $1.32–$1.56, with repeated tests of the lower boundary. Then came the move: Liquidity below swept ✅ Massive expansion ✅ Range reclaimed ✅ Retest holding ✅ Now XRP is approaching the $1.55–$1.56 key resistance. This is the level that decides everything: BREAK & HOLD → $1.80 → $2.00 🎯 REJECT → back into the range. The setup is there. Now XRP just needs to clear the range high. $2 is the next major target if the breakout confirms. 🚀

Войдите, чтобы посмотреть больше материала
Присоединяйтесь к пользователям криптовалют по всему миру на Binance Square
⚡️ Получайте новейшую и полезную информацию о криптоактивах.
💬 Нам доверяет крупнейшая в мире криптобиржа.
👍 Получите достоверные аналитические данные от верифицированных создателей контента.
Эл. почта/номер телефона
В тренде
ПротоколFOMC
Просмотров: 12,412
85 обсуждают
#ПротоколFOMC 🚨 Протокол FOMC: что важно для рынка?
ФРС сохранила процентную ставку на уровне 3,50–3,75%, однако внутри Комитета появились серьёзные разногласия.
🔥 Три члена FOMC выступили за повышение ставки на 25 б.п.
При этом инфляция остаётся выше целевого уровня 2%, а экономика продолжает расти устойчивыми темпами.
📌 Что это значит?
Ястребиная позиция ФРС может поддерживать доллар и доходности облигаций, создавая дополнительное давление на BTC и другие рисковые активы.
Но окончательное решение по сентябрю пока не принято.
📅 Следующее заседание FOMC состоится 15–16 сентября.
Именно новые данные по инфляции и рынку труда могут определить дальнейший курс ФРС.
👀 Сентябрь может стать ключевым месяцем для рынков.
MuskFutures
·Лайков: 1
·Просмотров: 158
fomcотслеживание
Просмотров: 18,120
288 обсуждают
BitcoinReboundsTo$79K
Просмотров: 8,736
90 обсуждают