
KCM 1
139 Публикации

KCM 1
Отправить жалобу
Заблокировать пользователя
0 подписок(и/а)
6 подписчиков(а)
18 понравилось
Посты
·
--
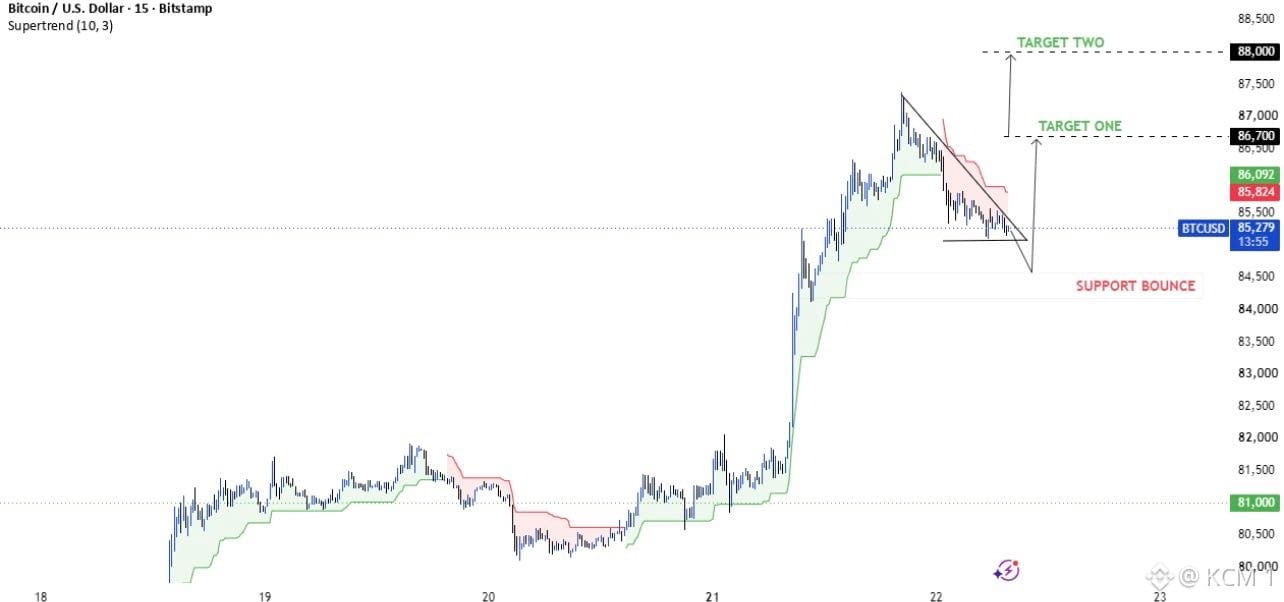
Пока продавцы, открывающие шорт, работают на откате, эта нисходящая клиновидная консолидация по $BTC сворачивается прямо над ключевой поддержкой внутри дня, что указывает на возможное бычье продолжение.
После сильного восходящего ралли цена откатила внутрь узкого нисходящего клина и сейчас тестирует поддержку примерно возле $85,279[span_0](start_span)[span_0](end_span). Индикатор Supertrend и локальная зона горизонтальной поддержки сигнализируют, что покупатели защищают нижнюю границу, подготавливая потенциальное расширение из структуры флага[span_1](start_span)[span_1](end_span).
Чистый пробой выше линии сопротивления нисходящего клина подтверждает движение вверх, открывая цель один на $86,700 и цель два на $88,000[span_2](start_span)[span_2](end_span). Удержание выше локальной поддержки возле $84,500 сохраняет бычий тезис, тогда как пробой вниз его опровергает[span_3](start_span)[span_3](end_span).
Не шортите по поддержке нисходящего клина — дождитесь расширения цены, чтобы подтвердить следующий более высокий шаг.
#BTC #Bitcoin #CryptoAnalysis #TechnicalAnalysis #Trading
Пока продавцы, открывающие шорт, работают на откате, эта нисходящая клиновидная консолидация по $BTC сворачивается прямо над ключевой поддержкой внутри дня, что указывает на возможное бычье продолжение.
После сильного восходящего ралли цена откатила внутрь узкого нисходящего клина и сейчас тестирует поддержку примерно возле $85,279[span_0](start_span)[span_0](end_span). Индикатор Supertrend и локальная зона горизонтальной поддержки сигнализируют, что покупатели защищают нижнюю границу, подготавливая потенциальное расширение из структуры флага[span_1](start_span)[span_1](end_span).
Чистый пробой выше линии сопротивления нисходящего клина подтверждает движение вверх, открывая цель один на $86,700 и цель два на $88,000[span_2](start_span)[span_2](end_span). Удержание выше локальной поддержки возле $84,500 сохраняет бычий тезис, тогда как пробой вниз его опровергает[span_3](start_span)[span_3](end_span).
Не шортите по поддержке нисходящего клина — дождитесь расширения цены, чтобы подтвердить следующий более высокий шаг.
#BTC #Bitcoin #CryptoAnalysis #TechnicalAnalysis #Trading
После сильного восходящего ралли цена откатила внутрь узкого нисходящего клина и сейчас тестирует поддержку примерно возле $85,279[span_0](start_span)[span_0](end_span). Индикатор Supertrend и локальная зона горизонтальной поддержки сигнализируют, что покупатели защищают нижнюю границу, подготавливая потенциальное расширение из структуры флага[span_1](start_span)[span_1](end_span).
Чистый пробой выше линии сопротивления нисходящего клина подтверждает движение вверх, открывая цель один на $86,700 и цель два на $88,000[span_2](start_span)[span_2](end_span). Удержание выше локальной поддержки возле $84,500 сохраняет бычий тезис, тогда как пробой вниз его опровергает[span_3](start_span)[span_3](end_span).
Не шортите по поддержке нисходящего клина — дождитесь расширения цены, чтобы подтвердить следующий более высокий шаг.
#BTC #Bitcoin #CryptoAnalysis #TechnicalAnalysis #Trading
49
·
--
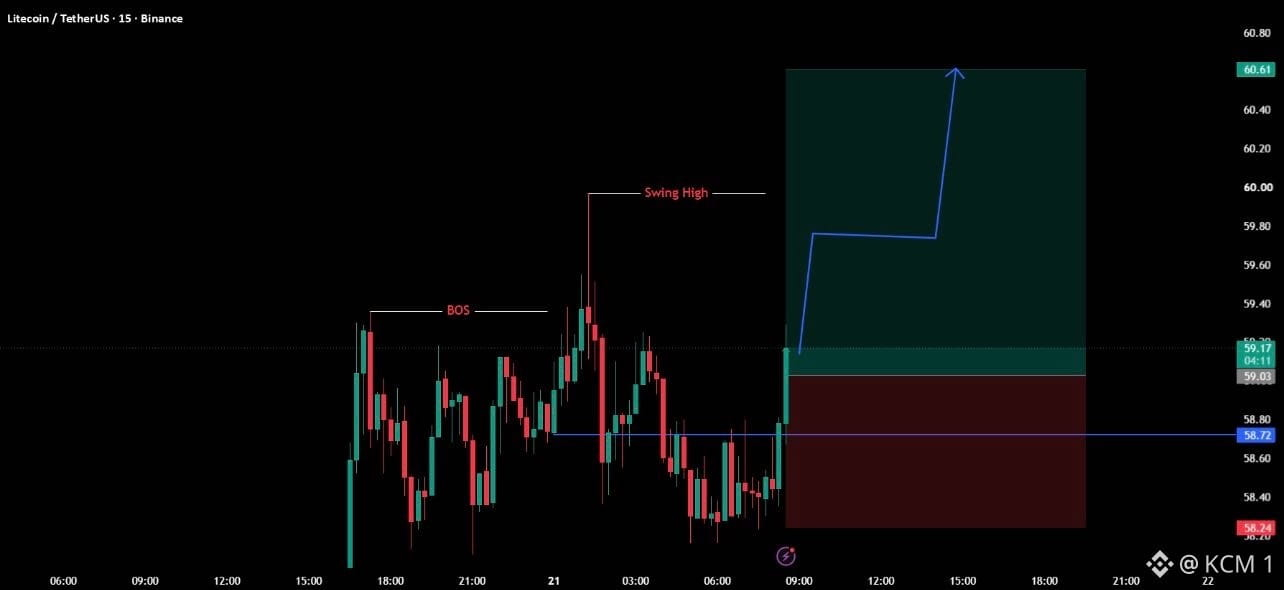
Пока многие ждут подтверждения на более старшем таймфрейме, этот внутридневной пробой структуры по $LTC запускает высоко-доходную (high-RR) лонг-схему продолжения.
После установления четкого Break of Structure (BOS) и формирования ключевого swing high цена сначала смела ликвидность на младшем таймфрейме, а затем агрессивные покупатели резко вошли возле $58.72 . Сильная бычья поглощающая свеча от внутреннего минимума подтверждает поглощение спроса и возвращает локальный импульс в сторону роста.
Удержание выше уровня, при котором торговый сценарий считается недействительным (invalidation), на $58.24 сохраняет бычий импульс: целью является пробитие ликвидности предыдущего swing high, а затем полное расширение до $60.61 . Неспособность удержать поддержку и падение ниже $58.24 аннулируют торговый сетап, сигнализируя о более глубокой коррекции в сторону нижних зон спроса.
Не ждите, пока цена убежит — согласуйте входы со сдвигами структуры на младшем таймфрейме от ключевых зон спроса.
#LTC #Litecoin #CryptoAnalysis #TechnicalAnalysis #Trading
Пока многие ждут подтверждения на более старшем таймфрейме, этот внутридневной пробой структуры по $LTC запускает высоко-доходную (high-RR) лонг-схему продолжения.
После установления четкого Break of Structure (BOS) и формирования ключевого swing high цена сначала смела ликвидность на младшем таймфрейме, а затем агрессивные покупатели резко вошли возле $58.72 . Сильная бычья поглощающая свеча от внутреннего минимума подтверждает поглощение спроса и возвращает локальный импульс в сторону роста.
Удержание выше уровня, при котором торговый сценарий считается недействительным (invalidation), на $58.24 сохраняет бычий импульс: целью является пробитие ликвидности предыдущего swing high, а затем полное расширение до $60.61 . Неспособность удержать поддержку и падение ниже $58.24 аннулируют торговый сетап, сигнализируя о более глубокой коррекции в сторону нижних зон спроса.
Не ждите, пока цена убежит — согласуйте входы со сдвигами структуры на младшем таймфрейме от ключевых зон спроса.
#LTC #Litecoin #CryptoAnalysis #TechnicalAnalysis #Trading
После установления четкого Break of Structure (BOS) и формирования ключевого swing high цена сначала смела ликвидность на младшем таймфрейме, а затем агрессивные покупатели резко вошли возле $58.72 . Сильная бычья поглощающая свеча от внутреннего минимума подтверждает поглощение спроса и возвращает локальный импульс в сторону роста.
Удержание выше уровня, при котором торговый сценарий считается недействительным (invalidation), на $58.24 сохраняет бычий импульс: целью является пробитие ликвидности предыдущего swing high, а затем полное расширение до $60.61 . Неспособность удержать поддержку и падение ниже $58.24 аннулируют торговый сетап, сигнализируя о более глубокой коррекции в сторону нижних зон спроса.
Не ждите, пока цена убежит — согласуйте входы со сдвигами структуры на младшем таймфрейме от ключевых зон спроса.
#LTC #Litecoin #CryptoAnalysis #TechnicalAnalysis #Trading
574
·
--
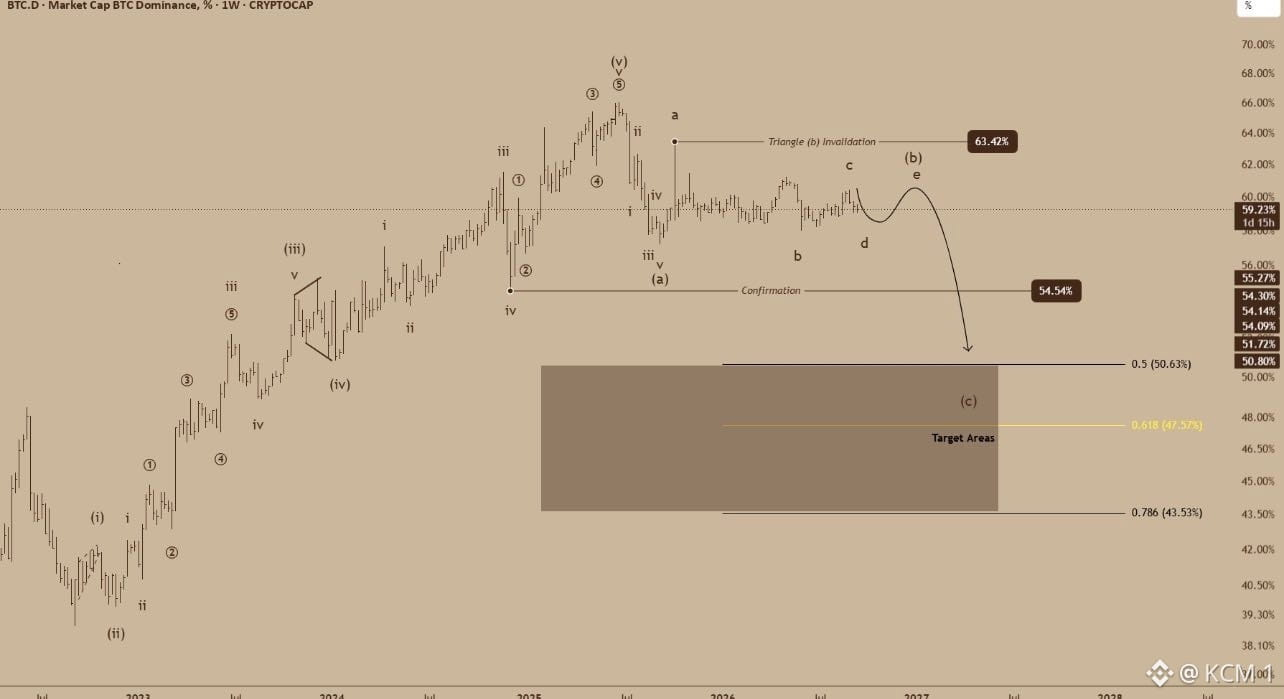
Пока биткоин-максималисты готовятся к росту доминирования, этот треугольник по волнам Эллиотта на $BTC .D сигнализирует о макро-сломe, который может проложить путь к продолжительному расширению альткоинов.
После завершения основной 5-волновой мотивной структуры доминирование рынка теперь консолидируется внутри корректирующей треугольной волны (b) с уровнем около 59,23% . Прогноз по волнам Эллиотта ожидает завершения заключительной подволны внутри треугольника перед развязкой в агрессивную нисходящую волну (c) импульса.
Удержание ниже уровня отмены сценария треугольника на 63,42% сохраняет рамки корректирующей консолидации. Пробой и недельное закрытие ниже подтверждающей поддержки на 54,54% запускают снижение волны (c) с целями в нижних зонах поддержки по Фибоначчи: 50,63% (0,5 Fib), 47,57% (0,618 Fib) и 43,53% (0,786 Fib).
Не игнорируйте сдвиги в доминировании рынка — следите за пробоем $BTC .D, чтобы подтвердить, когда ликвидность агрессивно перетекает в альты.
#BTC #BTC dominance #Altseason #CryptoAnalysis #TechnicalAnalysis
Пока биткоин-максималисты готовятся к росту доминирования, этот треугольник по волнам Эллиотта на $BTC .D сигнализирует о макро-сломe, который может проложить путь к продолжительному расширению альткоинов.
После завершения основной 5-волновой мотивной структуры доминирование рынка теперь консолидируется внутри корректирующей треугольной волны (b) с уровнем около 59,23% . Прогноз по волнам Эллиотта ожидает завершения заключительной подволны внутри треугольника перед развязкой в агрессивную нисходящую волну (c) импульса.
Удержание ниже уровня отмены сценария треугольника на 63,42% сохраняет рамки корректирующей консолидации. Пробой и недельное закрытие ниже подтверждающей поддержки на 54,54% запускают снижение волны (c) с целями в нижних зонах поддержки по Фибоначчи: 50,63% (0,5 Fib), 47,57% (0,618 Fib) и 43,53% (0,786 Fib).
Не игнорируйте сдвиги в доминировании рынка — следите за пробоем $BTC .D, чтобы подтвердить, когда ликвидность агрессивно перетекает в альты.
#BTC #BTC dominance #Altseason #CryptoAnalysis #TechnicalAnalysis
После завершения основной 5-волновой мотивной структуры доминирование рынка теперь консолидируется внутри корректирующей треугольной волны (b) с уровнем около 59,23% . Прогноз по волнам Эллиотта ожидает завершения заключительной подволны внутри треугольника перед развязкой в агрессивную нисходящую волну (c) импульса.
Удержание ниже уровня отмены сценария треугольника на 63,42% сохраняет рамки корректирующей консолидации. Пробой и недельное закрытие ниже подтверждающей поддержки на 54,54% запускают снижение волны (c) с целями в нижних зонах поддержки по Фибоначчи: 50,63% (0,5 Fib), 47,57% (0,618 Fib) и 43,53% (0,786 Fib).
Не игнорируйте сдвиги в доминировании рынка — следите за пробоем $BTC .D, чтобы подтвердить, когда ликвидность агрессивно перетекает в альты.
#BTC #BTC dominance #Altseason #CryptoAnalysis #TechnicalAnalysis
41
·
--
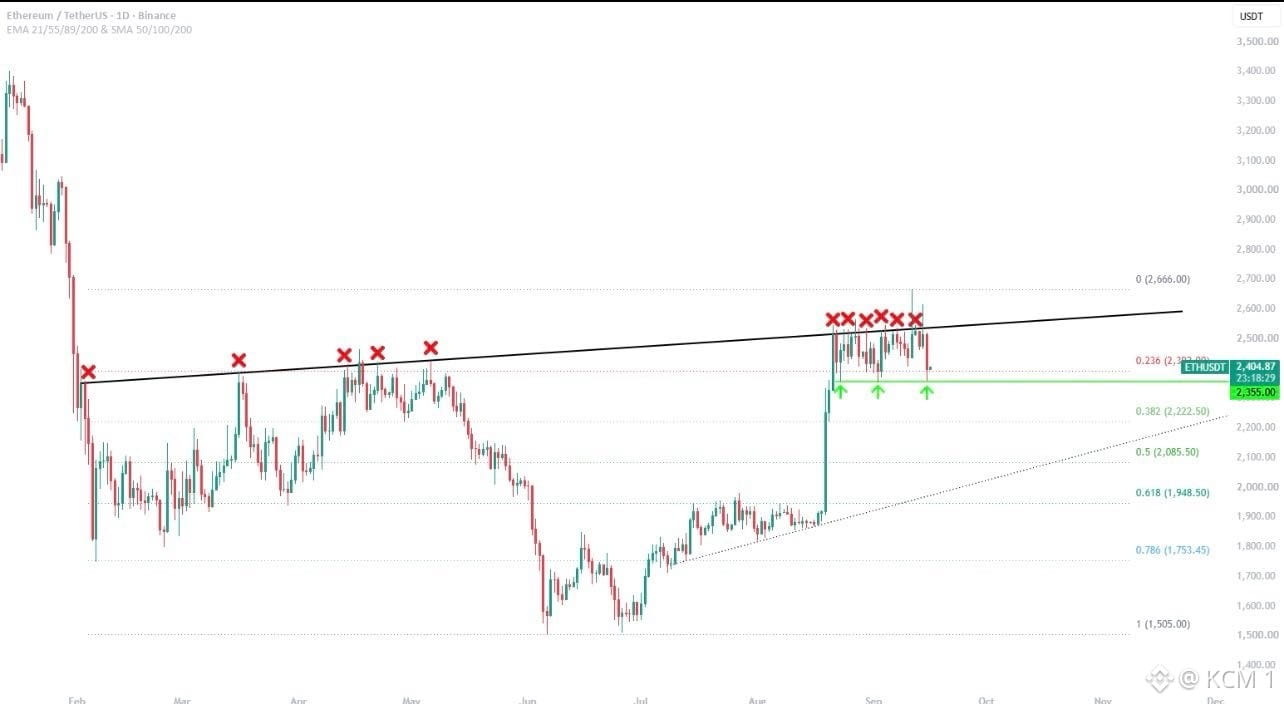
Хотя многие сосредотачиваются на повторяющихся отклонениях с верхних уровней, этот диапазон консолидации по $ETH удерживает критически важный горизонтальный уровень поддержки.
После неудачных попыток пробить восходящую линию сопротивления, отмеченную красными значками X для отклонения, цена откатилась к горизонтальной линии спроса на $2,355.00 . Повторяющиеся отскоки с этого уровня, отмеченные зелёными стрелками, указывают на сильный покупательский интерес, который поглощает давление от продаж сверху внутри диапазона консолидации.
Надёжное удержание выше $2,355.00 сохраняет активной бычью структуру накопления, подготавливая ещё одну попытку пробить динамическое сопротивление около $2,600.00 . Однако дневное закрытие ниже $2,355.00 аннулирует сценарий диапазона, открывая потенциал снижения к более низким уровням Фибоначчи на $2,222.50 и $2,085.50 .
Не паникуйте из‑за повторяющихся отклонений — наблюдайте, как цена защищает ключевые горизонтальные уровни поддержки, прежде чем начнётся следующее крупное движение.
#ETH #Ethereum #CryptoAnalysis #TechnicalAnalysis
Хотя многие сосредотачиваются на повторяющихся отклонениях с верхних уровней, этот диапазон консолидации по $ETH удерживает критически важный горизонтальный уровень поддержки.
После неудачных попыток пробить восходящую линию сопротивления, отмеченную красными значками X для отклонения, цена откатилась к горизонтальной линии спроса на $2,355.00 . Повторяющиеся отскоки с этого уровня, отмеченные зелёными стрелками, указывают на сильный покупательский интерес, который поглощает давление от продаж сверху внутри диапазона консолидации.
Надёжное удержание выше $2,355.00 сохраняет активной бычью структуру накопления, подготавливая ещё одну попытку пробить динамическое сопротивление около $2,600.00 . Однако дневное закрытие ниже $2,355.00 аннулирует сценарий диапазона, открывая потенциал снижения к более низким уровням Фибоначчи на $2,222.50 и $2,085.50 .
Не паникуйте из‑за повторяющихся отклонений — наблюдайте, как цена защищает ключевые горизонтальные уровни поддержки, прежде чем начнётся следующее крупное движение.
#ETH #Ethereum #CryptoAnalysis #TechnicalAnalysis
После неудачных попыток пробить восходящую линию сопротивления, отмеченную красными значками X для отклонения, цена откатилась к горизонтальной линии спроса на $2,355.00 . Повторяющиеся отскоки с этого уровня, отмеченные зелёными стрелками, указывают на сильный покупательский интерес, который поглощает давление от продаж сверху внутри диапазона консолидации.
Надёжное удержание выше $2,355.00 сохраняет активной бычью структуру накопления, подготавливая ещё одну попытку пробить динамическое сопротивление около $2,600.00 . Однако дневное закрытие ниже $2,355.00 аннулирует сценарий диапазона, открывая потенциал снижения к более низким уровням Фибоначчи на $2,222.50 и $2,085.50 .
Не паникуйте из‑за повторяющихся отклонений — наблюдайте, как цена защищает ключевые горизонтальные уровни поддержки, прежде чем начнётся следующее крупное движение.
#ETH #Ethereum #CryptoAnalysis #TechnicalAnalysis
55
·
--
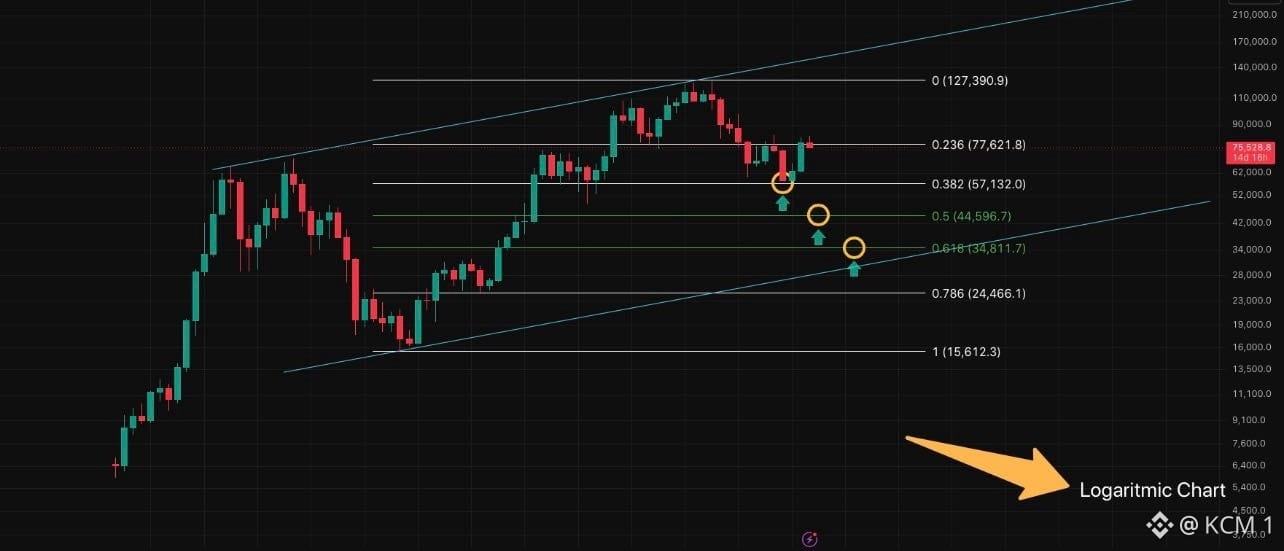
Пока быки празднуют локальные отскоки, эта логарифмическая конфигурация канала на $BTC сигнализирует о макро-коррекции, нацеленной на ключевые уровни Фибоначчи.
После пика вблизи верхней границы канала на $127,390.9 цена пробила вниз через промежуточную поддержку и сейчас тестирует уровень 0.236 Фиб около $77,621.8 . Неспособность удержать структуру верхнего диапазона подтверждает разворачивающийся макро-коррекционный цикл внутри многолетнего канала.
Отбой ниже $77,621.8 открывает последовательные цели снижения: уровень 0.382 Фиб на $57,132.0 , затем уровень 0.5 Фиб на $44,596.7 и уровень 0.618 Фиб на $34,811.7 . Для опровержения тезиса о макро-коррекции и восстановления бычьего импульса необходимо вернуть и удерживать цену выше $77,621.8 .
Не игнорируйте границы логарифмического канала — макро-уровни Фибоначчи указывают на глубокие рыночные коррекции.
#BTC #Bitcoin #CryptoAnalysis #TechnicalAnalysis
Пока быки празднуют локальные отскоки, эта логарифмическая конфигурация канала на $BTC сигнализирует о макро-коррекции, нацеленной на ключевые уровни Фибоначчи.
После пика вблизи верхней границы канала на $127,390.9 цена пробила вниз через промежуточную поддержку и сейчас тестирует уровень 0.236 Фиб около $77,621.8 . Неспособность удержать структуру верхнего диапазона подтверждает разворачивающийся макро-коррекционный цикл внутри многолетнего канала.
Отбой ниже $77,621.8 открывает последовательные цели снижения: уровень 0.382 Фиб на $57,132.0 , затем уровень 0.5 Фиб на $44,596.7 и уровень 0.618 Фиб на $34,811.7 . Для опровержения тезиса о макро-коррекции и восстановления бычьего импульса необходимо вернуть и удерживать цену выше $77,621.8 .
Не игнорируйте границы логарифмического канала — макро-уровни Фибоначчи указывают на глубокие рыночные коррекции.
#BTC #Bitcoin #CryptoAnalysis #TechnicalAnalysis
После пика вблизи верхней границы канала на $127,390.9 цена пробила вниз через промежуточную поддержку и сейчас тестирует уровень 0.236 Фиб около $77,621.8 . Неспособность удержать структуру верхнего диапазона подтверждает разворачивающийся макро-коррекционный цикл внутри многолетнего канала.
Отбой ниже $77,621.8 открывает последовательные цели снижения: уровень 0.382 Фиб на $57,132.0 , затем уровень 0.5 Фиб на $44,596.7 и уровень 0.618 Фиб на $34,811.7 . Для опровержения тезиса о макро-коррекции и восстановления бычьего импульса необходимо вернуть и удерживать цену выше $77,621.8 .
Не игнорируйте границы логарифмического канала — макро-уровни Фибоначчи указывают на глубокие рыночные коррекции.
#BTC #Bitcoin #CryptoAnalysis #TechnicalAnalysis
71
·
--
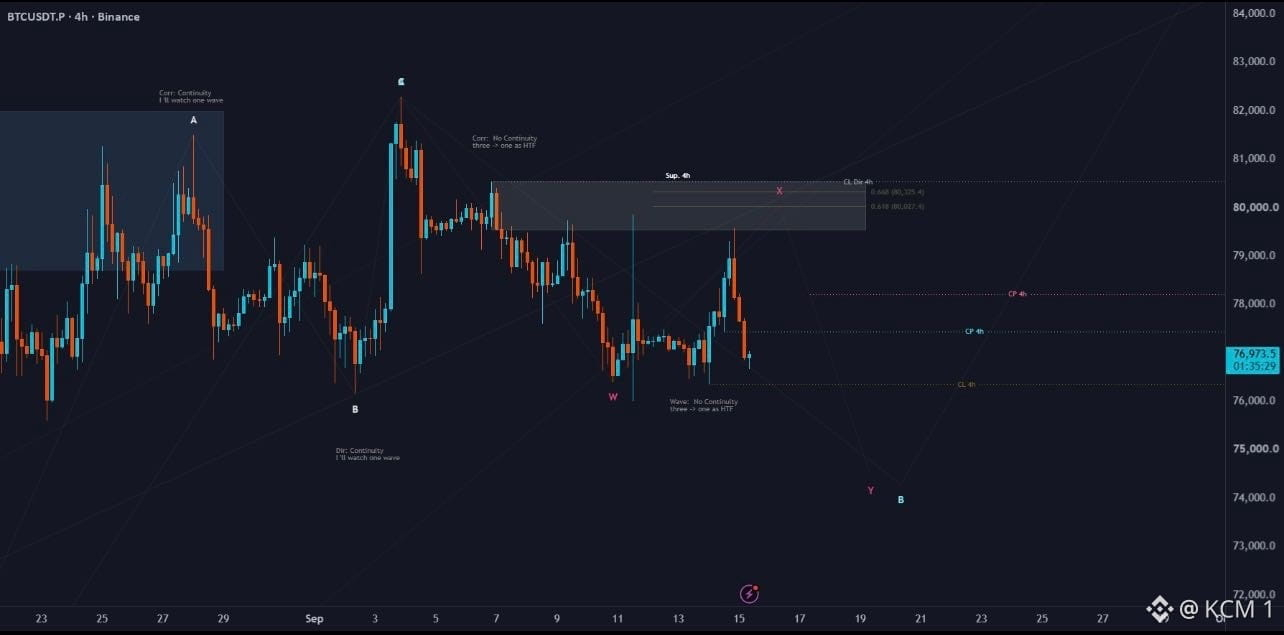
Пока консенсус наблюдает за локальным отскоком, эта разметка коррекционной волны по $BTC указывает на более глубокое структурное движение вниз, чтобы завершить коррекционный паттерн.
После отклонения от зоны предложения на 4-часовом таймфрейме неподалёку от $80,000 цена пробила поддержку на более младшем таймфрейме и торгуется ниже — около $76,973. Структура цены обозначает последовательность коррекционных волн (W-X-Y), где неудавшийся повторный тест области предложения сверху подтверждает контроль медведей на следующем нисходящем участке.
Удержание ниже потолка предложения на 4-часовом таймфрейме рядом с $80,000 сохраняет коррекционную гипотезу в силе, нацеливаясь на завершение нижней волны около $74,000. Надёжное восстановление и дневное закрытие выше $80,200 аннулирует сценарий с коррекционной волной, открывая путь для роста.
Не покупайте незавершённые коррекционные волны — дождитесь подтверждения структурного спроса в точке финального разворота.
#BTC #Bitcoin #CryptoAnalysis #TechnicalAnalysis
Пока консенсус наблюдает за локальным отскоком, эта разметка коррекционной волны по $BTC указывает на более глубокое структурное движение вниз, чтобы завершить коррекционный паттерн.
После отклонения от зоны предложения на 4-часовом таймфрейме неподалёку от $80,000 цена пробила поддержку на более младшем таймфрейме и торгуется ниже — около $76,973. Структура цены обозначает последовательность коррекционных волн (W-X-Y), где неудавшийся повторный тест области предложения сверху подтверждает контроль медведей на следующем нисходящем участке.
Удержание ниже потолка предложения на 4-часовом таймфрейме рядом с $80,000 сохраняет коррекционную гипотезу в силе, нацеливаясь на завершение нижней волны около $74,000. Надёжное восстановление и дневное закрытие выше $80,200 аннулирует сценарий с коррекционной волной, открывая путь для роста.
Не покупайте незавершённые коррекционные волны — дождитесь подтверждения структурного спроса в точке финального разворота.
#BTC #Bitcoin #CryptoAnalysis #TechnicalAnalysis
После отклонения от зоны предложения на 4-часовом таймфрейме неподалёку от $80,000 цена пробила поддержку на более младшем таймфрейме и торгуется ниже — около $76,973. Структура цены обозначает последовательность коррекционных волн (W-X-Y), где неудавшийся повторный тест области предложения сверху подтверждает контроль медведей на следующем нисходящем участке.
Удержание ниже потолка предложения на 4-часовом таймфрейме рядом с $80,000 сохраняет коррекционную гипотезу в силе, нацеливаясь на завершение нижней волны около $74,000. Надёжное восстановление и дневное закрытие выше $80,200 аннулирует сценарий с коррекционной волной, открывая путь для роста.
Не покупайте незавершённые коррекционные волны — дождитесь подтверждения структурного спроса в точке финального разворота.
#BTC #Bitcoin #CryptoAnalysis #TechnicalAnalysis
69
·
--
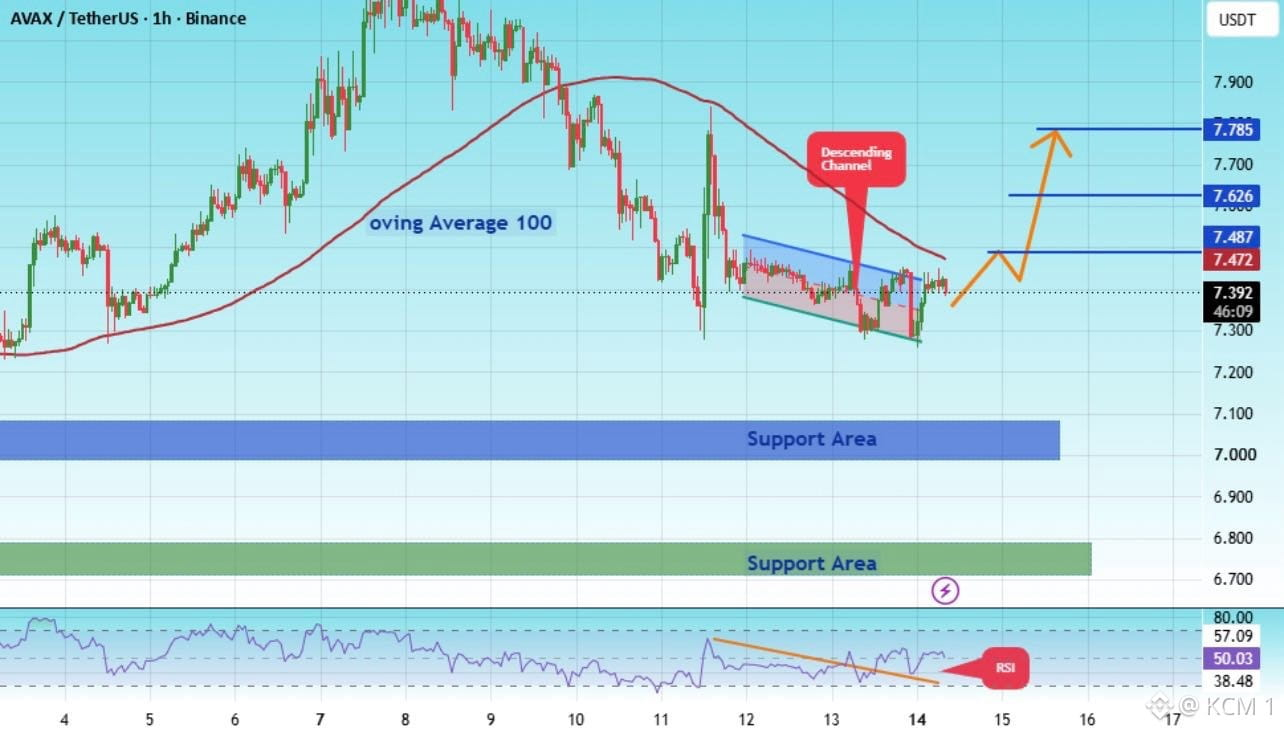
Все следят за этим плотным консолидационным диапазоном по $AVAX , но упускают прорыв RSI, который подготавливает крупный разворот в рамках канала.
После отката ниже 100-периодной скользящей средней на 1-часовом графике цена сжимается внутри узкого нисходящего канала над $7.300 . Параллельно RSI пробил свою нисходящую трендовую линию, сигнализируя о притоке бычьего импульса до того, как цена сделает свой ход.
Четкий пробой выше $7.472 подтверждает разворот паттерна, открывая путь к последовательным целям роста на $7.626 и $7.785 . Удержание выше ключевых зон поддержки около $7.050 и $6.750 сохраняет настрой на дальнейшее бычье продолжение полностью в силе.
Не ждите расширения цены — индикаторы импульса опережают прорыв еще до подтверждения ценой.
#AVAX #Avalanche #CryptoAnalysis #TechnicalAnalysis
Все следят за этим плотным консолидационным диапазоном по $AVAX , но упускают прорыв RSI, который подготавливает крупный разворот в рамках канала.
После отката ниже 100-периодной скользящей средней на 1-часовом графике цена сжимается внутри узкого нисходящего канала над $7.300 . Параллельно RSI пробил свою нисходящую трендовую линию, сигнализируя о притоке бычьего импульса до того, как цена сделает свой ход.
Четкий пробой выше $7.472 подтверждает разворот паттерна, открывая путь к последовательным целям роста на $7.626 и $7.785 . Удержание выше ключевых зон поддержки около $7.050 и $6.750 сохраняет настрой на дальнейшее бычье продолжение полностью в силе.
Не ждите расширения цены — индикаторы импульса опережают прорыв еще до подтверждения ценой.
#AVAX #Avalanche #CryptoAnalysis #TechnicalAnalysis
После отката ниже 100-периодной скользящей средней на 1-часовом графике цена сжимается внутри узкого нисходящего канала над $7.300 . Параллельно RSI пробил свою нисходящую трендовую линию, сигнализируя о притоке бычьего импульса до того, как цена сделает свой ход.
Четкий пробой выше $7.472 подтверждает разворот паттерна, открывая путь к последовательным целям роста на $7.626 и $7.785 . Удержание выше ключевых зон поддержки около $7.050 и $6.750 сохраняет настрой на дальнейшее бычье продолжение полностью в силе.
Не ждите расширения цены — индикаторы импульса опережают прорыв еще до подтверждения ценой.
#AVAX #Avalanche #CryptoAnalysis #TechnicalAnalysis
70
·
--
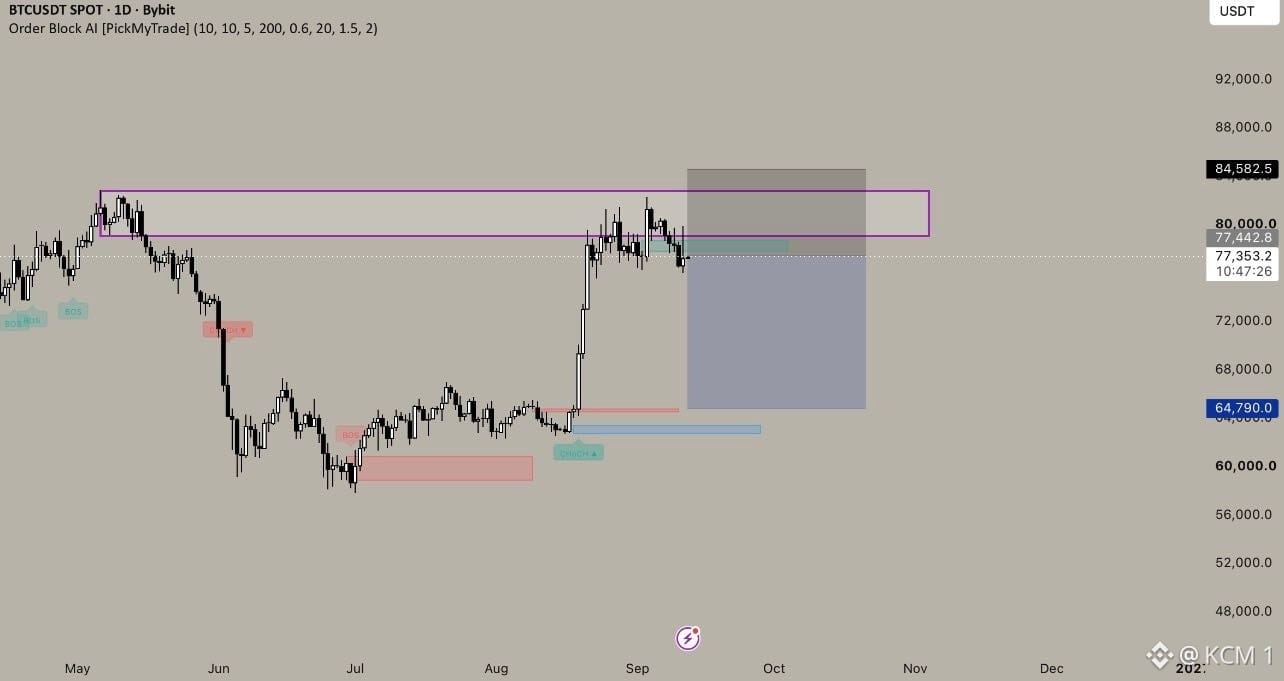
Пока покупатели, совершающие пробой, гонятся за более высокими уровнями, эта короткая торговая установка по $BTC готовится к чистому захвату ликвидности ниже.
После повторного тестирования основного дневного order block рядом с $80,000 цена резко отклонилась от зоны предложения примерно у $84,582. Текущая реакция указывает на распределение на сопротивлении, сохраняя актуальность шорт-сценария для отката обратно к ключевому блоку спроса.
Удержание ниже уровня аннулирования на $84,582 сохраняет активность короткой сделки, с целями на полный захват ликвидности вниз до $64,790. Пробой и дневное закрытие выше $84,582 аннулируют сценарий и открывают путь для макро-бычьего расширения.
Не покупайте, подстраиваясь под верхние order block: пусть сопротивление подтвердит отклонение, прежде чем торговать откат.
#BTC #Bitcoin #CryptoAnalysis #TechnicalAnalysis
Пока покупатели, совершающие пробой, гонятся за более высокими уровнями, эта короткая торговая установка по $BTC готовится к чистому захвату ликвидности ниже.
После повторного тестирования основного дневного order block рядом с $80,000 цена резко отклонилась от зоны предложения примерно у $84,582. Текущая реакция указывает на распределение на сопротивлении, сохраняя актуальность шорт-сценария для отката обратно к ключевому блоку спроса.
Удержание ниже уровня аннулирования на $84,582 сохраняет активность короткой сделки, с целями на полный захват ликвидности вниз до $64,790. Пробой и дневное закрытие выше $84,582 аннулируют сценарий и открывают путь для макро-бычьего расширения.
Не покупайте, подстраиваясь под верхние order block: пусть сопротивление подтвердит отклонение, прежде чем торговать откат.
#BTC #Bitcoin #CryptoAnalysis #TechnicalAnalysis
После повторного тестирования основного дневного order block рядом с $80,000 цена резко отклонилась от зоны предложения примерно у $84,582. Текущая реакция указывает на распределение на сопротивлении, сохраняя актуальность шорт-сценария для отката обратно к ключевому блоку спроса.
Удержание ниже уровня аннулирования на $84,582 сохраняет активность короткой сделки, с целями на полный захват ликвидности вниз до $64,790. Пробой и дневное закрытие выше $84,582 аннулируют сценарий и открывают путь для макро-бычьего расширения.
Не покупайте, подстраиваясь под верхние order block: пусть сопротивление подтвердит отклонение, прежде чем торговать откат.
#BTC #Bitcoin #CryptoAnalysis #TechnicalAnalysis
51
·
--
Все смотрят, как этот резкий рельеф отскакивает, но упускают двойной верх с отклонением и проверку дополнительного сопротивления на уровне около $79,800 .
После снижения из восходящего клина и падения до $77,800 цена устроила краткий откат прямо к ключевому сопротивлению. Отвержение на пунктирной горизонтальной линии указывает на активность продавцов, что создает потенциальные цели снижения на $77,800 и вторую целевую зону примерно около $77,000 .
Пробой ниже $78,828 подтверждает медвежье продолжение в сторону нижних целевых зон. Однако сильный пробой вверх выше $79,800 аннулирует короткую идею и снова открывает восходящий импульс в направлении $80,200 .
Не покупайте «отскок» слишком рано — дождитесь, пока структура рынка подтвердит отклонение, прежде чем торговать это движение.
#BTC #Bitcoin #CryptoAnalysis #TechnicalAnalysis
Все смотрят, как этот резкий рельеф отскакивает, но упускают двойной верх с отклонением и проверку дополнительного сопротивления на уровне около $79,800 .
После снижения из восходящего клина и падения до $77,800 цена устроила краткий откат прямо к ключевому сопротивлению. Отвержение на пунктирной горизонтальной линии указывает на активность продавцов, что создает потенциальные цели снижения на $77,800 и вторую целевую зону примерно около $77,000 .
Пробой ниже $78,828 подтверждает медвежье продолжение в сторону нижних целевых зон. Однако сильный пробой вверх выше $79,800 аннулирует короткую идею и снова открывает восходящий импульс в направлении $80,200 .
Не покупайте «отскок» слишком рано — дождитесь, пока структура рынка подтвердит отклонение, прежде чем торговать это движение.
#BTC #Bitcoin #CryptoAnalysis #TechnicalAnalysis
После снижения из восходящего клина и падения до $77,800 цена устроила краткий откат прямо к ключевому сопротивлению. Отвержение на пунктирной горизонтальной линии указывает на активность продавцов, что создает потенциальные цели снижения на $77,800 и вторую целевую зону примерно около $77,000 .
Пробой ниже $78,828 подтверждает медвежье продолжение в сторону нижних целевых зон. Однако сильный пробой вверх выше $79,800 аннулирует короткую идею и снова открывает восходящий импульс в направлении $80,200 .
Не покупайте «отскок» слишком рано — дождитесь, пока структура рынка подтвердит отклонение, прежде чем торговать это движение.
#BTC #Bitcoin #CryptoAnalysis #TechnicalAnalysis

63
·
--
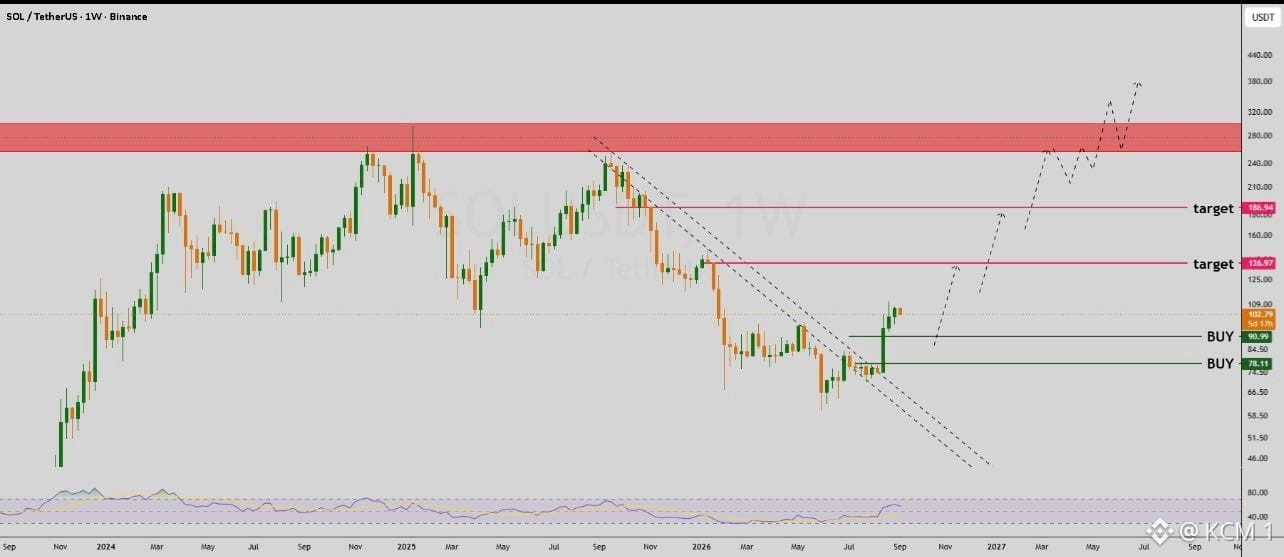
Все следят за этим недельным разворотом по $SOL , но упускают многомесячный пробой трендовой линии, который подтверждает ключевой макро-поворот.
После пробоя нисходящего параллельного канала цена вернула ключевую структурную поддержку выше зоны покупки $90.99. Это сильное бычье расширение на недельном таймфрейме сигнализирует о долгосрочном изменении характера движения, расчищая месяцы консолидации с более низкими максимумами.
Удержание выше уровней накопления $90.99 и $78.11 подтверждает макро-долгосрочный сетап, открывая последовательные цели роста: $138.97 и $186.94 . Поддержание этого импульса прокладывает путь к многоэтапному движению к главному уровню сопротивления над $260.00 .
Не игнорируйте пробои недельных трендовых линий — макроструктурные сдвиги формируют самые крупные макро-движения.
#SOL #Solana #CryptoAnalysis #TechnicalAnalysis
Все следят за этим недельным разворотом по $SOL , но упускают многомесячный пробой трендовой линии, который подтверждает ключевой макро-поворот.
После пробоя нисходящего параллельного канала цена вернула ключевую структурную поддержку выше зоны покупки $90.99. Это сильное бычье расширение на недельном таймфрейме сигнализирует о долгосрочном изменении характера движения, расчищая месяцы консолидации с более низкими максимумами.
Удержание выше уровней накопления $90.99 и $78.11 подтверждает макро-долгосрочный сетап, открывая последовательные цели роста: $138.97 и $186.94 . Поддержание этого импульса прокладывает путь к многоэтапному движению к главному уровню сопротивления над $260.00 .
Не игнорируйте пробои недельных трендовых линий — макроструктурные сдвиги формируют самые крупные макро-движения.
#SOL #Solana #CryptoAnalysis #TechnicalAnalysis
После пробоя нисходящего параллельного канала цена вернула ключевую структурную поддержку выше зоны покупки $90.99. Это сильное бычье расширение на недельном таймфрейме сигнализирует о долгосрочном изменении характера движения, расчищая месяцы консолидации с более низкими максимумами.
Удержание выше уровней накопления $90.99 и $78.11 подтверждает макро-долгосрочный сетап, открывая последовательные цели роста: $138.97 и $186.94 . Поддержание этого импульса прокладывает путь к многоэтапному движению к главному уровню сопротивления над $260.00 .
Не игнорируйте пробои недельных трендовых линий — макроструктурные сдвиги формируют самые крупные макро-движения.
#SOL #Solana #CryptoAnalysis #TechnicalAnalysis
65
·
--
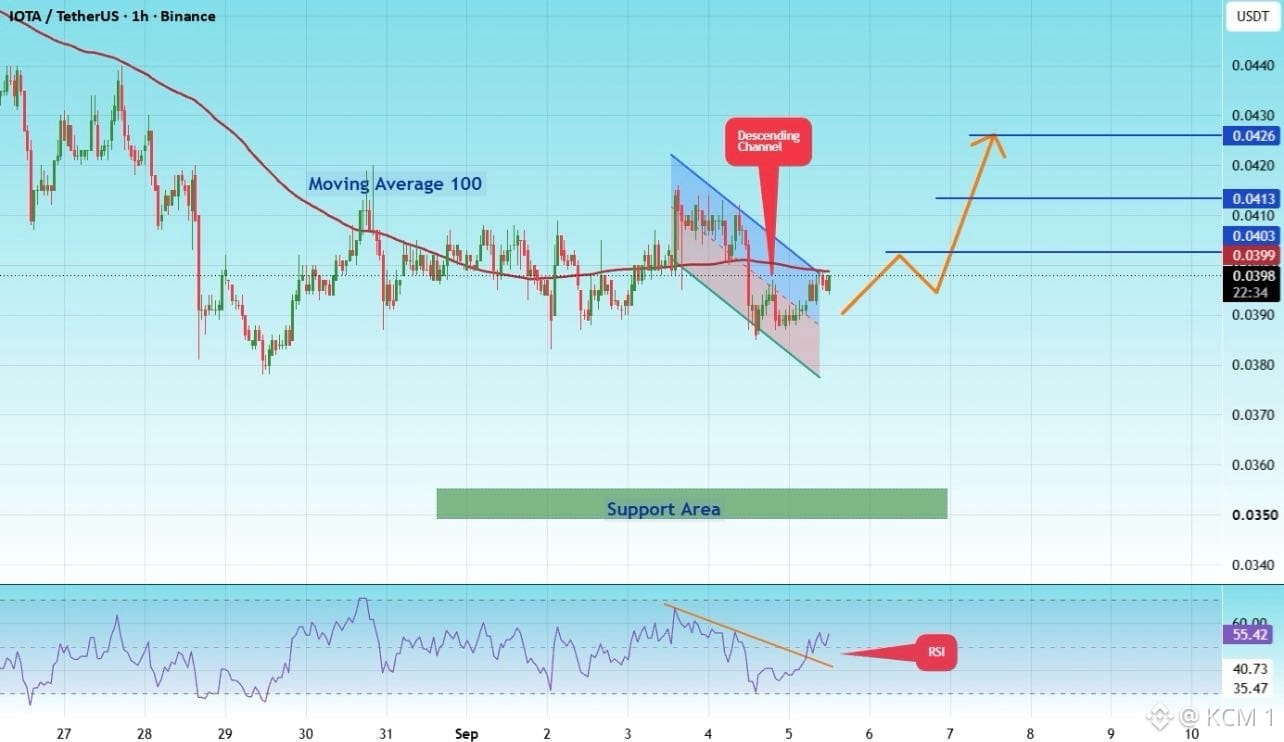
Все следят за этим крутым нисходящим каналом по $IOTA, но упускают бычью дивергенцию, которая формируется на RSI.
После консолидации около 100-периодной скользящей средней на 1-часовом графике цена тестирует верхнюю границу своей локальной нисходящей структуры. Тем временем RSI пробил свою нисходящую трендовую линию, сигнализируя о нарастании покупательского импульса под поверхностью до того, как цена отреагирует.
Чистый пробой выше $0.0399 подтверждает сценарий разворота, открывая путь к промежуточным целям по сопротивлению: $0.0403 , $0.0413 и $0.0426 . Удержание выше зоны локальной поддержки около $0.0350 сохраняет бычий тезис полностью актуальным.
Не ждите полного расширения свечи — наблюдайте, как импульс выводит цену из локальных моделей консолидации.
#IOTA #CryptoAnalysis #TechnicalAnalysis #Trading
Все следят за этим крутым нисходящим каналом по $IOTA, но упускают бычью дивергенцию, которая формируется на RSI.
После консолидации около 100-периодной скользящей средней на 1-часовом графике цена тестирует верхнюю границу своей локальной нисходящей структуры. Тем временем RSI пробил свою нисходящую трендовую линию, сигнализируя о нарастании покупательского импульса под поверхностью до того, как цена отреагирует.
Чистый пробой выше $0.0399 подтверждает сценарий разворота, открывая путь к промежуточным целям по сопротивлению: $0.0403 , $0.0413 и $0.0426 . Удержание выше зоны локальной поддержки около $0.0350 сохраняет бычий тезис полностью актуальным.
Не ждите полного расширения свечи — наблюдайте, как импульс выводит цену из локальных моделей консолидации.
#IOTA #CryptoAnalysis #TechnicalAnalysis #Trading
После консолидации около 100-периодной скользящей средней на 1-часовом графике цена тестирует верхнюю границу своей локальной нисходящей структуры. Тем временем RSI пробил свою нисходящую трендовую линию, сигнализируя о нарастании покупательского импульса под поверхностью до того, как цена отреагирует.
Чистый пробой выше $0.0399 подтверждает сценарий разворота, открывая путь к промежуточным целям по сопротивлению: $0.0403 , $0.0413 и $0.0426 . Удержание выше зоны локальной поддержки около $0.0350 сохраняет бычий тезис полностью актуальным.
Не ждите полного расширения свечи — наблюдайте, как импульс выводит цену из локальных моделей консолидации.
#IOTA #CryptoAnalysis #TechnicalAnalysis #Trading
56
·
--
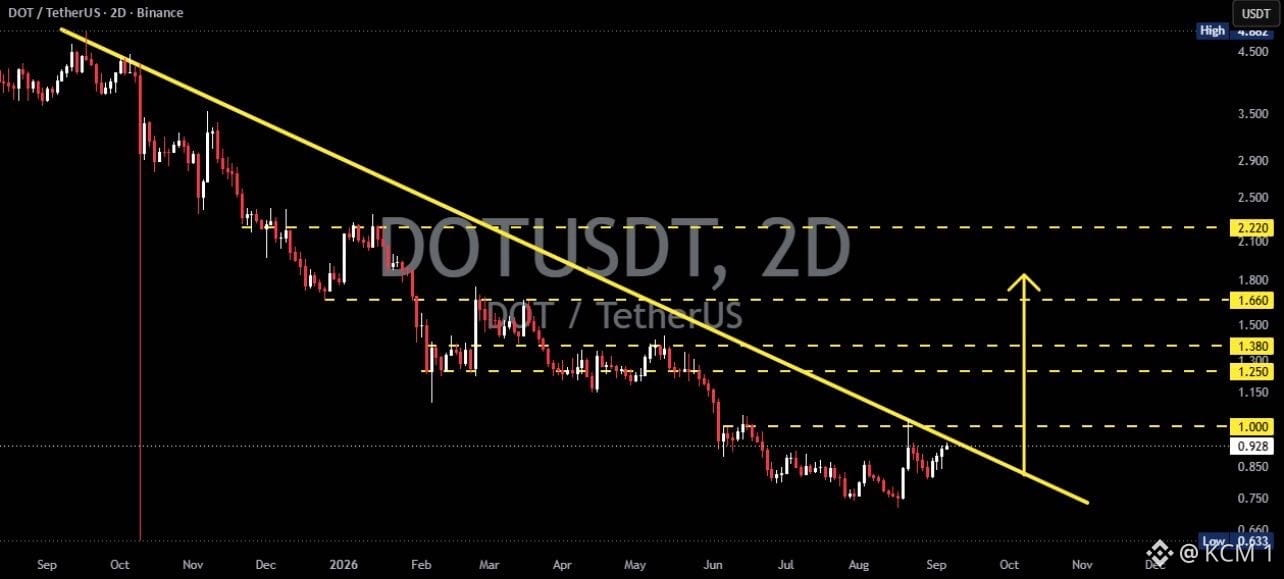
Все следят за этим многомесячным нисходящим трендом по $DOT , но упускают потенциальный пробой трендовой линии, который сжимается у локального сопротивления.
После месяцев более низких максимумов, ограниченных крутой жёлтой диагональной линией тренда, цена сейчас пытается преодолеть сопротивление около $0.928 у макро-основания. Чистый пробой вверх над этой диагональной «преградой» сигнализирует о смене структурного характера движения: импульс от продолжительного распределения переходит к раннему накоплению.
Пробой уровня $1.000 подтверждает выход из трендовой линии и открывает последовательные восходящие цели: $1.250 , $1.380 , и $1.660 . Однако если не удастся пробить диагональное сопротивление, $DOT может стать уязвимым для повторного теста поддержки в районе $0.750 .
Не торгуйте линию — дождитесь, пока рыночная структура подтвердит пробой над ключевым сопротивлением.
#DOT #Polkadot #CryptoAnalysis #TechnicalAnalysis
Все следят за этим многомесячным нисходящим трендом по $DOT , но упускают потенциальный пробой трендовой линии, который сжимается у локального сопротивления.
После месяцев более низких максимумов, ограниченных крутой жёлтой диагональной линией тренда, цена сейчас пытается преодолеть сопротивление около $0.928 у макро-основания. Чистый пробой вверх над этой диагональной «преградой» сигнализирует о смене структурного характера движения: импульс от продолжительного распределения переходит к раннему накоплению.
Пробой уровня $1.000 подтверждает выход из трендовой линии и открывает последовательные восходящие цели: $1.250 , $1.380 , и $1.660 . Однако если не удастся пробить диагональное сопротивление, $DOT может стать уязвимым для повторного теста поддержки в районе $0.750 .
Не торгуйте линию — дождитесь, пока рыночная структура подтвердит пробой над ключевым сопротивлением.
#DOT #Polkadot #CryptoAnalysis #TechnicalAnalysis
После месяцев более низких максимумов, ограниченных крутой жёлтой диагональной линией тренда, цена сейчас пытается преодолеть сопротивление около $0.928 у макро-основания. Чистый пробой вверх над этой диагональной «преградой» сигнализирует о смене структурного характера движения: импульс от продолжительного распределения переходит к раннему накоплению.
Пробой уровня $1.000 подтверждает выход из трендовой линии и открывает последовательные восходящие цели: $1.250 , $1.380 , и $1.660 . Однако если не удастся пробить диагональное сопротивление, $DOT может стать уязвимым для повторного теста поддержки в районе $0.750 .
Не торгуйте линию — дождитесь, пока рыночная структура подтвердит пробой над ключевым сопротивлением.
#DOT #Polkadot #CryptoAnalysis #TechnicalAnalysis
75
·
--
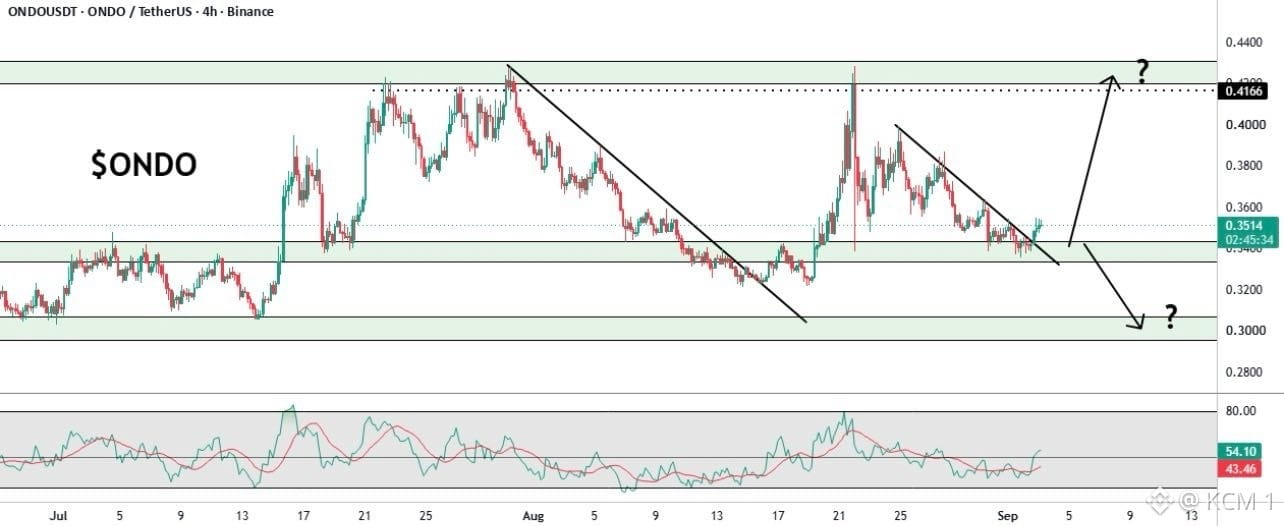
Пока рынок спорит о направлении на локальной поддержке, этот узел принятия решения по $ONDO задаёт чёткий триггер бинарного расширения.
После пробоя локальной нисходящей трендовой линии цена делает повторный тест динамической поддержки около $0.3400 внутри ключевого горизонтального блока спроса. RSI, поднимающийся обратно выше 50, указывает на скрытую бычью динамику, которая пытается вернуть контроль над структурой на младшем таймфрейме.
Надёжное удержание выше $0.3400 открывает прямой путь для бычьего движения к сопротивлению сверху на уровне $0.4166 . Однако неспособность удержать поддержку повышает риск пробойного повторного теста в сторону более низкого макроспроса около $0.3000 .
Не делайте прогноз слишком рано — пусть повторный тест на поддержке подтвердит направление расширения.
#ONDO #OndoFinance #CryptoAnalysis #TechnicalAnalysis
Пока рынок спорит о направлении на локальной поддержке, этот узел принятия решения по $ONDO задаёт чёткий триггер бинарного расширения.
После пробоя локальной нисходящей трендовой линии цена делает повторный тест динамической поддержки около $0.3400 внутри ключевого горизонтального блока спроса. RSI, поднимающийся обратно выше 50, указывает на скрытую бычью динамику, которая пытается вернуть контроль над структурой на младшем таймфрейме.
Надёжное удержание выше $0.3400 открывает прямой путь для бычьего движения к сопротивлению сверху на уровне $0.4166 . Однако неспособность удержать поддержку повышает риск пробойного повторного теста в сторону более низкого макроспроса около $0.3000 .
Не делайте прогноз слишком рано — пусть повторный тест на поддержке подтвердит направление расширения.
#ONDO #OndoFinance #CryptoAnalysis #TechnicalAnalysis
После пробоя локальной нисходящей трендовой линии цена делает повторный тест динамической поддержки около $0.3400 внутри ключевого горизонтального блока спроса. RSI, поднимающийся обратно выше 50, указывает на скрытую бычью динамику, которая пытается вернуть контроль над структурой на младшем таймфрейме.
Надёжное удержание выше $0.3400 открывает прямой путь для бычьего движения к сопротивлению сверху на уровне $0.4166 . Однако неспособность удержать поддержку повышает риск пробойного повторного теста в сторону более низкого макроспроса около $0.3000 .
Не делайте прогноз слишком рано — пусть повторный тест на поддержке подтвердит направление расширения.
#ONDO #OndoFinance #CryptoAnalysis #TechnicalAnalysis
76
·
--
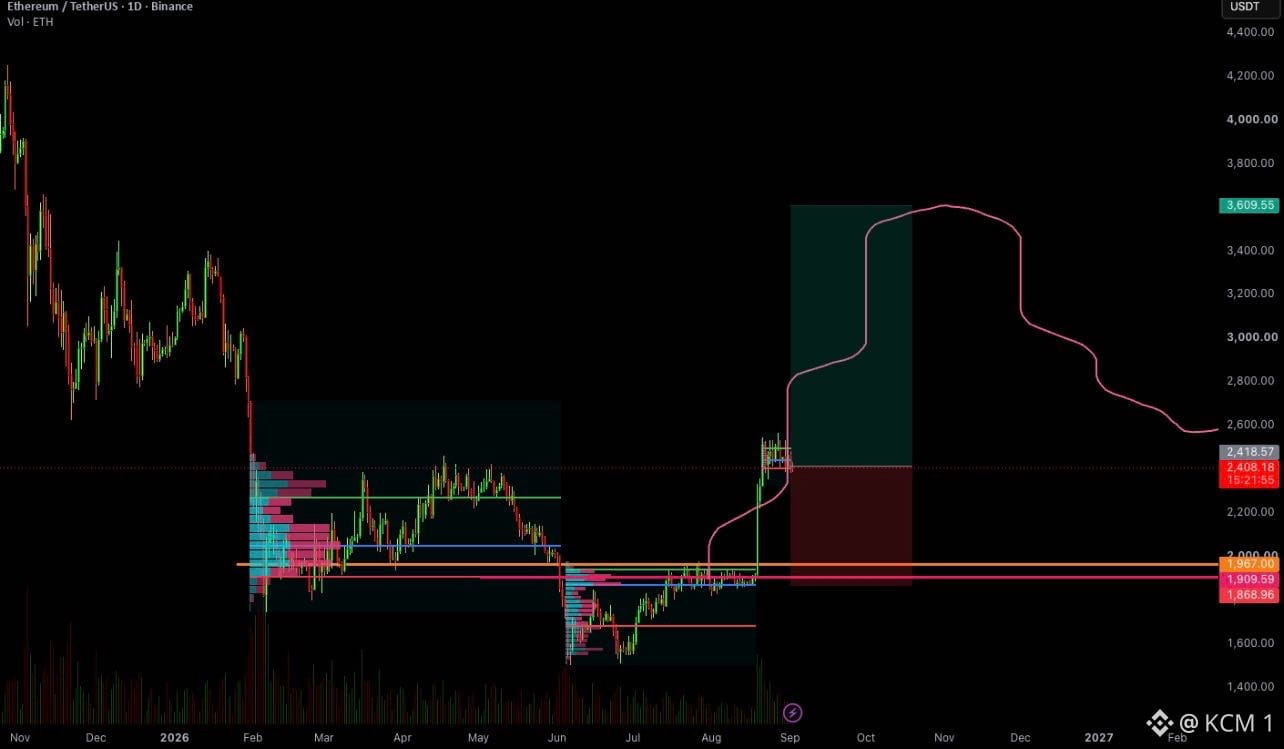
Хотя консенсус ожидает прямой восходящий путь, эта проекция по $ETH отображает высокоубеждённый макро-дорожный план на протяжении следующей фазы цикла.
После возврата ключевого уровня консолидации $2 400 ценовое движение формирует более высокий минимум над опорой крупного профиля объёма. Прогнозируемая кривая моделирует агрессивный импульс расширения к $3 600, за которым следует затяжная фаза макрокоррекции в начале 2027 года.
Удержание выше основного уровня недействительности около $1 900 сохраняет полностью неповреждённым долгосрочный бычий сценарий расширения. Возврат сопротивления в виде нависающих объёмов открывает дверь для значительного потенциала роста до того, как рынок достигнет пика текущего цикла.
Сфокусируйтесь на макроструктуре, а не на дневном шуме — именно более крупная рамка тренда определяет реальные движения.
#ETH #Ethereum #CryptoAnalysis #TechnicalAnalysis
Хотя консенсус ожидает прямой восходящий путь, эта проекция по $ETH отображает высокоубеждённый макро-дорожный план на протяжении следующей фазы цикла.
После возврата ключевого уровня консолидации $2 400 ценовое движение формирует более высокий минимум над опорой крупного профиля объёма. Прогнозируемая кривая моделирует агрессивный импульс расширения к $3 600, за которым следует затяжная фаза макрокоррекции в начале 2027 года.
Удержание выше основного уровня недействительности около $1 900 сохраняет полностью неповреждённым долгосрочный бычий сценарий расширения. Возврат сопротивления в виде нависающих объёмов открывает дверь для значительного потенциала роста до того, как рынок достигнет пика текущего цикла.
Сфокусируйтесь на макроструктуре, а не на дневном шуме — именно более крупная рамка тренда определяет реальные движения.
#ETH #Ethereum #CryptoAnalysis #TechnicalAnalysis
После возврата ключевого уровня консолидации $2 400 ценовое движение формирует более высокий минимум над опорой крупного профиля объёма. Прогнозируемая кривая моделирует агрессивный импульс расширения к $3 600, за которым следует затяжная фаза макрокоррекции в начале 2027 года.
Удержание выше основного уровня недействительности около $1 900 сохраняет полностью неповреждённым долгосрочный бычий сценарий расширения. Возврат сопротивления в виде нависающих объёмов открывает дверь для значительного потенциала роста до того, как рынок достигнет пика текущего цикла.
Сфокусируйтесь на макроструктуре, а не на дневном шуме — именно более крупная рамка тренда определяет реальные движения.
#ETH #Ethereum #CryptoAnalysis #TechnicalAnalysis
70
·
--
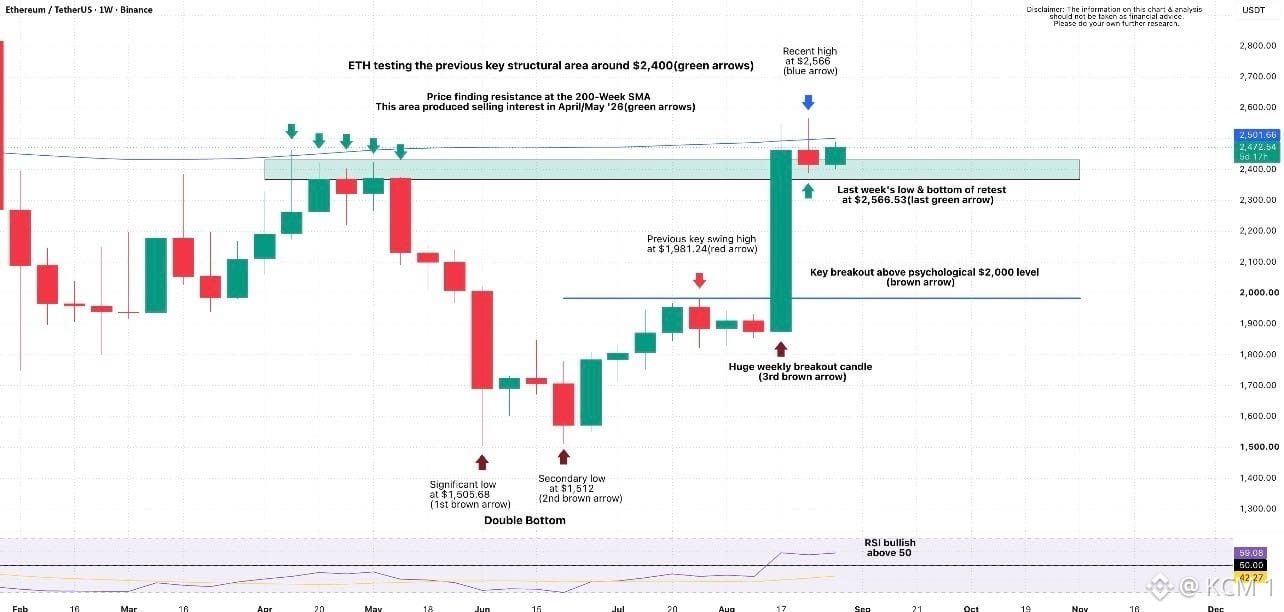
Каждый следит за этим еженедельным ретестом по $ETH, но упускает макро-«двойное дно» как фундамент, который и приводит к пробою.
После формирования надежного основания «двойное дно» рядом с $1,505 и прорыва выше психологической отметки $2,000 цена напрямую расширилась в ключевую зону структурного сопротивления около $2,400. Огромная зеленая недельная пробойная свеча подтверждает сильный институциональный спрос, повторно входящий на рынок.
Удержание выше бывшего горизонтального потолка около $2,400 переворачивает историческое предложение в новую структурную поддержку. Когда недельный RSI удерживается бычьим образом выше 50, успешный ретест этой зоны открывает путь к расширению выше недавнего максимума на $2,566.
Не позволяйте небольшим ретестам выбивать вас из позиции — смотрите, как прежние зоны сопротивления превращаются в прочную бычью поддержку.
#ETH #Ethereum #CryptoAnalysis #TechnicalAnalysis
Каждый следит за этим еженедельным ретестом по $ETH, но упускает макро-«двойное дно» как фундамент, который и приводит к пробою.
После формирования надежного основания «двойное дно» рядом с $1,505 и прорыва выше психологической отметки $2,000 цена напрямую расширилась в ключевую зону структурного сопротивления около $2,400. Огромная зеленая недельная пробойная свеча подтверждает сильный институциональный спрос, повторно входящий на рынок.
Удержание выше бывшего горизонтального потолка около $2,400 переворачивает историческое предложение в новую структурную поддержку. Когда недельный RSI удерживается бычьим образом выше 50, успешный ретест этой зоны открывает путь к расширению выше недавнего максимума на $2,566.
Не позволяйте небольшим ретестам выбивать вас из позиции — смотрите, как прежние зоны сопротивления превращаются в прочную бычью поддержку.
#ETH #Ethereum #CryptoAnalysis #TechnicalAnalysis
После формирования надежного основания «двойное дно» рядом с $1,505 и прорыва выше психологической отметки $2,000 цена напрямую расширилась в ключевую зону структурного сопротивления около $2,400. Огромная зеленая недельная пробойная свеча подтверждает сильный институциональный спрос, повторно входящий на рынок.
Удержание выше бывшего горизонтального потолка около $2,400 переворачивает историческое предложение в новую структурную поддержку. Когда недельный RSI удерживается бычьим образом выше 50, успешный ретест этой зоны открывает путь к расширению выше недавнего максимума на $2,566.
Не позволяйте небольшим ретестам выбивать вас из позиции — смотрите, как прежние зоны сопротивления превращаются в прочную бычью поддержку.
#ETH #Ethereum #CryptoAnalysis #TechnicalAnalysis
97
·
--
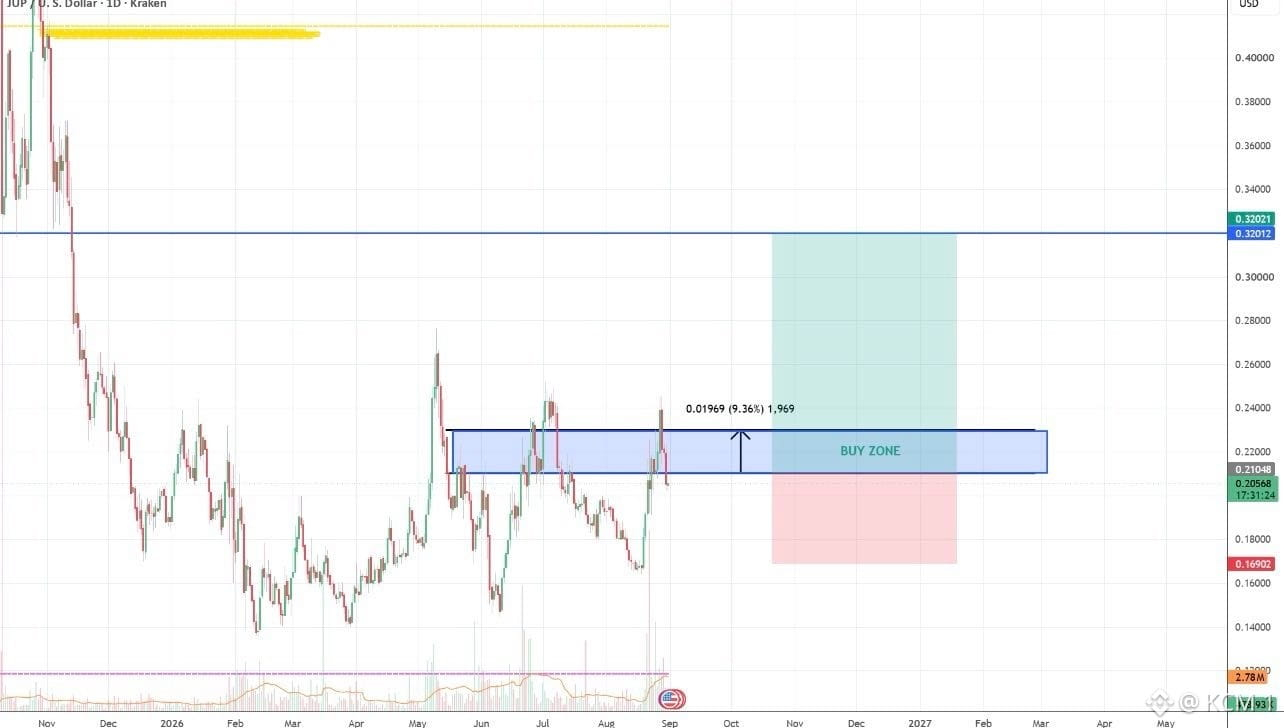
Все следят за этим консолидационным движением по $JUP, но упускают ключевой demand-блок, который формирует высоковероятный лонг-сетап.
После того как был найден макро-низ около $0.1400 и сформирована структура с более высоким минимумом, цена тестирует основную зону накопления внутри диапазона покупки $0.2100–$0.2300. Повторяющиеся отскоки от этого горизонтального уровня показывают, что покупатели последовательно защищают базу от распродаж на младших таймфреймах.
Удержание выше нижней границы около $0.2050 подтверждает торговый сетап и открывает путь к бычьему расширению в сторону верхней цели по сопротивлению на $0.3200. Стоп-лосс около $0.1690 защищает от любых сценариев макро-пробоя, которые могут устроить «снос» ликвидности.
Терпеливые покупатели накапливают позицию внутри ключевых зон спроса до того, как начнется фаза расширения.
#JUP #Jupiter #CryptoAnalysis #TechnicalAnalysis
Все следят за этим консолидационным движением по $JUP, но упускают ключевой demand-блок, который формирует высоковероятный лонг-сетап.
После того как был найден макро-низ около $0.1400 и сформирована структура с более высоким минимумом, цена тестирует основную зону накопления внутри диапазона покупки $0.2100–$0.2300. Повторяющиеся отскоки от этого горизонтального уровня показывают, что покупатели последовательно защищают базу от распродаж на младших таймфреймах.
Удержание выше нижней границы около $0.2050 подтверждает торговый сетап и открывает путь к бычьему расширению в сторону верхней цели по сопротивлению на $0.3200. Стоп-лосс около $0.1690 защищает от любых сценариев макро-пробоя, которые могут устроить «снос» ликвидности.
Терпеливые покупатели накапливают позицию внутри ключевых зон спроса до того, как начнется фаза расширения.
#JUP #Jupiter #CryptoAnalysis #TechnicalAnalysis
После того как был найден макро-низ около $0.1400 и сформирована структура с более высоким минимумом, цена тестирует основную зону накопления внутри диапазона покупки $0.2100–$0.2300. Повторяющиеся отскоки от этого горизонтального уровня показывают, что покупатели последовательно защищают базу от распродаж на младших таймфреймах.
Удержание выше нижней границы около $0.2050 подтверждает торговый сетап и открывает путь к бычьему расширению в сторону верхней цели по сопротивлению на $0.3200. Стоп-лосс около $0.1690 защищает от любых сценариев макро-пробоя, которые могут устроить «снос» ликвидности.
Терпеливые покупатели накапливают позицию внутри ключевых зон спроса до того, как начнется фаза расширения.
#JUP #Jupiter #CryptoAnalysis #TechnicalAnalysis
80
·
--
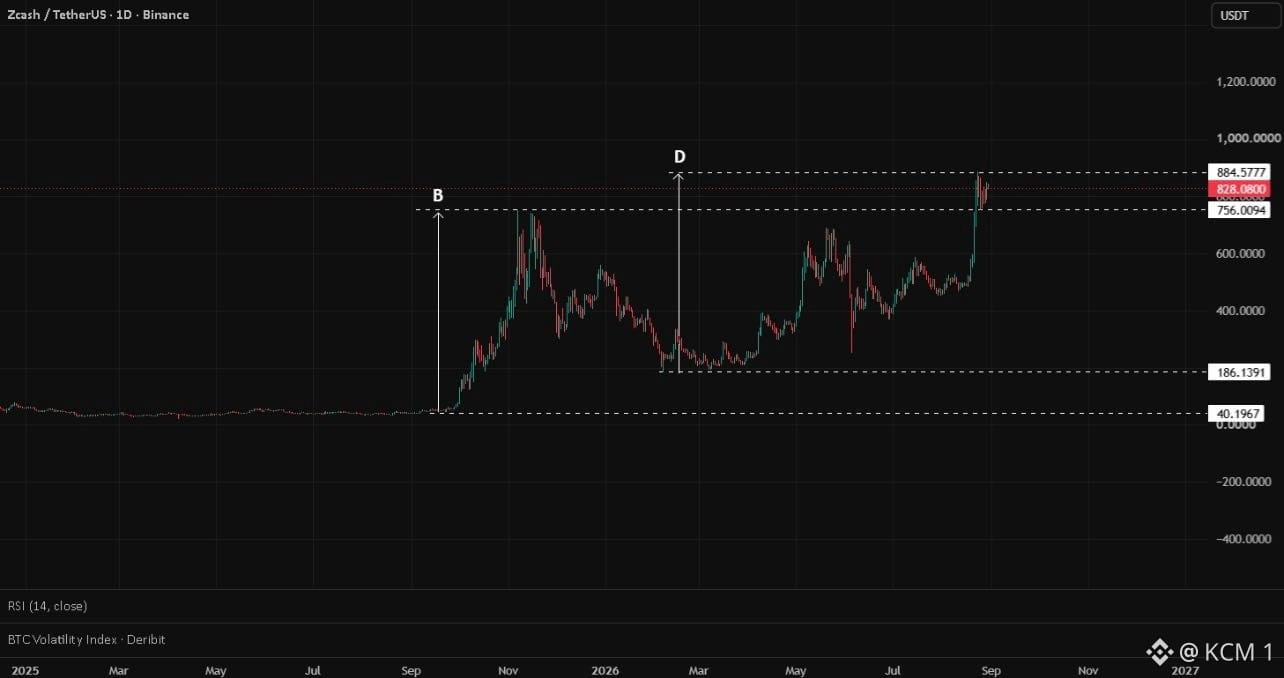
Все смотрят на этот огромный пробой по $ZEC, но при этом упускают историческое рассчитанное движение, проецирующееся в крупную зону предложения.
После завершения масштабного накопления в основании и пробоя выше предыдущих максимумов диапазона примерно у $756.00 цена агрессивно расширилась вверх до $884.57. Вертикальный импульс повторяет предыдущие циклы сильного роста, вталкивая цену прямо в ключевые уровни макро-сопротивления.
Временный ретест обратно к уровню пробоя примерно $756.00 подтвердит, что бывшее сопротивление стало надежной поддержкой. Удержание выше этого важного порога сохраняет бычью структуру и открывает путь для продолжения движения к $1,000.00.
Не гонись за вертикальным расширением — следи за тем, как формируется структура рынка выше крупных зон пробоя.
#ZEC #Zcash #CryptoAnalysis #TechnicalAnalysis
Все смотрят на этот огромный пробой по $ZEC, но при этом упускают историческое рассчитанное движение, проецирующееся в крупную зону предложения.
После завершения масштабного накопления в основании и пробоя выше предыдущих максимумов диапазона примерно у $756.00 цена агрессивно расширилась вверх до $884.57. Вертикальный импульс повторяет предыдущие циклы сильного роста, вталкивая цену прямо в ключевые уровни макро-сопротивления.
Временный ретест обратно к уровню пробоя примерно $756.00 подтвердит, что бывшее сопротивление стало надежной поддержкой. Удержание выше этого важного порога сохраняет бычью структуру и открывает путь для продолжения движения к $1,000.00.
Не гонись за вертикальным расширением — следи за тем, как формируется структура рынка выше крупных зон пробоя.
#ZEC #Zcash #CryptoAnalysis #TechnicalAnalysis
После завершения масштабного накопления в основании и пробоя выше предыдущих максимумов диапазона примерно у $756.00 цена агрессивно расширилась вверх до $884.57. Вертикальный импульс повторяет предыдущие циклы сильного роста, вталкивая цену прямо в ключевые уровни макро-сопротивления.
Временный ретест обратно к уровню пробоя примерно $756.00 подтвердит, что бывшее сопротивление стало надежной поддержкой. Удержание выше этого важного порога сохраняет бычью структуру и открывает путь для продолжения движения к $1,000.00.
Не гонись за вертикальным расширением — следи за тем, как формируется структура рынка выше крупных зон пробоя.
#ZEC #Zcash #CryptoAnalysis #TechnicalAnalysis
81
·
--
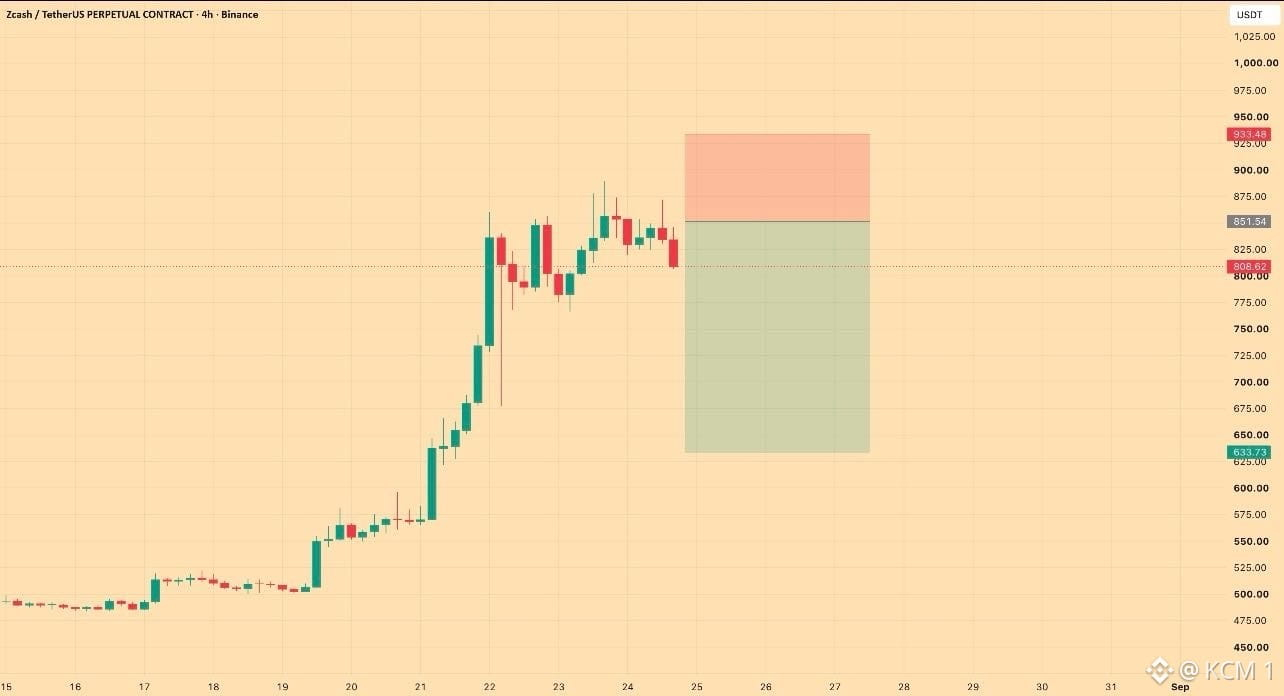
Все наблюдают за этим чрезмерно растянутым ралли по $ZEC, но упускают фазу распределения, которая формируется на локальных максимумах.
После взрывного вертикального импульса от $500 до $880 моментум застопорился в узком паттерне консолидации с более низкими максимумами на 4-часовом графике. Неспособность обновить максимумы после такого масштабного импульса сигнализирует, что покупательная сила быстро ослабевает.
Неспособность вернуть уровень $851 сохраняет тезис по короткой позиции в силе: ожидается движение к среднему возврату вниз примерно к $633, чтобы заполнить нижний разрыв ликвидности. Установка стоп-лосса около $933 защищает от любых финальных всплесков шорт-сквиза.
Вертикальные всплески привлекают поздних покупателей FOMO прямо перед тем, как рыночная структура смещается в сторону коррекции.
#ZEC #Zcash #CryptoAnalysis #TechnicalAnalysis
Все наблюдают за этим чрезмерно растянутым ралли по $ZEC, но упускают фазу распределения, которая формируется на локальных максимумах.
После взрывного вертикального импульса от $500 до $880 моментум застопорился в узком паттерне консолидации с более низкими максимумами на 4-часовом графике. Неспособность обновить максимумы после такого масштабного импульса сигнализирует, что покупательная сила быстро ослабевает.
Неспособность вернуть уровень $851 сохраняет тезис по короткой позиции в силе: ожидается движение к среднему возврату вниз примерно к $633, чтобы заполнить нижний разрыв ликвидности. Установка стоп-лосса около $933 защищает от любых финальных всплесков шорт-сквиза.
Вертикальные всплески привлекают поздних покупателей FOMO прямо перед тем, как рыночная структура смещается в сторону коррекции.
#ZEC #Zcash #CryptoAnalysis #TechnicalAnalysis
После взрывного вертикального импульса от $500 до $880 моментум застопорился в узком паттерне консолидации с более низкими максимумами на 4-часовом графике. Неспособность обновить максимумы после такого масштабного импульса сигнализирует, что покупательная сила быстро ослабевает.
Неспособность вернуть уровень $851 сохраняет тезис по короткой позиции в силе: ожидается движение к среднему возврату вниз примерно к $633, чтобы заполнить нижний разрыв ликвидности. Установка стоп-лосса около $933 защищает от любых финальных всплесков шорт-сквиза.
Вертикальные всплески привлекают поздних покупателей FOMO прямо перед тем, как рыночная структура смещается в сторону коррекции.
#ZEC #Zcash #CryptoAnalysis #TechnicalAnalysis
80
·
--
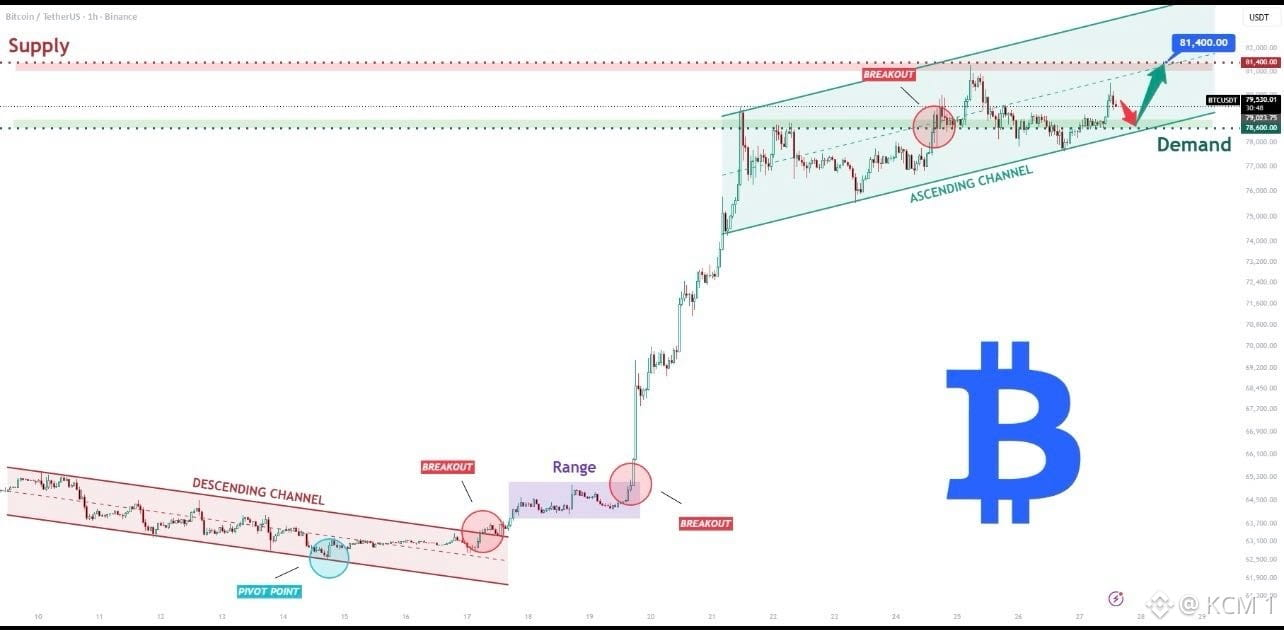
Все наблюдают это плотное консолидационное движение внутри восходящего канала по $BTC , но при этом упускают из виду сценарий продолжения тренда, который формируется от поддержки спроса.
После пробоя из нижнего нисходящего канала и консолидации в промежуточном диапазоне около $65 000 , цена агрессивно расширилась в направлении зоны $79 500 . Текущее ценовое движение уважает спрос нижнего канала возле $78 600 , удерживаясь уверенно выше ключевой динамической поддержки.
Успешный отскок от линии спроса канала задаёт следующий импульс вверх, целью которого является чистый ретест верхнего предложения примерно у $81 400 . Сохранение структуры этого канала полностью поддерживает более общий бычий импульс.
Не паникуйте на локальных откатах — там, где поддержка на младших таймфреймах совпадает с продолжением движения внутри канала.
#BTC #Bitcoin #CryptoAnalysis #TechnicalAnalysis
Все наблюдают это плотное консолидационное движение внутри восходящего канала по $BTC , но при этом упускают из виду сценарий продолжения тренда, который формируется от поддержки спроса.
После пробоя из нижнего нисходящего канала и консолидации в промежуточном диапазоне около $65 000 , цена агрессивно расширилась в направлении зоны $79 500 . Текущее ценовое движение уважает спрос нижнего канала возле $78 600 , удерживаясь уверенно выше ключевой динамической поддержки.
Успешный отскок от линии спроса канала задаёт следующий импульс вверх, целью которого является чистый ретест верхнего предложения примерно у $81 400 . Сохранение структуры этого канала полностью поддерживает более общий бычий импульс.
Не паникуйте на локальных откатах — там, где поддержка на младших таймфреймах совпадает с продолжением движения внутри канала.
#BTC #Bitcoin #CryptoAnalysis #TechnicalAnalysis
После пробоя из нижнего нисходящего канала и консолидации в промежуточном диапазоне около $65 000 , цена агрессивно расширилась в направлении зоны $79 500 . Текущее ценовое движение уважает спрос нижнего канала возле $78 600 , удерживаясь уверенно выше ключевой динамической поддержки.
Успешный отскок от линии спроса канала задаёт следующий импульс вверх, целью которого является чистый ретест верхнего предложения примерно у $81 400 . Сохранение структуры этого канала полностью поддерживает более общий бычий импульс.
Не паникуйте на локальных откатах — там, где поддержка на младших таймфреймах совпадает с продолжением движения внутри канала.
#BTC #Bitcoin #CryptoAnalysis #TechnicalAnalysis
79
·
--
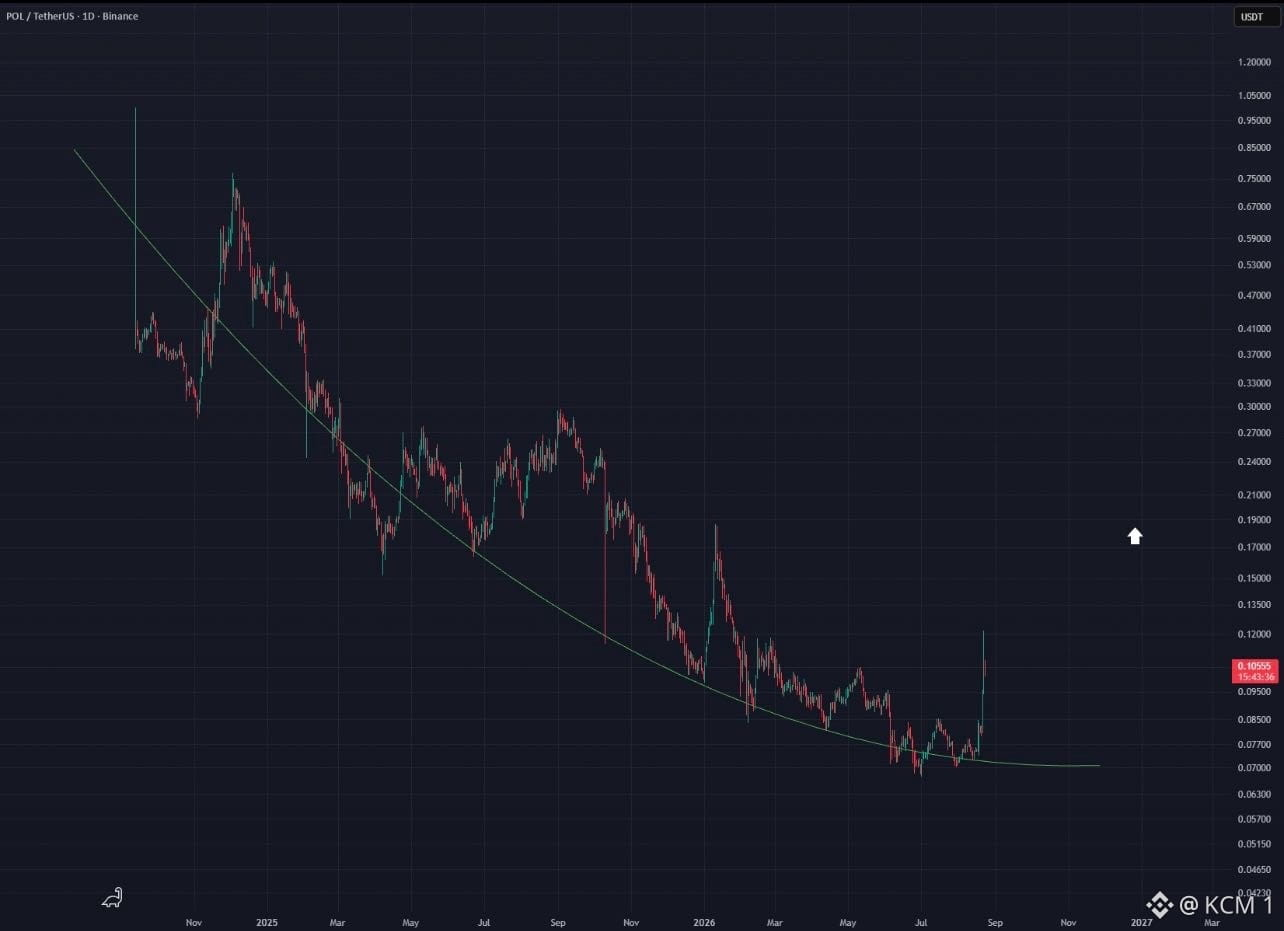
Все наблюдают этот внезапный всплеск по $POL, но упускают многолетнюю изогнутую базу, которая только что спровоцировала крупный структурный пробой.
После долгого нисходящего тренда на фоне параболической округлой кривой цена наконец вернула ключевую поддержку около $0.0750 и резко взлетела к $0.1100. Эта агрессивная зелёная расширяющаяся свеча сигнализирует о том, что покупатели поглощают долгосрочное сопротивление сверху в нижней части макродиапазона.
Хотя на младших таймфреймах после такого резкого вертикального импульса возможна краткосрочная коррекция, удержание выше уровня пробоя по кривой подтверждает смену тренда. Сохранение этой структуры закладывает основу для продолжительного разворота с целью роста к уровням более высокого сопротивления.
Не игнорируйте кривые накопления за несколько месяцев — когда они ломаются, импульс меняется очень быстро.
#POL #Polygon #CryptoAnalysis #TechnicalAnalysis
Все наблюдают этот внезапный всплеск по $POL, но упускают многолетнюю изогнутую базу, которая только что спровоцировала крупный структурный пробой.
После долгого нисходящего тренда на фоне параболической округлой кривой цена наконец вернула ключевую поддержку около $0.0750 и резко взлетела к $0.1100. Эта агрессивная зелёная расширяющаяся свеча сигнализирует о том, что покупатели поглощают долгосрочное сопротивление сверху в нижней части макродиапазона.
Хотя на младших таймфреймах после такого резкого вертикального импульса возможна краткосрочная коррекция, удержание выше уровня пробоя по кривой подтверждает смену тренда. Сохранение этой структуры закладывает основу для продолжительного разворота с целью роста к уровням более высокого сопротивления.
Не игнорируйте кривые накопления за несколько месяцев — когда они ломаются, импульс меняется очень быстро.
#POL #Polygon #CryptoAnalysis #TechnicalAnalysis
После долгого нисходящего тренда на фоне параболической округлой кривой цена наконец вернула ключевую поддержку около $0.0750 и резко взлетела к $0.1100. Эта агрессивная зелёная расширяющаяся свеча сигнализирует о том, что покупатели поглощают долгосрочное сопротивление сверху в нижней части макродиапазона.
Хотя на младших таймфреймах после такого резкого вертикального импульса возможна краткосрочная коррекция, удержание выше уровня пробоя по кривой подтверждает смену тренда. Сохранение этой структуры закладывает основу для продолжительного разворота с целью роста к уровням более высокого сопротивления.
Не игнорируйте кривые накопления за несколько месяцев — когда они ломаются, импульс меняется очень быстро.
#POL #Polygon #CryptoAnalysis #TechnicalAnalysis
65
Войдите, чтобы посмотреть больше материала
Присоединяйтесь к пользователям криптовалют по всему миру на Binance Square
⚡️ Получайте новейшую и полезную информацию о криптоактивах.
💬 Нам доверяет крупнейшая в мире криптобиржа.
👍 Получите достоверные аналитические данные от верифицированных создателей контента.
Эл. почта/номер телефона
В тренде
AIStocksWhatNext
Просмотров: 619,634
4,686 обсуждают
Поделись и выиграй награду за трафик в нашей кампании с трендовым хэштегом
✨Тема: Какие ещё инвестиционные возможности остаются, пока акции ИИ продолжают расти?
👉Как принять участие:
Опубликуйте короткий пост или статью с хэштегом #AIStocksWhatNext
Расскажите, вы бычьей или медвежьей позиции придерживаетесь, и опубликуйте свои холдинги или сделки по акциям ИИ — использование виджета для трейда может повысить вашу соответствие требованиям.
Вы также можете усилить пост, поделившись данными или графиками, и избегая изображений, сгенерированных ИИ.
✍️Создайте контент, опираясь на приведённые ниже ракурсы:
- Nvidia говорит, что продажи чипов удвоятся в следующем году, а ведущие компании в сфере ИИ продолжают бить рекорды по выручке — затраты на вычисления за этим стоят просто колоссальные. Спрос на ИИ действительно растёт? И как долго это может продолжаться? Акции ИИ растут по всему рынку. Это реальный прорыв или просто краткосрочный отскок?
- Лидеры отрасли призывают замедлить развитие ИИ, а Трамп планирует создать «AI Force» («ИИ-Силу»), утверждая, что ИИ может составить 25% ВВП США в будущем. На чьей вы стороне? Будет ли поддержка на уровне штатов долгосрочной победой для акций ИИ?
- Покупаете ли вы акции ИИ? Поделитесь своей сделкой/холдингами по темам ИИ с помощью нашего виджета для обмена трейдами.
⏰Период кампании:
- 2026-09-22 7:00 - 2026-09-24 4:00 UTC
🎁Награда:
- Квалифицированные посты, которые соответствуют указанным выше правилам и содержат более 100 слов, будут рассмотрены и могут получить случайный бонус к трафику в размере 500–3 000 просмотров. Если ваш пост будет выбран, вы получите уведомление от вашего секретаря ленты.
- Получите шанс, чтобы вашу статью разместили на Binance Square Official
Нужны идеи для поста? Перейдите на страницу темы #AIStocksWhatNext или Square Guide on How to Post for Better Reach.
Binance Square Official
·Лайков: 470
·Просмотров: 1.3M
ПротоколFOMC
Просмотров: 28,236
114 обсуждают
fomcотслеживание
Просмотров: 40,144
324 обсуждают