

ETH Technical Outlook: Ethereum Breaks Below $2,100 as Selling Pressure Intensifies
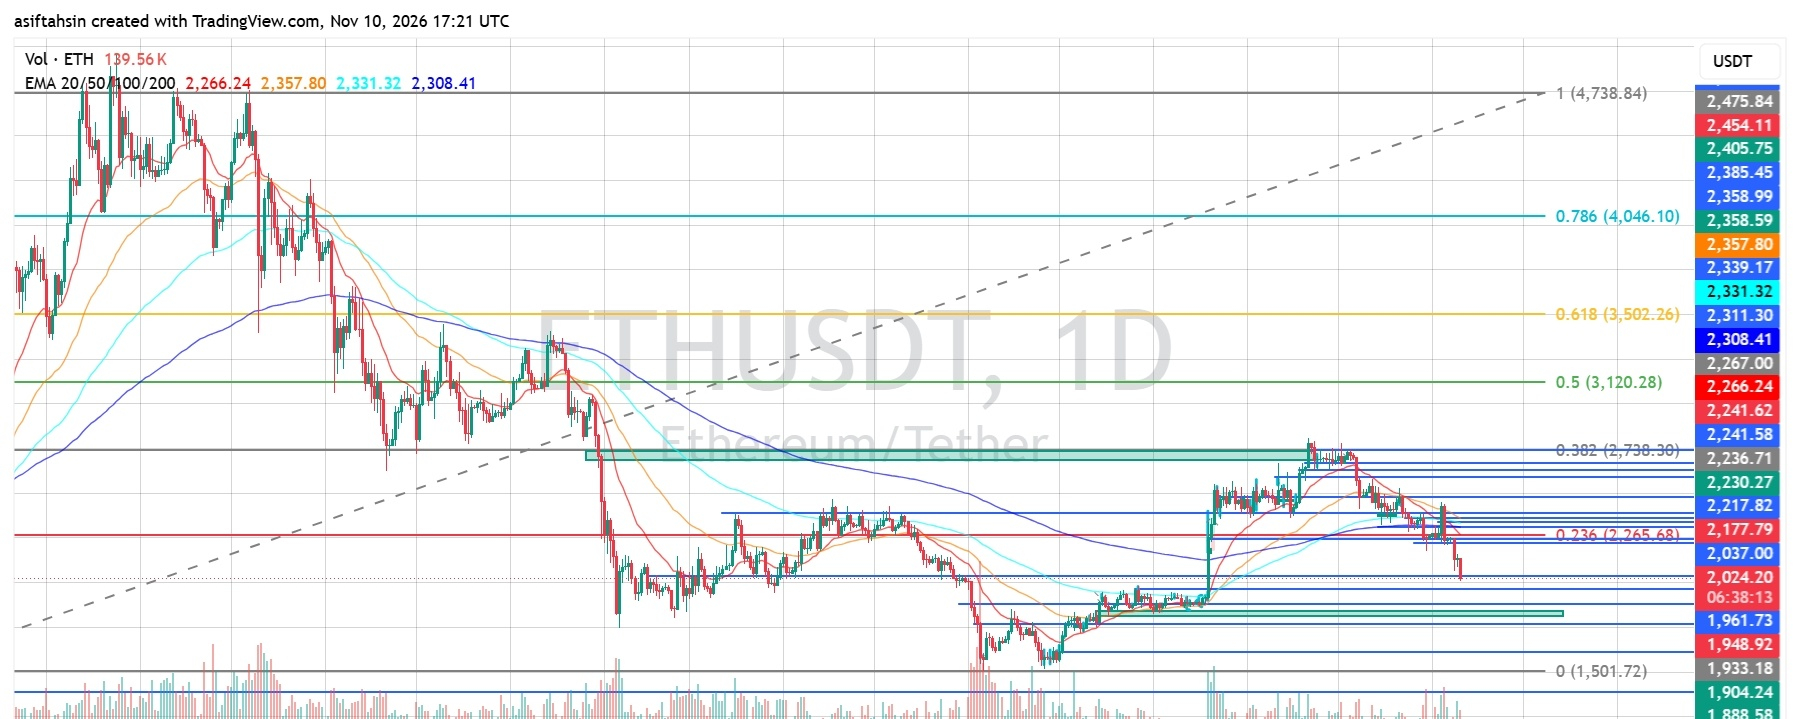
Ethereum is showing renewed weakness on the daily chart, with price falling toward $2,024 after breaking below several important support levels. The latest move puts sellers firmly in control, while RSI has dropped into oversold territory.
ETH is also trading below all four major EMAs, highlighting the weakness in its broader daily structure. The key question now is whether buyers can defend the $2,000 psychological area or whether another leg down will follow.
1. EMA Structure: Bearish Momentum Dominates
Current EMA levels:
- EMA 20: $2,266.24
- EMA 50: $2,357.80
- EMA 100: $2,331.32
- EMA 200: $2,308.41
ETH is trading below all four major EMAs. The EMA 20 is the nearest dynamic resistance, while the $2,308–$2,358 region forms a broader resistance cluster.
As long as ETH remains below these averages, recovery attempts may face significant selling pressure.
2. Fibonacci Levels: Important Recovery Zones
Key Fibonacci levels:
- 0.236: $2,265.68
- 0.382: $2,738.30
- 0.500: $3,120.28
- 0.618: $3,502.26
- 0.786: $4,046.10
The $2,265 area is the first major Fibonacci recovery level and closely aligns with the EMA 20.
ETH needs to reclaim this region before a stronger recovery scenario becomes more convincing. Higher Fibonacci levels remain longer-term upside references rather than immediate targets.
3. Bearish Scenario: Is $2,000 at Risk?
ETH has broken below the nearby $2,037 support area, showing that sellers are maintaining pressure.
If price fails to recover above $2,037, further downside could expose these levels:
- $2,000: Psychological support
- $1,961.73: Next important support
- $1,948.92: Additional downside level
- $1,933.18: Lower support
- $1,904.24–$1,888.58: Deeper support zone
- $1,876.76: Lower chart level
A sustained move below $1,961 could increase the risk of a deeper correction toward the $1,900 region.
4. Bullish Scenario: What Must ETH Reclaim?
For buyers to regain some control, ETH needs to recover the recently lost support levels.
Important resistance levels:
- $2,037: First level to reclaim
- $2,177.79: Near-term resistance
- $2,217.82–$2,241.58: Resistance cluster
- $2,265.68–$2,266.24: Fibonacci 0.236 and EMA 20
- $2,308–$2,358: Major EMA resistance zone
A recovery above $2,177 would be an initial improvement. A daily close above $2,266 would provide a stronger signal that bullish momentum may be returning.
5. RSI Momentum: ETH Enters Oversold Territory
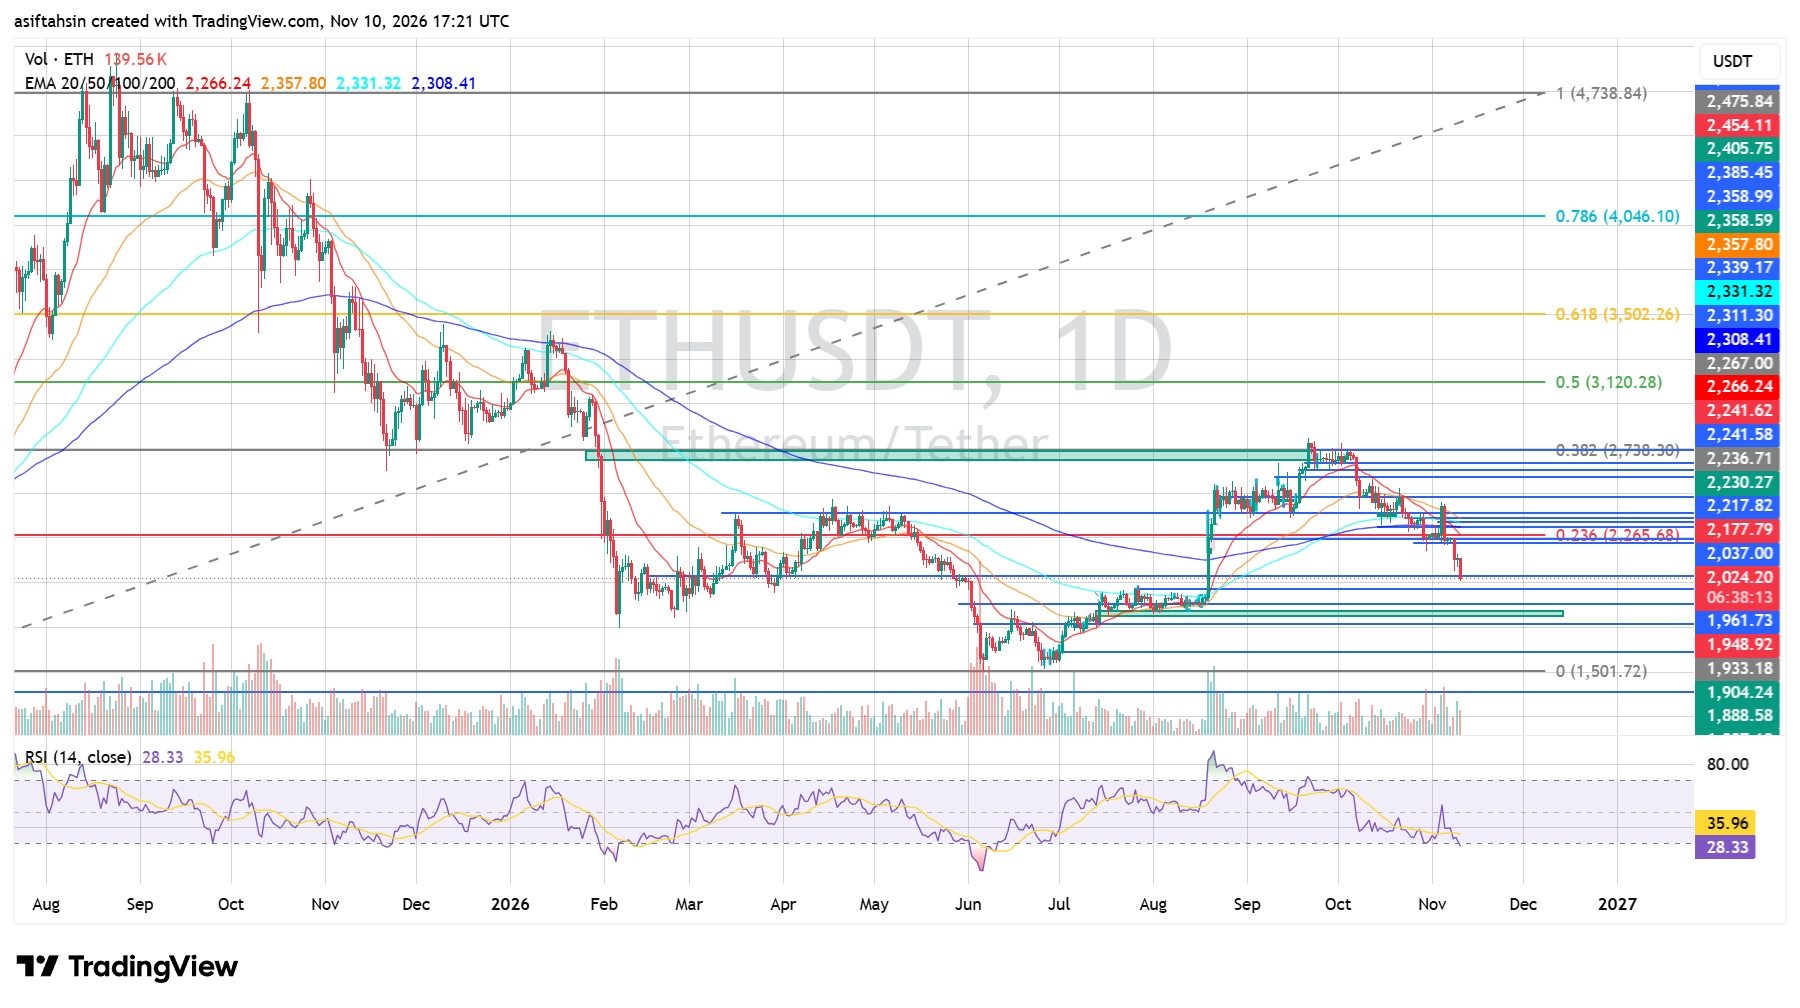
RSI (14): 28.33
RSI Moving Average: 35.96
RSI has fallen below the traditional 30 oversold threshold, reflecting strong selling pressure.
This could create conditions for a short-term relief bounce. However, oversold RSI does not guarantee a reversal. Buyers need to confirm strength through price recovery and improved momentum.
6. Key Support and Resistance Levels
Support
- $2,000: Psychological support
- $1,961.73: Immediate lower support
- $1,948.92–$1,933.18: Support zone
- $1,904.24–$1,888.58: Deeper support
- $1,876.76: Lower chart level
Resistance
- $2,037: First recovery level
- $2,177.79: Near-term resistance
- $2,217.82–$2,241.58: Resistance cluster
- $2,265.68–$2,266.24: Fibonacci and EMA resistance
- $2,308–$2,358: Major EMA resistance
Final Outlook
Ethereum's daily structure remains strongly bearish. Price is below all four major EMAs, has broken below $2,037 support, and RSI is now in oversold territory.
The $2,000 psychological level is an important area to watch. Holding this region could allow a temporary relief bounce, while a sustained breakdown may expose $1,961 and the $1,900 support zone.
For a meaningful recovery, ETH needs to reclaim $2,177 first, followed by the $2,265–$2,266 resistance zone.
Current Bias: Bearish below $2,177. A sustained recovery above $2,266 would be an important first step toward improving the daily outlook.
