


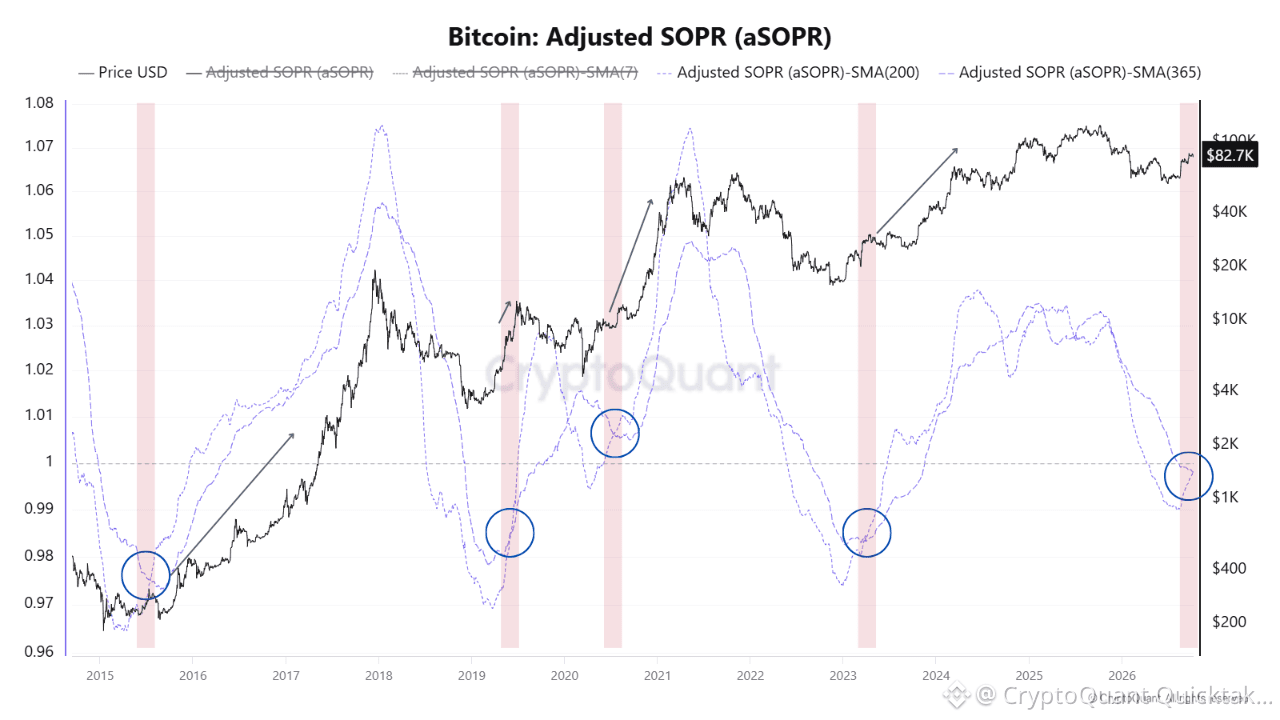
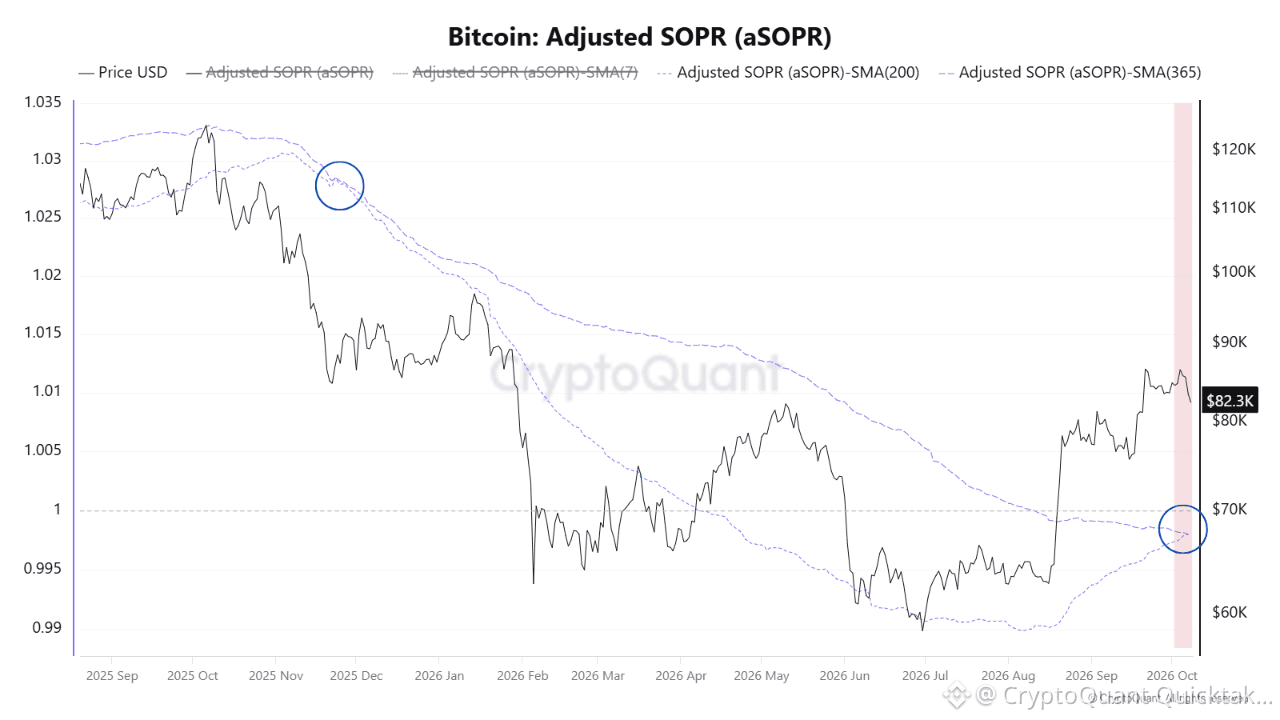
Bitcoin’s recovery is gaining a signal beneath price: the 200-day average of Adjusted SOPR is beginning to cross above its 365-day average.
aSOPR compares the value of spent outputs with their value when created, excluding outputs younger than one hour. Above 1, spending realizes an aggregate profit; below 1, an aggregate loss.
The crossover means average spending profitability over the last 200 days is overtaking the annual average. It suggests the recent loss regime is easing and realized profitability is recovering.
The historical chart highlights comparable upward crosses in 2015, 2019, 2020 and 2023. They accompanied recoveries that extended over subsequent months, with several preceding substantial longer-term advances. Yet 2019’s rally later reversed: the pattern supports a recovery thesis without guaranteeing an uninterrupted bull market.
The current setup has an important distinction. The 200-day average is rising from its lows, while the 365-day average is still declining. Both remain just below 1, around 0.998. Relative improvement is therefore emerging before a sustained return to profitability is established on these longer horizons.
For investors, this points to a possible transition away from loss-dominated spending. It does not establish that selling volume is falling or fresh demand is accelerating. Because both averages are slow, the crossover also reflects a recovery already underway.
What to Watch
The next test is whether improving profitability is accompanied by easing seller stress and stronger demand. STH SOPR holding above 1, with pullbacks finding support near breakeven, would suggest recent buyers are maintaining profitable spending conditions.
Declining realized loss volumes during those pullbacks would reinforce the recovery thesis.
Sustained positive Apparent Demand would add evidence of supply absorption, strengthening the case that Bitcoin can withstand renewed profit-taking and extend its recovery.
Written by MorenoDV_