
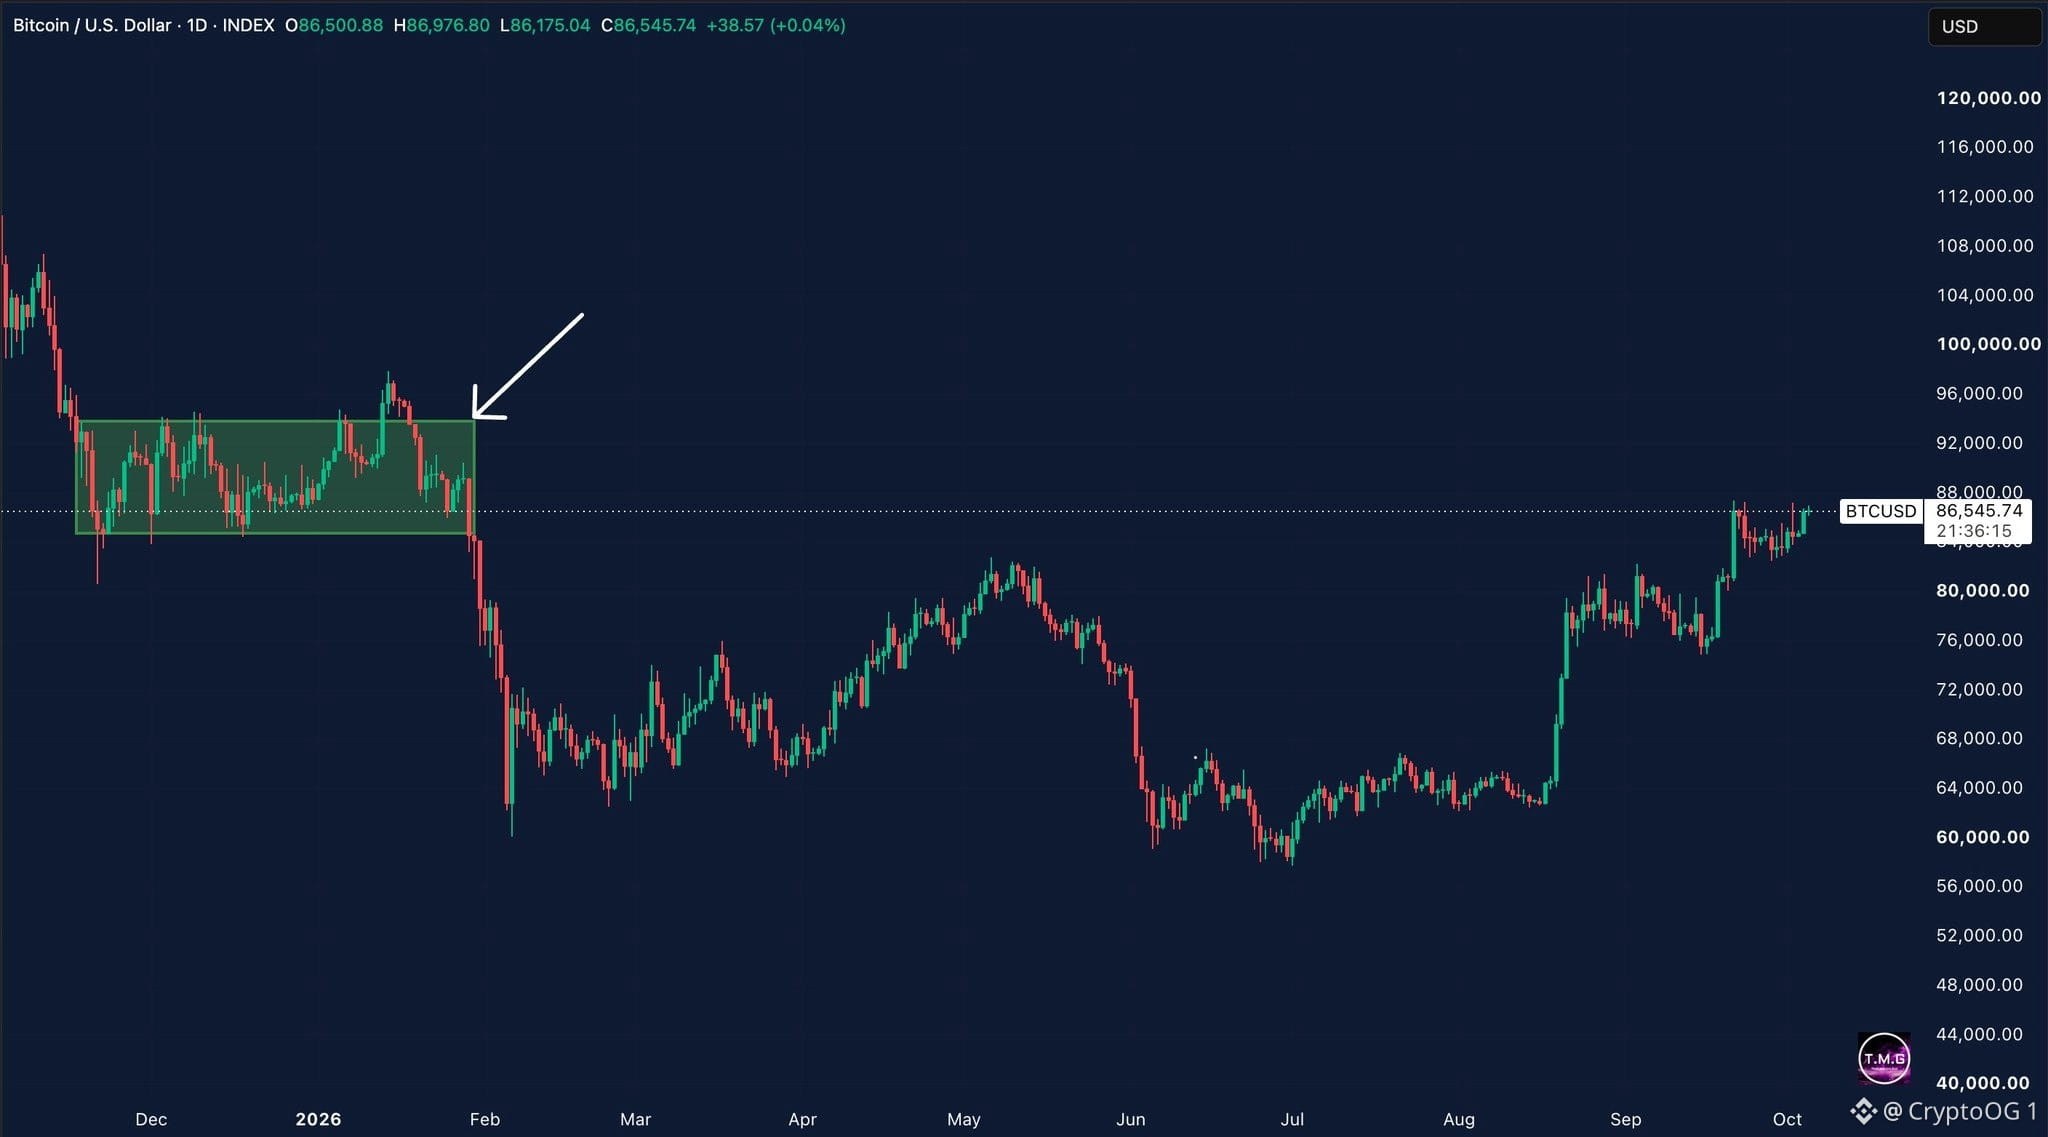
Bitcoin $BTC Is Starting To Look Like Its Late 2025 Range Setup The range highlighted on the chart formed from roughly late November 2025 through late January 2026. During that period, Bitcoin spent weeks consolidating between roughly $86K and $95K, repeatedly testing the upper boundary before eventually losing the lower end of the range and breaking sharply lower. We’re now seeing a surprisingly similar structure. Bitcoin has spent the last several weeks consolidating after the move higher, with roughly $87K acting as the top of the current range. The big difference is what happens next. If BTC breaks and holds above $87K, this comparison starts to break down and the current range could be acting as a continuation structure instead. But if we get another rejection from the top and eventually lose the lower end of the range, I’d start paying much more attention to the similarity with late 2025. I’m not saying history is about to repeat itself. I just think this is one of those charts where the reaction at the range boundaries matters a lot. For me, $87K is the level I want to see Bitcoin properly reclaim.


Посты
Отказ от ответственности. Содержит мнения третьих сторон. Не является рекомендацией. Binance AI не предоставляет гарантий. См. Правила и условия.