
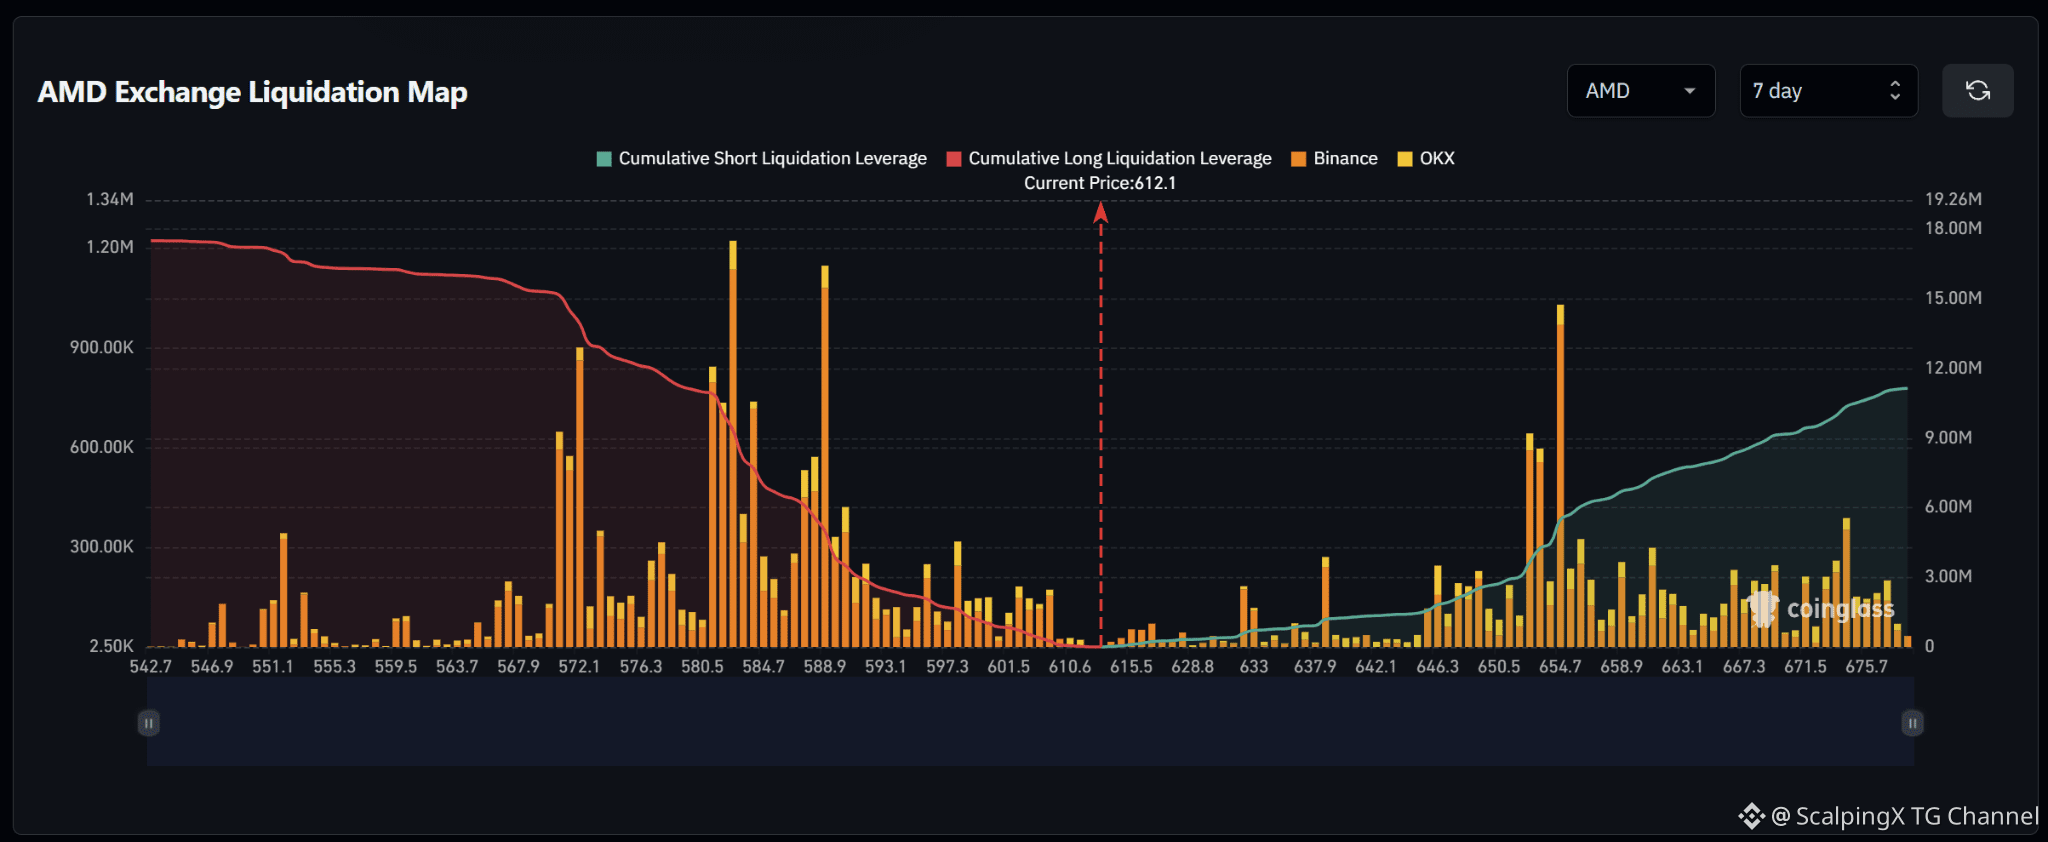
$AMD – Liquidation Map (7 Days) – Current Price 612.1 🔎 The 7-day liquidation map shows roughly 17–18 million USD in long liquidations below the current price, exceeding approximately 10–11 million USD in short liquidations above. The liquidity structure therefore favors the downside, with around 1.6 times more cumulative liquidity below the market. 📉 Below the market, long-liquidation liquidity is concentrated heavily across 572–589. Major clusters sit around 572 with a bar near 0.9 million USD, 582–584 with a bar above 1.2 million USD, and 588–589 with a bar around 1.1–1.2 million USD. Losing 610 would shift attention toward 601–597 and then 589–582. 📈 Above the market, short-liquidation liquidity is initially thin but rises noticeably from around 646. The strongest cluster sits around 654–655 with a bar near 1 million USD, while 650–655 also contains several bars around 0.5–0.65 million USD. Further out, 658–676 holds multiple smaller but relatively dense liquidity pockets. 🧭 The broader setup favors the downside because long-liquidation exposure below is larger. Losing 610 would increase the probability of a sweep toward 601–597, followed by 589–582. Breaking above 642–646 would instead expose 650–655 and then 659–663. #LiquidationMap


Посты
Отказ от ответственности. Содержит мнения третьих сторон. Не является рекомендацией. Binance AI не предоставляет гарантий. См. Правила и условия.