



Fair Isaac Corporation stock is undergoing a violent technical breakdown triggered by a structural regulatory threat. FICO closed at 840.89 on September 28 after the FHFA announced changes to introduce competition into its mortgage credit scoring business. Shares tumbled roughly 8% after-hours.
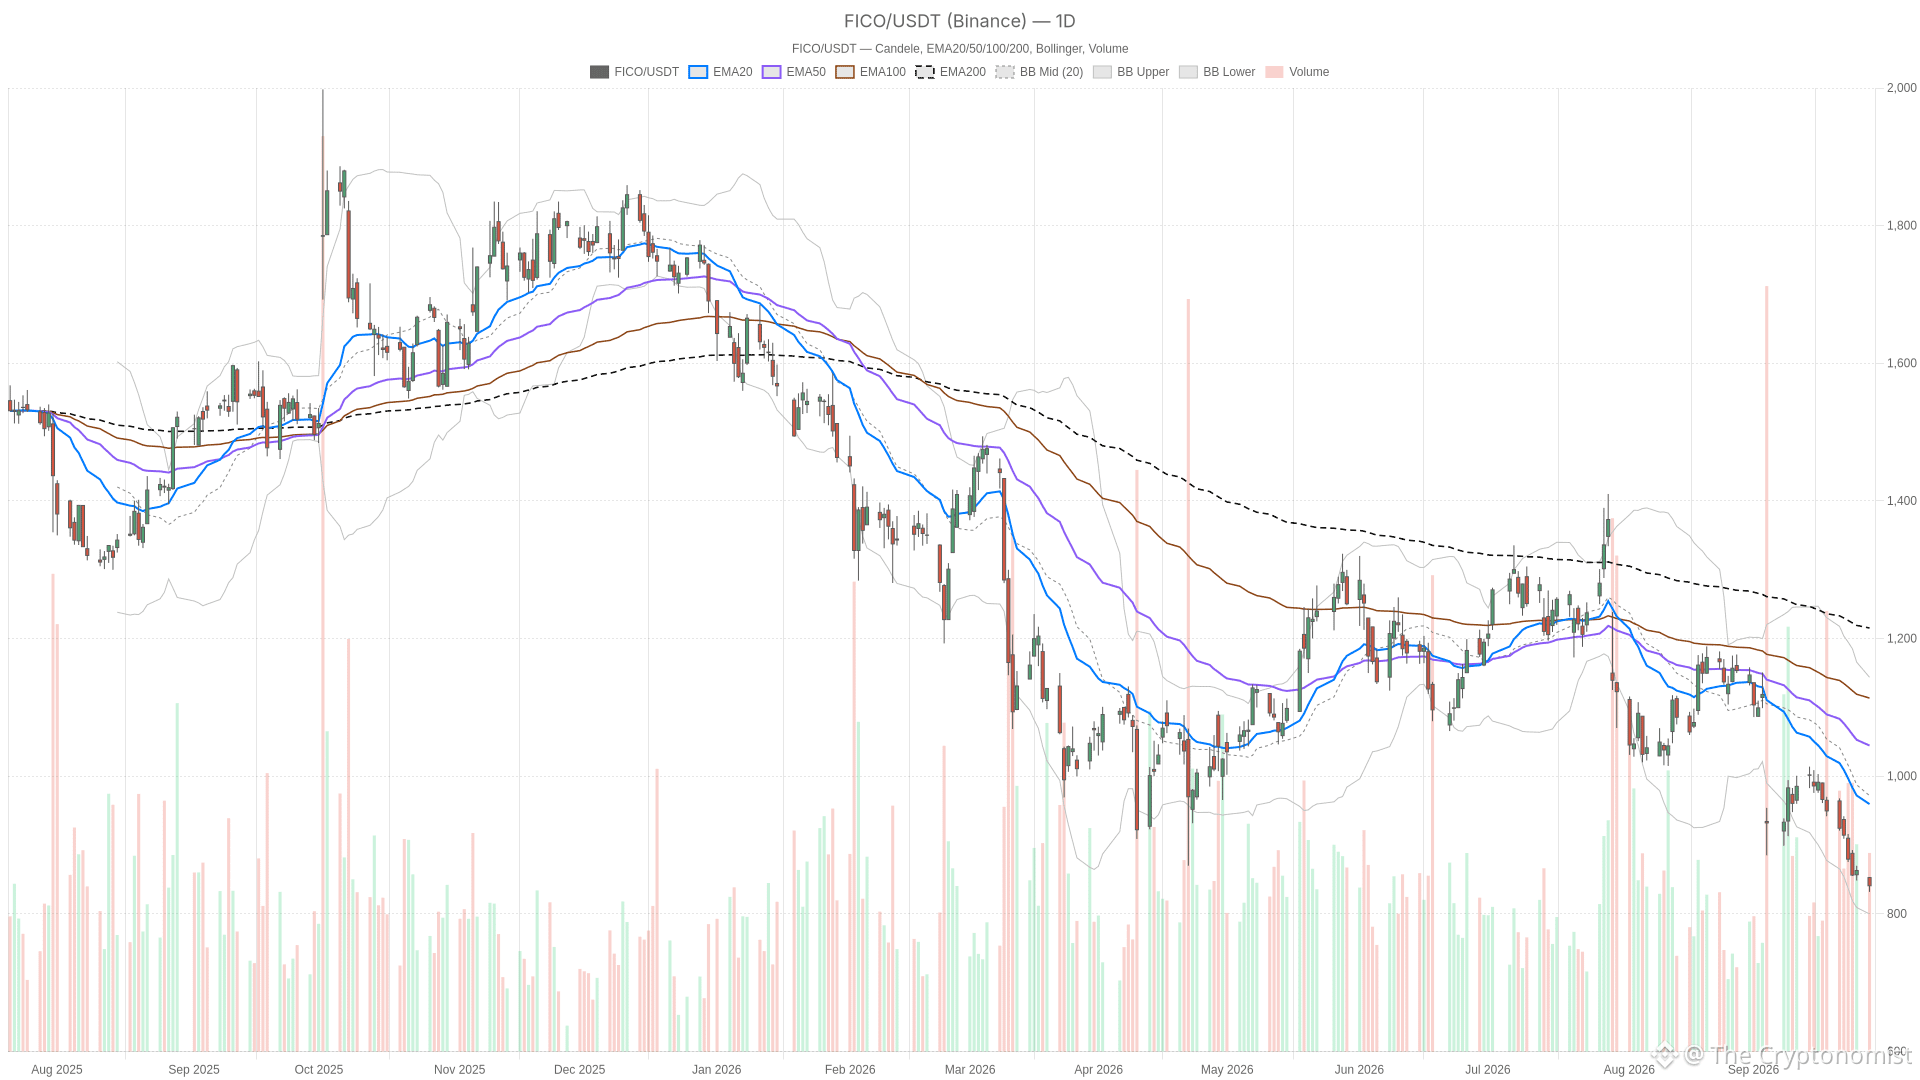 FICO — daily chart with candlesticks, EMA20/EMA50 and volume.
Key takeaways
FICO closed at 840.89 on September 28, down roughly -2.57% from the prior close of 863.09
After-hours trading pushed shares approximately 8% lower following the FHFA regulatory announcement
Daily RSI14 plunged to 27.76, deep in oversold territory, while MACD histogram sits at -10.67
Price trades below all major daily EMAs: 20-day at 959.54, 50-day at 1044.65, and 200-day at 1215.42
Daily ATR14 expanded to 37.05, confirming elevated volatility alongside the directional sell-off
Daily Trend: Fair Isaac Corporation Stock Firmly in a Bearish Regime
The daily trend for Fair Isaac Corporation stock is unequivocally bearish. Price sits below every major moving average, confirming a genuine change in trend character rather than a shallow pullback inside an uptrend.
Against the prior close of 863.09, the close-to-close decline works out to roughly -2.57%. The open-to-close move on the day itself was about -1.40%. Combined with the after-hours reaction, sellers are firmly in control. The market is now repricing FICO’s long-term earnings power, not just reacting to a single headline.
Price sits below the 20-day EMA at 959.54. It also trades under the 50-day EMA at 1044.65 and the 200-day EMA at 1215.42. That stacking is a textbook bearish trend alignment.
Momentum and Volatility Deepen the Bearish Signal
The daily RSI14 has fallen to 27.76, deep into oversold territory. Meanwhile, MACD sits at -64.22 versus a signal line of -53.55, with a histogram of -10.67. A histogram that negative shows downside momentum is still active, even after such a sharp decline.
The daily ATR14 has expanded to 37.05. This confirms that volatility has stepped up alongside the directional move. Such behavior is typical of a stock digesting a fundamental shock rather than routine profit-taking.
Bollinger Bands Leave Room for Further Downside
The daily Bollinger setup adds useful context. With the mid-band at 971.90 and the lower band at 799.94, the current close of 840.89 is still above the lower boundary. Despite the scale of the drop, price has not yet reached a statistical extreme. This leaves room for further downside before the move would become a mean-reversion candidate.
1H Timeframe: Trend Confirmed, But Momentum Shows Early Cracks
The 1-hour chart confirms the bearish trend seen on the daily timeframe for FICO. However, early signs suggest downside momentum is beginning to decelerate at the intraday level.
EMA20 at 857.60, EMA50 at 890.40, and EMA200 at 1000.52 are all stacked above price. This reinforces the same downtrend visible on the daily chart. RSI14 at 28.97 is likewise deep in oversold territory, matching the daily reading almost tick for tick.
Notably, the 1H MACD histogram has flipped to a marginally positive 0.56. The MACD line at -15.71 and signal line at -16.27 both remain negative. This divergence is not a reversal signal on its own. Still, it suggests downside momentum is decelerating, even as the broader daily trend stays firmly bearish.
The 1H Bollinger Bands show price at 840.85 against a lower band of 832.67. The upper band sits at 879.68. Combined with the pivot structure—pivot point 840.06, support at 837.14, resistance at 843.76—price is oscillating right around the pivot. This reads as short-term indecision layered on top of a longer-term downtrend.
15-Minute Execution View
The 15-minute chart for FICO stock shifts toward consolidation rather than continued panic selling. RSI14 sits near neutral at 45.13. The MACD histogram is marginally positive at 0.69. Both indicators hint that intraday sellers have, at least temporarily, lost some urgency.
Price is trading close to its own EMA20 of 841.56, inside a tight Bollinger range between 836.51 and 843.49. Notably, this micro-structure sits almost exactly on the same pivot level of 840.06 seen on the 1H chart. This reinforces that the 840 zone is the immediate battleground for the next directional move.
Bullish Scenario: What Fair Isaac Corporation Stock Needs to Reverse
A bullish reversal in Fair Isaac Corporation stock is possible but requires more than an oversold RSI reading. The Motley Fool has framed the sell-off as a potential opportunity. It questioned whether the crash represents a generational buying moment, even as investors worry the company is losing its competitive moat.
For that thesis to gain technical traction, price would need to reclaim the 1H resistance at 843.76. More importantly, it must push back above the daily pivot at 842.15 and toward the daily R1 at 852.29. A sustained move above the 1H EMA20 near 857.60 would be a stronger signal. It would suggest the oversold bounce has real follow-through rather than being another failed relief rally inside a downtrend.
Bearish Scenario: What Invalidates the Bounce Case
The bearish case remains the path of least resistance for FICO stock. Price stays under every major EMA on both the daily and 1H charts. A break below the daily S1 at 830.74 would confirm sellers remain in control. A move under the September 28 low of 832 would reinforce that signal.
Such a breakdown would open the door toward the daily Bollinger lower band at 799.94. The prior 52-week low near 869.09 would be left further behind. In that scenario, the regulatory overhang tied to FICO’s mortgage scoring monopoly would continue to outweigh any short-term technical stabilization.
Overall, the picture across timeframes is one of a dominant daily downtrend. The 1-hour chart confirms this in structure but slightly softens in momentum. Meanwhile, the 15-minute chart shows a market pausing around the 840 pivot. Volatility is elevated, as the expanded ATR readings confirm.
The fundamental backdrop—a direct regulatory challenge to FICO’s scoring monopoly—adds uncertainty that technical indicators alone cannot fully capture. Positioning around Fair Isaac Corporation stock should account for both oversold technicals and unresolved structural risk.
FAQ
What caused Fair Isaac Corporation stock to drop?
The Federal Housing Finance Agency announced changes designed to introduce competition into FICO’s mortgage credit scoring business. This structural regulatory threat triggered a sharp sell-off, with shares tumbling roughly 8% after-hours on September 28.
Is Fair Isaac Corporation stock oversold?
Yes. The daily RSI14 has fallen to 27.76, deep into oversold territory. However, oversold readings alone do not guarantee a reversal. Price remains below all major moving averages, and the MACD histogram at -10.67 confirms active downside momentum.
What are the key support levels for FICO stock?
Immediate support sits at the daily S1 level of 830.74, with the September 28 low at 832 serving as a nearby reference. Below that, the daily Bollinger lower band at 799.94 represents the next significant downside target.
Could this sell-off be a buying opportunity in Fair Isaac Corporation stock?
The Motley Fool has framed the sell-off as a potential opportunity. However, a bullish reversal requires price to reclaim the 1H resistance at 843.76 and push above the daily pivot at 842.15. A sustained move above the 1H EMA20 near 857.60 would signal follow-through strength rather than a failed relief rally.
Disclaimer: This article is for informational purposes only and does not constitute financial advice, an investment recommendation, or a solicitation to buy or sell any financial instrument or cryptocurrency. The analysis provided is not indicative of future results. Investing in crypto assets and financial markets carries a high risk of capital loss. Always do your own research (DYOR) and consult a qualified financial advisor before making any decision.
Article produced with the assistance of artificial intelligence and reviewed by the editorial team.