

Malik-Bilal 786
382 Публикации

Malik-Bilal 786
Отправить жалобу
Заблокировать пользователя
Открытая сделка
Трейдер с регулярными сделками
2.7 г
22 подписок(и/а)
22 подписчиков(а)
55 понравилось
Посты
Портфель
Все
Цитирования
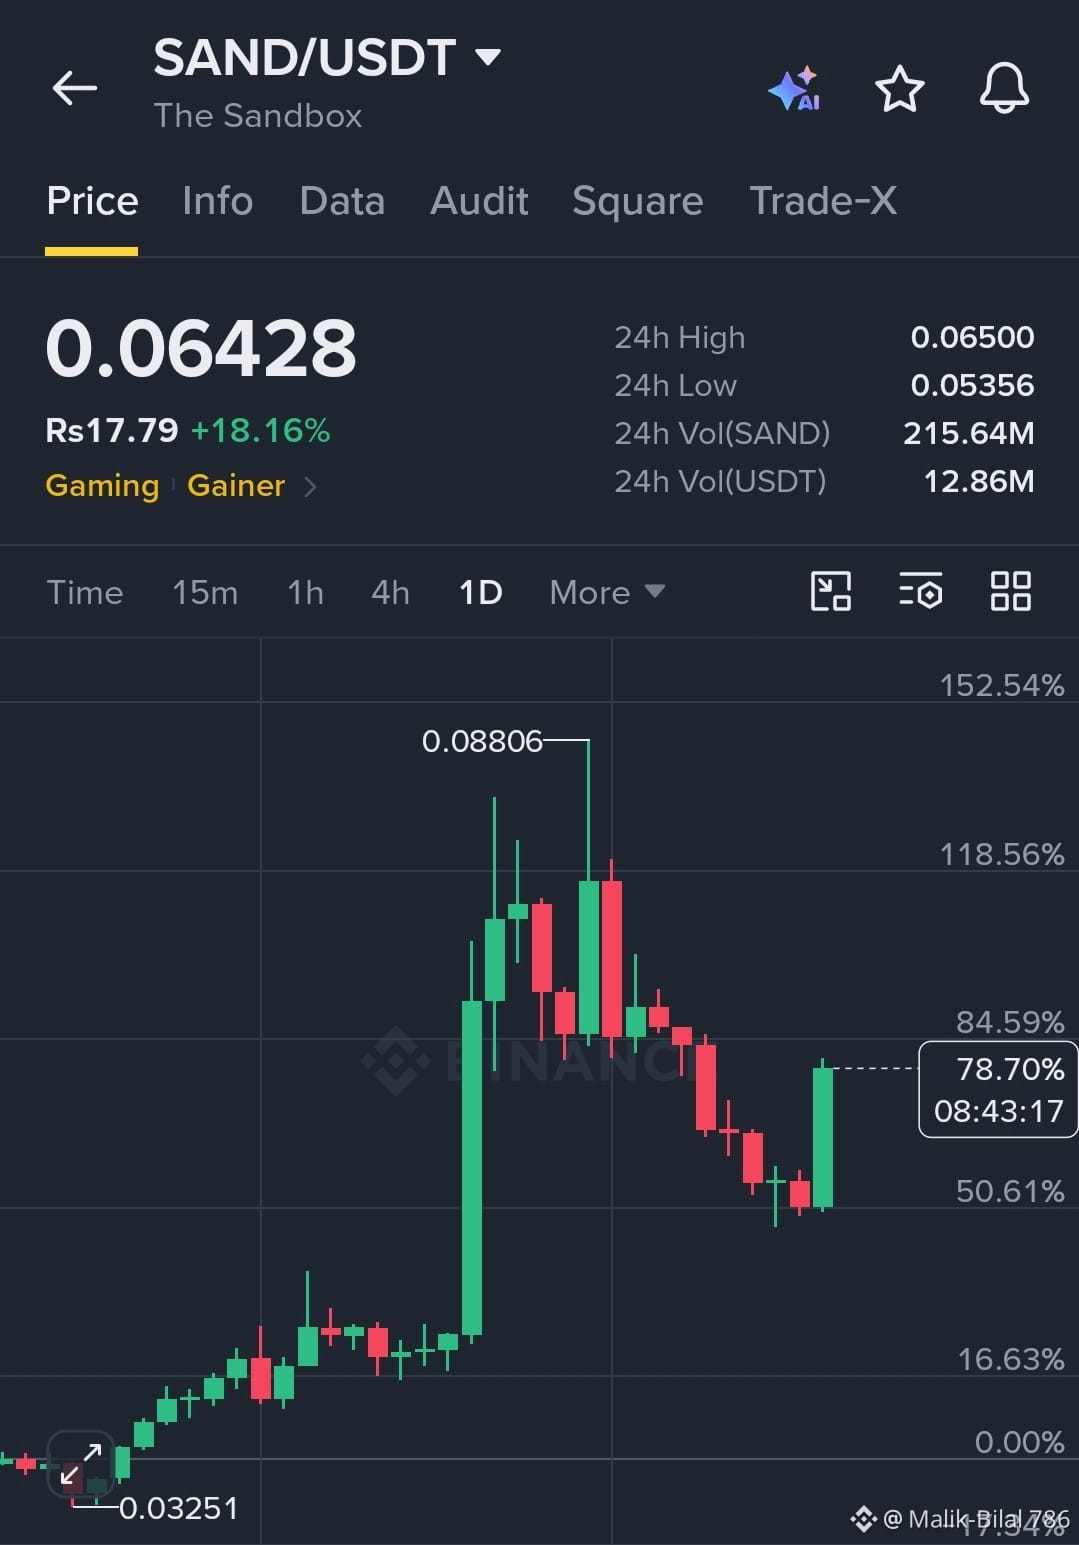
$SAND SAND/USDT Latest Analysis (1D Chart)
Current price: 0.06428 USDT
24h change: +18.16% — strong bullish recovery.
Trend: Price is bouncing after a correction from 0.08806, with rising volume supporting the rebound.
Resistance: 0.0650, then 0.0700–0.0750 USDT.
Support: 0.0600, then 0.0535 USDT.
RSI: Around 57 — bullish momentum is improving, without being strongly overbought.
Short-term outlook: Cautiously bullish. A confirmed breakout above 0.0650 could push SAND toward 0.0700. Rejection may lead to a pullback toward 0.0600.#CelestiaRises16%To2026High #NasdaqDowWeeklyGapWidestSinceJuly2002
1
222
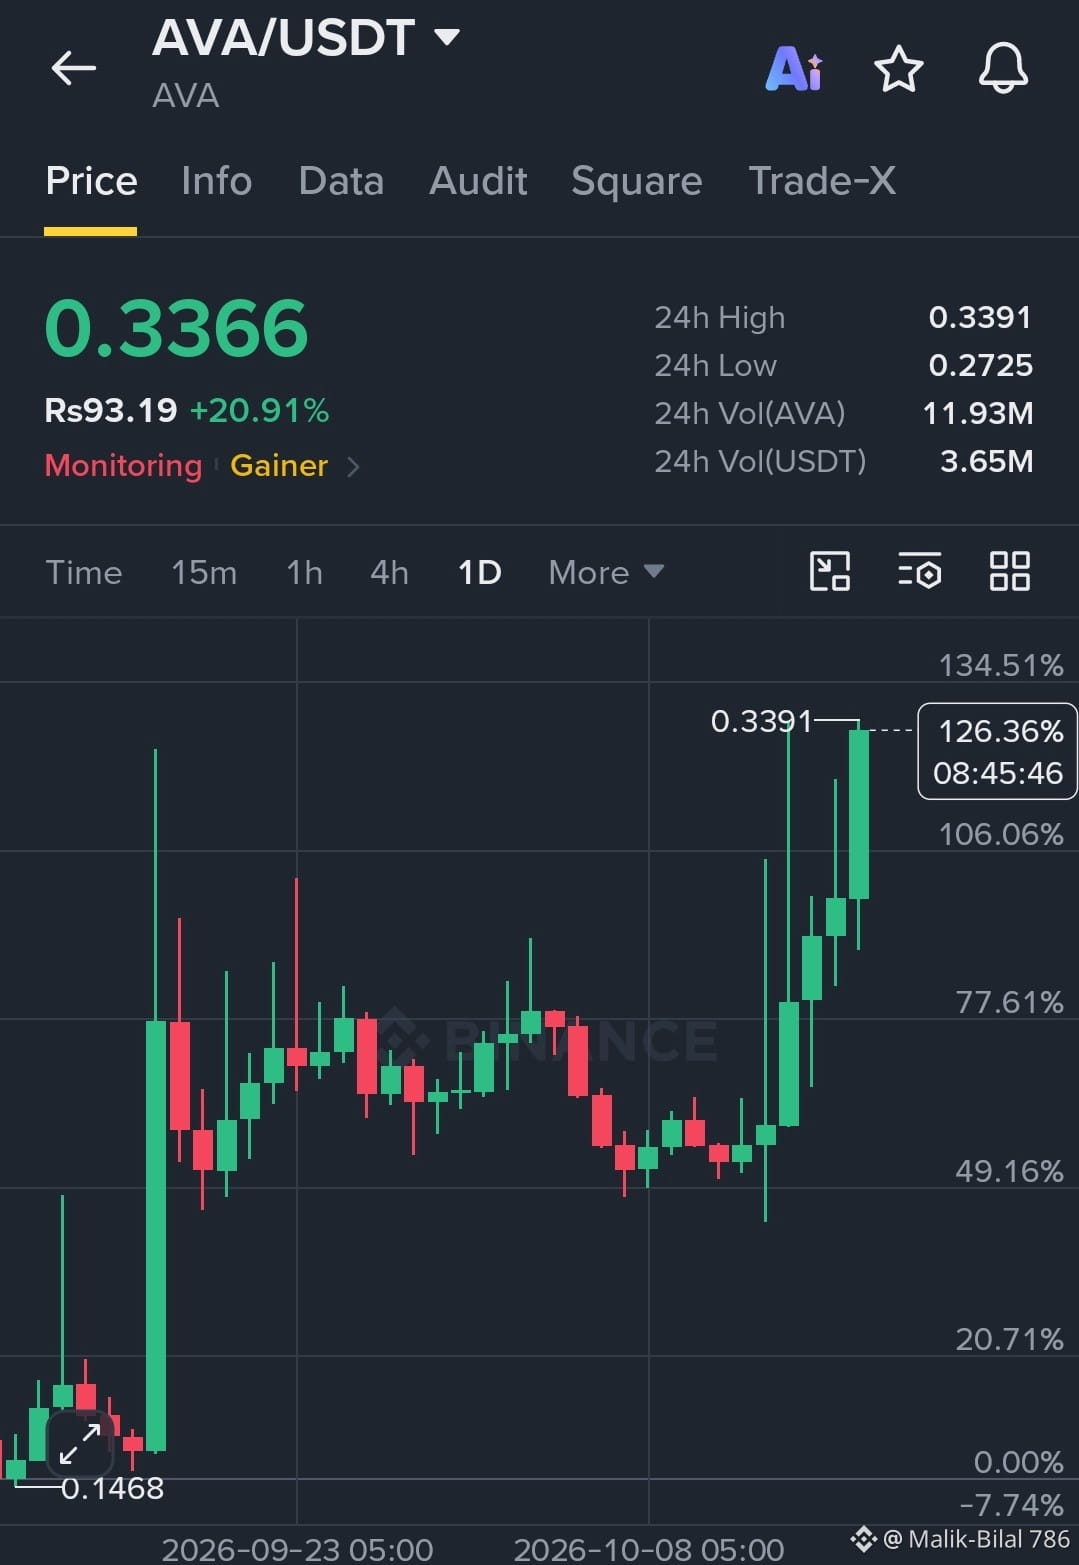
$AVA 24h change: +20.91% — strong bullish momentum.
Trend: Price is surging with strong green candles and rising volume, suggesting buyers are in control.
Resistance: 0.3391 USDT. A breakout above this level could open the way toward 0.35–0.36.
Support: 0.32, then 0.30–0.29 USDT.
RSI: RSI(30) at 67.69 indicates strong momentum but also a risk of short-term overbought conditions.
Short-term outlook: Bullish, but a pullback or consolidation is possible after this sharp rally. A daily close above 0.3391 with strong volume would strengthen the bullish case. Rejection at resistance could trigger profit-taking toward 0.32.
{spot}(AVAUSDT)
$AVA 24h change: +20.91% — strong bullish momentum.
Trend: Price is surging with strong green candles and rising volume, suggesting buyers are in control.
Resistance: 0.3391 USDT. A breakout above this level could open the way toward 0.35–0.36.
Support: 0.32, then 0.30–0.29 USDT.
RSI: RSI(30) at 67.69 indicates strong momentum but also a risk of short-term overbought conditions.
Short-term outlook: Bullish, but a pullback or consolidation is possible after this sharp rally. A daily close above 0.3391 with strong volume would strengthen the bullish case. Rejection at resistance could trigger profit-taking toward 0.32.
216
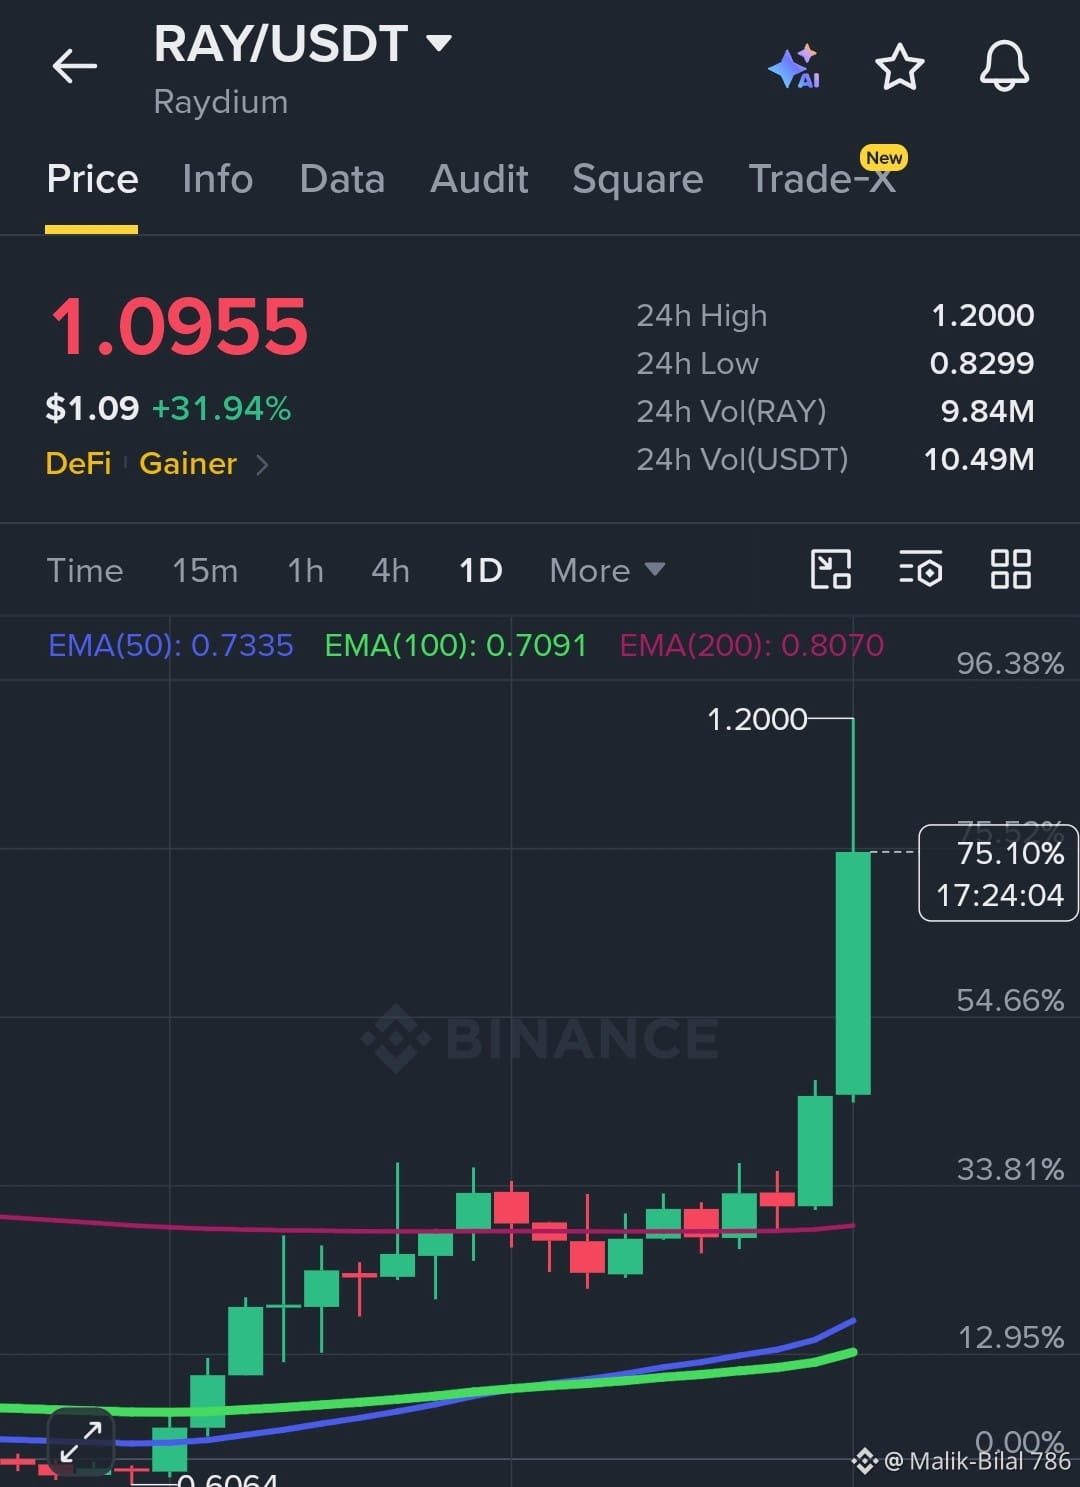
$RAY Raydium ($RAY) is exploding on the charts today with massive bullish momentum! 📈
The price has surged +31.94% in the last 24 hours, currently trading at $1.0955 after hitting a 24-hour high of $1.2000!
🔑 Technical Highlights:
📊 24h Volume: Strong volume inflow of 9.84M RAY (~$10.49M USDT), driving a clean vertical candle.
📈 Moving Average Breakout: $RAY has easily breached all key exponential moving averages—EMA 50 ($0.7335), EMA 100 ($0.7091), and EMA 200 ($0.8070).
⚠️ RSI Indicator: Daily RSI(30) is currently sitting at 76.10, signaling extreme buying strength, but also placing the asset in overbought territory.
📍 Key Levels To Watch:
🔴 Resistance: $1.2000 (24h High — a daily close above this level could unleash the next expansion wave)
🟢 Immediate Support: $0.9200 - $0.9500
🟢 Major Support: $0.8070 (200 EMA confluence zone)
💡 Trading Insight:
While momentum is strongly bullish, an RSI above 75 often suggests a short-term cooling off or consolidation before continuing upward. Watch for potential dip-buying opportunities near support zones rather than chasing green candles! 🛡️
$RAY Raydium ($RAY ) is exploding on the charts today with massive bullish momentum! 📈
The price has surged +31.94% in the last 24 hours, currently trading at $1.0955 after hitting a 24-hour high of $1.2000!
🔑 Technical Highlights:
📊 24h Volume: Strong volume inflow of 9.84M RAY (~$10.49M USDT), driving a clean vertical candle.
📈 Moving Average Breakout: $RAY has easily breached all key exponential moving averages—EMA 50 ($0.7335), EMA 100 ($0.7091), and EMA 200 ($0.8070).
⚠️ RSI Indicator: Daily RSI(30) is currently sitting at 76.10, signaling extreme buying strength, but also placing the asset in overbought territory.
📍 Key Levels To Watch:
🔴 Resistance: $1.2000 (24h High — a daily close above this level could unleash the next expansion wave)
🟢 Immediate Support: $0.9200 - $0.9500
🟢 Major Support: $0.8070 (200 EMA confluence zone)
💡 Trading Insight:
While momentum is strongly bullish, an RSI above 75 often suggests a short-term cooling off or consolidation before continuing upward. Watch for potential dip-buying opportunities near support zones rather than chasing green candles! 🛡️
79
Статья
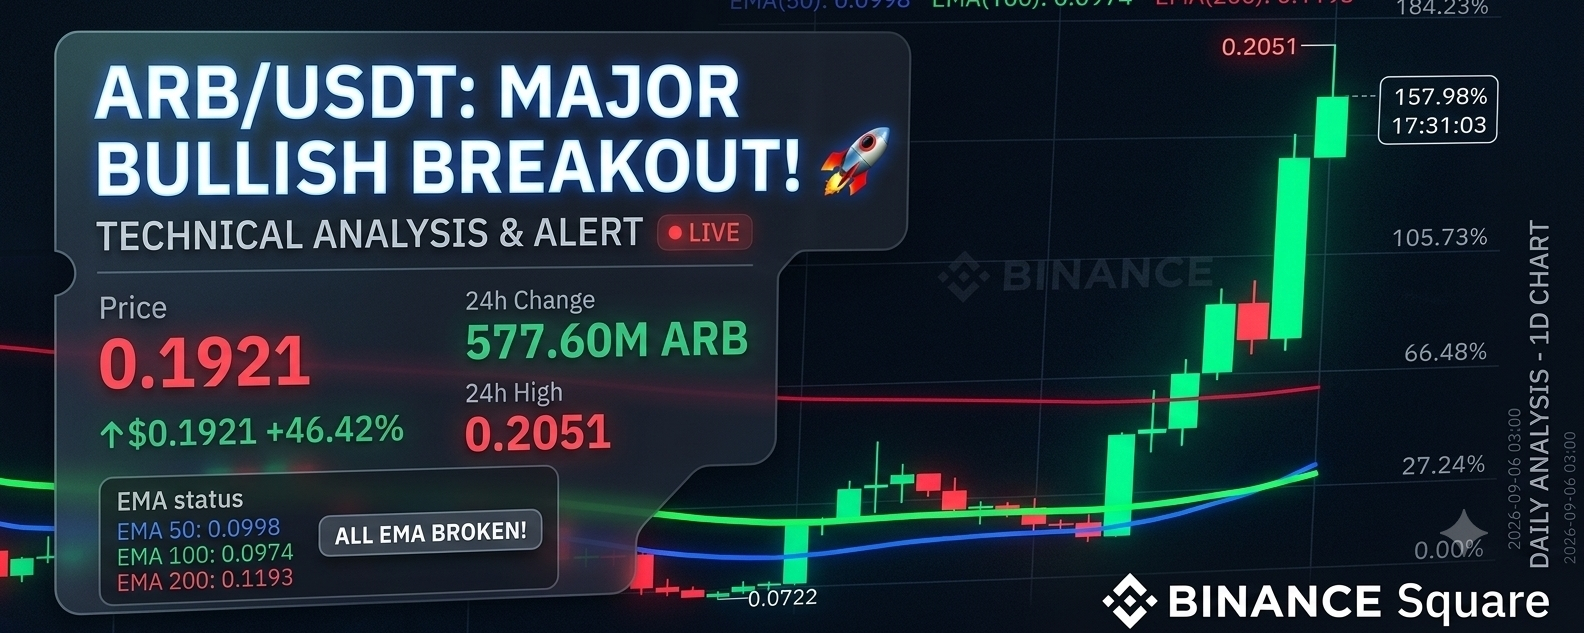
🚨 ARB / USDT: MASSIVE BREAKOUT IN PROGRESS! 🚀🔥$ARB Arbitrum ($ARB) is making serious noise today with a massive vertical surge! 📈
Price has smashed through major resistance zones, printing a solid +46%+ gain in 24 hours and reaching a high of $0.2051 (+157% from recent consolidation levels)! 💣
🔑 Key Technical Highlights:
📊 24h Volume: Huge volume inflow exceeding 577M ARB (~$99.8M USDT), proving this move is backed by real buying pressure!
📈 Moving Averages Shattered: ARB comfortably cleared the EMA 50 ($0.0998), EMA 100 ($0.0974), and EMA 200 ($0.1193), turning past overhead resistance into solid dynamic support.
⚡ Momentum: Strong bullish continuation on the daily timeframe with high volatility.
📍 Levels To Watch:
🔴 Resistance: $0.2051 (24h High — a daily close above this opens doors for higher targets)
🟢 Immediate Support: $0.1580 - $0.1600
🟢 Major Support: $0.1193 (200 EMA zone)
💡 Trading Strategy / Caution:
Extreme parabolic candles often lead to quick retests. Watch out for potential pullbacks toward $0.1580 to cool off indicators before the next leg up. Avoid FOMOing blindly—always wait for confirmation or buy the dips with tight risk management! 🛡️
🚨 ARB / USDT: MASSIVE BREAKOUT IN PROGRESS! 🚀🔥
$ARB Arbitrum ($ARB ) is making serious noise today with a massive vertical surge! 📈
Price has smashed through major resistance zones, printing a solid +46%+ gain in 24 hours and reaching a high of $0.2051 (+157% from recent consolidation levels)! 💣
🔑 Key Technical Highlights:
📊 24h Volume: Huge volume inflow exceeding 577M ARB (~$99.8M USDT), proving this move is backed by real buying pressure!
📈 Moving Averages Shattered: ARB comfortably cleared the EMA 50 ($0.0998), EMA 100 ($0.0974), and EMA 200 ($0.1193), turning past overhead resistance into solid dynamic support.
⚡ Momentum: Strong bullish continuation on the daily timeframe with high volatility.
📍 Levels To Watch:
🔴 Resistance: $0.2051 (24h High — a daily close above this opens doors for higher targets)
🟢 Immediate Support: $0.1580 - $0.1600
🟢 Major Support: $0.1193 (200 EMA zone)
💡 Trading Strategy / Caution:
Extreme parabolic candles often lead to quick retests. Watch out for potential pullbacks toward $0.1580 to cool off indicators before the next leg up. Avoid FOMOing blindly—always wait for confirmation or buy the dips with tight risk management! 🛡️
118
🇺🇸 White House Executive Director Patrick Witt on the Clarity Act: "We cannot afford to delay any longer"
🇺🇸 White House Executive Director Patrick Witt on the Clarity Act: "We cannot afford to delay any longer"

66
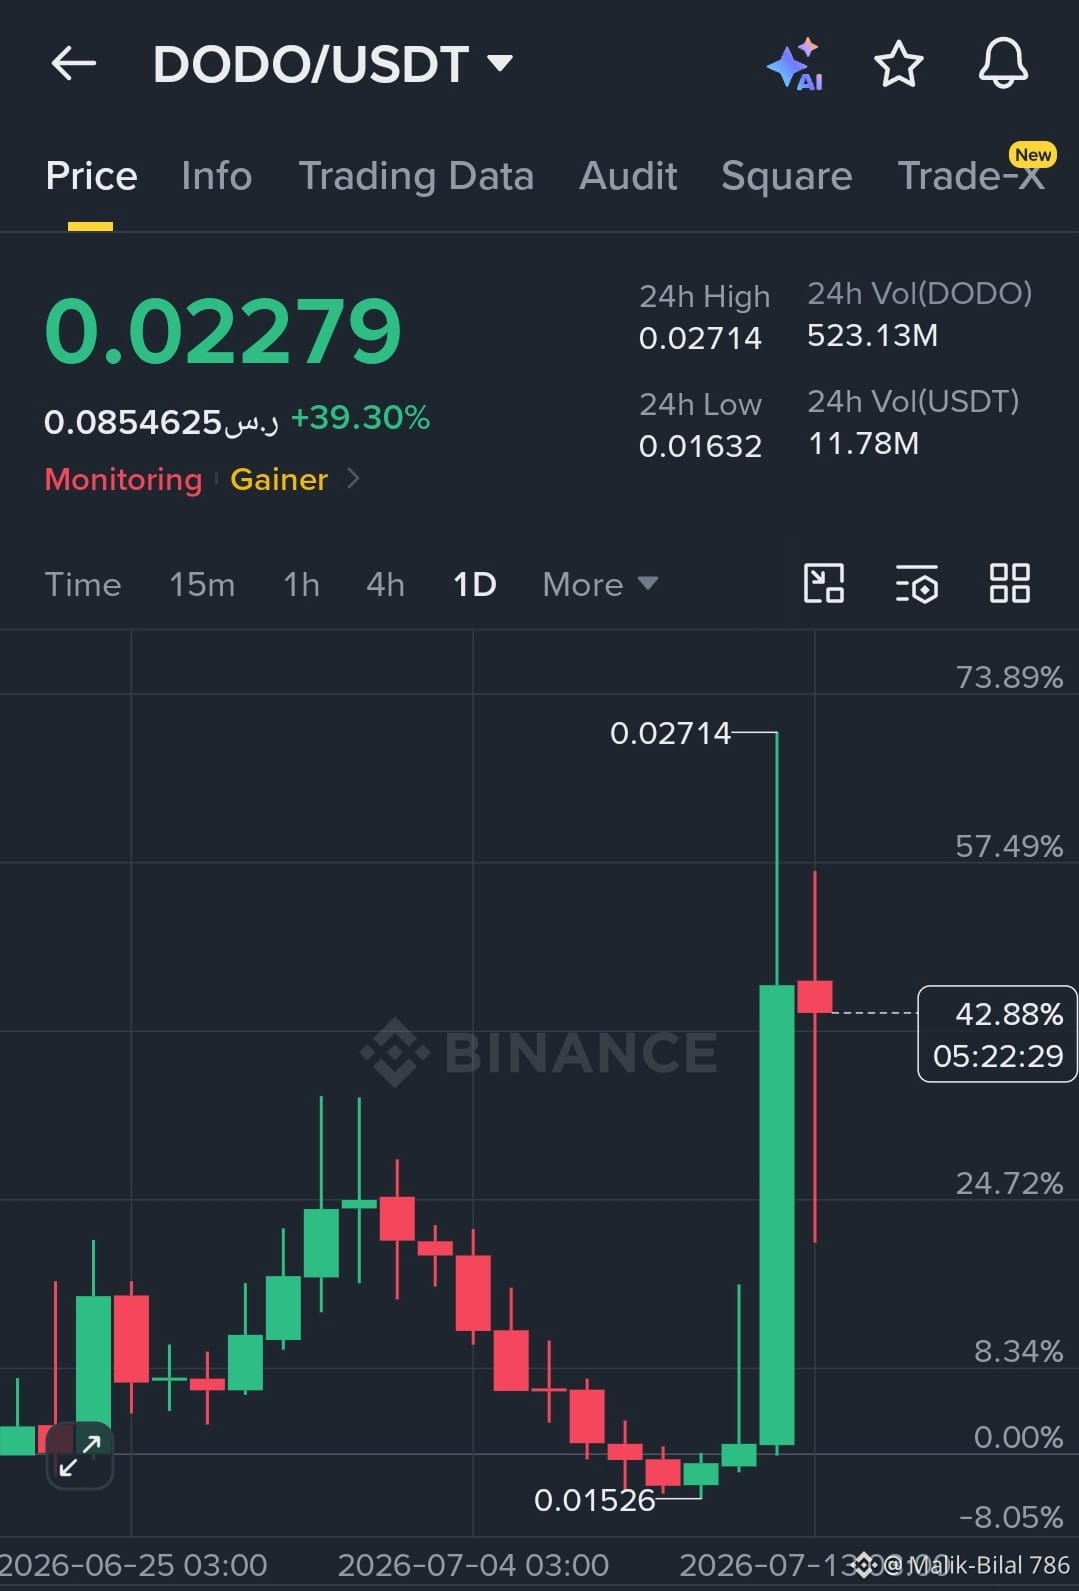
$DODO DODO has surged nearly 40% with strong buying volume, confirming a bullish breakout from its recent downtrend.
📈 Support: $0.0215–0.0220
🎯 Targets: $0.0255 → $0.0271 → $0.0300
🛑 Stop-loss: Below $0.0205
#BinanceTurns9
#MarketsPriceInOneFedHikeBeforeSeptember
StrategyRaises$467MEquityNoBitcoinSold
{spot}(DODOUSDT)
$DODO DODO has surged nearly 40% with strong buying volume, confirming a bullish breakout from its recent downtrend.
📈 Support: $0.0215–0.0220
🎯 Targets: $0.0255 → $0.0271 → $0.0300
🛑 Stop-loss: Below $0.0205
#BinanceTurns9
#MarketsPriceInOneFedHikeBeforeSeptember
StrategyRaises$467MEquityNoBitcoinSold
📈 Support: $0.0215–0.0220
🎯 Targets: $0.0255 → $0.0271 → $0.0300
🛑 Stop-loss: Below $0.0205
#BinanceTurns9
#MarketsPriceInOneFedHikeBeforeSeptember
StrategyRaises$467MEquityNoBitcoinSold
1
116
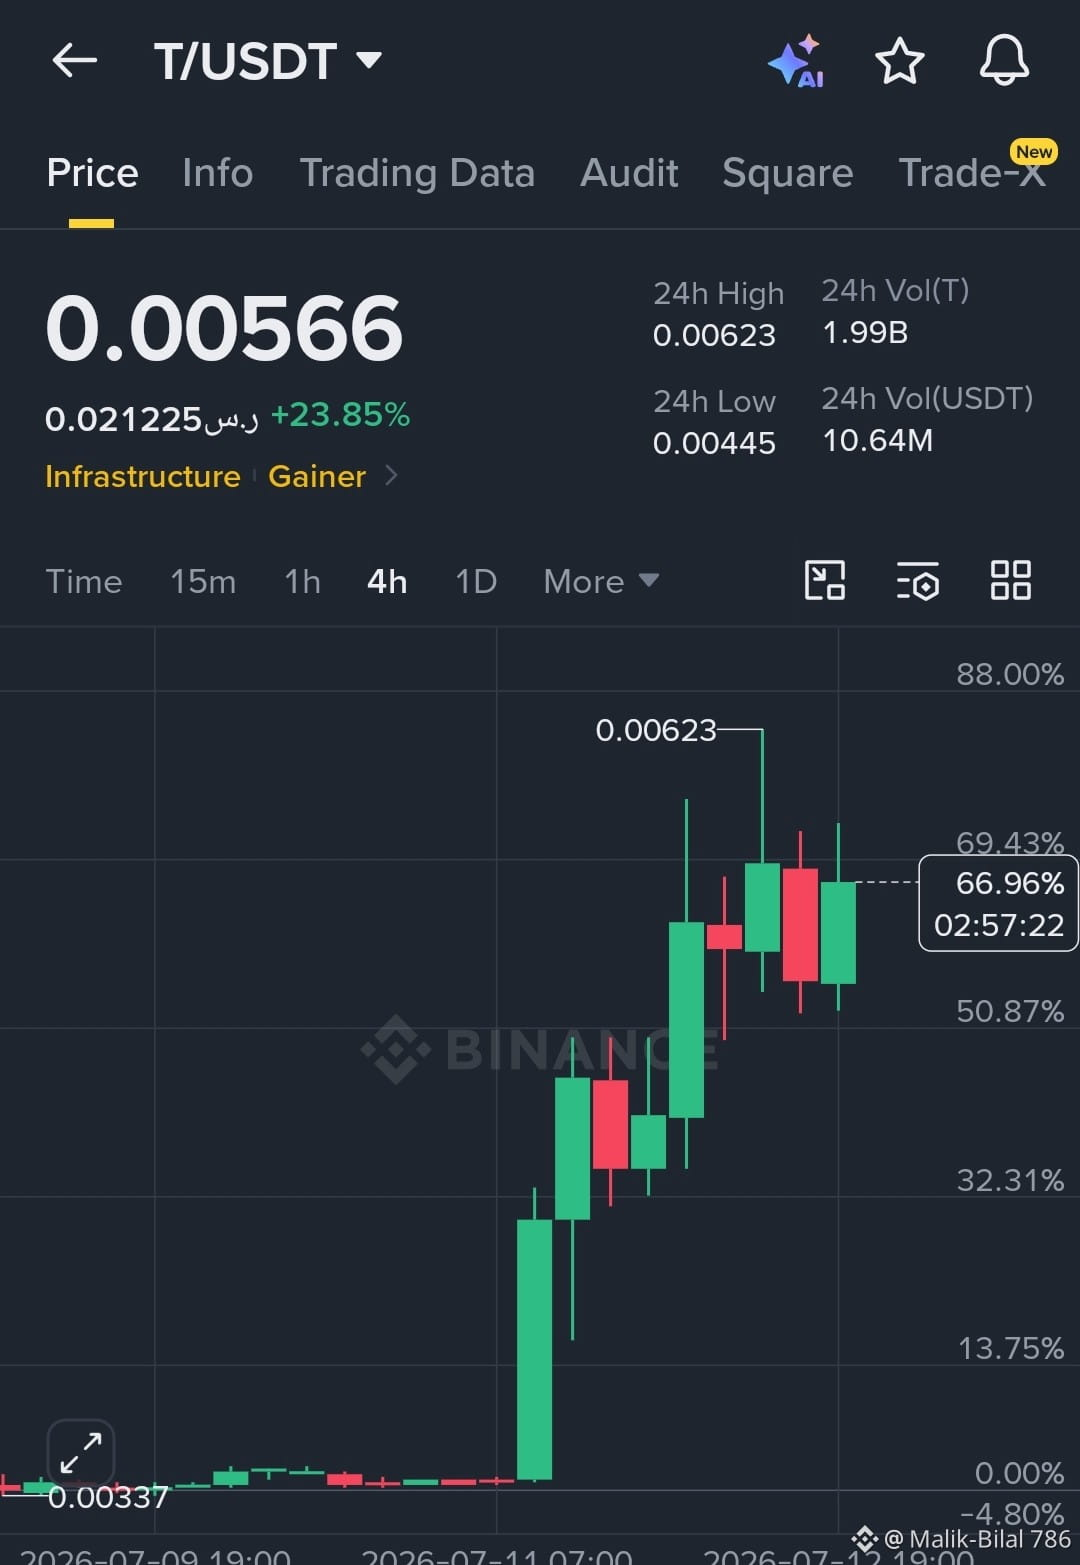
$T remains in a strong bullish trend, up nearly 24% in the last 24 hours after a powerful breakout. Price is consolidating around $0.00566, while $0.00623 is the key resistance.
🔹 Entry Zone: $0.00540–0.00570
✅ Confirmation: 4H close above $0.00623
🎯 Targets: $0.00680 → $0.00750 → $0.00820
🛑 Stop-Loss: Below $0.00510
🔹 Entry Zone: $0.00540–0.00570
✅ Confirmation: 4H close above $0.00623
🎯 Targets: $0.00680 → $0.00750 → $0.00820
🛑 Stop-Loss: Below $0.00510
202
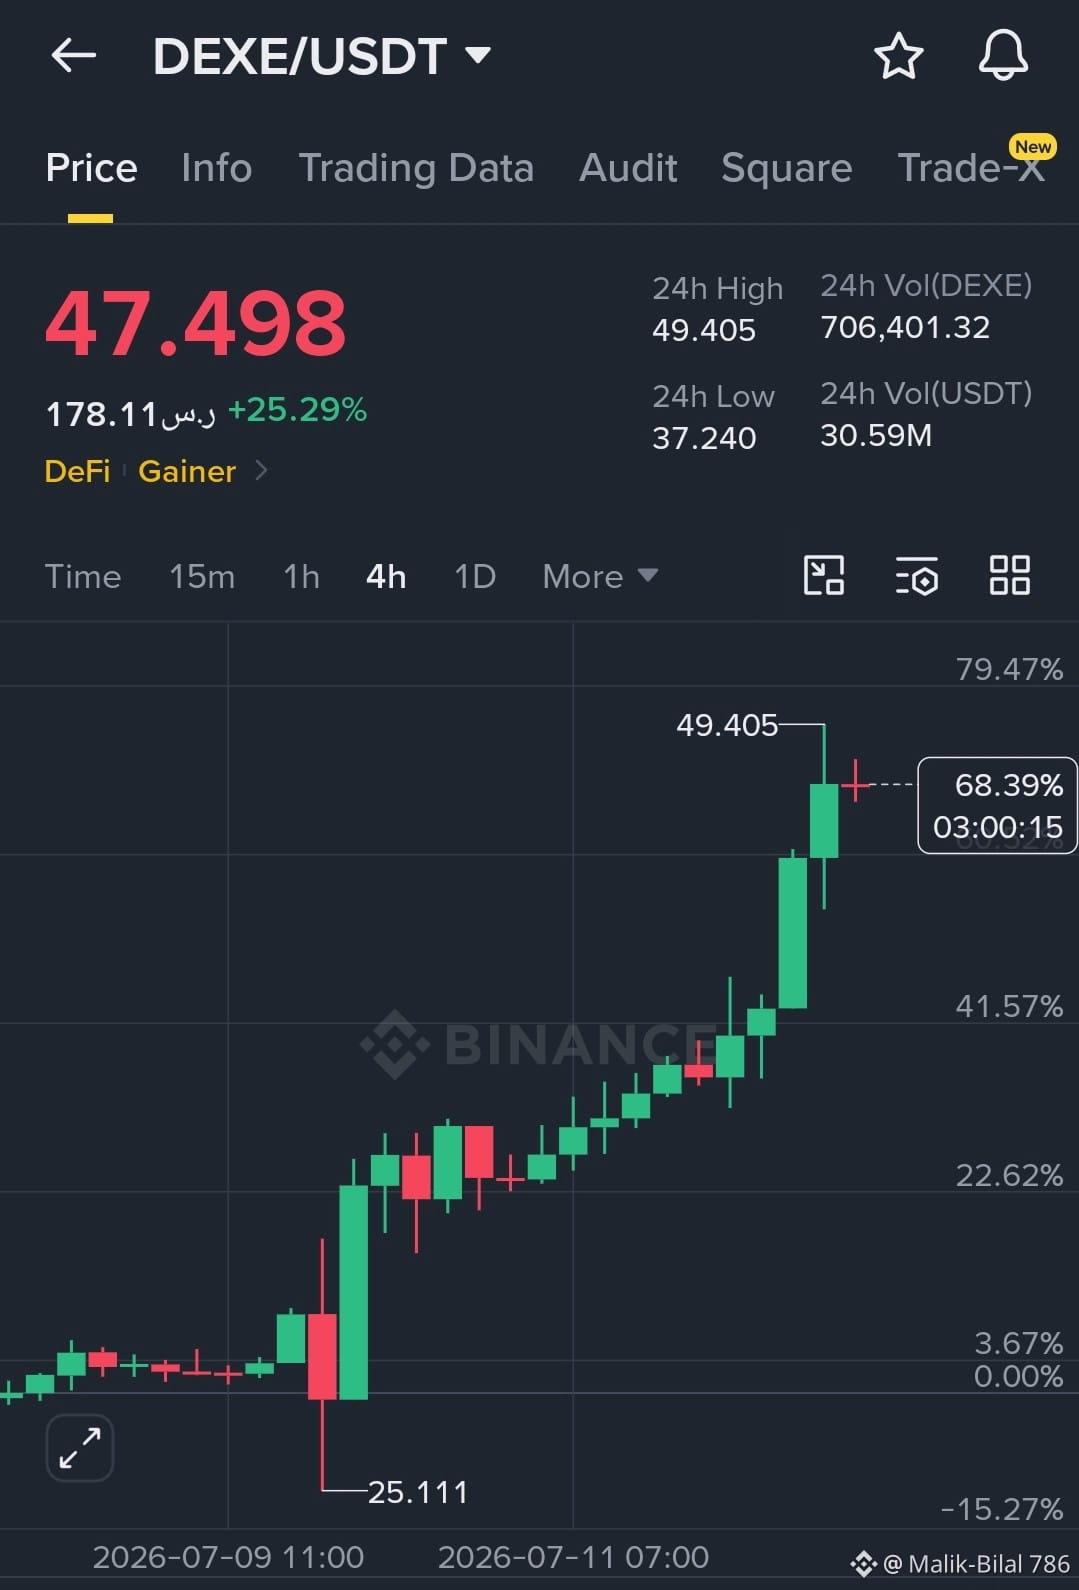
$DEXE DEXE remains strongly bullish after a sharp breakout, gaining over 25% in the last 24 hours. Price is consolidating near $47.50, just below the $49.40 resistance.
🔹 Entry Zone: $46.00–47.20
✅ Confirmation: A 4H close above $49.40 could trigger the next rally.
🎯 Targets: $52.00 → $55.00 → $60.00
🛑 Stop-Loss: Below $44.50
Momentum is still positive, but after such a strong move, a short-term pullback before the next leg higher would be healthy.#BitcoinPlansECashHardFork #AMDSharesSlideNearly10%
{spot}(DEXEUSDT)
$DEXE DEXE remains strongly bullish after a sharp breakout, gaining over 25% in the last 24 hours. Price is consolidating near $47.50, just below the $49.40 resistance.
🔹 Entry Zone: $46.00–47.20
✅ Confirmation: A 4H close above $49.40 could trigger the next rally.
🎯 Targets: $52.00 → $55.00 → $60.00
🛑 Stop-Loss: Below $44.50
Momentum is still positive, but after such a strong move, a short-term pullback before the next leg higher would be healthy.#BitcoinPlansECashHardFork #AMDSharesSlideNearly10%
1
1
361
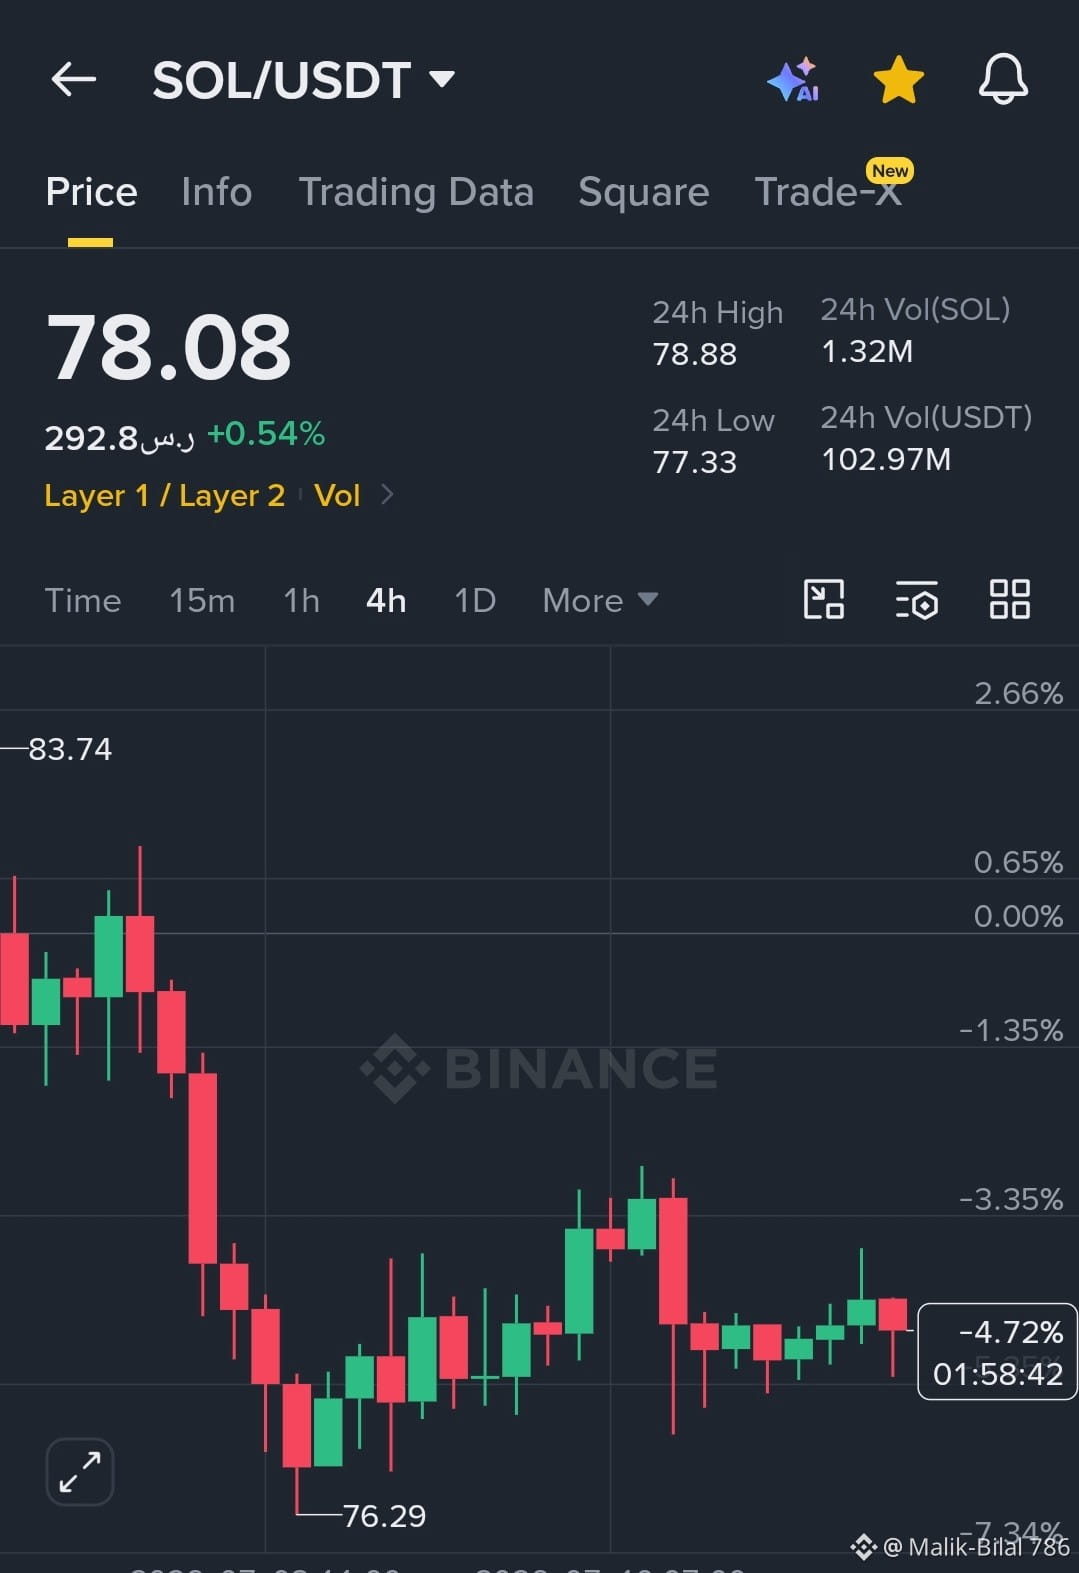
$SOL SOL is trading around $78.08 and is attempting to stabilize after a recent correction. Support lies at $76.30–$77.30, while resistance is at $79–$80. A breakout above $80 could trigger a move toward $82–$84. The short-term bias is neutral to bullish as long as $76.30 holds.#IranRulesOutTalksUntilUSWithdraws CashCatTops$200MMarketCap
{spot}(SOLUSDT)
$SOL SOL is trading around $78.08 and is attempting to stabilize after a recent correction. Support lies at $76.30–$77.30, while resistance is at $79–$80. A breakout above $80 could trigger a move toward $82–$84. The short-term bias is neutral to bullish as long as $76.30 holds.#IranRulesOutTalksUntilUSWithdraws CashCatTops$200MMarketCap
67
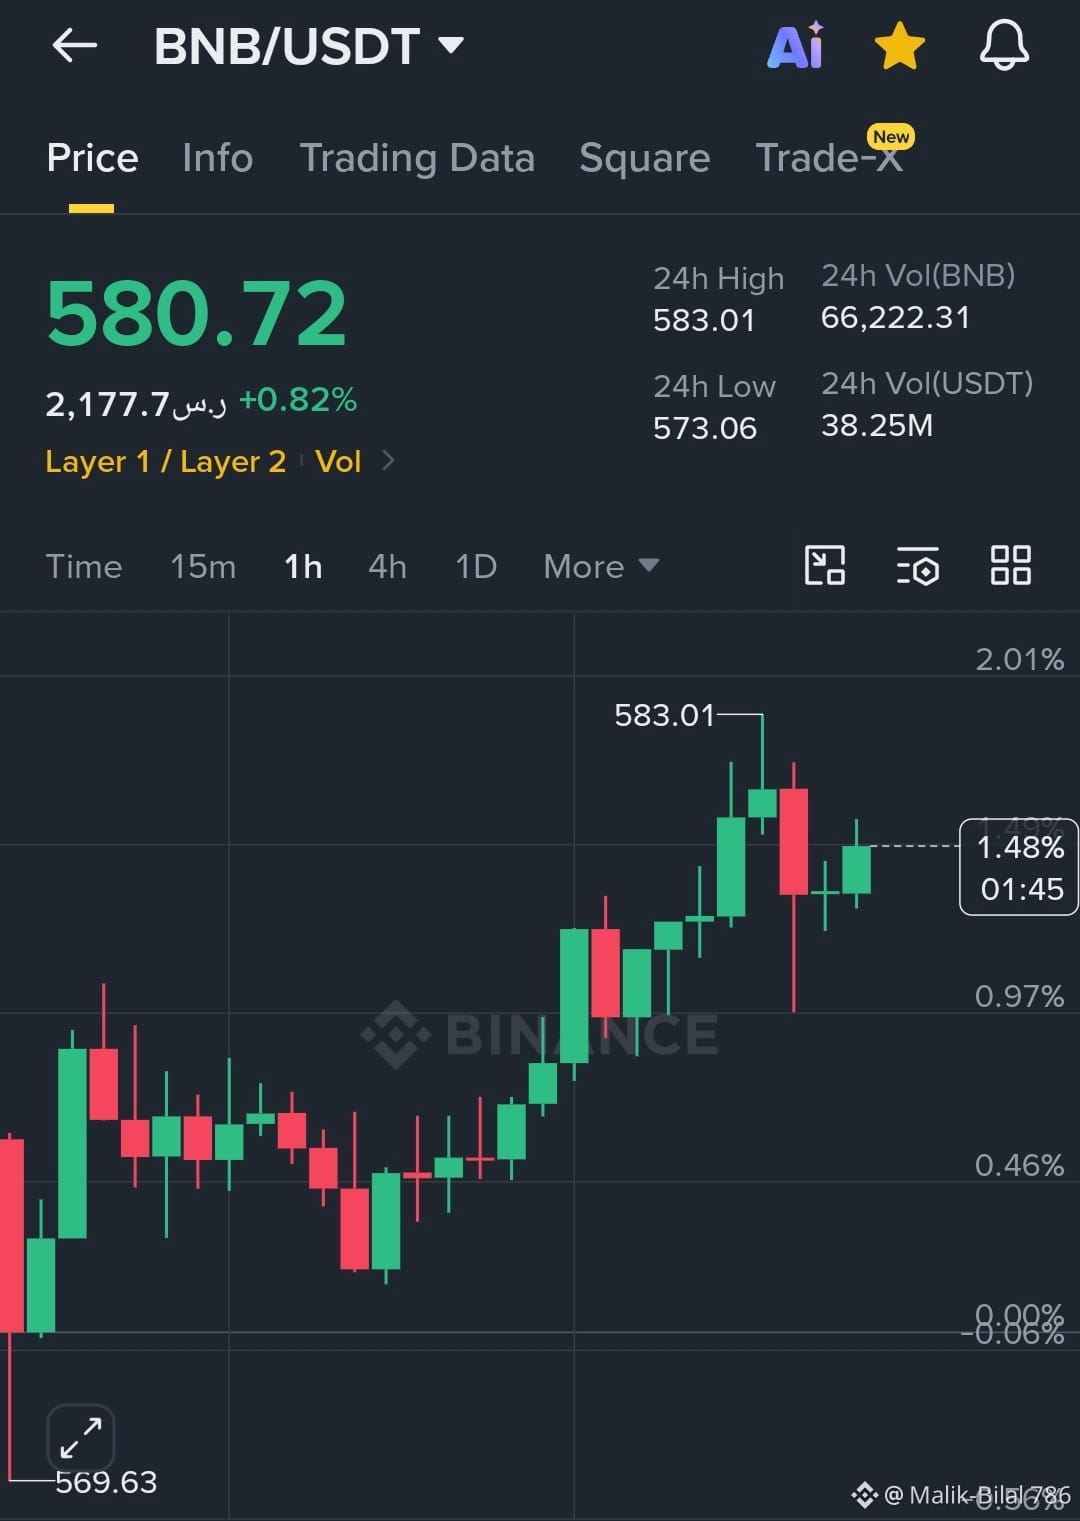
$BNB BNB is showing bullish momentum, trading around $580.72 after rejecting the $573 support zone. A sustained move above $583 could open the way toward $590–$600. If price falls below $573, a pullback to $565 is possible. Overall bias remains bullish as long as key support holds.#BitcoinUp9.5%InJulyBestInFourYears #XRPActiveWalletsHitSecondLowestOf2026 USRetailInvestorsBuyNet$13BInStocks
{spot}(BNBUSDT)
$BNB BNB is showing bullish momentum, trading around $580.72 after rejecting the $573 support zone. A sustained move above $583 could open the way toward $590–$600. If price falls below $573, a pullback to $565 is possible. Overall bias remains bullish as long as key support holds.#BitcoinUp9.5%InJulyBestInFourYears #XRPActiveWalletsHitSecondLowestOf2026 USRetailInvestorsBuyNet$13BInStocks
71
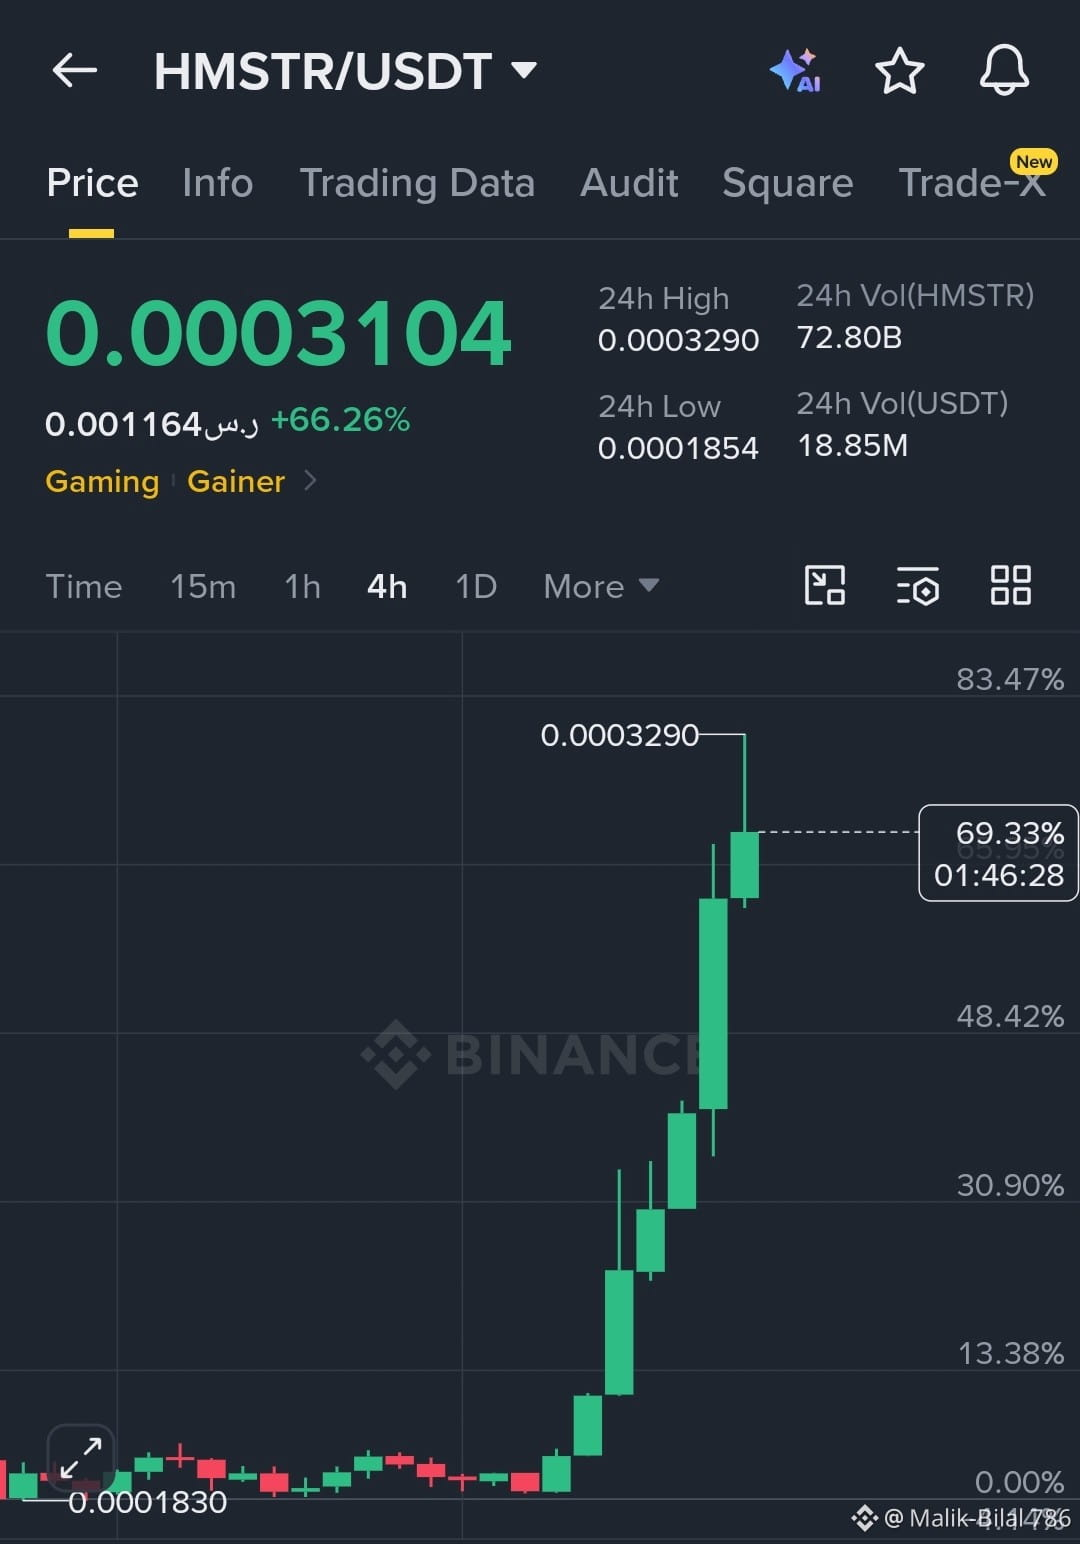
$HMSTR Bullish Momentum: HMSTR has surged over 66%, showing strong buying pressure and a clear breakout from its recent consolidation.
Current Price: 0.0003104
Resistance: 0.0003290 (today's high). A confirmed breakout above this level could push the price toward 0.0003500–0.0003800.
Support: 0.0002800, then 0.0002500 if a pullback occurs.
Bias: Bullish, but the rally is extended, so a short-term pullback or consolidation is possible before the next move.
Trade Idea:
Entry: 0.0002850–0.0003000 (on pullback) or after a confirmed breakout above 0.0003290
Take Profit: 0.0003500 / 0.0003800
Stop Loss: Below 0.0002700
Wait for confirmation instead of chasing the current pump.
{spot}(HMSTRUSDT)
#GillibrandCallsForDigitalAssetEthicsBan #RevolutToDelistUSDT
$HMSTR Bullish Momentum: HMSTR has surged over 66%, showing strong buying pressure and a clear breakout from its recent consolidation.
Current Price: 0.0003104
Resistance: 0.0003290 (today's high). A confirmed breakout above this level could push the price toward 0.0003500–0.0003800.
Support: 0.0002800, then 0.0002500 if a pullback occurs.
Bias: Bullish, but the rally is extended, so a short-term pullback or consolidation is possible before the next move.
Trade Idea:
Entry: 0.0002850–0.0003000 (on pullback) or after a confirmed breakout above 0.0003290
Take Profit: 0.0003500 / 0.0003800
Stop Loss: Below 0.0002700
Wait for confirmation instead of chasing the current pump.
#GillibrandCallsForDigitalAssetEthicsBan #RevolutToDelistUSDT
186
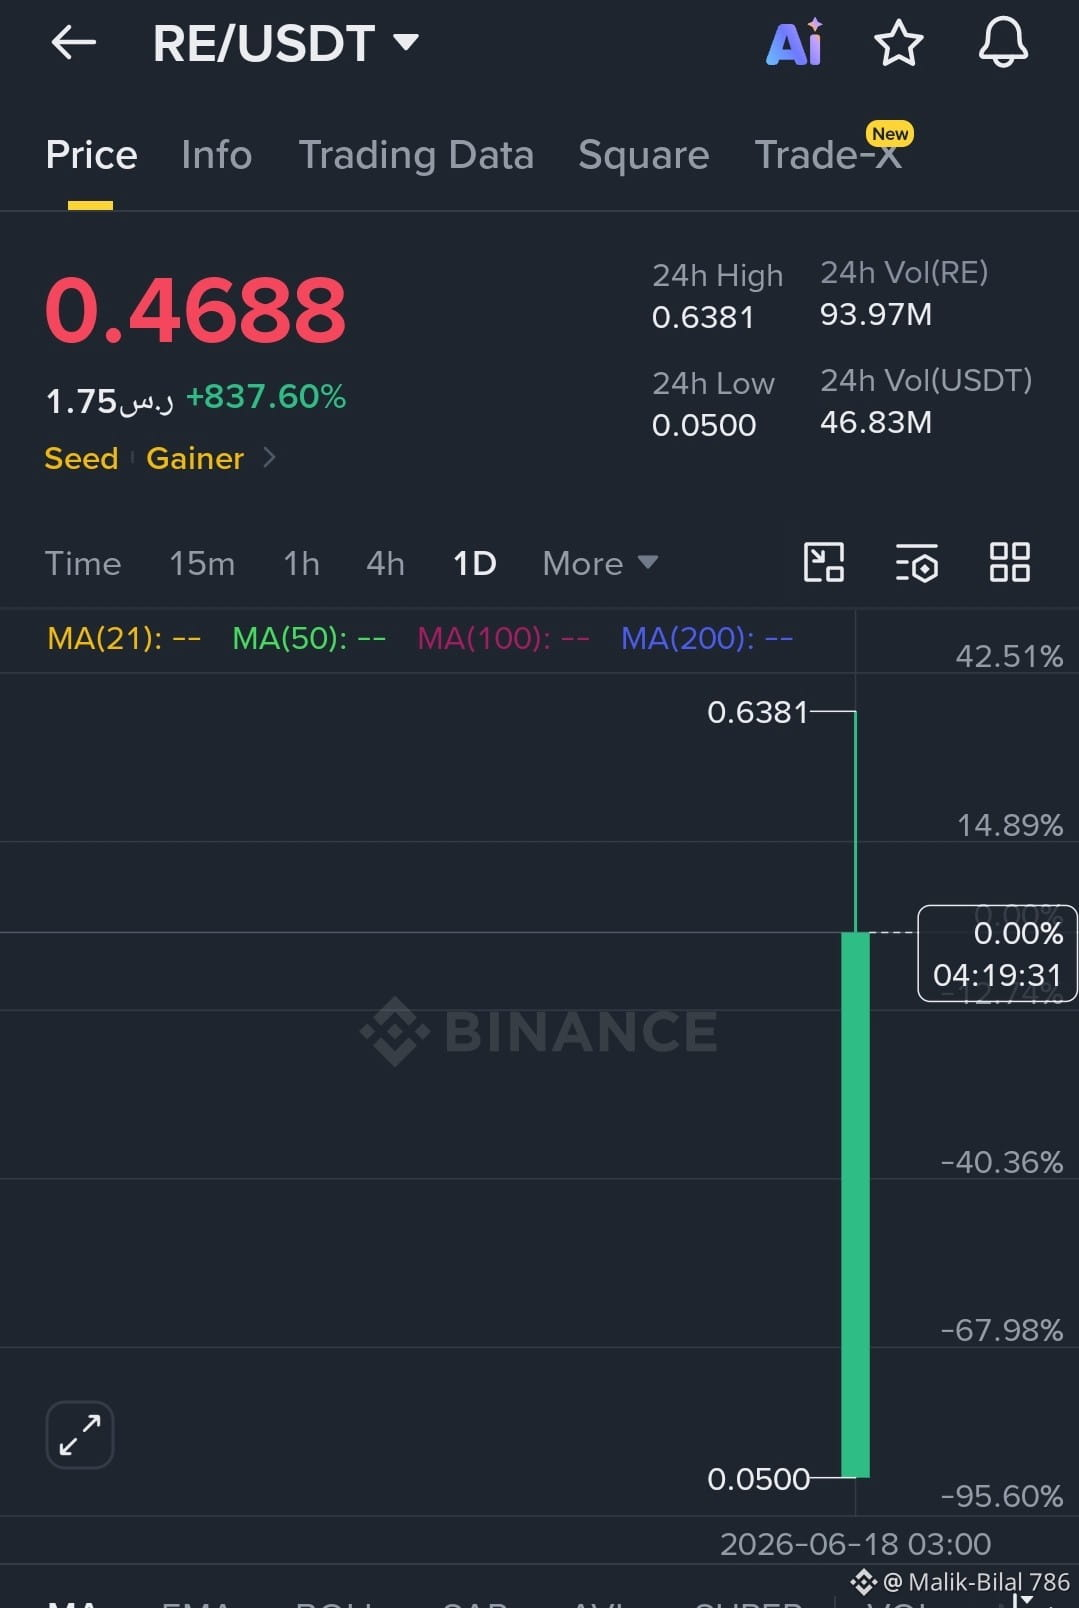
$RE RE/USDT remains highly volatile after an explosive +837% surge, reaching a high of $0.6381 before pulling back to around $0.4688.
Support Zone: $0.40 – $0.45
Resistance Zone: $0.55 – $0.64
Bias: Bullish but extremely risky
Momentum: Strong buying interest is present, but profit-taking could trigger sharp corrections.
A sustained move above $0.55 may open the door toward $0.64+, while losing $0.40 could lead to a deeper retracement. Trade cautiously due to the unusually high volatility.
263
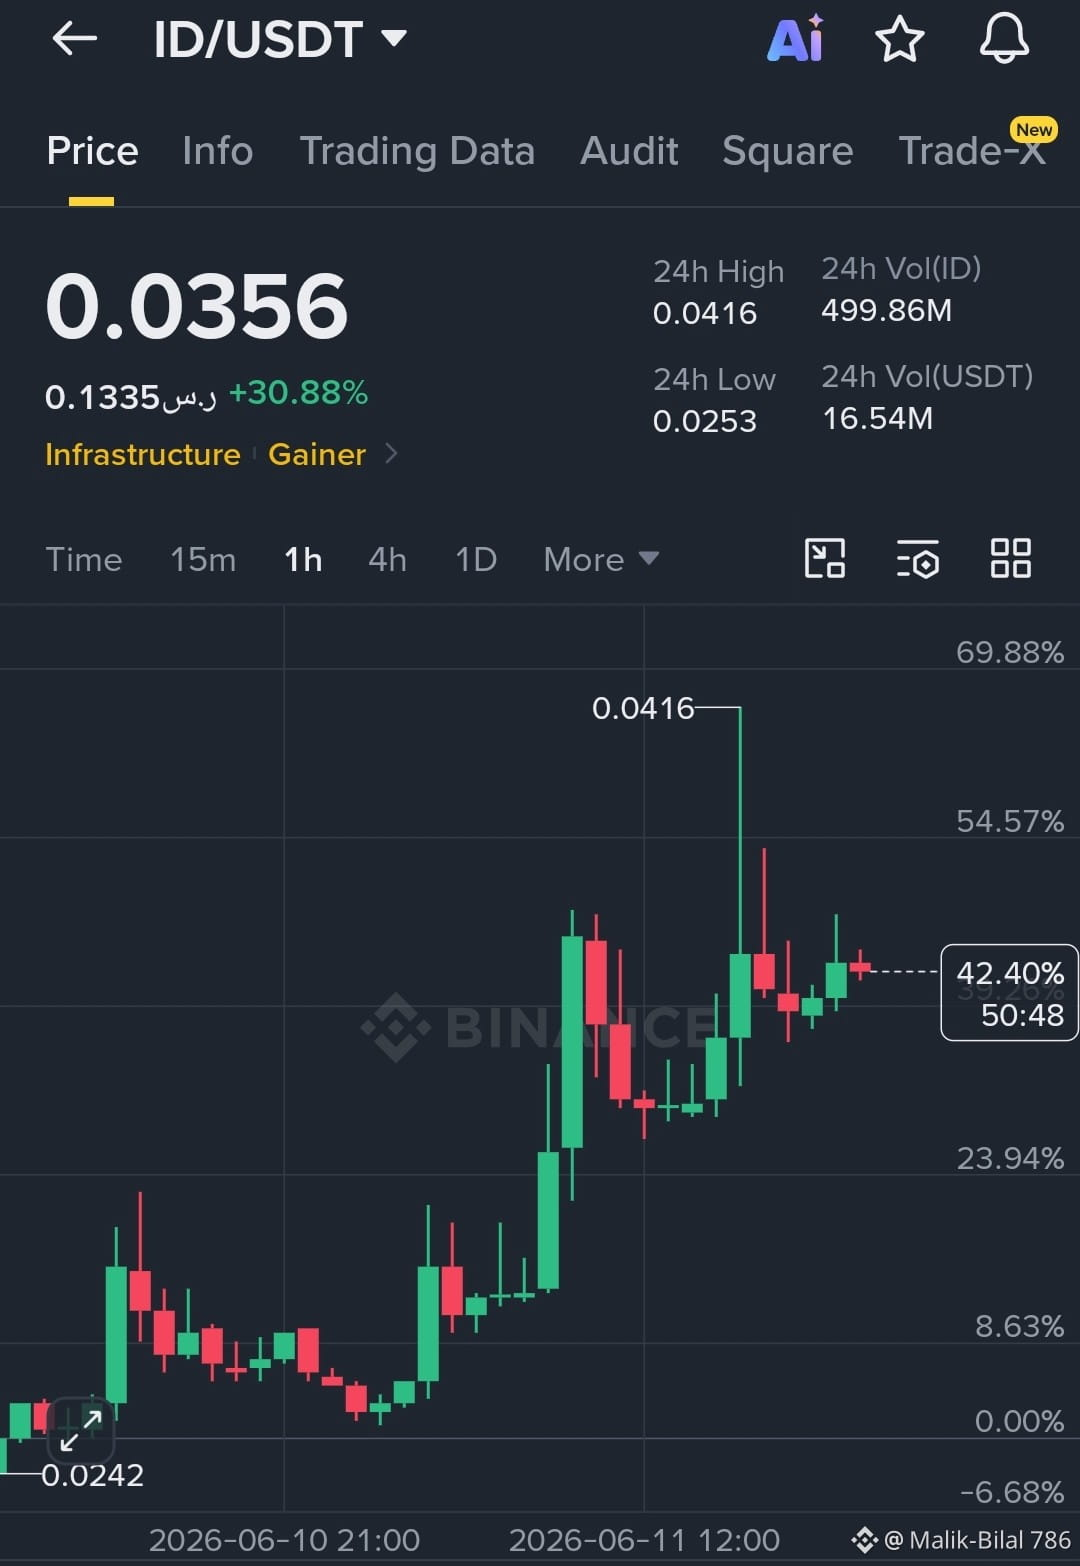
$ID Current Price: $0.0356 (+30.88%)
• Strong bullish momentum remains intact after a sharp rally. • Price is consolidating above the $0.034 support zone, indicating buyers are still active. • Resistance lies at $0.0385 and $0.0416. • A breakout above $0.0385 could open the door toward $0.0450. • If $0.034 support fails, a pullback toward $0.0320 is possible.
Entry: $0.0340–$0.0360
TP1: $0.0416
TP2: $0.0450
SL: $0.0320
81
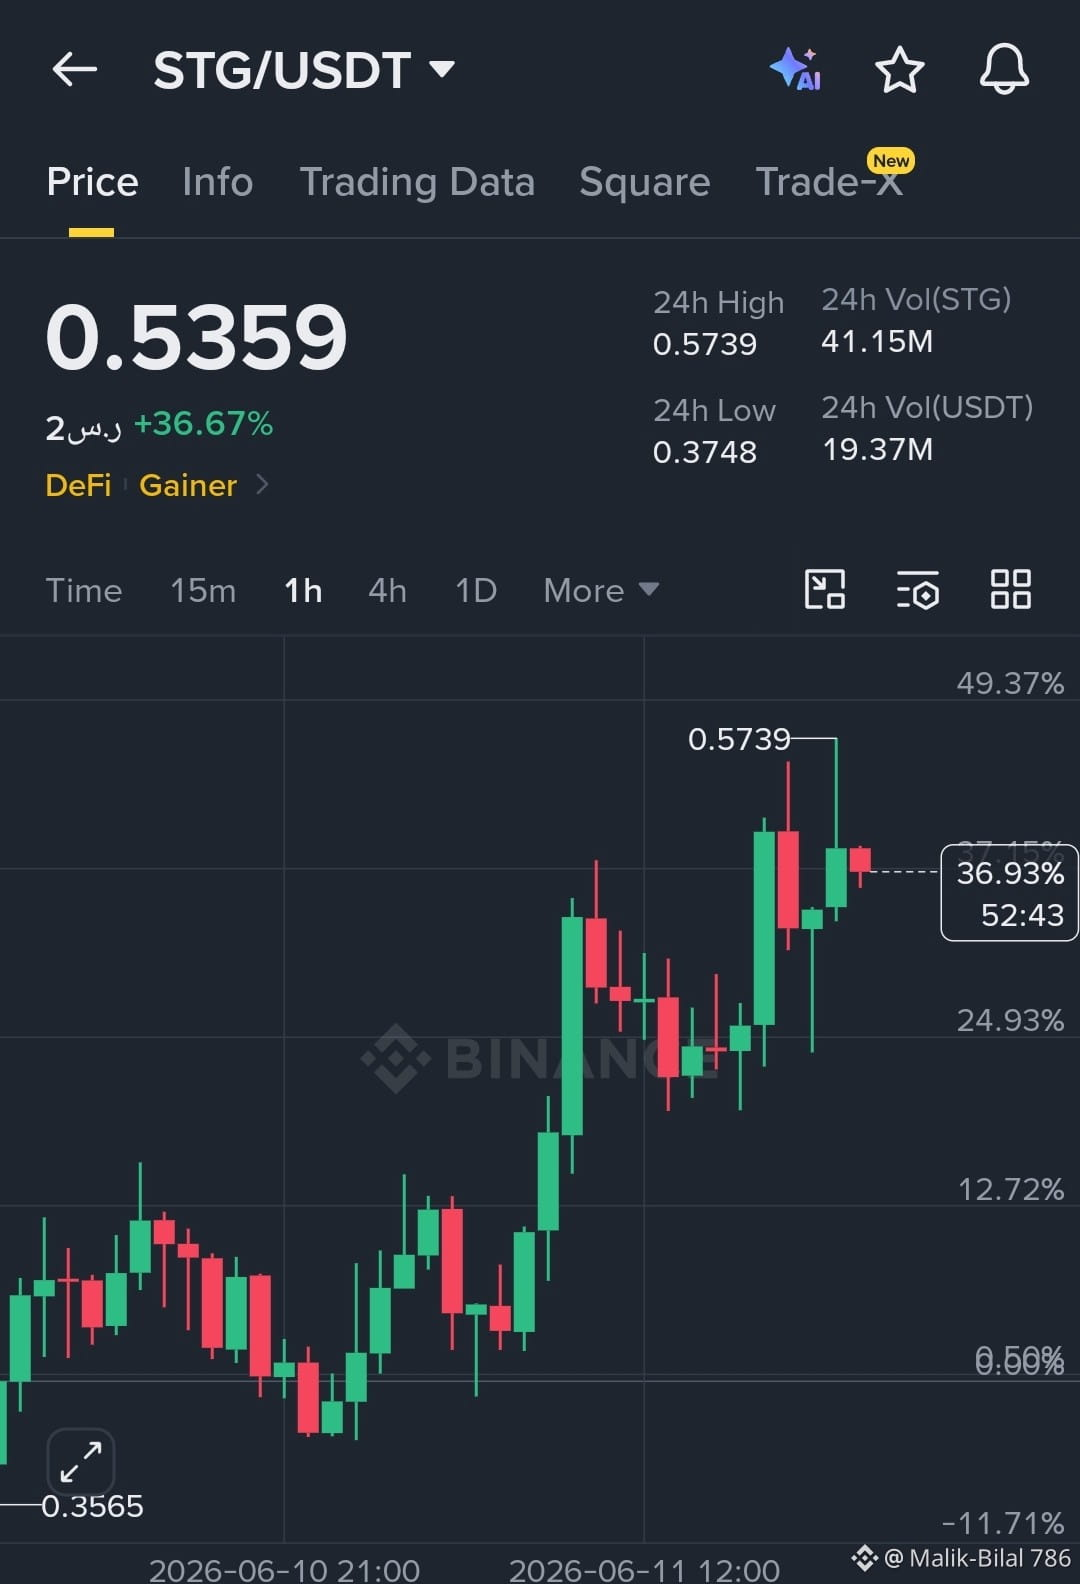
$STG Bullish Momentum Continues
Current price: $0.5359
STG has surged over 36% in the last 24 hours, showing strong buying pressure.
Price recently hit a high of $0.5739 and is now consolidating above $0.52, which is a positive sign.
Immediate support: $0.52 – $0.50
Resistance: $0.57, then $0.60
Trading View:
As long as price holds above $0.52, bulls remain in control.
A breakout above $0.574 could push STG toward $0.60–$0.65.
Losing $0.50 may trigger a deeper pullback toward $0.47.
112
$ETH
Bullish Recovery in Progress
Price: $1,631
Entry Zone: $1,610–1,635
Confirmation: Break above $1,660
TP1: $1,680
TP2: $1,720
TP3: $1,800
Stop Loss: $1,570
Bias: Bullish. Holding above $1,600 keeps the recovery trend intact. A breakout above $1,660 could trigger a move toward $1,700–1,800.
$ETH
Bullish Recovery in Progress
Price: $1,631
Entry Zone: $1,610–1,635
Confirmation: Break above $1,660
TP1: $1,680
TP2: $1,720
TP3: $1,800
Stop Loss: $1,570
Bias: Bullish. Holding above $1,600 keeps the recovery trend intact. A breakout above $1,660 could trigger a move toward $1,700–1,800.
Bullish Recovery in Progress
Price: $1,631
Entry Zone: $1,610–1,635
Confirmation: Break above $1,660
TP1: $1,680
TP2: $1,720
TP3: $1,800
Stop Loss: $1,570
Bias: Bullish. Holding above $1,600 keeps the recovery trend intact. A breakout above $1,660 could trigger a move toward $1,700–1,800.
81
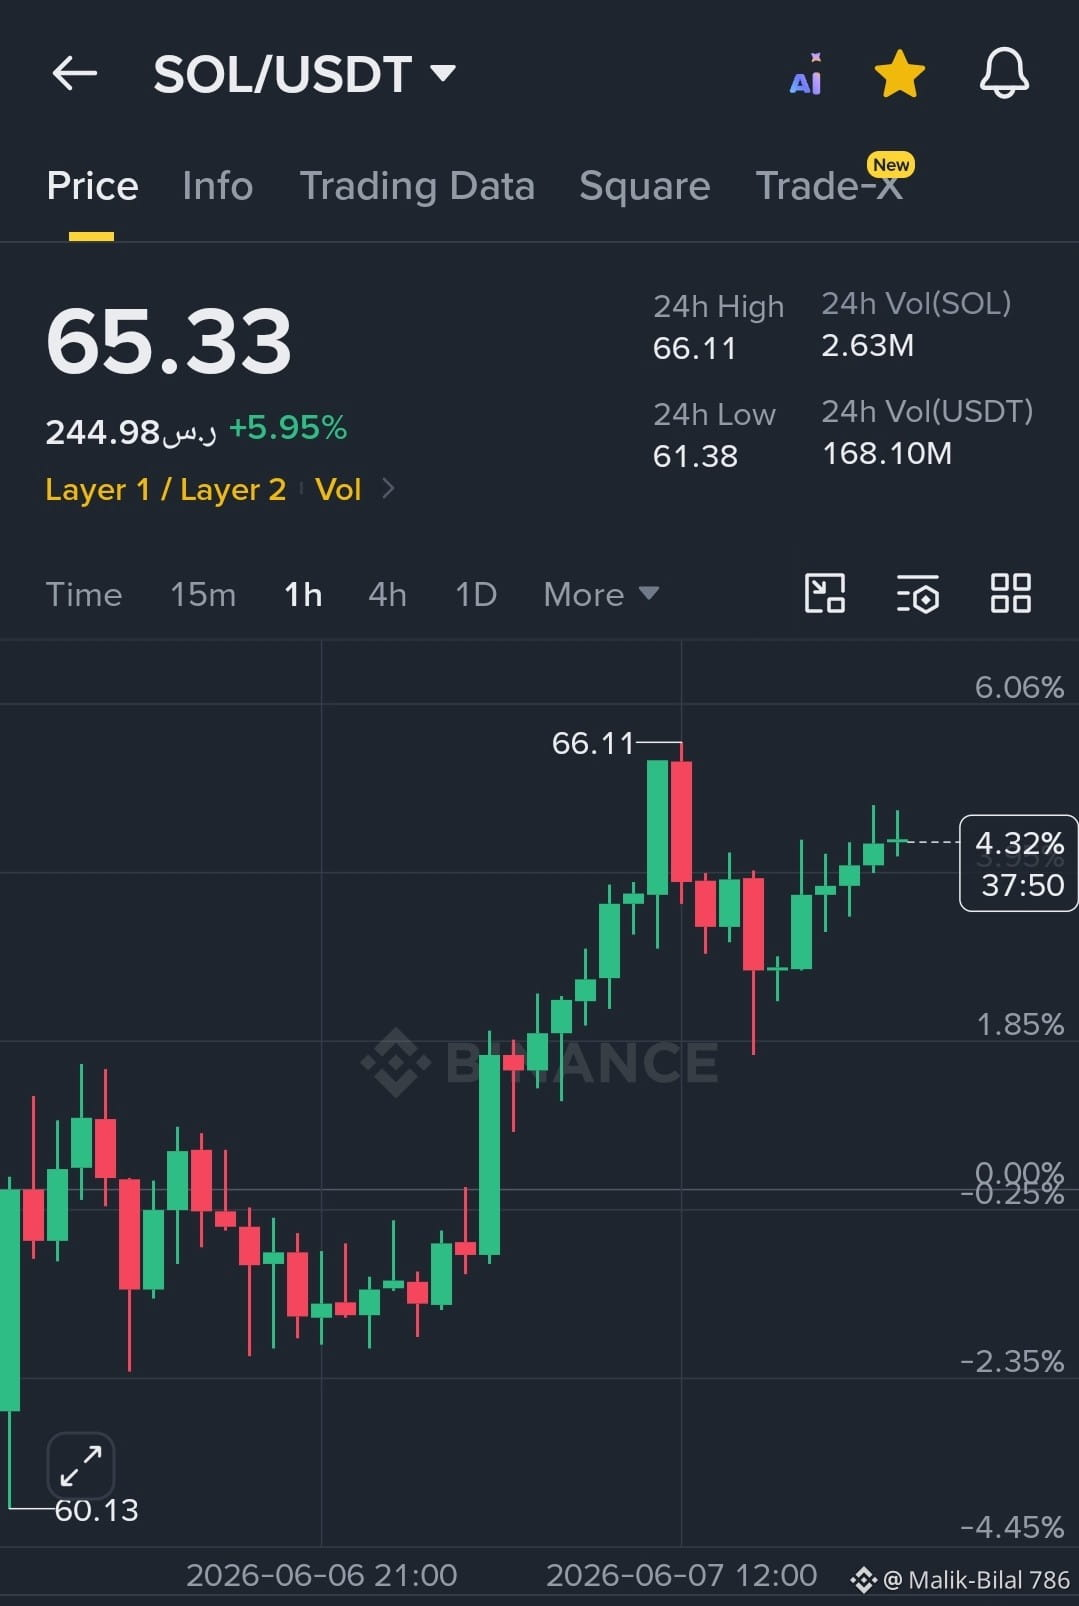
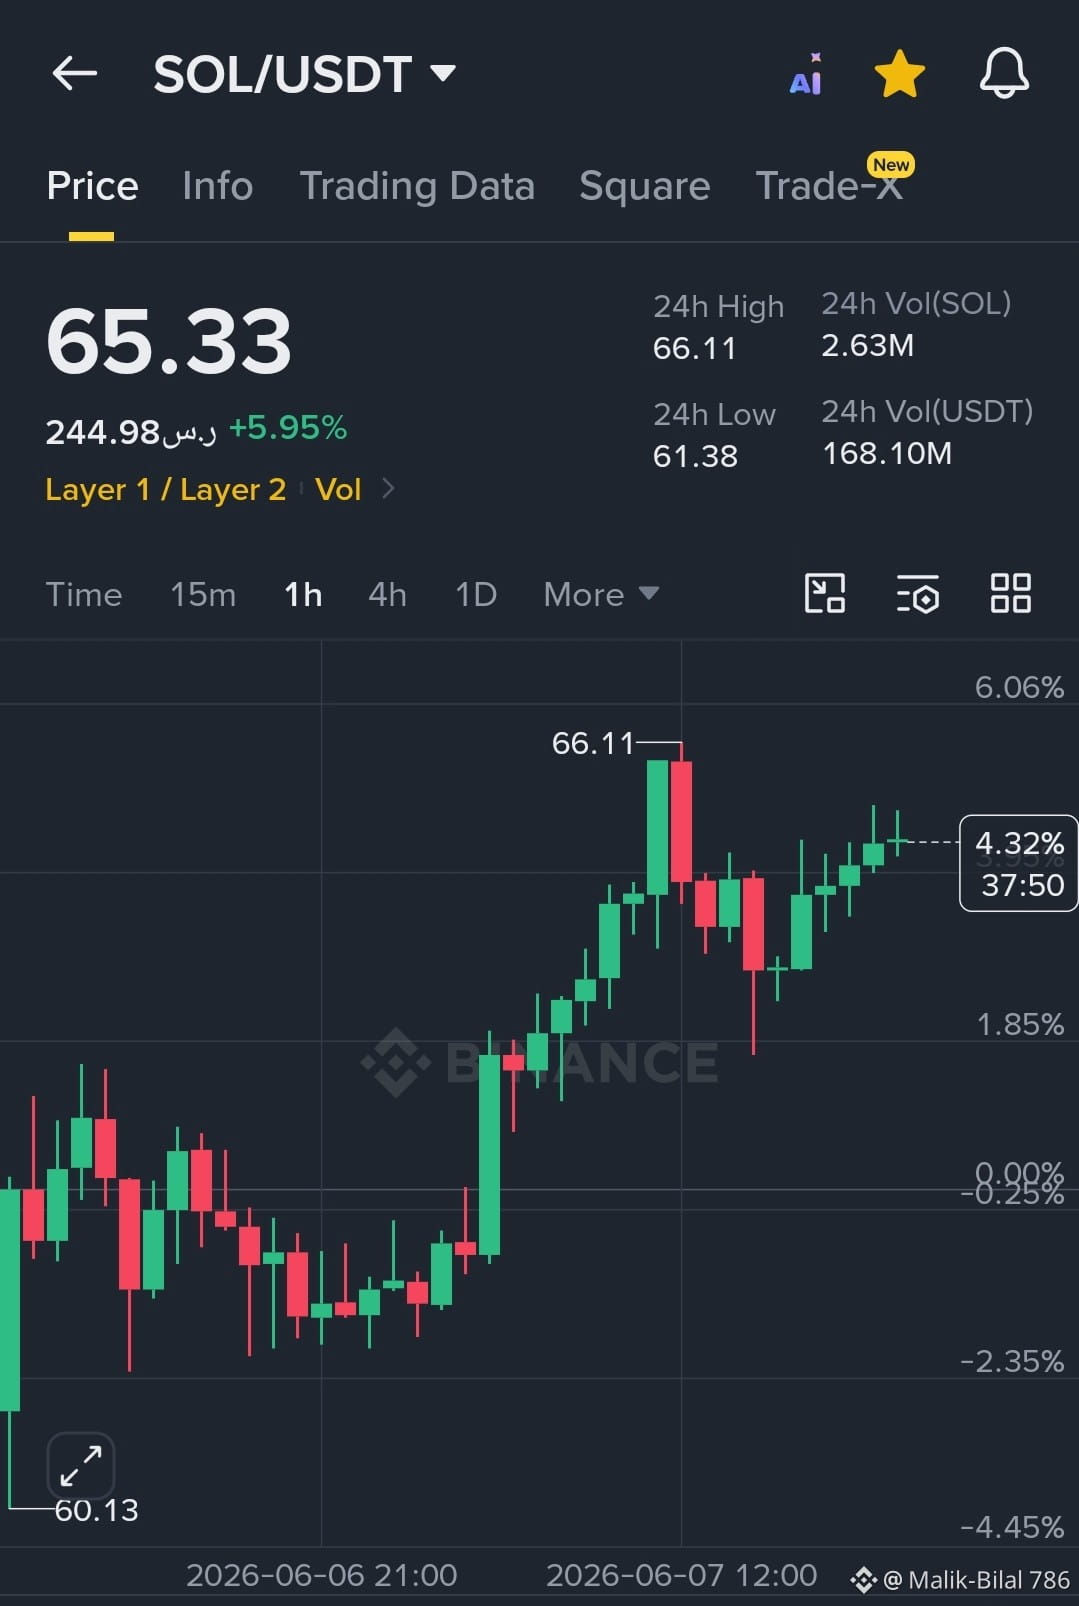
$SOL SOL is trading around $65.33 after rejecting the recent high at $66.11. Price has recovered from the pullback and is forming higher lows, indicating buyers remain in control.
📍 Entry Zone: $64.5–65.5
✅ Confirmation Level: Break and close above $66.11
🎯 TP1: $67.50
🎯 TP2: $69.00
🎯 TP3: $72.00
🛑 Stop Loss: $62.80
📍 Entry Zone: $64.5–65.5
✅ Confirmation Level: Break and close above $66.11
🎯 TP1: $67.50
🎯 TP2: $69.00
🎯 TP3: $72.00
🛑 Stop Loss: $62.80
112
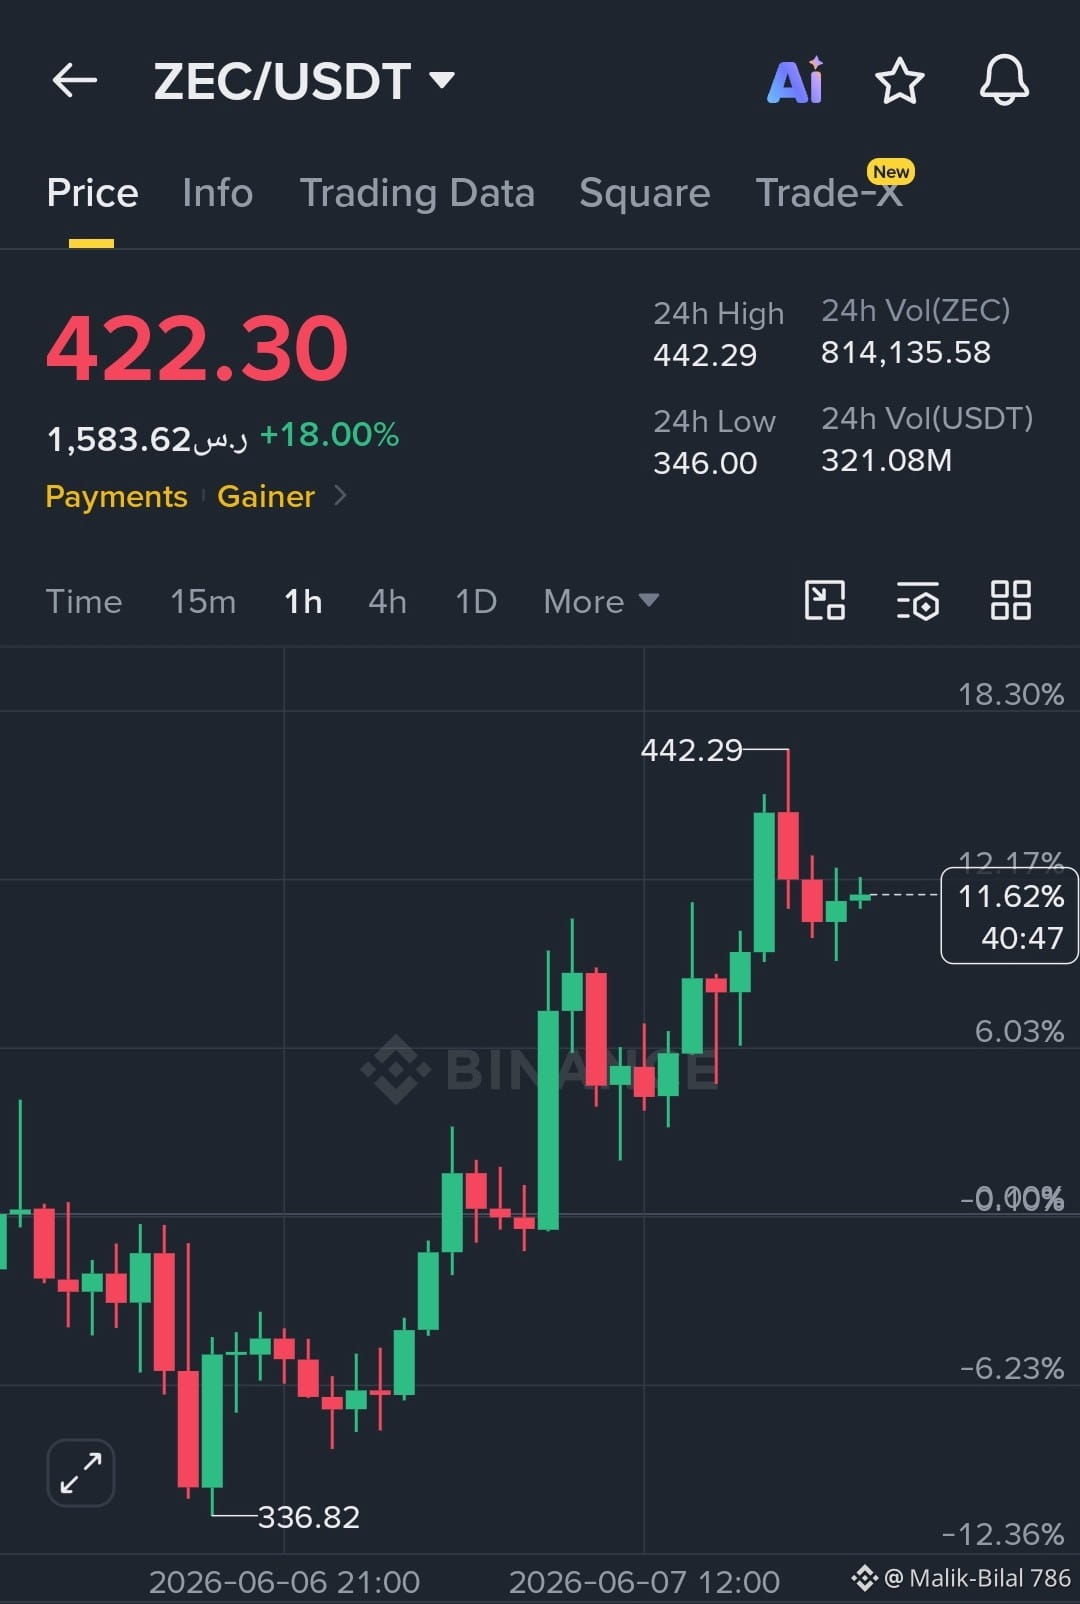
$ZEC Price is holding near $422 after a strong rally and a local high at $442.29. The trend remains bullish as long as support around $410 holds.
📍 Entry: $415–425
✅ Breakout Confirmation: Above $442
🎯 TP1: $450
🎯 TP2: $470
🎯 TP3: $500
🛑 SL: $395
Bias: Bullish. A breakout above $442 could trigger another move toward $460–500, while a pullback to $410–415 may offer a better entry.#GrayscaleFilesS1ForCantonTokenSpotETF #TrumpSaysUSWouldHelpIranDestroyEnrichedUranium
{spot}(ZECUSDT)
$ZEC Price is holding near $422 after a strong rally and a local high at $442.29. The trend remains bullish as long as support around $410 holds.
📍 Entry: $415–425
✅ Breakout Confirmation: Above $442
🎯 TP1: $450
🎯 TP2: $470
🎯 TP3: $500
🛑 SL: $395
Bias: Bullish. A breakout above $442 could trigger another move toward $460–500, while a pullback to $410–415 may offer a better entry.#GrayscaleFilesS1ForCantonTokenSpotETF #TrumpSaysUSWouldHelpIranDestroyEnrichedUranium
230
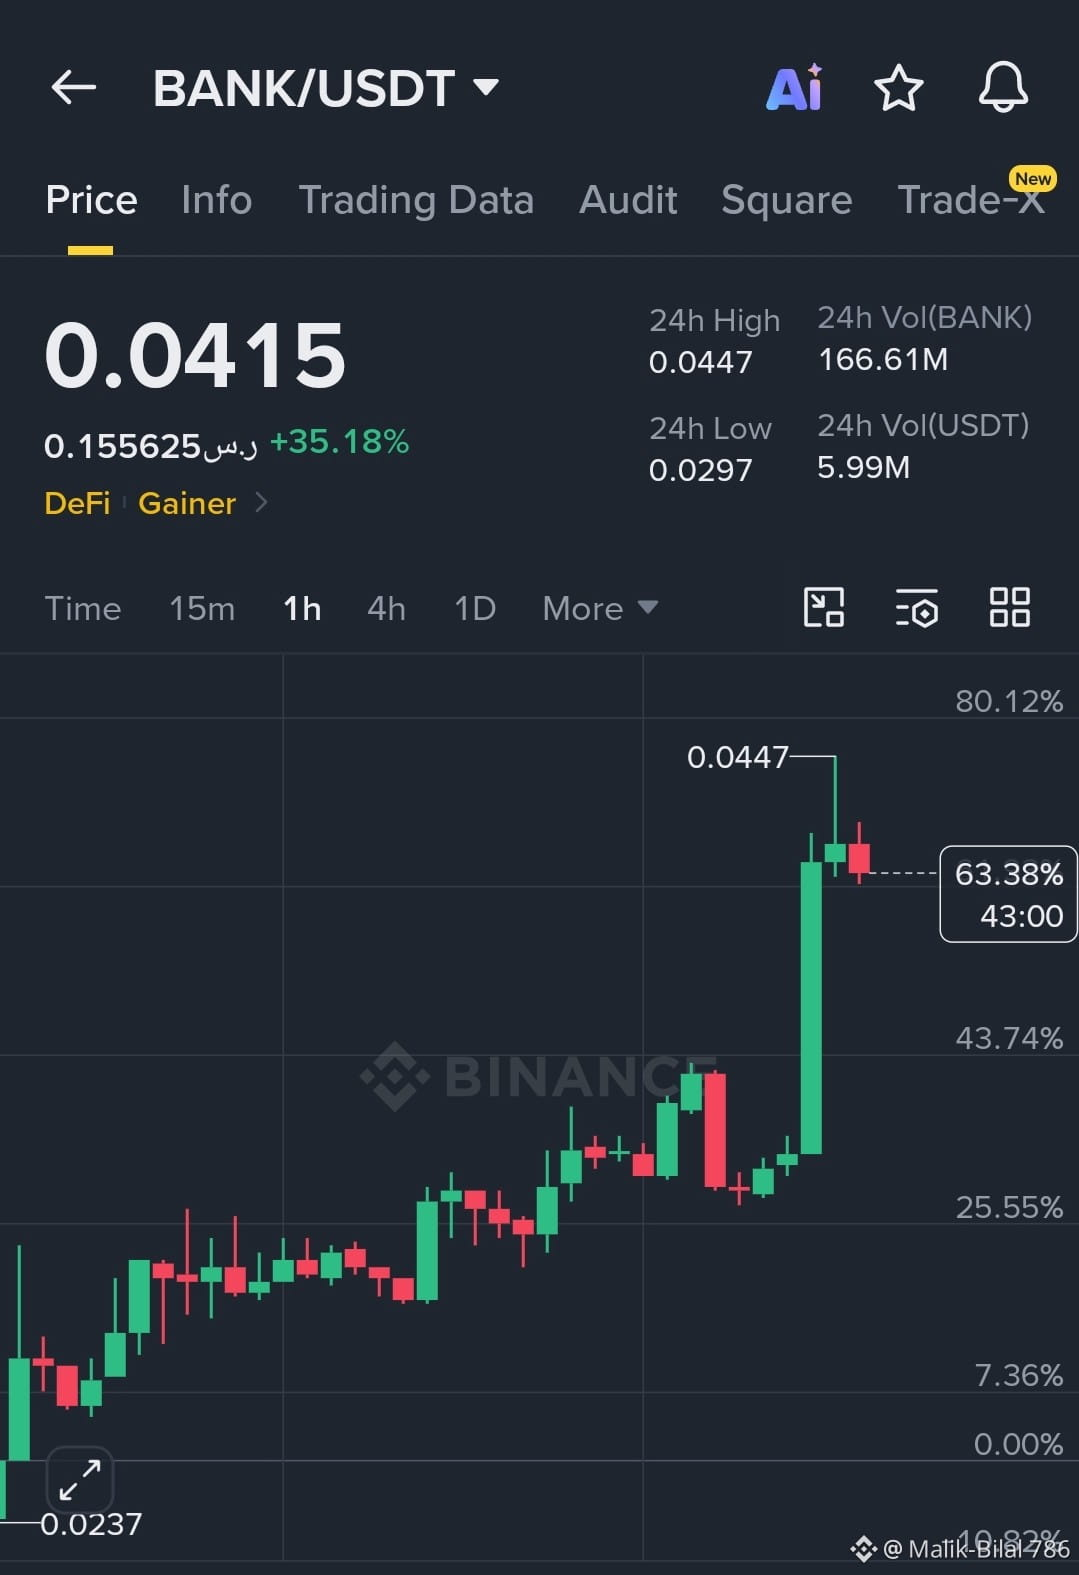
$BANK BANK is showing strong bullish momentum, surging over 35% with a sharp breakout from the 0.030–0.034 accumulation zone.
Price is currently around 0.0415, holding near the recent high of 0.0447, which suggests buyers remain in control.
Resistance: 0.0447 → 0.0500
Support: 0.0390 → 0.0360
Trading Setup
Entry Zone: 0.0390–0.0410
Confirmation Level: Break and close above 0.0447
TP1: 0.0480
TP2: 0.0520
TP3: 0.0580
Stop Loss: 0.0355#SaylorHintsStrategyBitcoinBuy #TrumpSaysUSWouldHelpIranDestroyEnrichedUranium
{spot}(BANKUSDT)
$BANK BANK is showing strong bullish momentum, surging over 35% with a sharp breakout from the 0.030–0.034 accumulation zone.
Price is currently around 0.0415, holding near the recent high of 0.0447, which suggests buyers remain in control.
Resistance: 0.0447 → 0.0500
Support: 0.0390 → 0.0360
Trading Setup
Entry Zone: 0.0390–0.0410
Confirmation Level: Break and close above 0.0447
TP1: 0.0480
TP2: 0.0520
TP3: 0.0580
Stop Loss: 0.0355#SaylorHintsStrategyBitcoinBuy #TrumpSaysUSWouldHelpIranDestroyEnrichedUranium
80
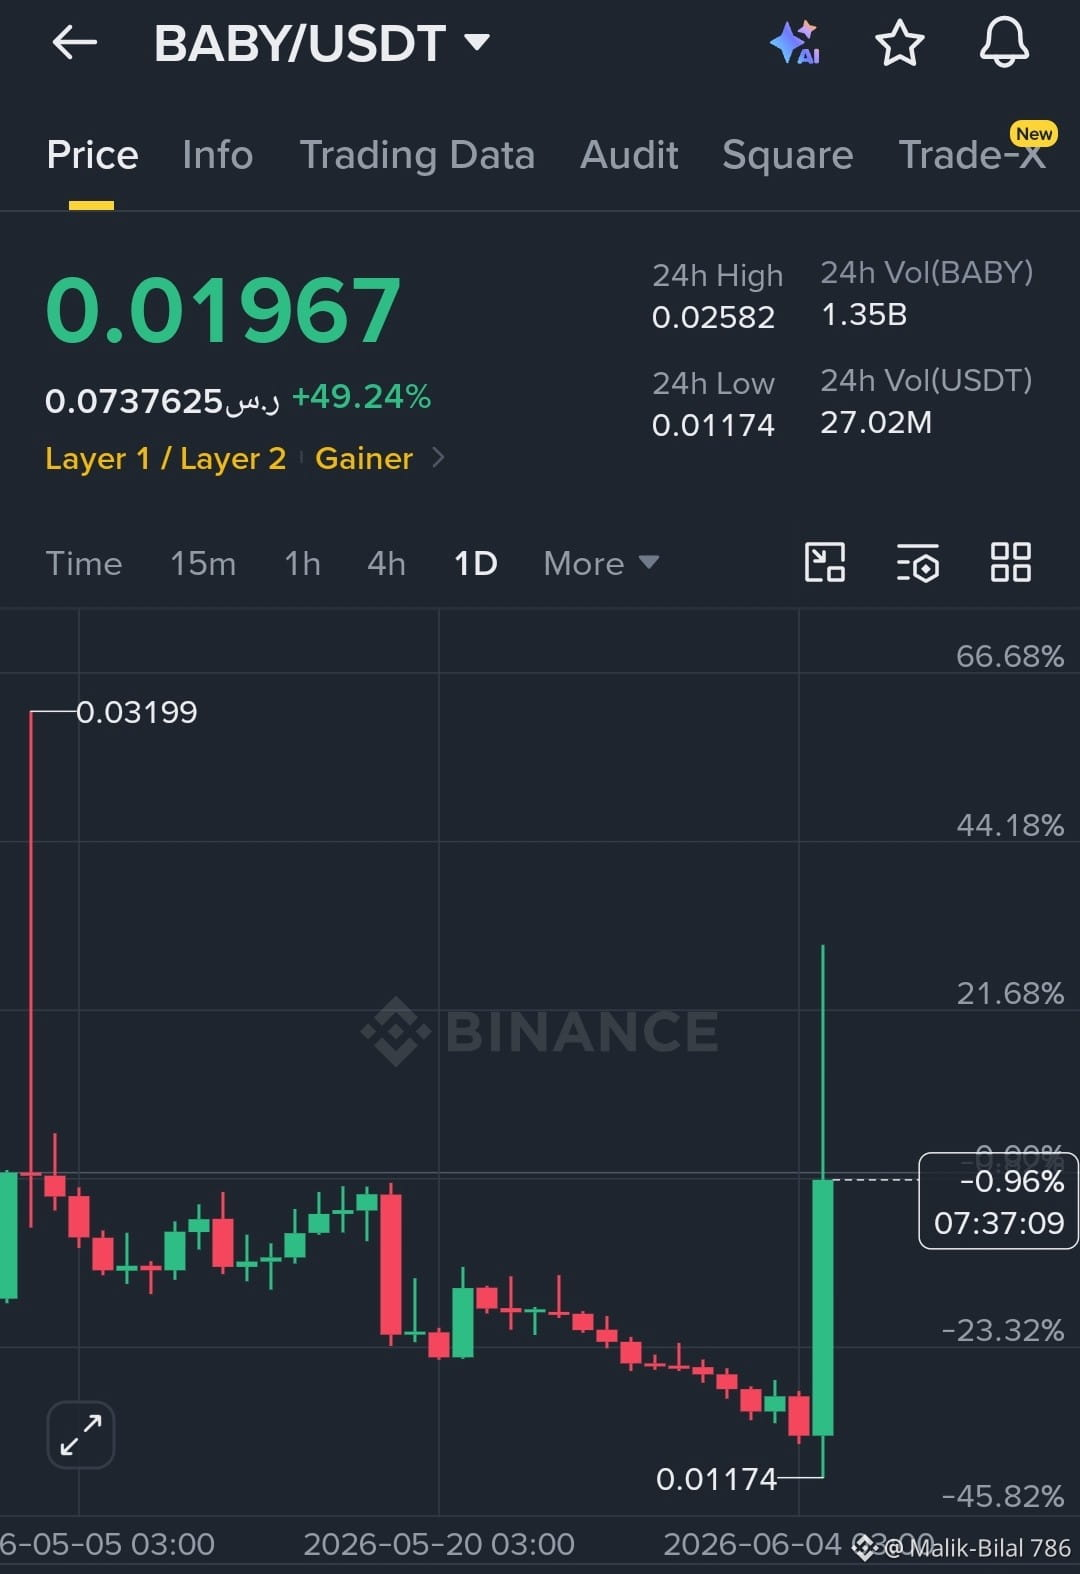
$BABY Price is around 0.01967 USDT, up nearly 49% in 24h after a strong rebound from 0.01174 support.
The large bullish candle shows strong buying momentum, but price is approaching a key resistance zone around 0.0220–0.0260.
If buyers hold above 0.0180, the rally could extend toward 0.0250 and 0.0300.
A rejection near resistance may trigger a pullback toward 0.0160–0.0180 before the next move.
{spot}(BABYUSDT)
#MyStocksQuestion BitcoinDropsBelow$60KWorstWeekSinceJuly2024#USJobsReportDoublesForecasts
$BABY Price is around 0.01967 USDT, up nearly 49% in 24h after a strong rebound from 0.01174 support.
The large bullish candle shows strong buying momentum, but price is approaching a key resistance zone around 0.0220–0.0260.
If buyers hold above 0.0180, the rally could extend toward 0.0250 and 0.0300.
A rejection near resistance may trigger a pullback toward 0.0160–0.0180 before the next move.
#MyStocksQuestion BitcoinDropsBelow$60KWorstWeekSinceJuly2024#USJobsReportDoublesForecasts
147
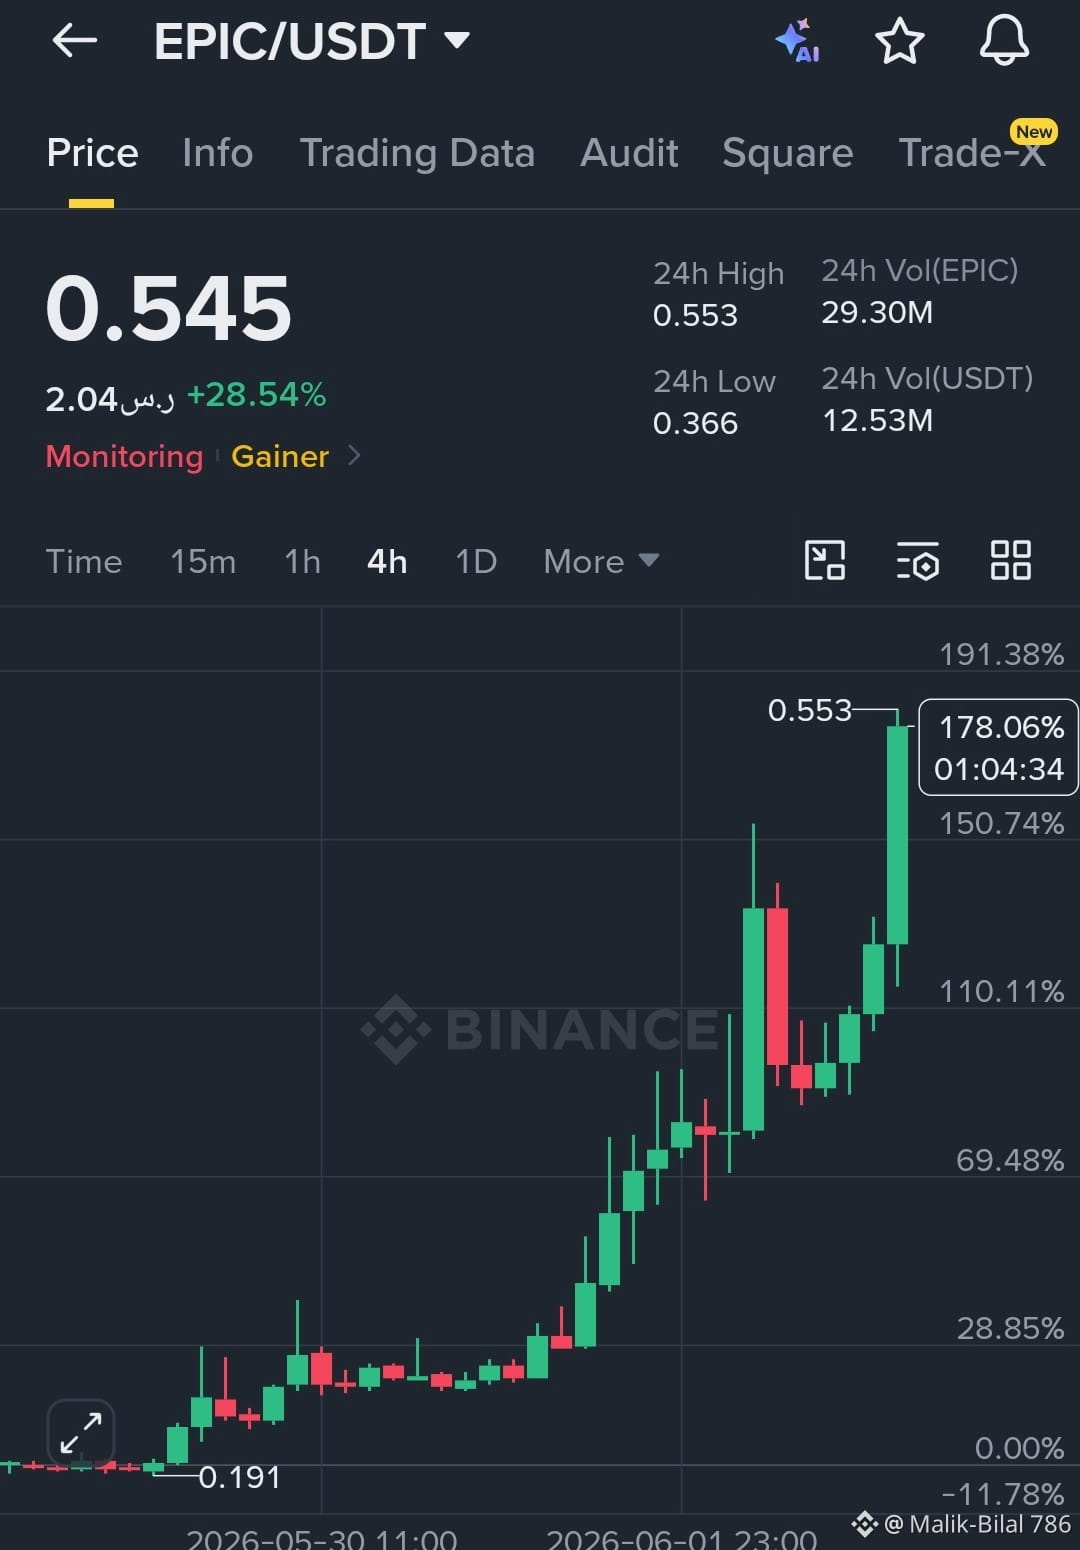
$EPIC Current Price: 0.545 USDT
🔹 24H Change: +28.54%
EPIC remains in a strong bullish uptrend, printing higher highs and higher lows on the 4H chart. The breakout above 0.50 attracted strong buying volume, pushing price to a new local high near 0.553.
📈 Bullish Scenario:
Holding above 0.50–0.52 keeps momentum positive.
Next targets: 0.58, 0.62, and 0.70.
⚠️ Risk Area:
A drop below 0.50 could trigger profit-taking and a pullback toward 0.45–0.47.
{spot}(EPICUSDT)
#MRVLSoarsOnNVDATrillionDollarOutlook #ZcashFourHourBlockProductionHalt #BitcoinFearGaugeSurgesNearly20%
$EPIC Current Price: 0.545 USDT
🔹 24H Change: +28.54%
EPIC remains in a strong bullish uptrend, printing higher highs and higher lows on the 4H chart. The breakout above 0.50 attracted strong buying volume, pushing price to a new local high near 0.553.
📈 Bullish Scenario:
Holding above 0.50–0.52 keeps momentum positive.
Next targets: 0.58, 0.62, and 0.70.
⚠️ Risk Area:
A drop below 0.50 could trigger profit-taking and a pullback toward 0.45–0.47.
#MRVLSoarsOnNVDATrillionDollarOutlook #ZcashFourHourBlockProductionHalt #BitcoinFearGaugeSurgesNearly20%
151
Войдите, чтобы посмотреть больше материала
Присоединяйтесь к пользователям криптовалют по всему миру на Binance Square
⚡️ Получайте новейшую и полезную информацию о криптоактивах.
💬 Нам доверяет крупнейшая в мире криптобиржа.
👍 Получите достоверные аналитические данные от верифицированных создателей контента.
Эл. почта/номер телефона
В тренде
EarningsSeason
Просмотров: 6.6M
33,257 обсуждают
Earnings Season Session 3: Will Google & Microsoft Beat Earnings Expectations?
Binance Square Official
·Лайков: 184
·Просмотров: 110.2k
USMidtermElections
Просмотров: 90,482
1,184 обсуждают
StrategySTRCReaches$99.95ForFirstTimeIn165Days
Просмотров: 1,296
40 обсуждают