
Zenobia-Rox
33.6k Публикации

Zenobia-Rox
 Square Verified+
Отправить жалобу
Заблокировать пользователя
Открытая сделка
Случайный трейдер
1.2 г
1.1K+ подписок(и/а)
45.4K+ подписчиков(а)
57.1K+ понравилось
Посты
Портфель
Все
Активно
·
--
Рост
$LITE /USDT – Bulls Are Back, But Is Another Leg Coming?
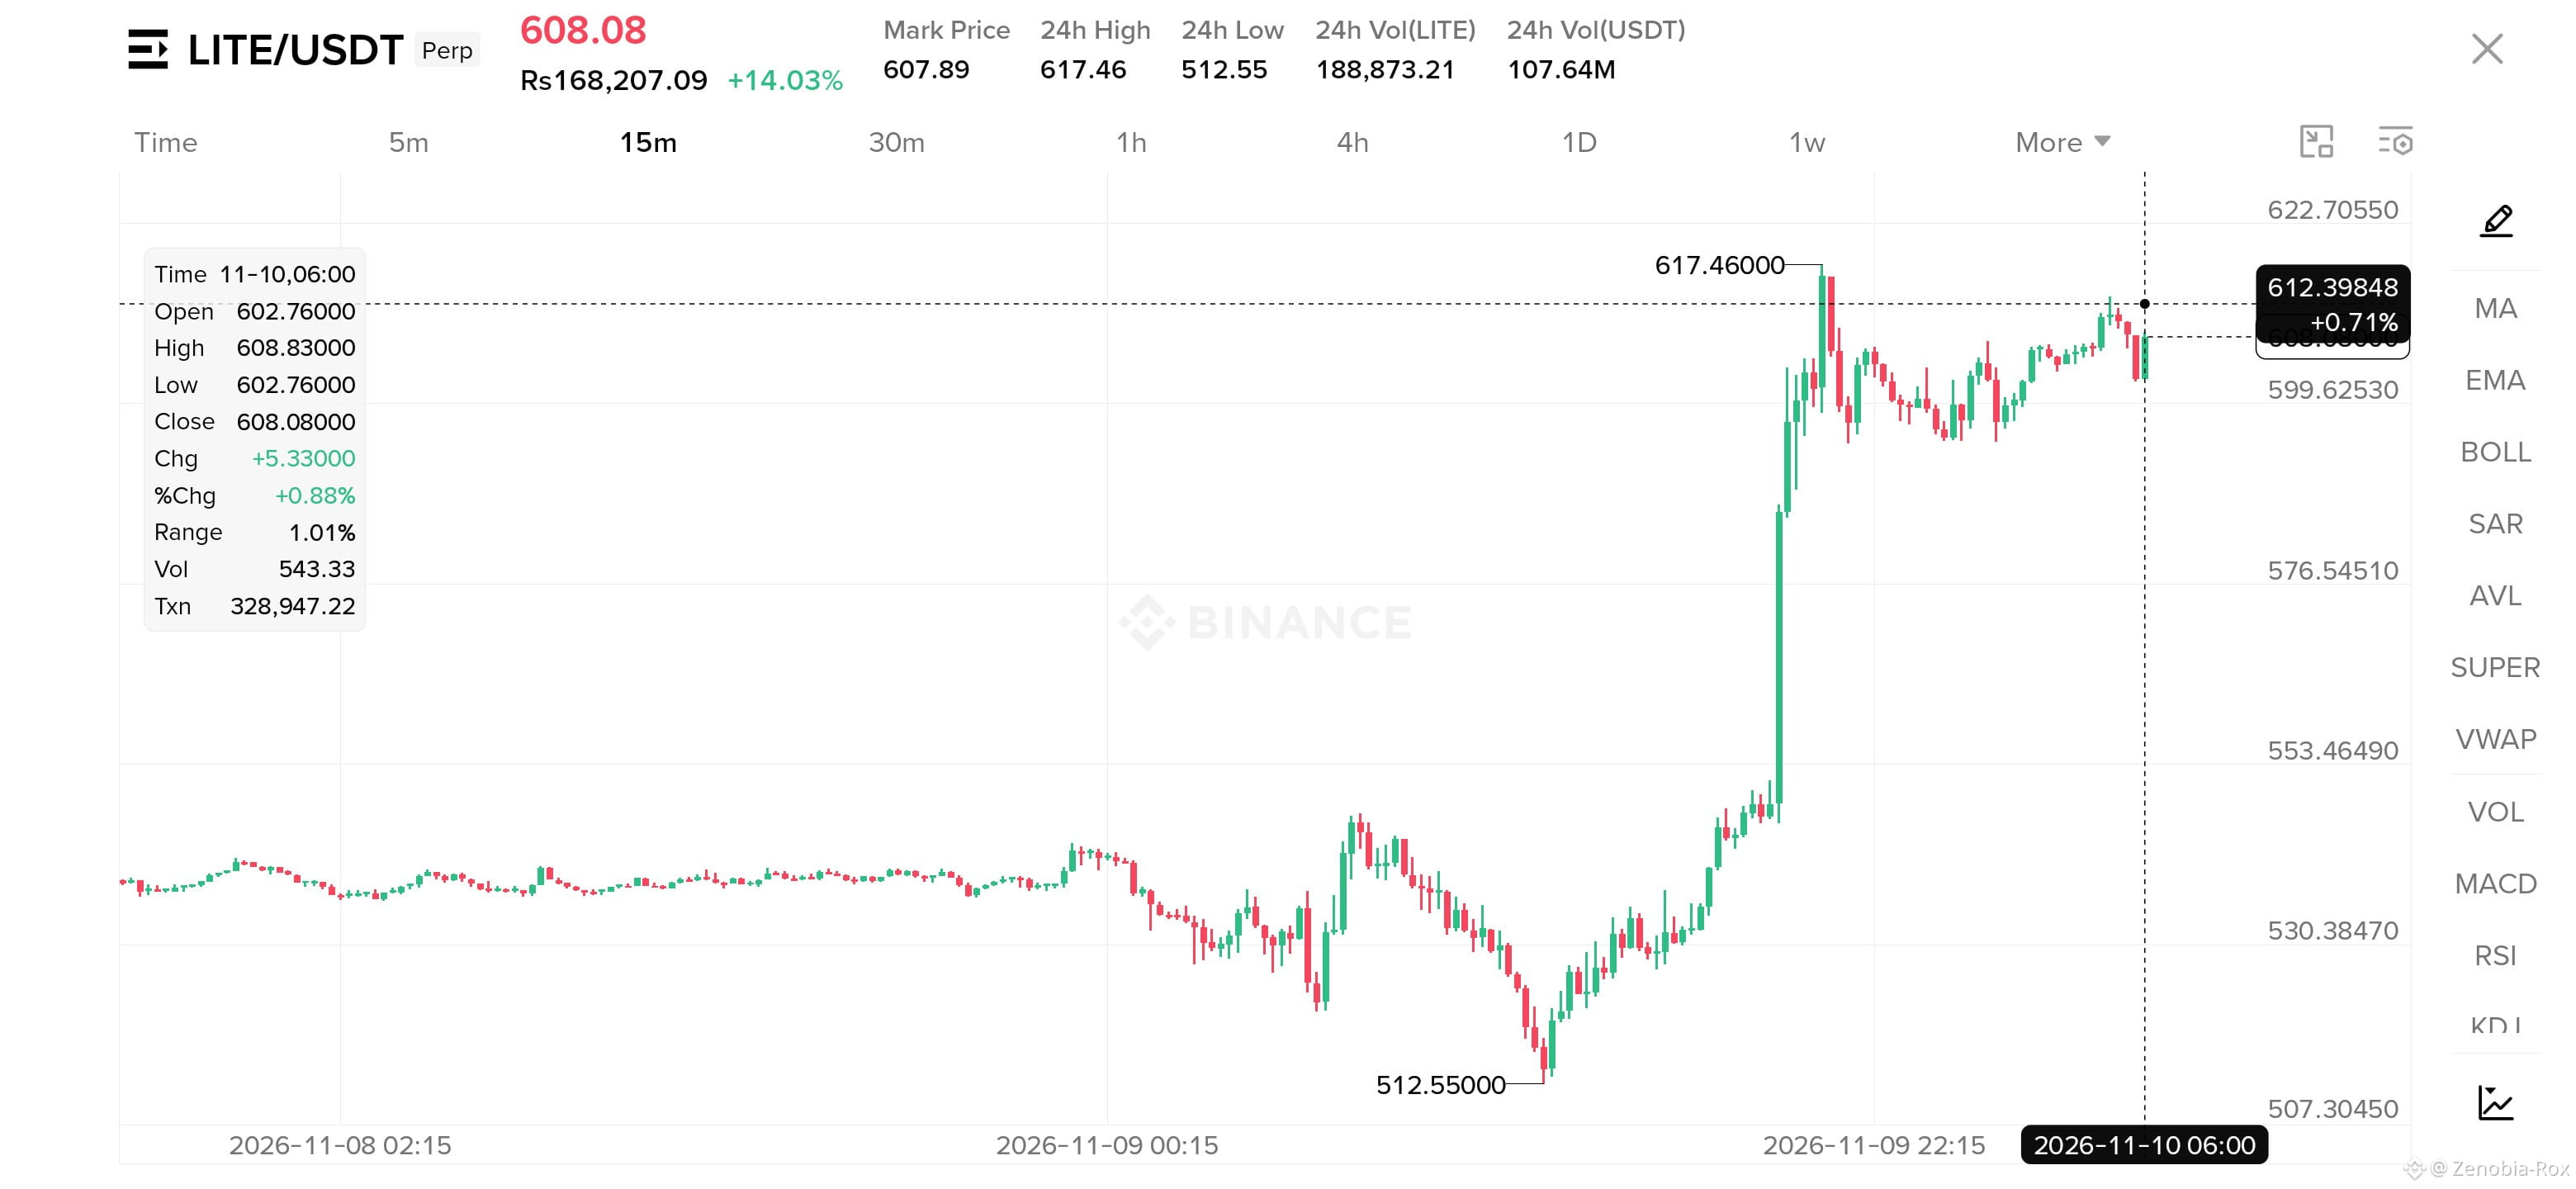
I'm watching $LITE closely after that explosive breakout! 🔥 Price has surged over 14%, smashing through the previous trading range and now holding around $608. Buyers have shown serious strength, but the next move around $617 resistance could decide everything.
A clean breakout above this level could open the door to another bullish push. I'm watching for a controlled pullback before considering an entry.
🎯 Entry Level: $600 – $606
🥇 TP1: $617
🥈 TP2: $628
🥉 TP3: $642
🛑 STOP LOSS: $589
⚡ Key Level: A strong 15M close above $617 could signal further upside. Rejection here may trigger a short-term pullback.
⚠️ DISCLAIMER: This is a technical trading setup, not financial advice. Always manage your risk, use proper position sizing, and never trade with money you cannot afford to lose.
{future}(LITEUSDT)
$LITE /USDT – Bulls Are Back, But Is Another Leg Coming?
I'm watching $LITE closely after that explosive breakout! 🔥 Price has surged over 14%, smashing through the previous trading range and now holding around $608. Buyers have shown serious strength, but the next move around $617 resistance could decide everything.
A clean breakout above this level could open the door to another bullish push. I'm watching for a controlled pullback before considering an entry.
🎯 Entry Level: $600 – $606
🥇 TP1: $617
🥈 TP2: $628
🥉 TP3: $642
🛑 STOP LOSS: $589
⚡ Key Level: A strong 15M close above $617 could signal further upside. Rejection here may trigger a short-term pullback.
⚠️ DISCLAIMER: This is a technical trading setup, not financial advice. Always manage your risk, use proper position sizing, and never trade with money you cannot afford to lose.
I'm watching $LITE closely after that explosive breakout! 🔥 Price has surged over 14%, smashing through the previous trading range and now holding around $608. Buyers have shown serious strength, but the next move around $617 resistance could decide everything.
A clean breakout above this level could open the door to another bullish push. I'm watching for a controlled pullback before considering an entry.
🎯 Entry Level: $600 – $606
🥇 TP1: $617
🥈 TP2: $628
🥉 TP3: $642
🛑 STOP LOSS: $589
⚡ Key Level: A strong 15M close above $617 could signal further upside. Rejection here may trigger a short-term pullback.
⚠️ DISCLAIMER: This is a technical trading setup, not financial advice. Always manage your risk, use proper position sizing, and never trade with money you cannot afford to lose.
195
·
--
Рост
🚀 $PIEVERSE – Bulls Are Still Making Noise!
I'm watching $PIEVERSE closely because this chart is showing some serious bullish momentum! 🔥
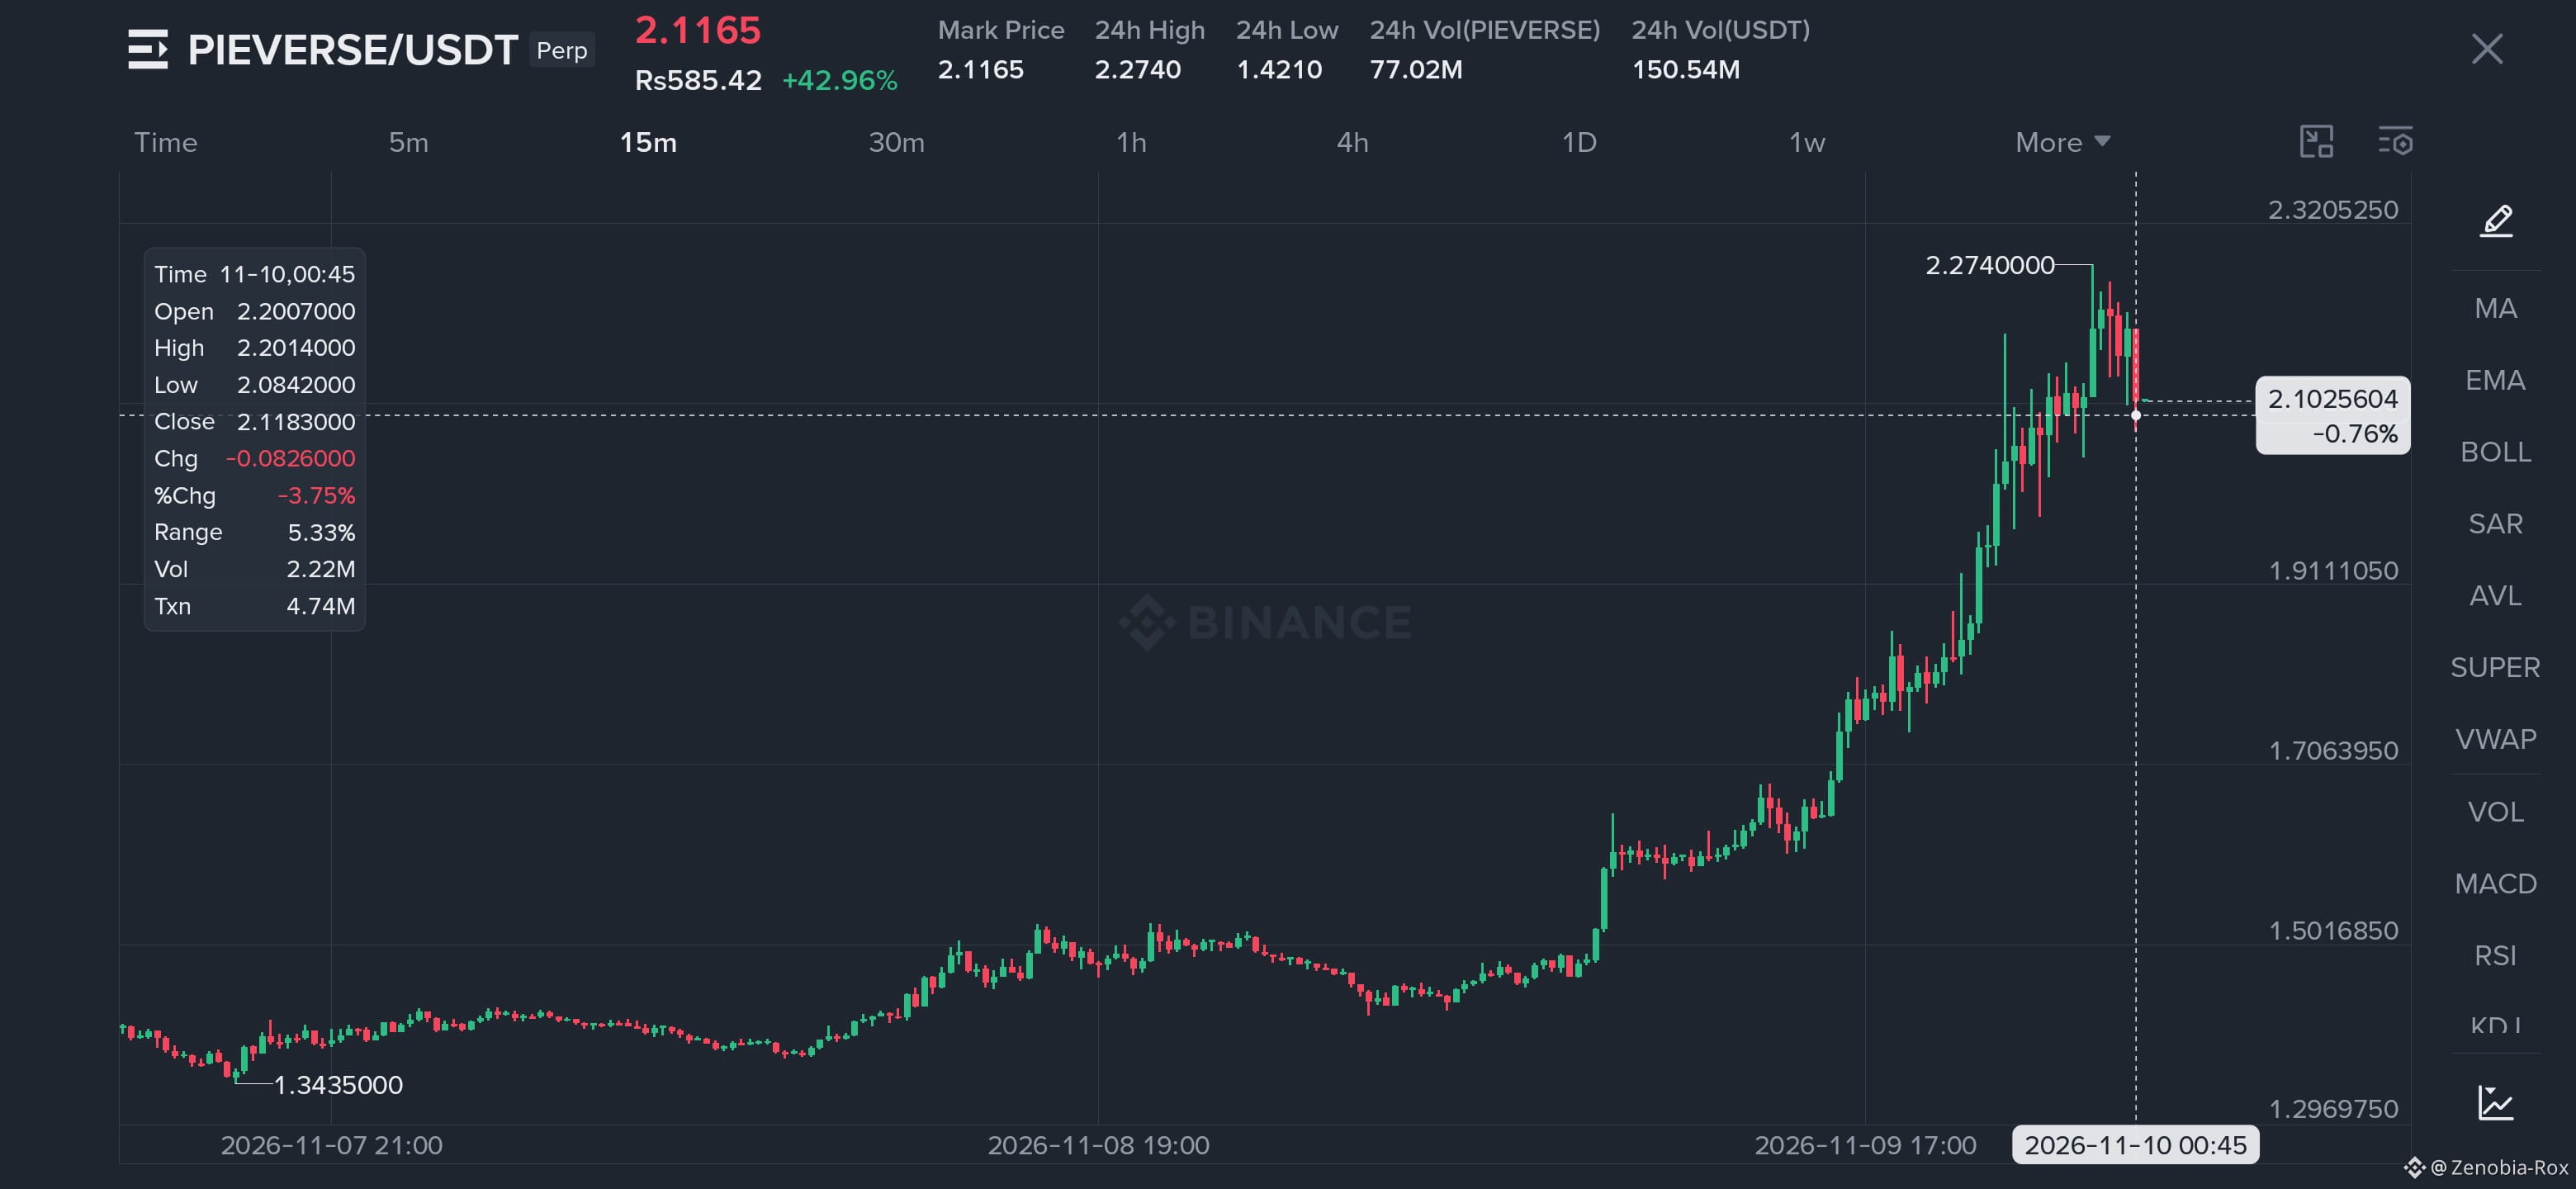
PIEVERSE has surged nearly 43%, breaking through multiple resistance levels and reaching a high of $2.2740. Now price is pulling back slightly after the aggressive rally.
The key question is whether buyers can defend the $2.05–$2.10 area and push toward another breakout. I don't want to chase the pump; I'm watching for a healthy retest.
📊 Trade Setup – PIEVERSE/USDT
🟢 Entry Level: $2.05 – $2.12
🎯 TP1: $2.20
🎯 TP2: $2.27
🎯 TP3: $2.40
🛑 STOP LOSS: $1.98
🔥 My Focus: If buyers defend the entry zone, another attempt toward the previous high could be on the table. Watch volume and price action before entering.
⚠️ DISCLAIMER: This is a technical trading idea, not financial advice. Crypto trading involves significant risk. Always manage your position size and do your own research.
{future}(PIEVERSEUSDT)
🚀 $PIEVERSE – Bulls Are Still Making Noise!
I'm watching $PIEVERSE closely because this chart is showing some serious bullish momentum! 🔥
PIEVERSE has surged nearly 43%, breaking through multiple resistance levels and reaching a high of $2.2740. Now price is pulling back slightly after the aggressive rally.
The key question is whether buyers can defend the $2.05–$2.10 area and push toward another breakout. I don't want to chase the pump; I'm watching for a healthy retest.
📊 Trade Setup – PIEVERSE/USDT
🟢 Entry Level: $2.05 – $2.12
🎯 TP1: $2.20
🎯 TP2: $2.27
🎯 TP3: $2.40
🛑 STOP LOSS: $1.98
🔥 My Focus: If buyers defend the entry zone, another attempt toward the previous high could be on the table. Watch volume and price action before entering.
⚠️ DISCLAIMER: This is a technical trading idea, not financial advice. Crypto trading involves significant risk. Always manage your position size and do your own research.
I'm watching $PIEVERSE closely because this chart is showing some serious bullish momentum! 🔥
PIEVERSE has surged nearly 43%, breaking through multiple resistance levels and reaching a high of $2.2740. Now price is pulling back slightly after the aggressive rally.
The key question is whether buyers can defend the $2.05–$2.10 area and push toward another breakout. I don't want to chase the pump; I'm watching for a healthy retest.
📊 Trade Setup – PIEVERSE/USDT
🟢 Entry Level: $2.05 – $2.12
🎯 TP1: $2.20
🎯 TP2: $2.27
🎯 TP3: $2.40
🛑 STOP LOSS: $1.98
🔥 My Focus: If buyers defend the entry zone, another attempt toward the previous high could be on the table. Watch volume and price action before entering.
⚠️ DISCLAIMER: This is a technical trading idea, not financial advice. Crypto trading involves significant risk. Always manage your position size and do your own research.
375
·
--
Рост
🚀$HANA – BIG MOVE, BUT CAN BULLS PUSH HIGHER?
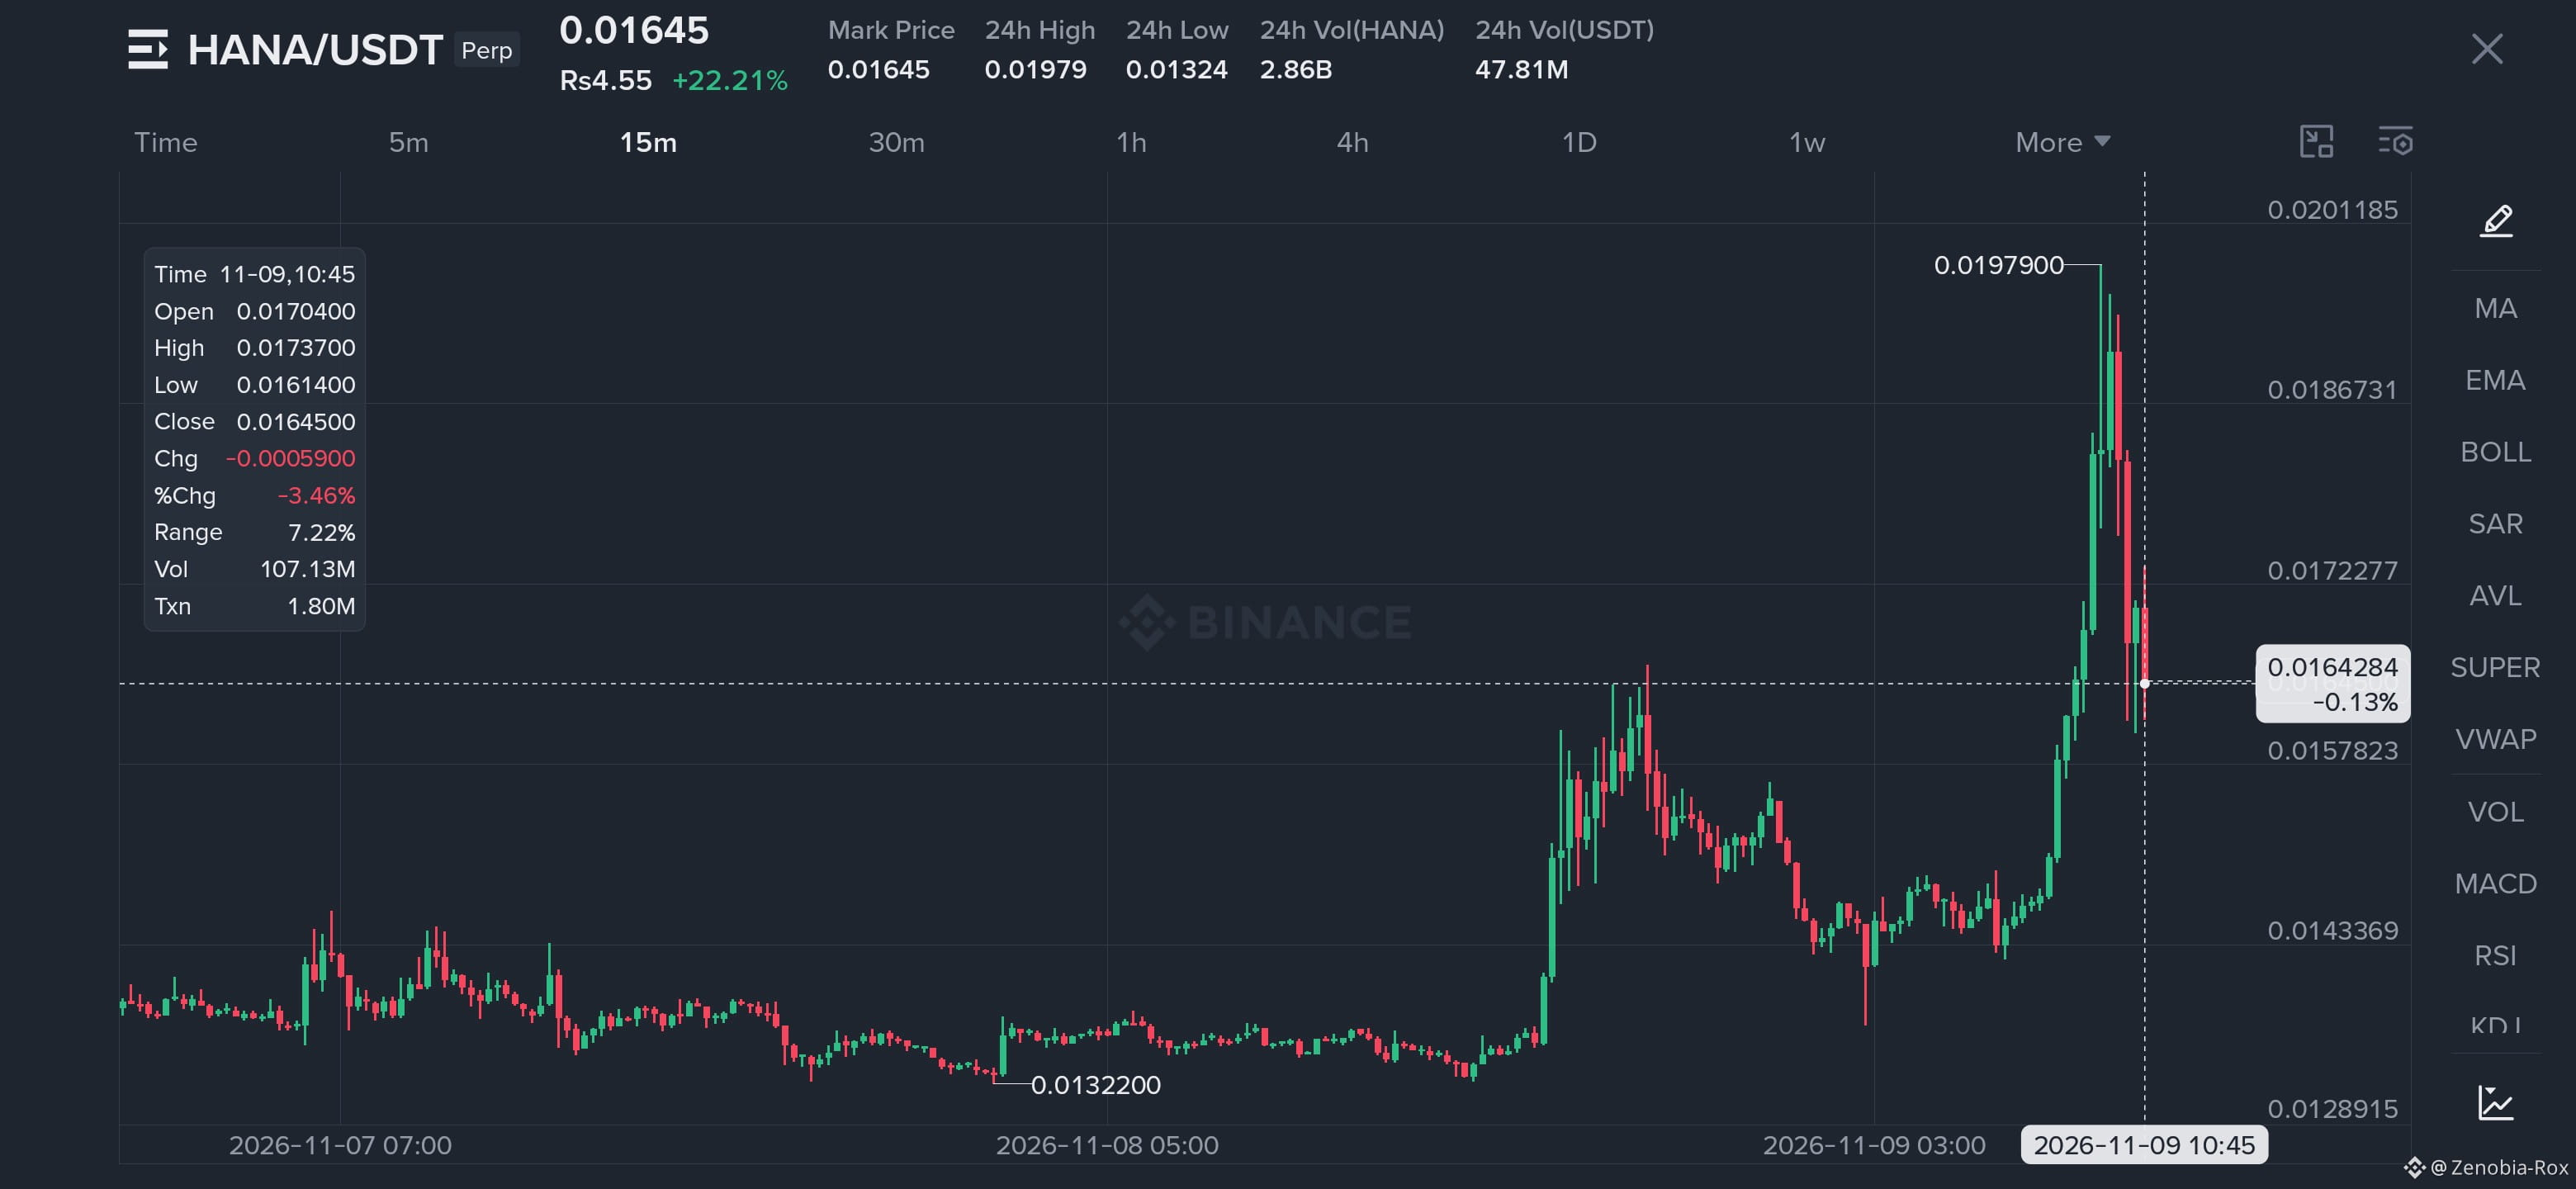
I'm watching $HANA USDT closely! The price has surged over 22% in 24 hours, attracting serious market attention. After reaching $0.01979, HANA faced some selling pressure and is now testing its next potential support area.
I don't want to chase the spike. A healthy hold above support could create another opportunity for buyers. 👀
📍 Entry Level: $0.0158 – $0.0164
🎯 TP1: $0.0172
🎯 TP2: $0.0186
🚀 TP3: $0.0197
🛑 STOP LOSS: $0.0152
DISCLAIMER: This is a technical trading idea, not financial advice. Wait for confirmation, manage your risk, and never trade with money you cannot afford to lose.
{future}(HANAUSDT)
🚀$HANA – BIG MOVE, BUT CAN BULLS PUSH HIGHER?
I'm watching $HANA USDT closely! The price has surged over 22% in 24 hours, attracting serious market attention. After reaching $0.01979, HANA faced some selling pressure and is now testing its next potential support area.
I don't want to chase the spike. A healthy hold above support could create another opportunity for buyers. 👀
📍 Entry Level: $0.0158 – $0.0164
🎯 TP1: $0.0172
🎯 TP2: $0.0186
🚀 TP3: $0.0197
🛑 STOP LOSS: $0.0152
DISCLAIMER: This is a technical trading idea, not financial advice. Wait for confirmation, manage your risk, and never trade with money you cannot afford to lose.
I'm watching $HANA USDT closely! The price has surged over 22% in 24 hours, attracting serious market attention. After reaching $0.01979, HANA faced some selling pressure and is now testing its next potential support area.
I don't want to chase the spike. A healthy hold above support could create another opportunity for buyers. 👀
📍 Entry Level: $0.0158 – $0.0164
🎯 TP1: $0.0172
🎯 TP2: $0.0186
🚀 TP3: $0.0197
🛑 STOP LOSS: $0.0152
DISCLAIMER: This is a technical trading idea, not financial advice. Wait for confirmation, manage your risk, and never trade with money you cannot afford to lose.
2
2
811
·
--
Рост
$AIOT – BULLS ARE PUSHING HARD!
I'm watching $AIOT USDT closely because this chart is showing impressive bullish momentum! 🔥
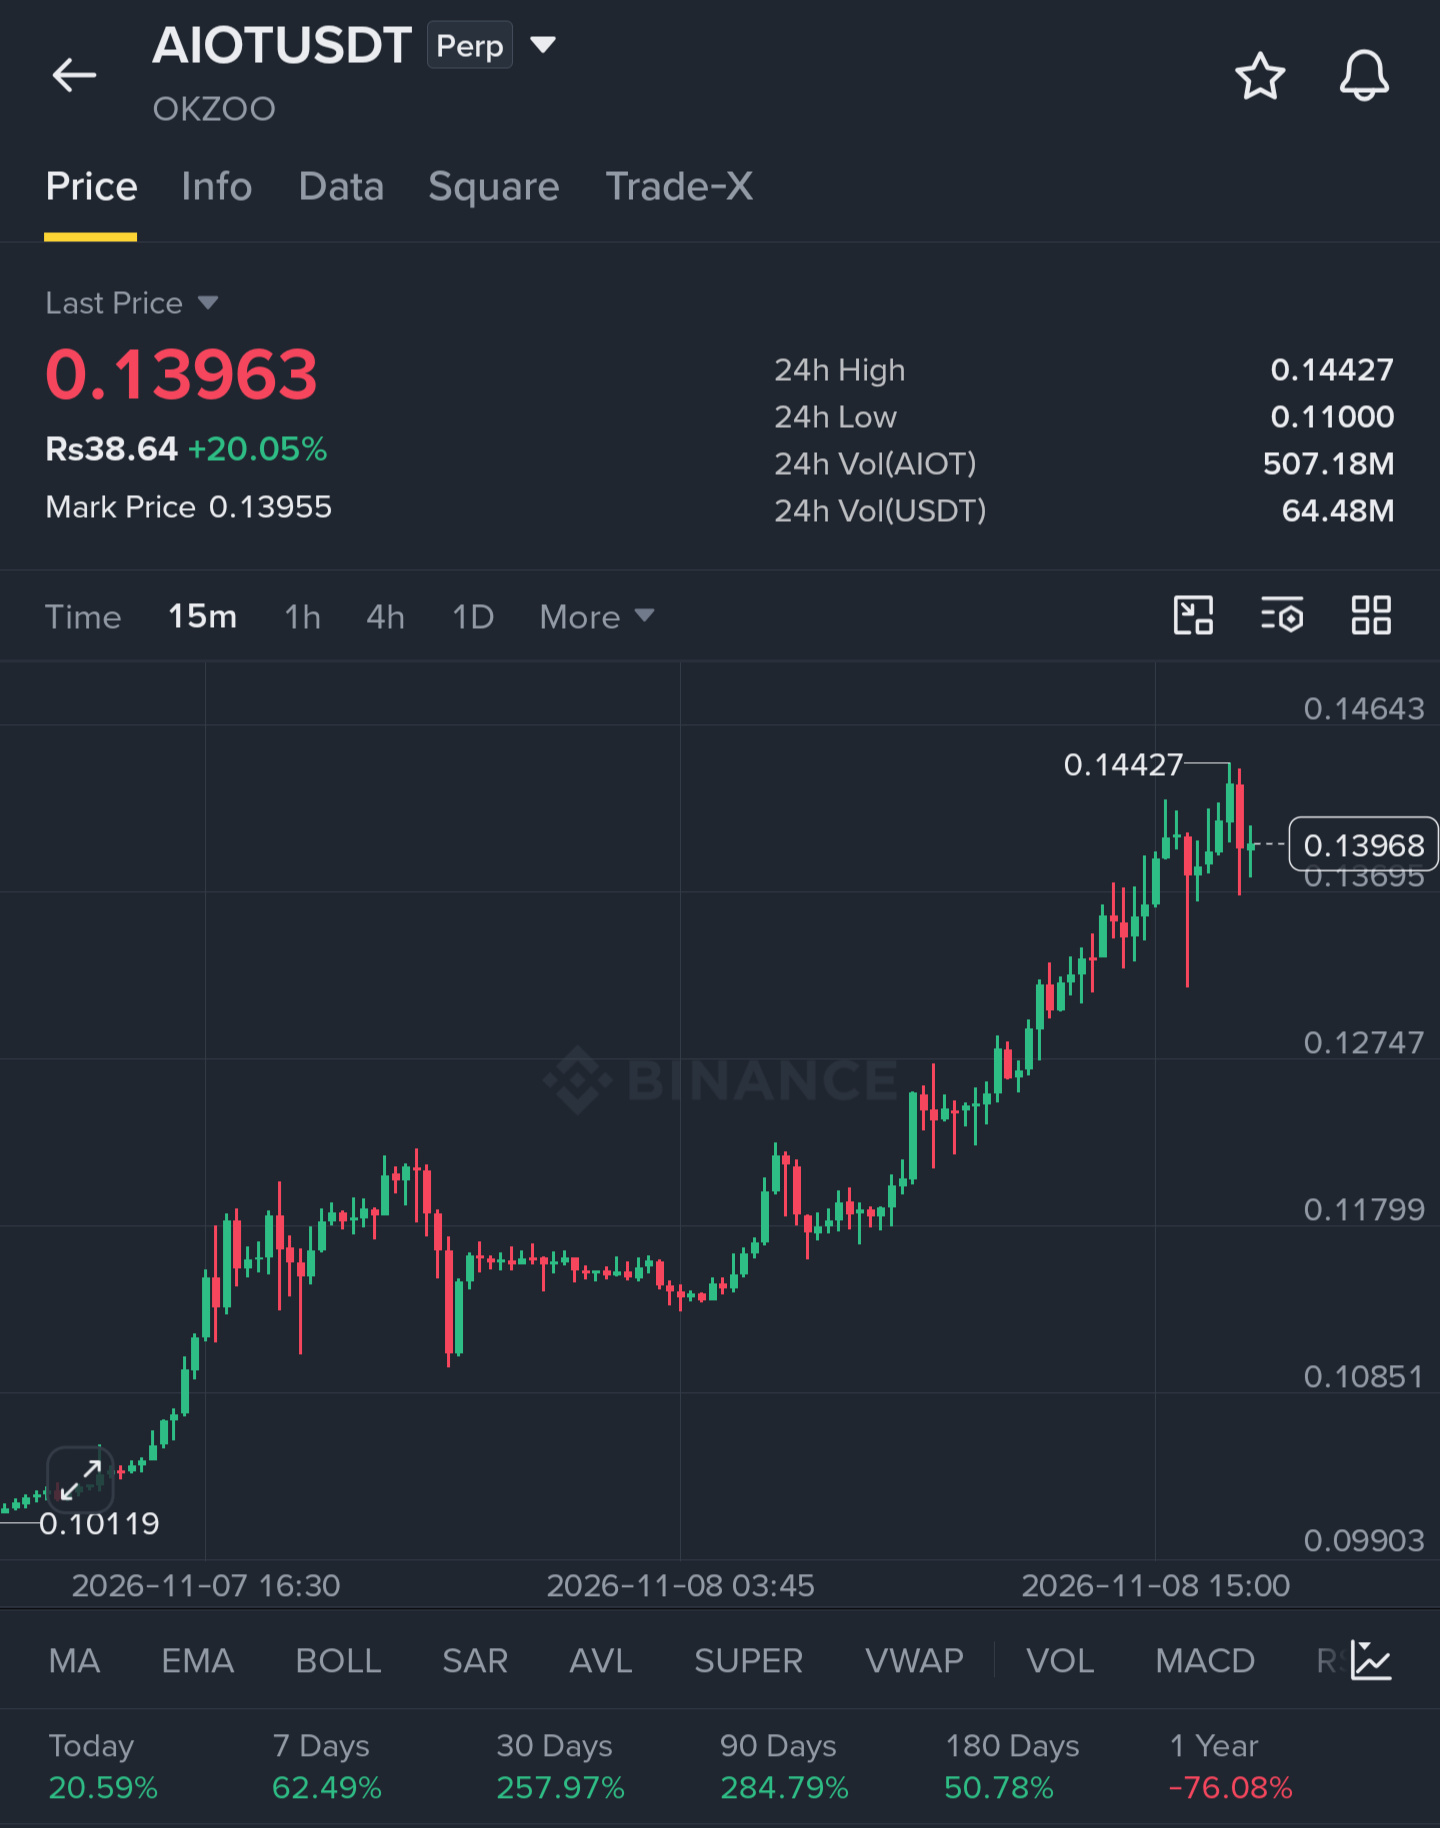
$AIOT has climbed more than 20% in 24 hours, forming a strong upward structure. Price is now hovering around $0.1396 after testing the $0.14427 resistance.
The next move could be interesting. If buyers defend the support zone and break the recent high, another bullish leg may follow. 📈
🎯 Entry Level: $0.1365 – $0.1390
🥇 TP1: $0.1440
🥈 TP2: $0.1490
🥉 TP3: $0.1550
🛑 STOP LOSS: $0.1325
DISCLAIMER: This is a technical analysis idea, not financial advice. Always manage your risk, use proper position sizing, and do your own research before trading. Crypto markets are highly volatile.
{future}(AIOTUSDT)
$AIOT – BULLS ARE PUSHING HARD!
I'm watching $AIOT USDT closely because this chart is showing impressive bullish momentum! 🔥
$AIOT has climbed more than 20% in 24 hours, forming a strong upward structure. Price is now hovering around $0.1396 after testing the $0.14427 resistance.
The next move could be interesting. If buyers defend the support zone and break the recent high, another bullish leg may follow. 📈
🎯 Entry Level: $0.1365 – $0.1390
🥇 TP1: $0.1440
🥈 TP2: $0.1490
🥉 TP3: $0.1550
🛑 STOP LOSS: $0.1325
DISCLAIMER: This is a technical analysis idea, not financial advice. Always manage your risk, use proper position sizing, and do your own research before trading. Crypto markets are highly volatile.
I'm watching $AIOT USDT closely because this chart is showing impressive bullish momentum! 🔥
$AIOT has climbed more than 20% in 24 hours, forming a strong upward structure. Price is now hovering around $0.1396 after testing the $0.14427 resistance.
The next move could be interesting. If buyers defend the support zone and break the recent high, another bullish leg may follow. 📈
🎯 Entry Level: $0.1365 – $0.1390
🥇 TP1: $0.1440
🥈 TP2: $0.1490
🥉 TP3: $0.1550
🛑 STOP LOSS: $0.1325
DISCLAIMER: This is a technical analysis idea, not financial advice. Always manage your risk, use proper position sizing, and do your own research before trading. Crypto markets are highly volatile.
311
·
--
Рост
ALTCOINS ARE ON FIRE! 🔥 WHO'S LEADING THE RALLY?
The crypto market is heating up, and some low-cap altcoins are making serious moves! 📈
🔥 Today's Top Gainers:
🥇 $KOMA +37.01% 🚀
🥈 $IDOL +33.37%
🥉 $AIOT +29.99%
⚡ $ICNT +27.23%
🔥 $JCT +25.79%
💎 $TA +19.33%
🚀 $SWARMS +17.52%
📈 $ONE +16.89%
👀 What's Happening?
Smaller altcoins are showing impressive momentum, with leading the pack at over 37% gains!
But here's the real question: Can these tokens maintain their momentum, or is a pullback around the corner?
⚠️ Big pumps bring big opportunities, but chasing green candles without confirmation can be risky.
#Crypto #Altcoins #CryptoTrading #bullish #Binance
Which coin has the biggest potential for the next breakout
ALTCOINS ARE ON FIRE! 🔥 WHO'S LEADING THE RALLY?
The crypto market is heating up, and some low-cap altcoins are making serious moves! 📈
🔥 Today's Top Gainers:
🥇 $KOMA +37.01% 🚀
🥈 $IDOL +33.37%
🥉 $AIOT +29.99%
⚡ $ICNT +27.23%
🔥 $JCT +25.79%
💎 $TA +19.33%
🚀 $SWARMS +17.52%
📈 $ONE +16.89%
👀 What's Happening?
Smaller altcoins are showing impressive momentum, with leading the pack at over 37% gains!
But here's the real question: Can these tokens maintain their momentum, or is a pullback around the corner?
⚠️ Big pumps bring big opportunities, but chasing green candles without confirmation can be risky.
#Crypto #Altcoins #CryptoTrading #bullish #Binance
Which coin has the biggest potential for the next breakout
The crypto market is heating up, and some low-cap altcoins are making serious moves! 📈
🔥 Today's Top Gainers:
🥇 $KOMA +37.01% 🚀
🥈 $IDOL +33.37%
🥉 $AIOT +29.99%
⚡ $ICNT +27.23%
🔥 $JCT +25.79%
💎 $TA +19.33%
🚀 $SWARMS +17.52%
📈 $ONE +16.89%
👀 What's Happening?
Smaller altcoins are showing impressive momentum, with leading the pack at over 37% gains!
But here's the real question: Can these tokens maintain their momentum, or is a pullback around the corner?
⚠️ Big pumps bring big opportunities, but chasing green candles without confirmation can be risky.
#Crypto #Altcoins #CryptoTrading #bullish #Binance
Which coin has the biggest potential for the next breakout
Which altcoin breaks next? 🚀
0%
Who leads the rally? 🔥
0%
Best coin for breakout? 👀
0%
Ready for altseason gains? 📈
0%
0 проголосовали • Голосование закрыто
87
·
--
Рост
🔥 **Personal hook I'm watching: $ICNT ** 🔥
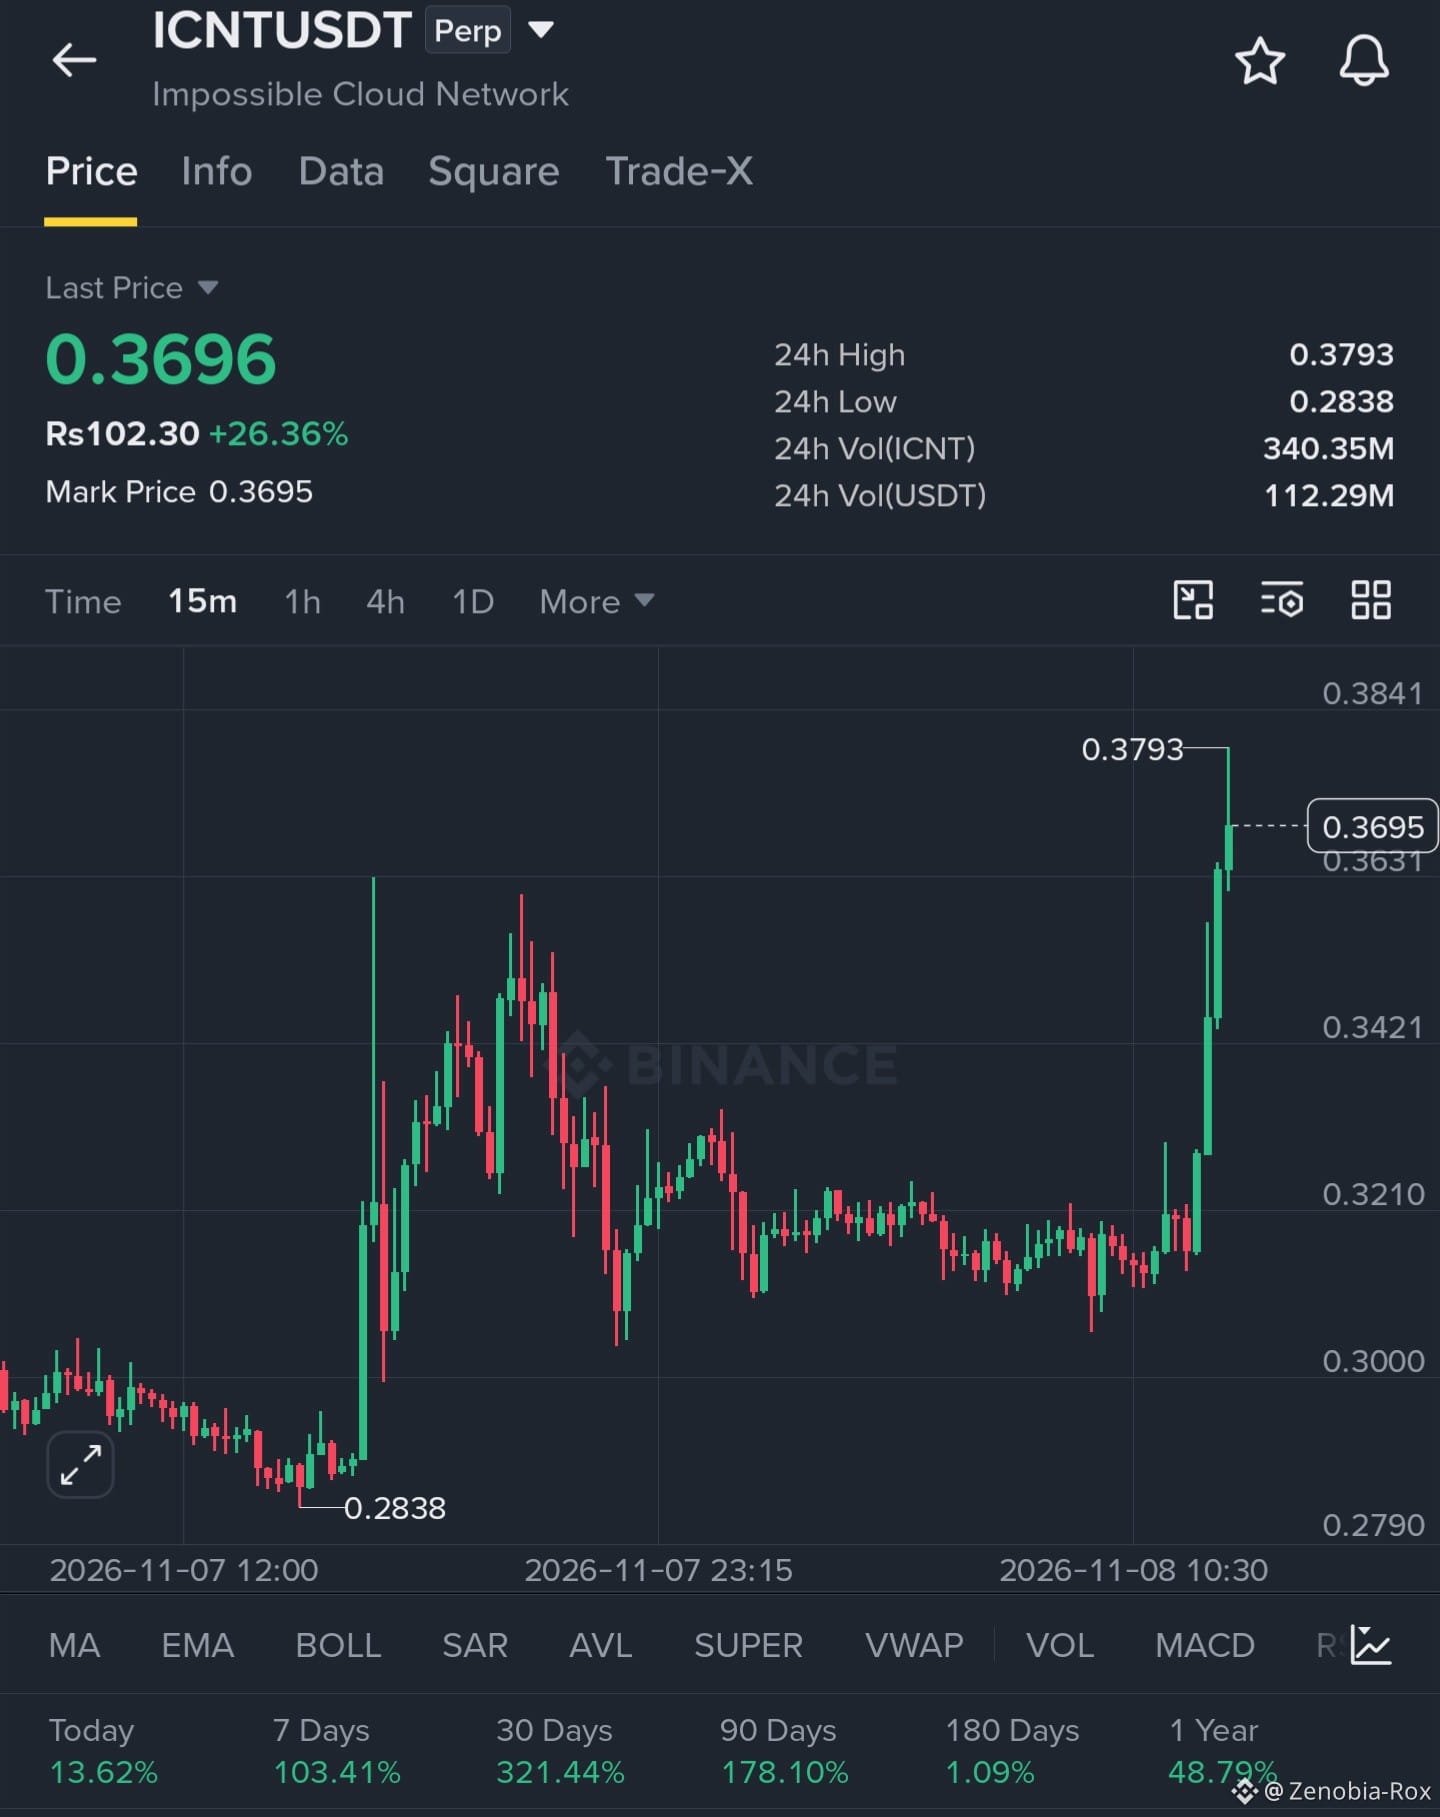
Seven days ago nobody cared. Now it's up **+26% in 24h** with **112M USDT** in volume. 👀
The chart tells the story. $ICNT sat quietly around 0.30 to 0.32, then one vertical rocket candle took it straight to 0.3793. Smart money isn't chasing the top, and neither am I. I'm waiting for the pullback.
📍 **Entry:** 0.3520 – 0.3560 (retest zone, no FOMO buying here)
🎯 **TP1:** 0.3793 (the 24h high, a first breath of profit)
🎯 **TP2:** 0.3950 (breakout continuation)
🎯 **TP3:** 0.4200 (moon-bag target 🚀)
🛑 **Stop Loss:** 0.3390 (a close below 0.3421 means the breakout failed, and I'm out, no ego)
The setup is simple. If 0.3500 holds as the new floor, this move may just be getting started. If it doesn't, the stop protects me. Either way, I'm in control.
Patience pays. Chasing green candles pays the exchange. 😉
⚠️ **DISCLAIMER:** This is my personal opinion and not financial advice. Crypto and futures trading carry very high risk, and you can lose your entire capital. Use proper risk management, never risk more than you can afford to l
ose, and do your own research (DYOR) before entering any trade.
{future}(ICNTUSDT)
🔥 **Personal hook I'm watching: $ICNT ** 🔥
Seven days ago nobody cared. Now it's up **+26% in 24h** with **112M USDT** in volume. 👀
The chart tells the story. $ICNT sat quietly around 0.30 to 0.32, then one vertical rocket candle took it straight to 0.3793. Smart money isn't chasing the top, and neither am I. I'm waiting for the pullback.
📍 **Entry:** 0.3520 – 0.3560 (retest zone, no FOMO buying here)
🎯 **TP1:** 0.3793 (the 24h high, a first breath of profit)
🎯 **TP2:** 0.3950 (breakout continuation)
🎯 **TP3:** 0.4200 (moon-bag target 🚀)
🛑 **Stop Loss:** 0.3390 (a close below 0.3421 means the breakout failed, and I'm out, no ego)
The setup is simple. If 0.3500 holds as the new floor, this move may just be getting started. If it doesn't, the stop protects me. Either way, I'm in control.
Patience pays. Chasing green candles pays the exchange. 😉
⚠️ **DISCLAIMER:** This is my personal opinion and not financial advice. Crypto and futures trading carry very high risk, and you can lose your entire capital. Use proper risk management, never risk more than you can afford to l
ose, and do your own research (DYOR) before entering any trade.
Seven days ago nobody cared. Now it's up **+26% in 24h** with **112M USDT** in volume. 👀
The chart tells the story. $ICNT sat quietly around 0.30 to 0.32, then one vertical rocket candle took it straight to 0.3793. Smart money isn't chasing the top, and neither am I. I'm waiting for the pullback.
📍 **Entry:** 0.3520 – 0.3560 (retest zone, no FOMO buying here)
🎯 **TP1:** 0.3793 (the 24h high, a first breath of profit)
🎯 **TP2:** 0.3950 (breakout continuation)
🎯 **TP3:** 0.4200 (moon-bag target 🚀)
🛑 **Stop Loss:** 0.3390 (a close below 0.3421 means the breakout failed, and I'm out, no ego)
The setup is simple. If 0.3500 holds as the new floor, this move may just be getting started. If it doesn't, the stop protects me. Either way, I'm in control.
Patience pays. Chasing green candles pays the exchange. 😉
⚠️ **DISCLAIMER:** This is my personal opinion and not financial advice. Crypto and futures trading carry very high risk, and you can lose your entire capital. Use proper risk management, never risk more than you can afford to l
ose, and do your own research (DYOR) before entering any trade.
1
374
·
--
Рост
🚀 $AKE – Bulls Are Holding Their Ground!
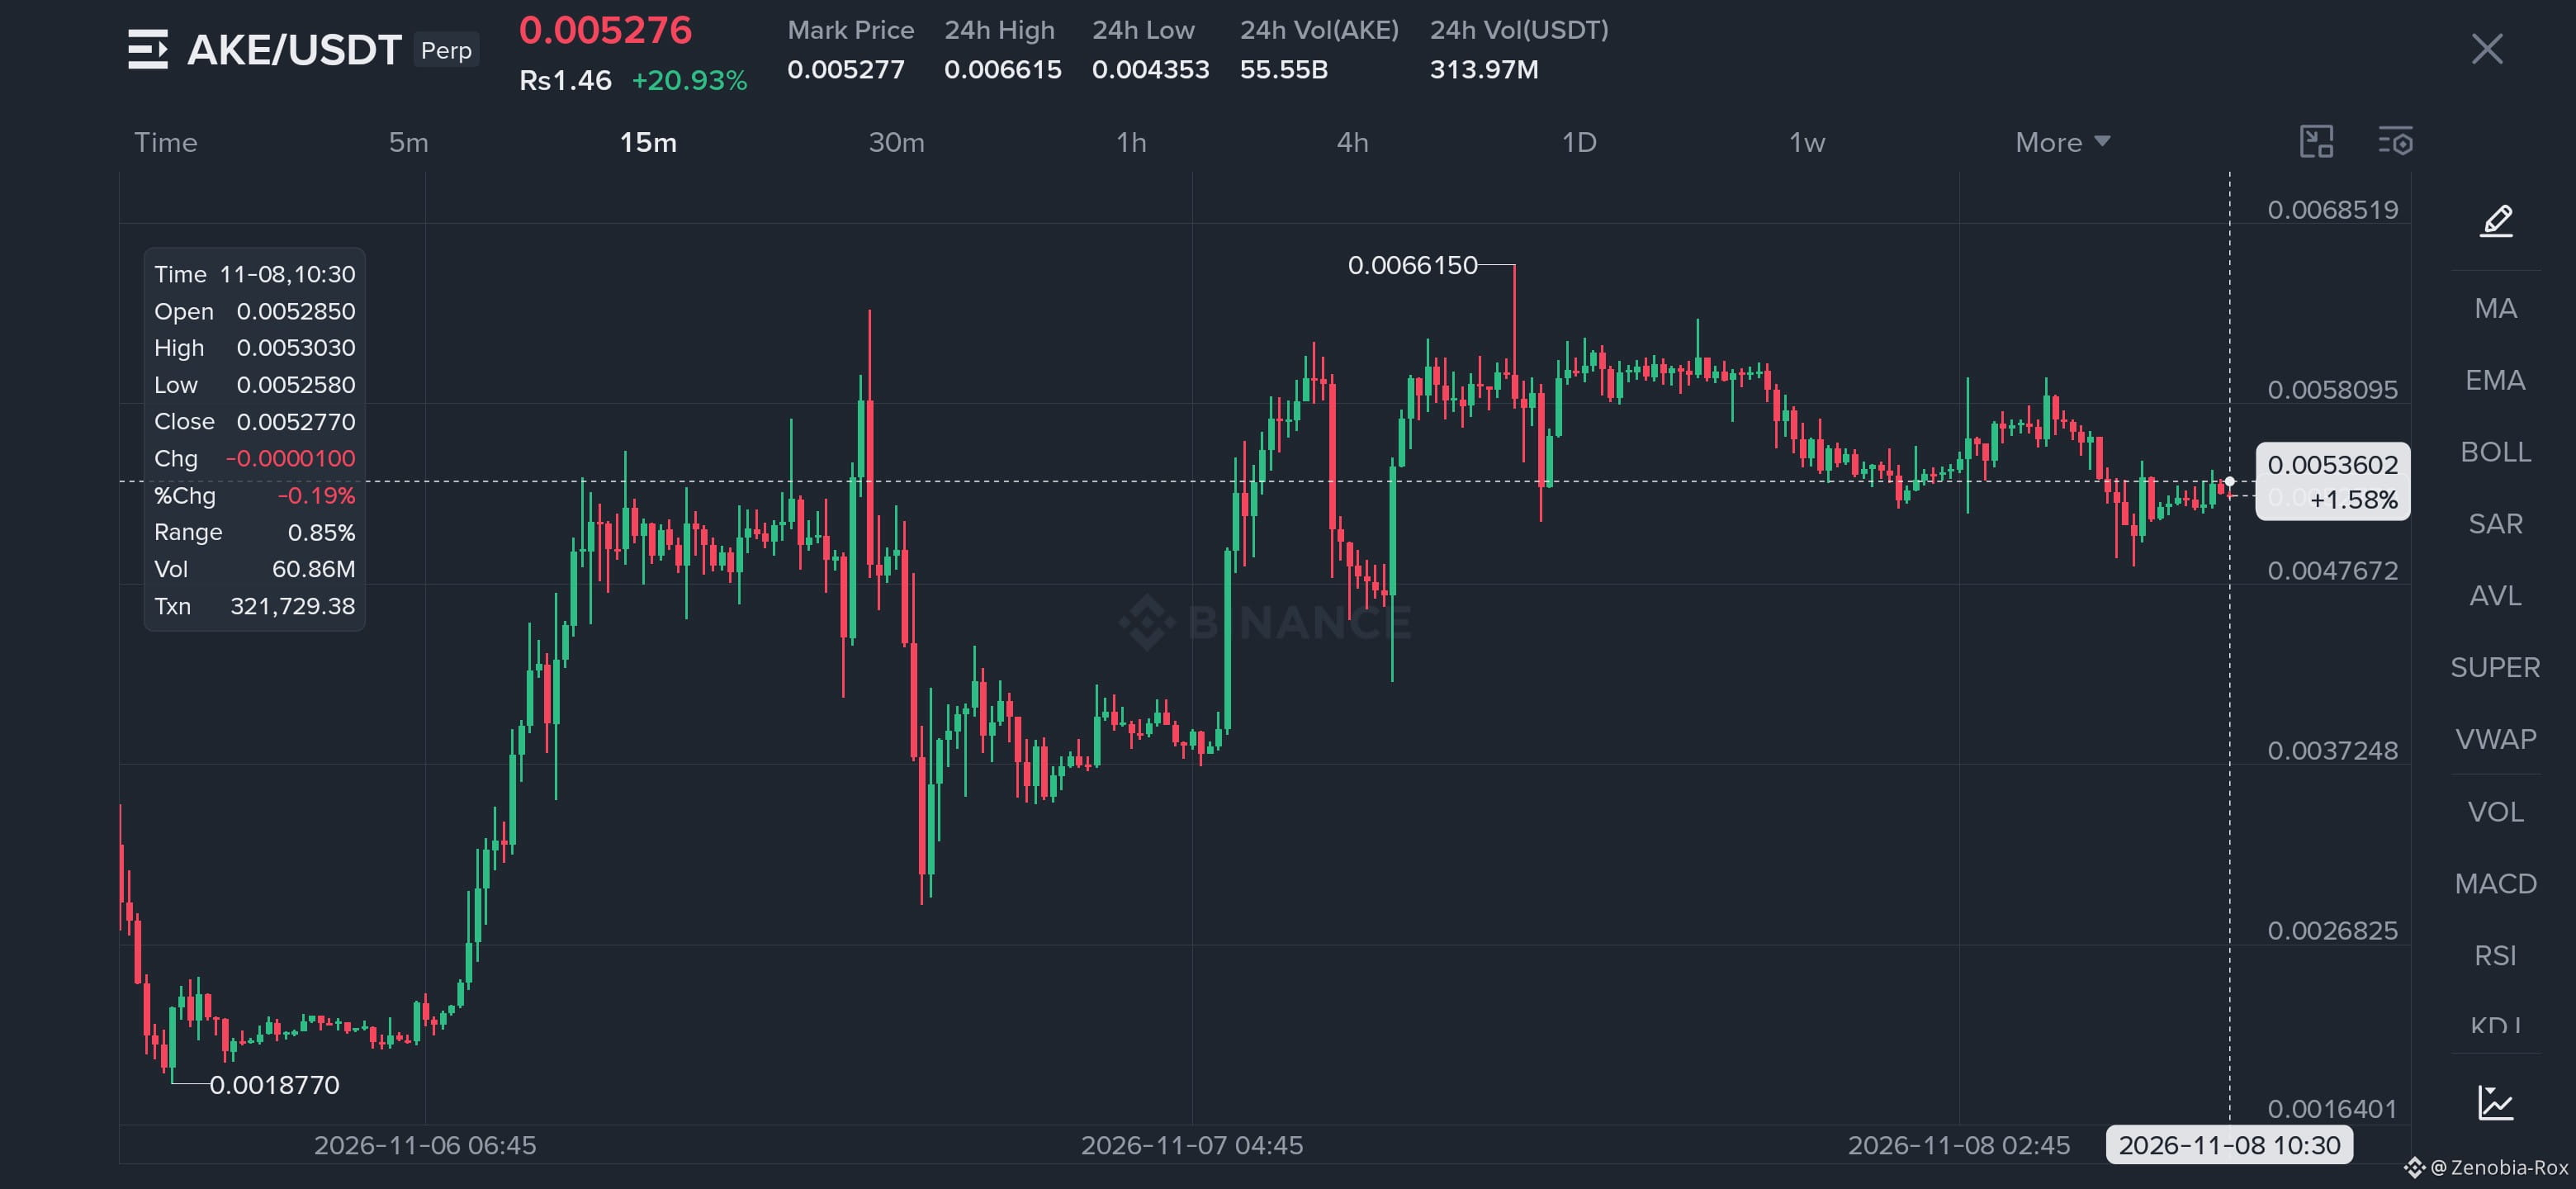
I'm watching $AKE closely because the chart is showing an interesting setup after a strong rally. Buyers have already pushed the price significantly higher, and now the market is trying to build support around the current zone.
The key question is whether bulls can reclaim the next resistance and make another run toward the previous high. I'm watching for a clean breakout with volume confirmation. 👀
Entry Level: $0.00515 – $0.00530
TP1: $0.00560
TP2: $0.00590
TP3: $0.00630
STOP LOSS: $0.00490
⚡ If buying pressure returns, $AKE could have another opportunity to push higher. Watch the breakout carefully and don't chase sudden green candles.
DISCLAIMER: This is a technical analysis idea, not financial advice. Crypto trading carries high risk. Always manage your risk and do your own research.
🚀 $AKE – Bulls Are Holding Their Ground!
I'm watching $AKE closely because the chart is showing an interesting setup after a strong rally. Buyers have already pushed the price significantly higher, and now the market is trying to build support around the current zone.
The key question is whether bulls can reclaim the next resistance and make another run toward the previous high. I'm watching for a clean breakout with volume confirmation. 👀
Entry Level: $0.00515 – $0.00530
TP1: $0.00560
TP2: $0.00590
TP3: $0.00630
STOP LOSS: $0.00490
⚡ If buying pressure returns, $AKE could have another opportunity to push higher. Watch the breakout carefully and don't chase sudden green candles.
DISCLAIMER: This is a technical analysis idea, not financial advice. Crypto trading carries high risk. Always manage your risk and do your own research.
I'm watching $AKE closely because the chart is showing an interesting setup after a strong rally. Buyers have already pushed the price significantly higher, and now the market is trying to build support around the current zone.
The key question is whether bulls can reclaim the next resistance and make another run toward the previous high. I'm watching for a clean breakout with volume confirmation. 👀
Entry Level: $0.00515 – $0.00530
TP1: $0.00560
TP2: $0.00590
TP3: $0.00630
STOP LOSS: $0.00490
⚡ If buying pressure returns, $AKE could have another opportunity to push higher. Watch the breakout carefully and don't chase sudden green candles.
DISCLAIMER: This is a technical analysis idea, not financial advice. Crypto trading carries high risk. Always manage your risk and do your own research.
473
·
--
Рост
🚀 $ACT /USDT – Bulls Are Still in the Game!
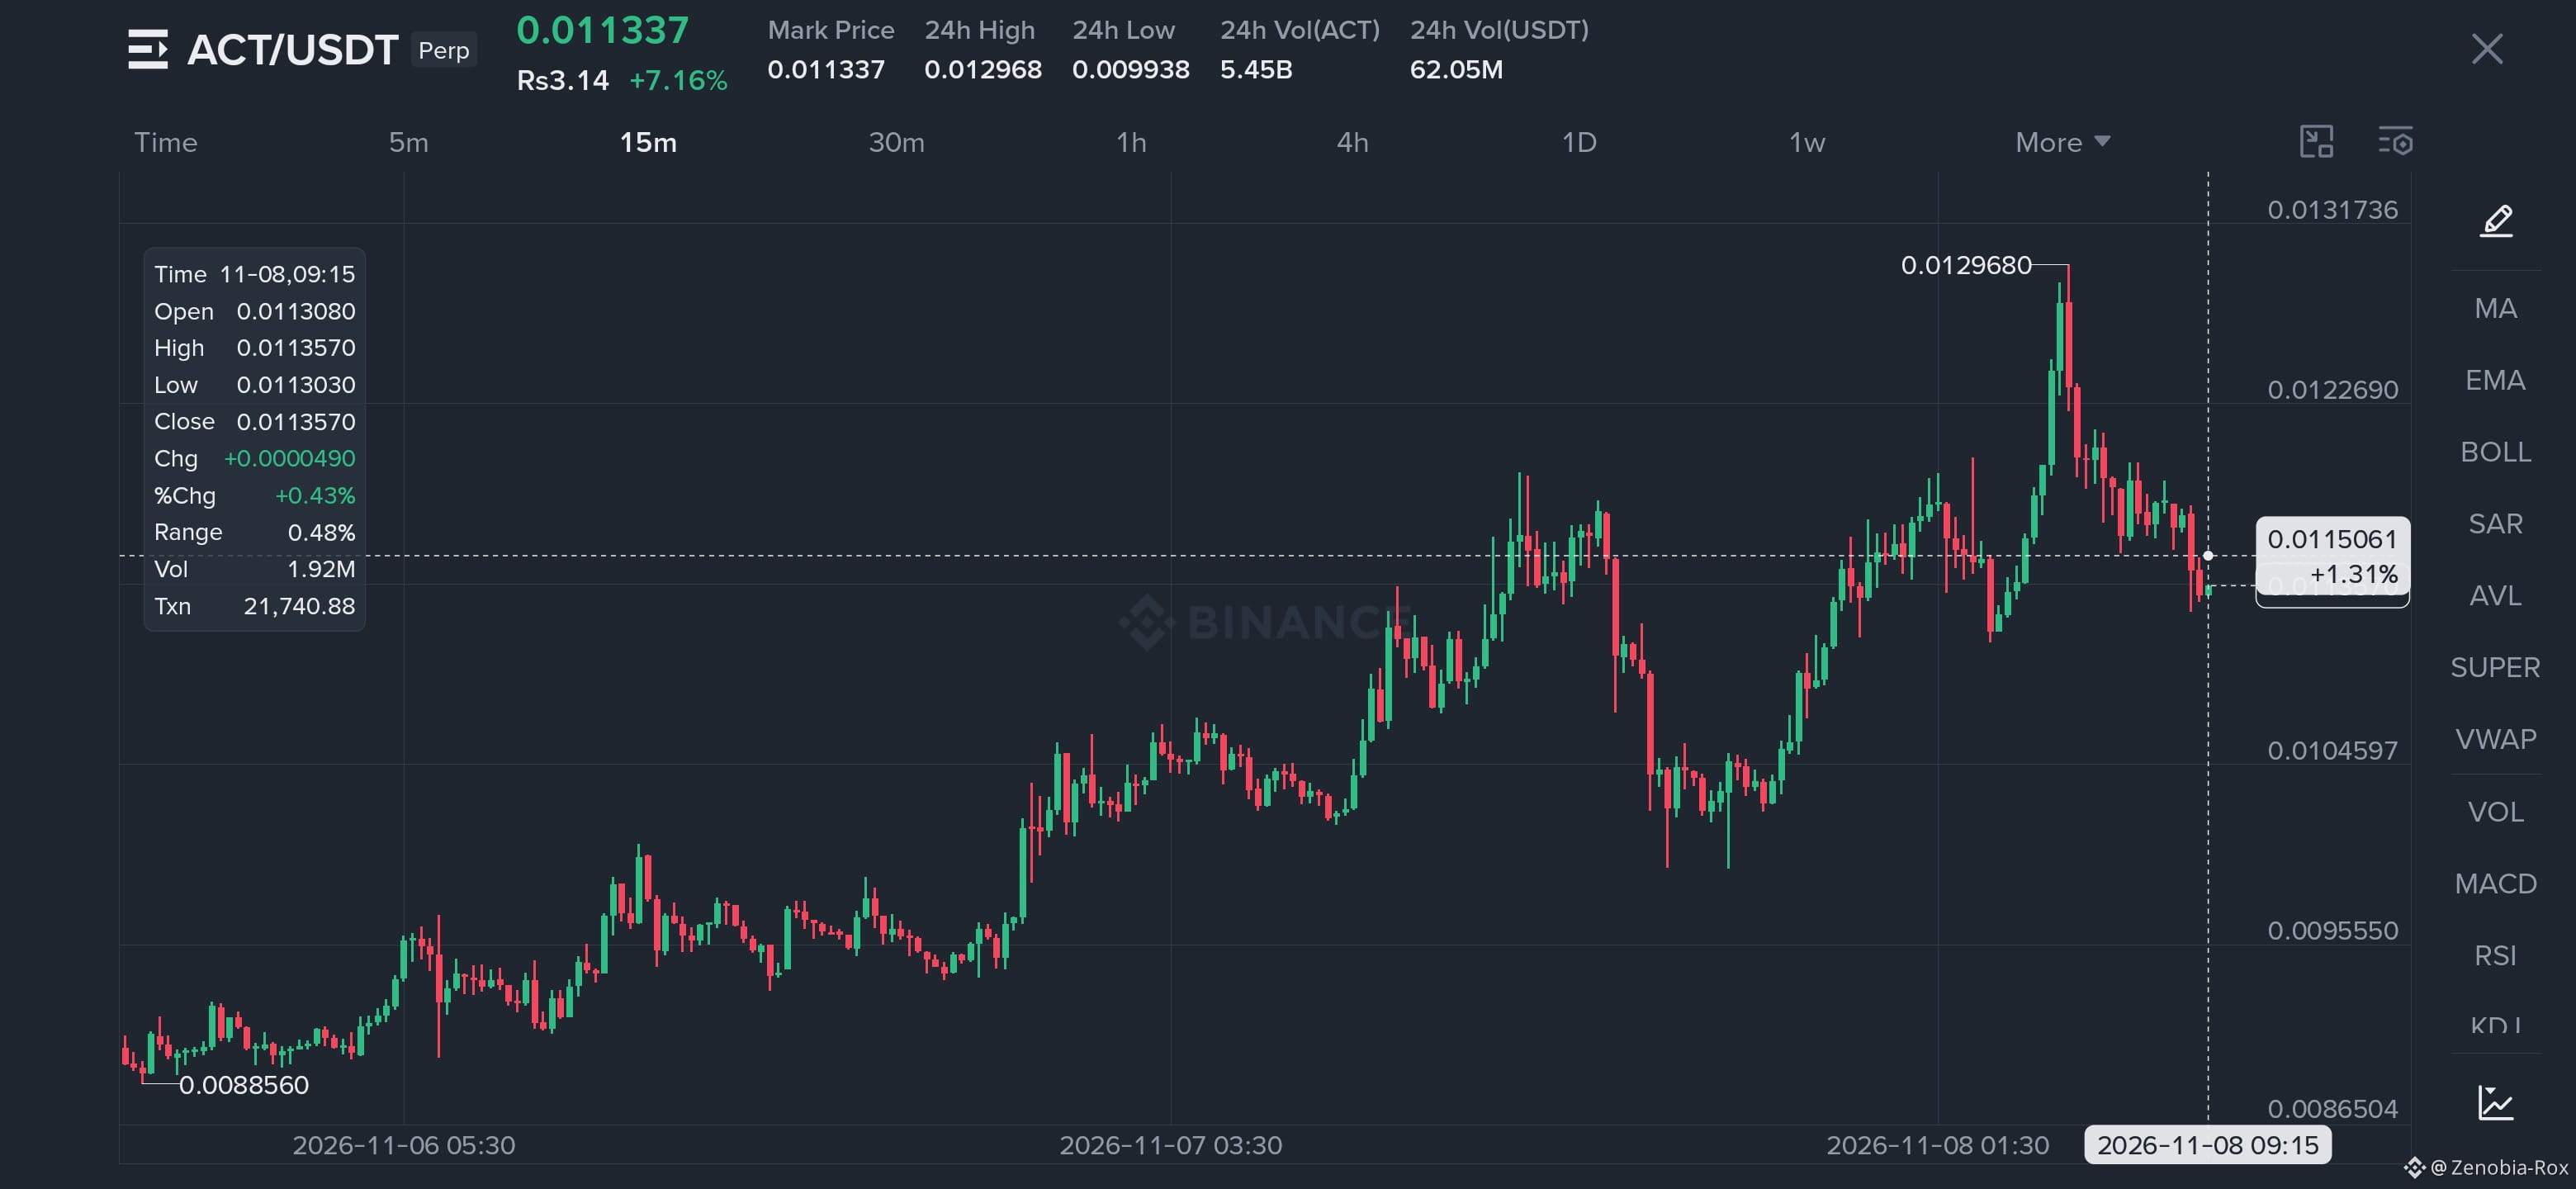
I'm watching $ACT closely because the 15M chart is showing an interesting battle between buyers and sellers. After an impressive rally toward $0.012968, price has entered a pullback phase, but the broader short-term structure is still showing bullish potential.
The key now is whether buyers can defend the $0.0110–$0.0113 support zone and push price toward another breakout. If momentum returns, ACT could be preparing for another upside move! 🔥
📍 Entry Level: $0.01110 – $0.01135
🎯 TP1: $0.01180
🎯 TP2: $0.01230
🎯 TP3: $0.01290
🛑 STOP LOSS: $0.01075
⚡ Key Watch: A strong 15M candle close above $0.01180 could strengthen the bullish continuation setup. Losing $0.0110 would weaken the idea, so watch support carefully.
DISCLAIMER: This is a technical trading setup based on the provided chart, not financial advice. Always manage risk, use proper position sizing, and do your own research before entering any trade.
{spot}(ACTUSDT)
🚀 $ACT /USDT – Bulls Are Still in the Game!
I'm watching $ACT closely because the 15M chart is showing an interesting battle between buyers and sellers. After an impressive rally toward $0.012968, price has entered a pullback phase, but the broader short-term structure is still showing bullish potential.
The key now is whether buyers can defend the $0.0110–$0.0113 support zone and push price toward another breakout. If momentum returns, ACT could be preparing for another upside move! 🔥
📍 Entry Level: $0.01110 – $0.01135
🎯 TP1: $0.01180
🎯 TP2: $0.01230
🎯 TP3: $0.01290
🛑 STOP LOSS: $0.01075
⚡ Key Watch: A strong 15M candle close above $0.01180 could strengthen the bullish continuation setup. Losing $0.0110 would weaken the idea, so watch support carefully.
DISCLAIMER: This is a technical trading setup based on the provided chart, not financial advice. Always manage risk, use proper position sizing, and do your own research before entering any trade.
I'm watching $ACT closely because the 15M chart is showing an interesting battle between buyers and sellers. After an impressive rally toward $0.012968, price has entered a pullback phase, but the broader short-term structure is still showing bullish potential.
The key now is whether buyers can defend the $0.0110–$0.0113 support zone and push price toward another breakout. If momentum returns, ACT could be preparing for another upside move! 🔥
📍 Entry Level: $0.01110 – $0.01135
🎯 TP1: $0.01180
🎯 TP2: $0.01230
🎯 TP3: $0.01290
🛑 STOP LOSS: $0.01075
⚡ Key Watch: A strong 15M candle close above $0.01180 could strengthen the bullish continuation setup. Losing $0.0110 would weaken the idea, so watch support carefully.
DISCLAIMER: This is a technical trading setup based on the provided chart, not financial advice. Always manage risk, use proper position sizing, and do your own research before entering any trade.
410
·
--
Рост
🔥 $BTC /USDT – Bears Are Taking Control!
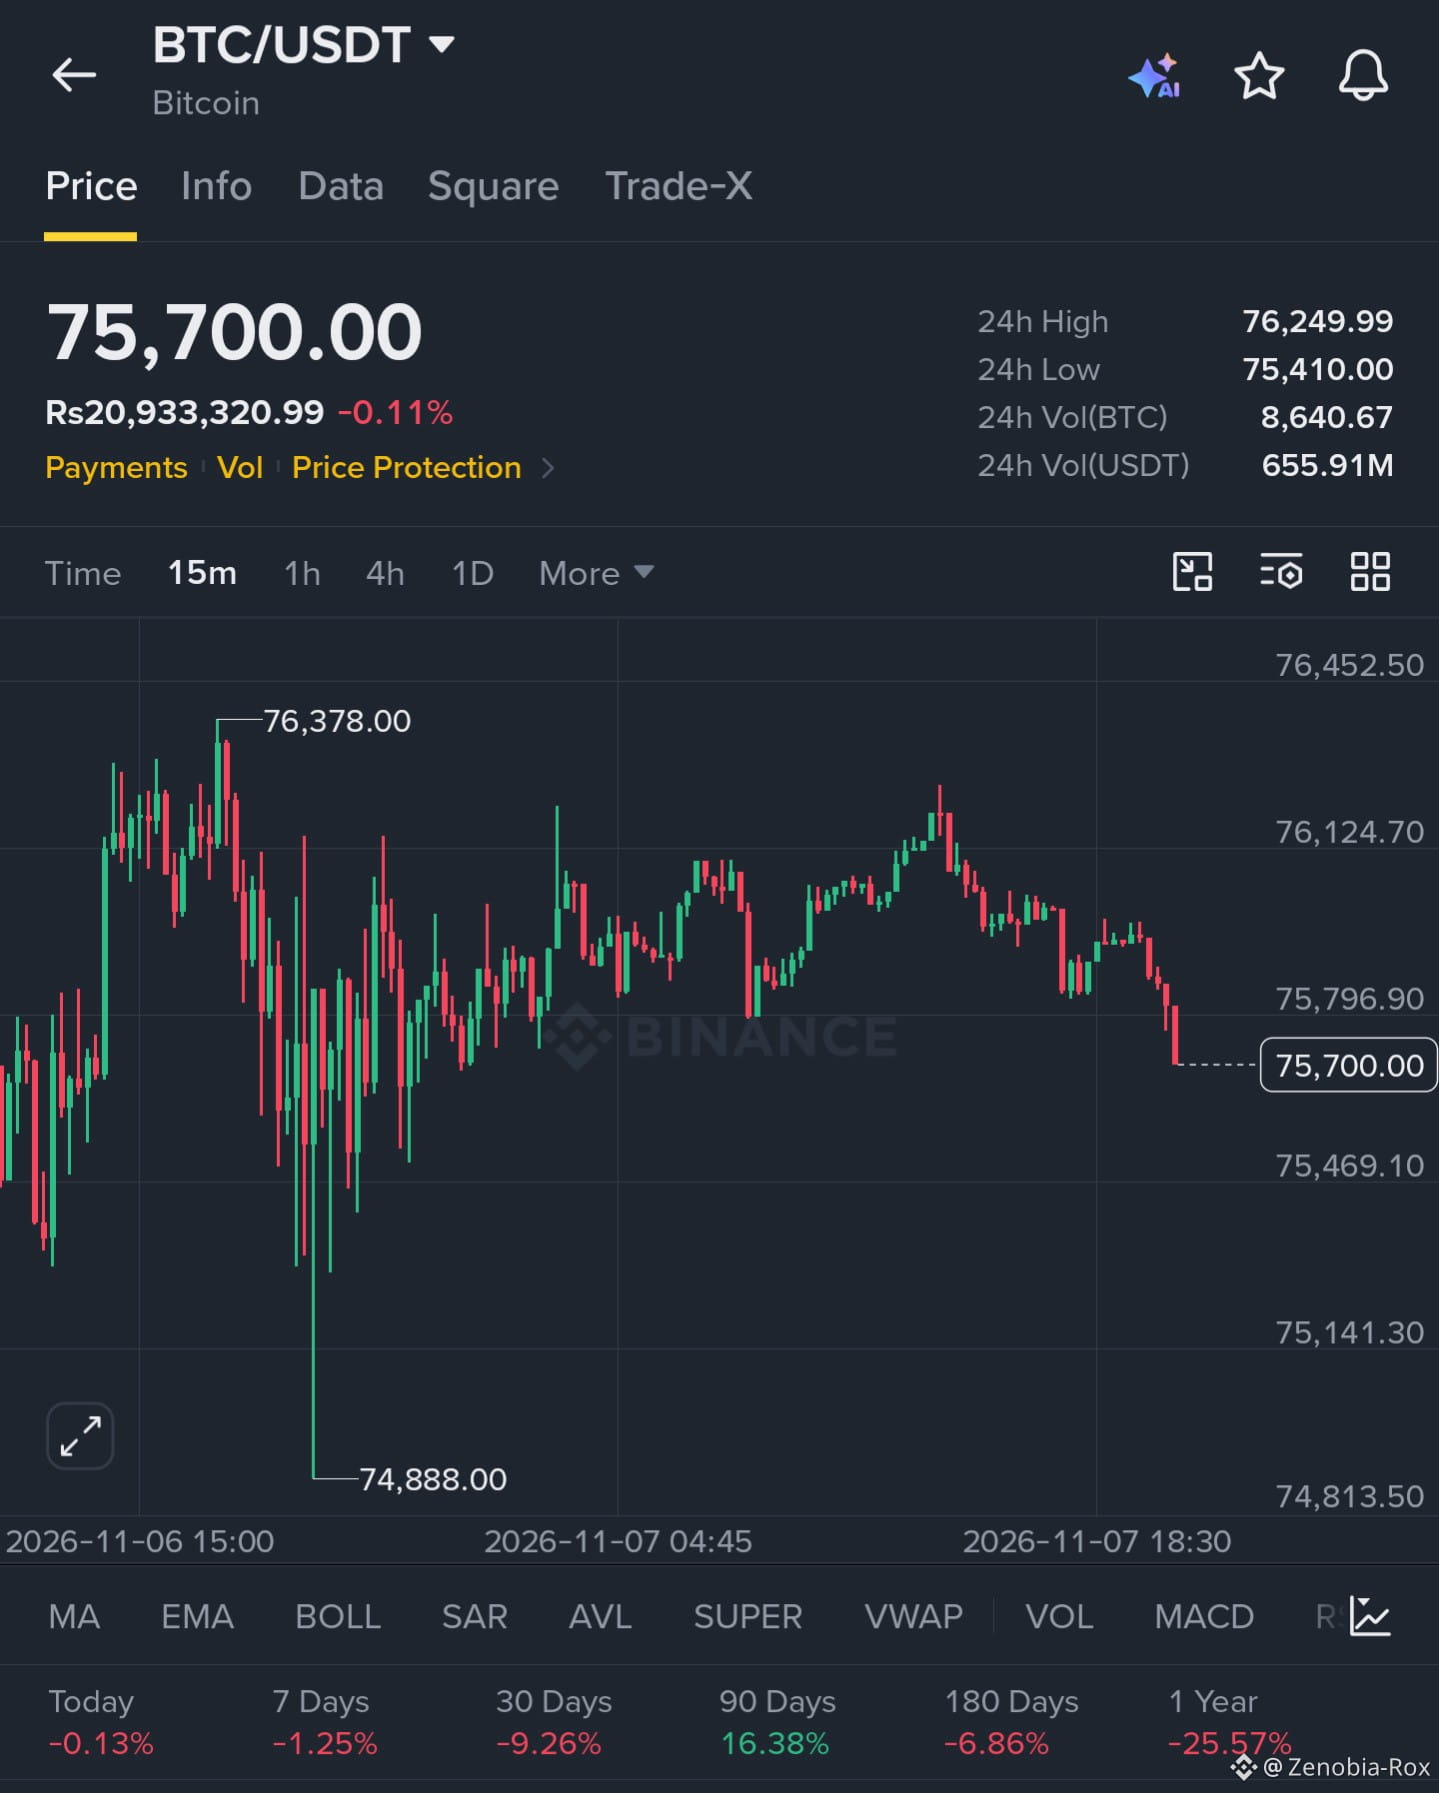
I'm watching $BTC closely around $75,700. The 15-minute chart is showing fresh selling pressure after price failed to sustain its recovery near the $76,100 resistance zone.
BTC has slipped below the $75,800 area, and sellers are starting to gain momentum. I'm keeping a bearish eye on this setup, but I want confirmation before chasing the move.
🎯 Trade Setup – SHORT
Entry Level: $75,680 – $75,780
TP1: $75,470
TP2: $75,150
TP3: $74,900
STOP LOSS: $76,080
⚠️ Key Levels to Watch:
- Resistance: $75,800 – $76,125
- Support: $75,470
- Major downside area: $75,150
DISCLAIMER: This is a technical analysis idea, not financial advice. Always manage your risk, use proper position sizing, and wait for confirmation before entering any trade. Crypto markets are highly volatile.
{spot}(BTCUSDT)
#BTC #Bitcoin #BTCUSDT #cryptotrading #BİNANCE
🔥 $BTC /USDT – Bears Are Taking Control!
I'm watching $BTC closely around $75,700. The 15-minute chart is showing fresh selling pressure after price failed to sustain its recovery near the $76,100 resistance zone.
BTC has slipped below the $75,800 area, and sellers are starting to gain momentum. I'm keeping a bearish eye on this setup, but I want confirmation before chasing the move.
🎯 Trade Setup – SHORT
Entry Level: $75,680 – $75,780
TP1: $75,470
TP2: $75,150
TP3: $74,900
STOP LOSS: $76,080
⚠️ Key Levels to Watch:
- Resistance: $75,800 – $76,125
- Support: $75,470
- Major downside area: $75,150
DISCLAIMER: This is a technical analysis idea, not financial advice. Always manage your risk, use proper position sizing, and wait for confirmation before entering any trade. Crypto markets are highly volatile.
#BTC #Bitcoin #BTCUSDT #cryptotrading #BİNANCE
I'm watching $BTC closely around $75,700. The 15-minute chart is showing fresh selling pressure after price failed to sustain its recovery near the $76,100 resistance zone.
BTC has slipped below the $75,800 area, and sellers are starting to gain momentum. I'm keeping a bearish eye on this setup, but I want confirmation before chasing the move.
🎯 Trade Setup – SHORT
Entry Level: $75,680 – $75,780
TP1: $75,470
TP2: $75,150
TP3: $74,900
STOP LOSS: $76,080
⚠️ Key Levels to Watch:
- Resistance: $75,800 – $76,125
- Support: $75,470
- Major downside area: $75,150
DISCLAIMER: This is a technical analysis idea, not financial advice. Always manage your risk, use proper position sizing, and wait for confirmation before entering any trade. Crypto markets are highly volatile.
#BTC #Bitcoin #BTCUSDT #cryptotrading #BİNANCE
910
·
--
Рост
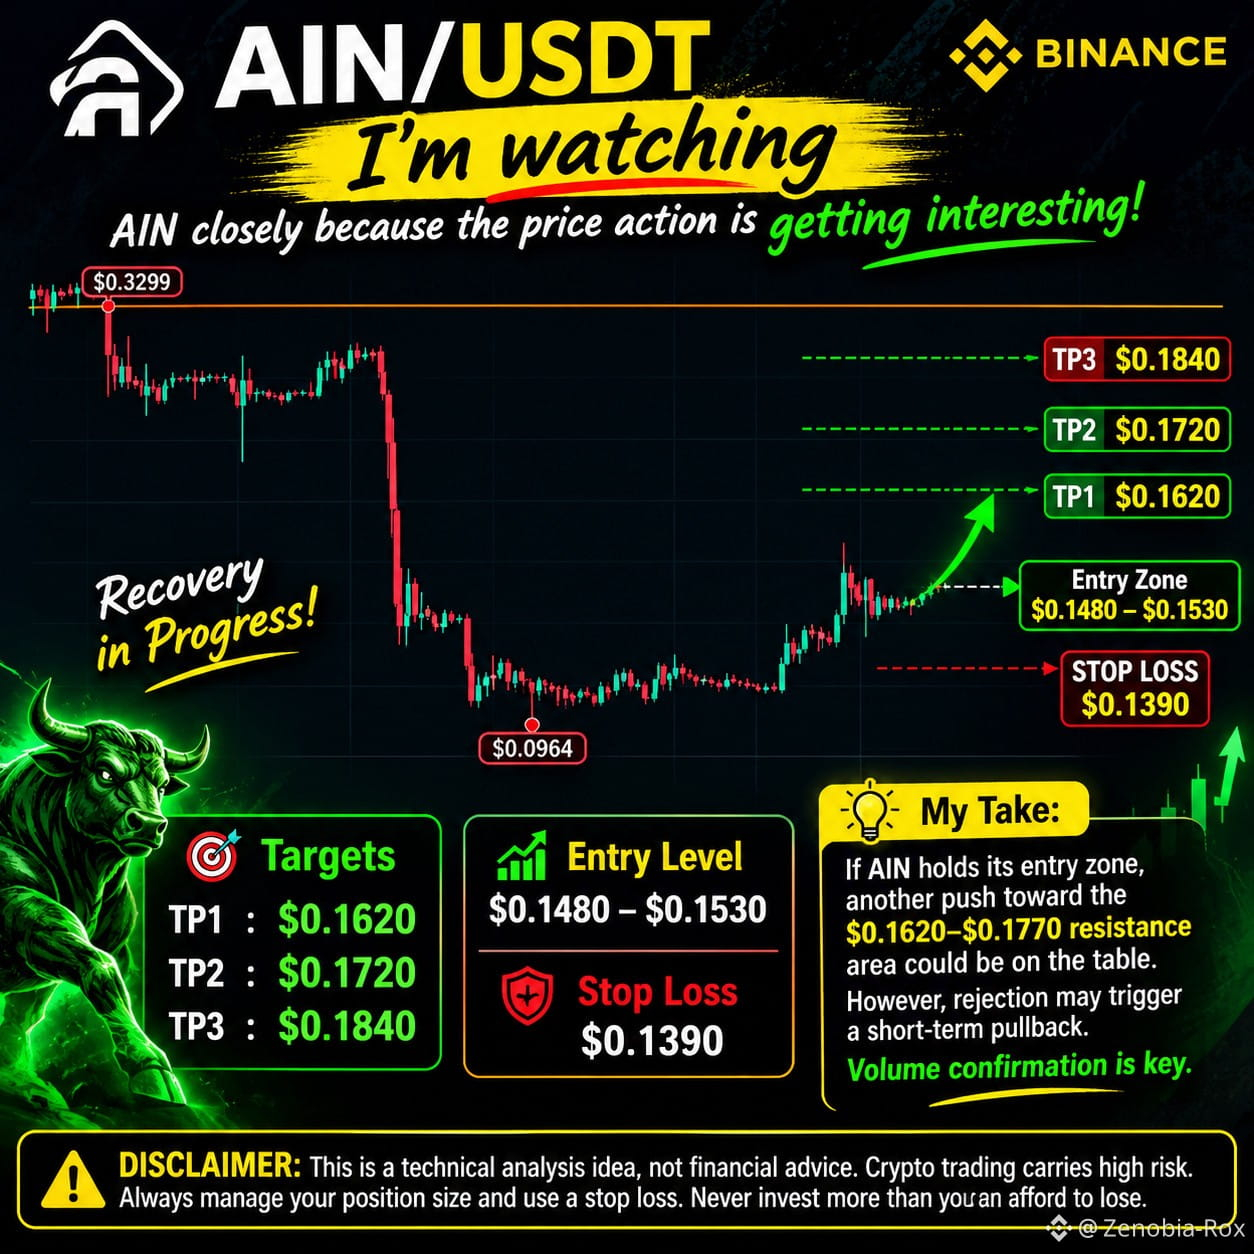
🚀 $AIN USDT – Bulls Are Trying to Take Control!
I'm watching $AIN closely because the price action is getting interesting. After a massive sell-off toward $0.0964, buyers have stepped back in and pushed the price toward $0.1547.
The recovery is impressive, but I don't want to chase a candle after such a strong 24-hour move. I'm looking for a healthy retest and confirmation that buyers can defend the current momentum.
📍 Entry Level: $0.1480 – $0.1530
🎯 TP1: $0.1620
🎯 TP2: $0.1720
🎯 TP3: $0.1840
🛑 STOP LOSS: $0.1390
My Take: If AIN holds its entry zone, another push toward the $0.1620–$0.1770 resistance area could be on the table. However, rejection around resistance may trigger a short-term pullback. Volume confirmation is key.
⚠️ DISCLAIMER: This is a technical analysis idea, not financial advice. Crypto trading carries high risk. Always manage your position size and use a stop loss. Never invest more than you can afford to lose.
{future}(AINUSDT)
🚀 $AIN USDT – Bulls Are Trying to Take Control!
I'm watching $AIN closely because the price action is getting interesting. After a massive sell-off toward $0.0964, buyers have stepped back in and pushed the price toward $0.1547.
The recovery is impressive, but I don't want to chase a candle after such a strong 24-hour move. I'm looking for a healthy retest and confirmation that buyers can defend the current momentum.
📍 Entry Level: $0.1480 – $0.1530
🎯 TP1: $0.1620
🎯 TP2: $0.1720
🎯 TP3: $0.1840
🛑 STOP LOSS: $0.1390
My Take: If AIN holds its entry zone, another push toward the $0.1620–$0.1770 resistance area could be on the table. However, rejection around resistance may trigger a short-term pullback. Volume confirmation is key.
⚠️ DISCLAIMER: This is a technical analysis idea, not financial advice. Crypto trading carries high risk. Always manage your position size and use a stop loss. Never invest more than you can afford to lose.
I'm watching $AIN closely because the price action is getting interesting. After a massive sell-off toward $0.0964, buyers have stepped back in and pushed the price toward $0.1547.
The recovery is impressive, but I don't want to chase a candle after such a strong 24-hour move. I'm looking for a healthy retest and confirmation that buyers can defend the current momentum.
📍 Entry Level: $0.1480 – $0.1530
🎯 TP1: $0.1620
🎯 TP2: $0.1720
🎯 TP3: $0.1840
🛑 STOP LOSS: $0.1390
My Take: If AIN holds its entry zone, another push toward the $0.1620–$0.1770 resistance area could be on the table. However, rejection around resistance may trigger a short-term pullback. Volume confirmation is key.
⚠️ DISCLAIMER: This is a technical analysis idea, not financial advice. Crypto trading carries high risk. Always manage your position size and use a stop loss. Never invest more than you can afford to lose.
321
·
--
Рост
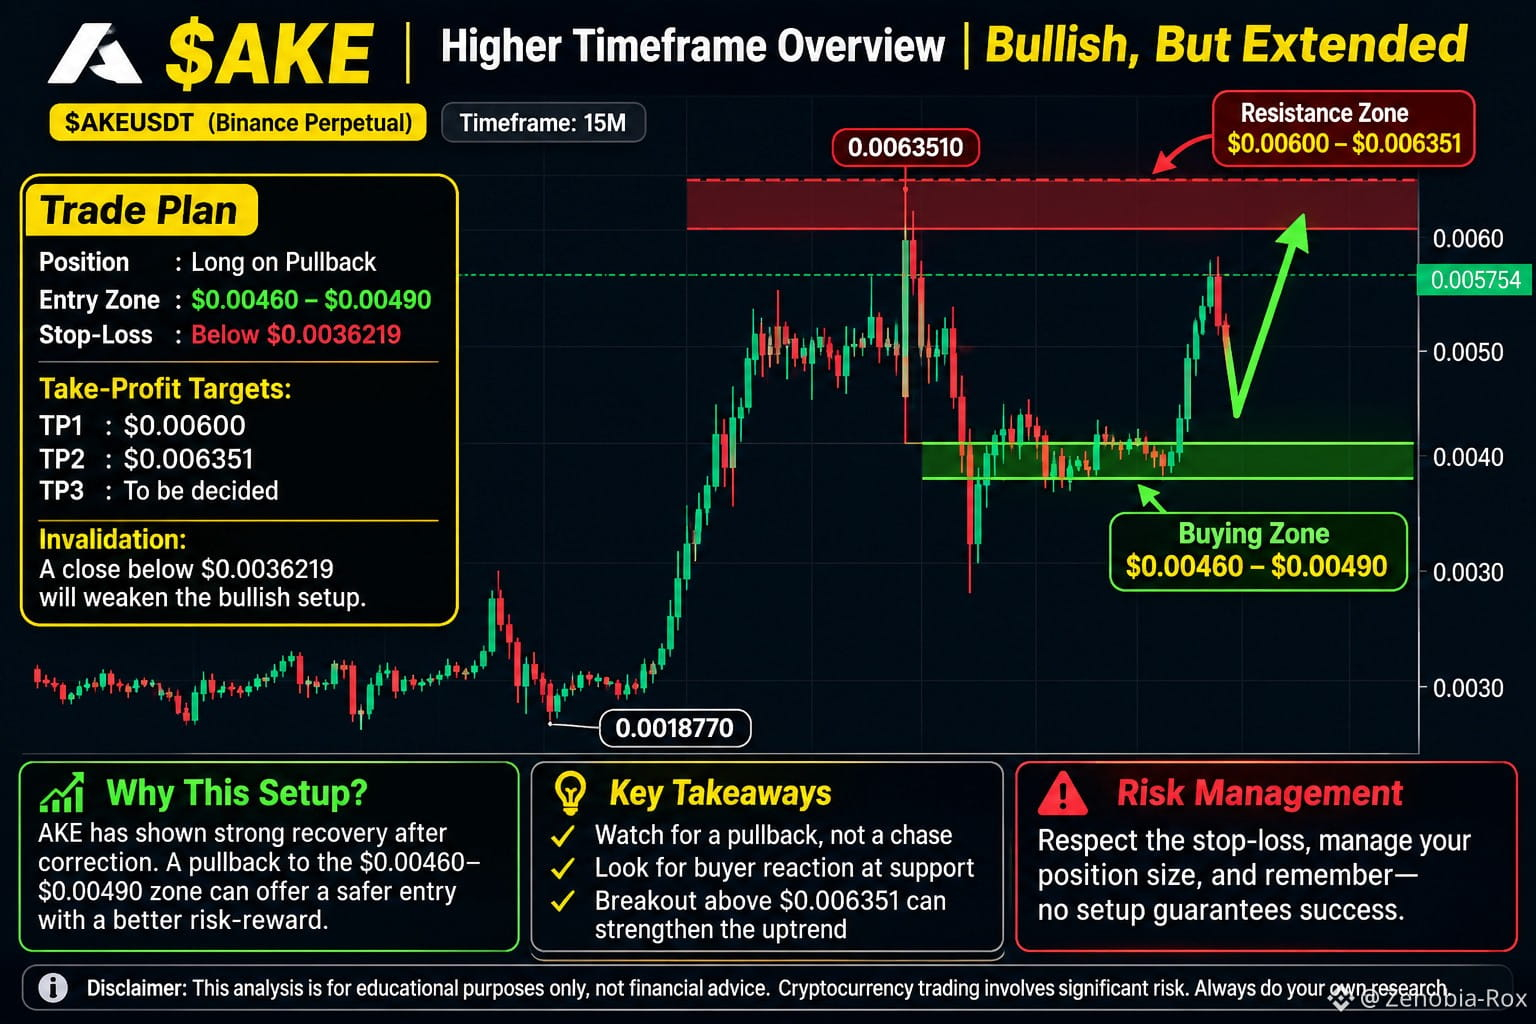
$AKE /USDT – Bulls Are Back, But One Resistance Stands in the Way!
I'm watching $AKE closely here. The market has already delivered a massive upside move, and buyers are showing impressive strength after the previous correction. But with price approaching the $0.0060 resistance area, I don't want to chase the move blindly. A healthy pullback could offer a much better opportunity.
Entry Level: $0.00460 – $0.00490 (Long on bullish confirmation)
TP1: $0.00600
TP2: $0.00635
TP3: $0.00680 (only if breakout confirms)
STOP LOSS: Below $0.00362
My View: If buyers defend the entry zone, another bullish push could develop. A clean breakout above $0.00635 would make the structure even more interesting. Until then, patience is key. No need to chase green candles!
DISCLAIMER: This is a technical analysis, not financial advice. Always manage your risk, use proper position sizing, and never trade with money you cannot afford to lose.
{future}(AKEUSDT)
$AKE /USDT – Bulls Are Back, But One Resistance Stands in the Way!
I'm watching $AKE closely here. The market has already delivered a massive upside move, and buyers are showing impressive strength after the previous correction. But with price approaching the $0.0060 resistance area, I don't want to chase the move blindly. A healthy pullback could offer a much better opportunity.
Entry Level: $0.00460 – $0.00490 (Long on bullish confirmation)
TP1: $0.00600
TP2: $0.00635
TP3: $0.00680 (only if breakout confirms)
STOP LOSS: Below $0.00362
My View: If buyers defend the entry zone, another bullish push could develop. A clean breakout above $0.00635 would make the structure even more interesting. Until then, patience is key. No need to chase green candles!
DISCLAIMER: This is a technical analysis, not financial advice. Always manage your risk, use proper position sizing, and never trade with money you cannot afford to lose.
I'm watching $AKE closely here. The market has already delivered a massive upside move, and buyers are showing impressive strength after the previous correction. But with price approaching the $0.0060 resistance area, I don't want to chase the move blindly. A healthy pullback could offer a much better opportunity.
Entry Level: $0.00460 – $0.00490 (Long on bullish confirmation)
TP1: $0.00600
TP2: $0.00635
TP3: $0.00680 (only if breakout confirms)
STOP LOSS: Below $0.00362
My View: If buyers defend the entry zone, another bullish push could develop. A clean breakout above $0.00635 would make the structure even more interesting. Until then, patience is key. No need to chase green candles!
DISCLAIMER: This is a technical analysis, not financial advice. Always manage your risk, use proper position sizing, and never trade with money you cannot afford to lose.
3
1.1k
·
--
Рост
$BIRB – I'm watching this one very closely 👀**
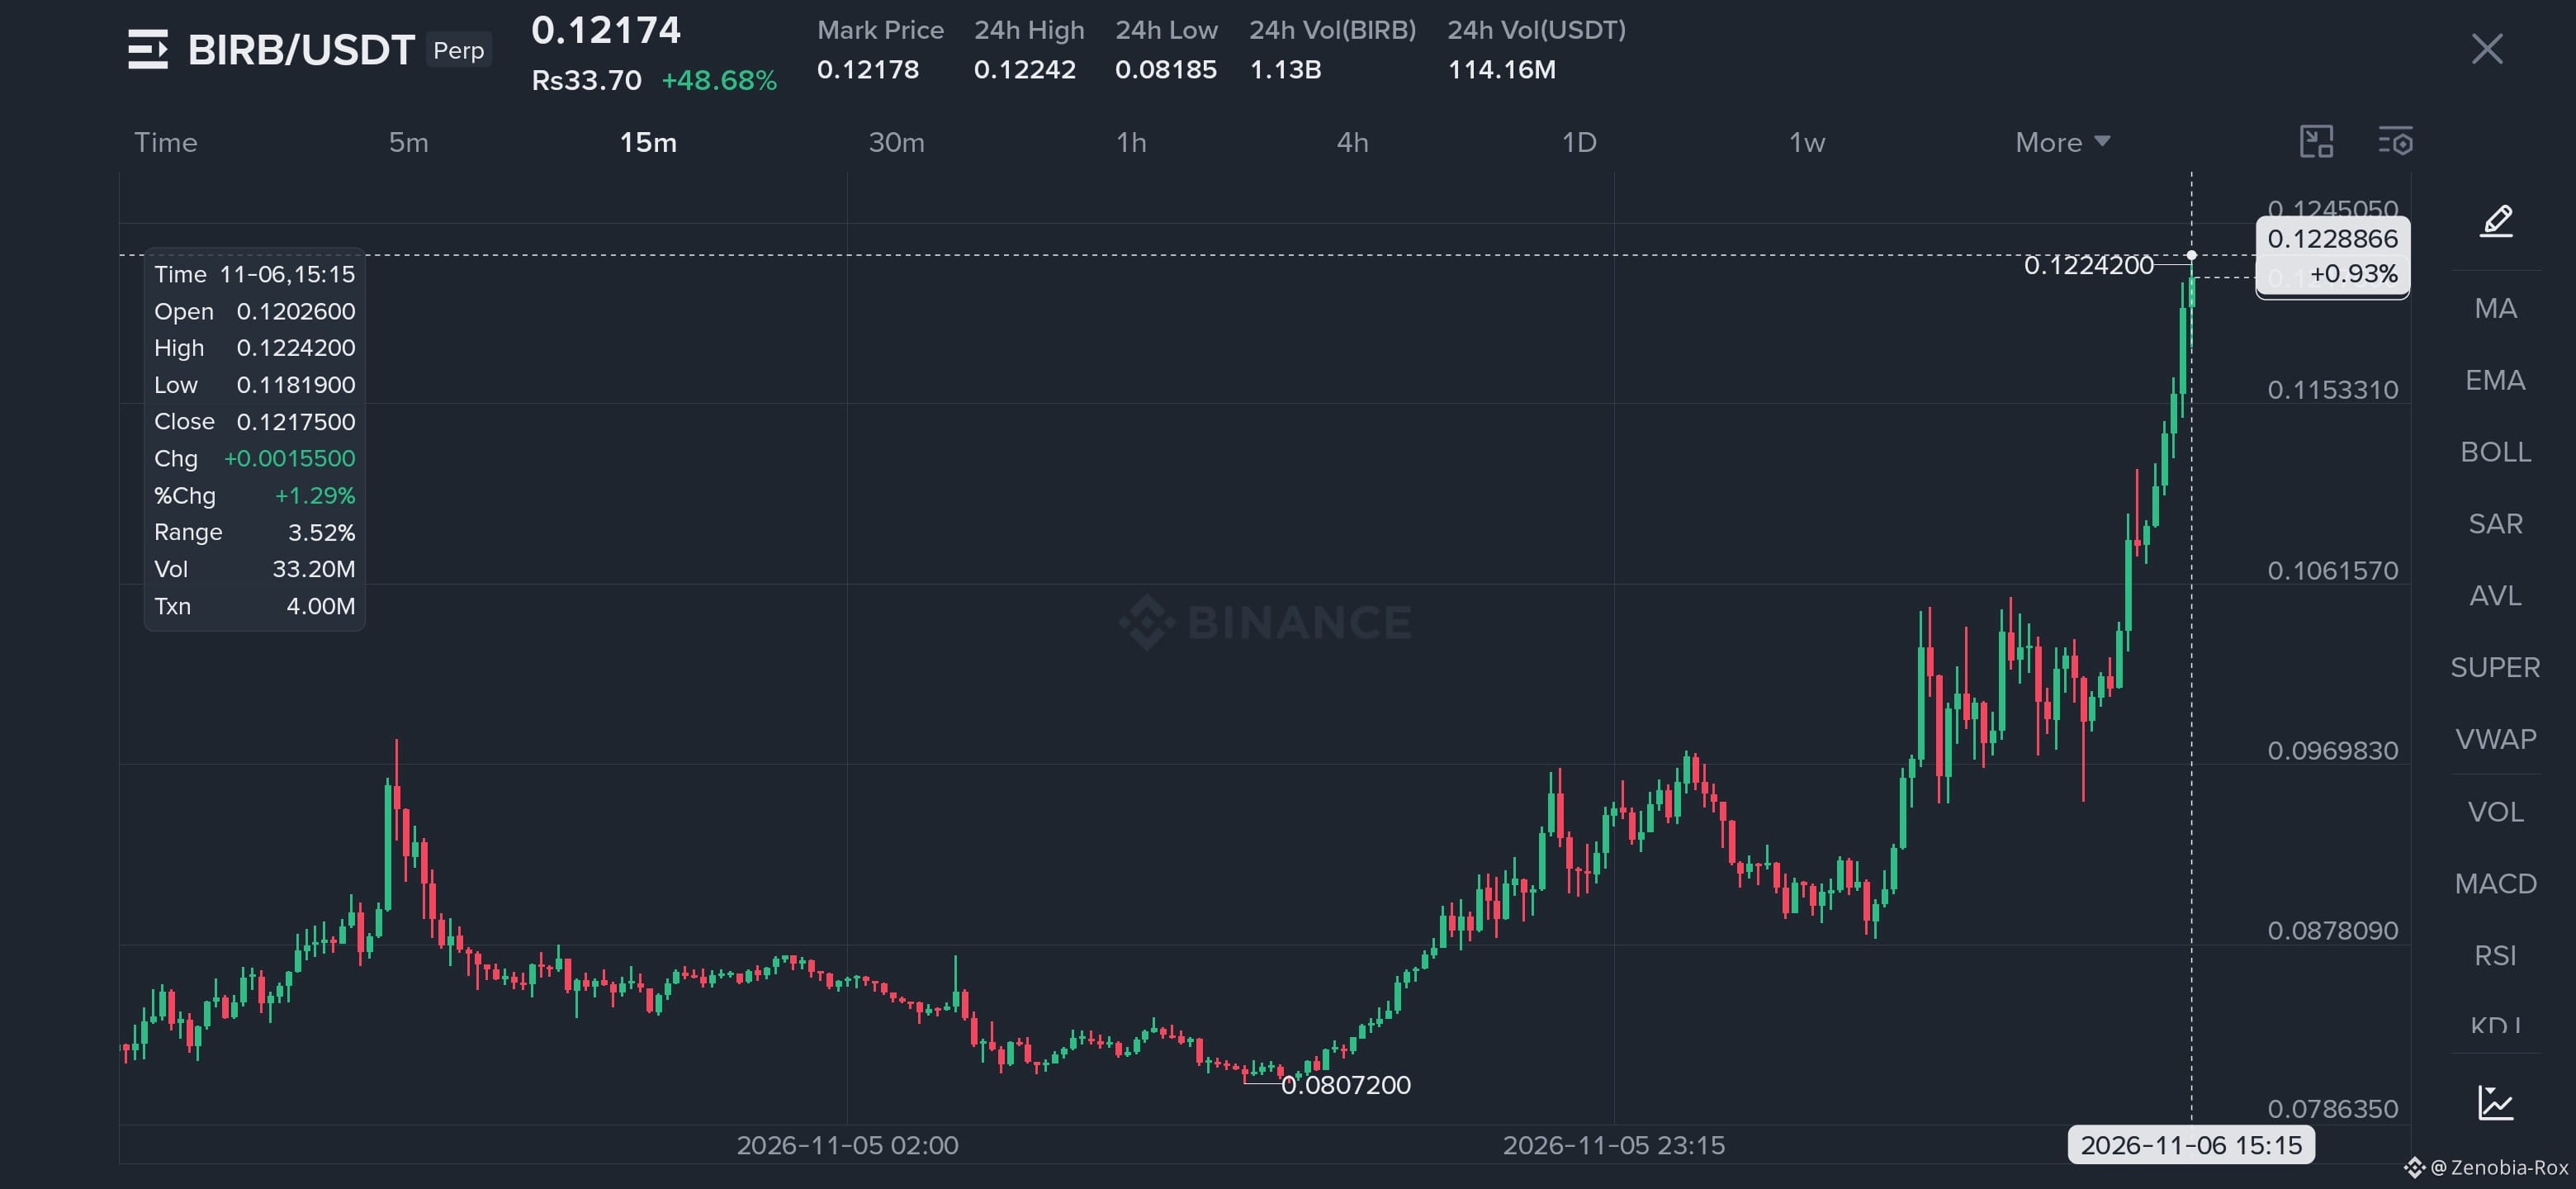
Pair: $BIRBUSDT (Perp)
I'm watching $BIRB right now because this chart is moving fast. It sat in a quiet range near 0.0807, then climbed step by step, and the last leg went almost straight up. Price is sitting near 0.1217, right under the 24h high of 0.1224, with the day up roughly 48%.
I'm not chasing a candle like this. If it pulls back and buyers show up, I'm ready.
**Entry Level**
0.1050 – 0.1065, only after buyers react and hold the zone
**TP1**
0.1153
**TP2**
0.1224 (retest of the current high)
**TP3**
0.1245 (just above the high, if the breakout holds)
**Stop-Loss**
0.0970. A close below it means the breakout structure has failed.
**Disclaimer**
This is not financial advice, just my own chart view. The market can reverse fast, especially after a run like this, and no setup is guaranteed. Always use a stop-loss and size your position for the risk. Do your own research before trading.
*Note: I read these levels from the chart gridlines, so adjust them to your own plan before posting.*
$BIRB – I'm watching this one very closely 👀**
Pair: $BIRBUSDT (Perp)
I'm watching $BIRB right now because this chart is moving fast. It sat in a quiet range near 0.0807, then climbed step by step, and the last leg went almost straight up. Price is sitting near 0.1217, right under the 24h high of 0.1224, with the day up roughly 48%.
I'm not chasing a candle like this. If it pulls back and buyers show up, I'm ready.
**Entry Level**
0.1050 – 0.1065, only after buyers react and hold the zone
**TP1**
0.1153
**TP2**
0.1224 (retest of the current high)
**TP3**
0.1245 (just above the high, if the breakout holds)
**Stop-Loss**
0.0970. A close below it means the breakout structure has failed.
**Disclaimer**
This is not financial advice, just my own chart view. The market can reverse fast, especially after a run like this, and no setup is guaranteed. Always use a stop-loss and size your position for the risk. Do your own research before trading.
*Note: I read these levels from the chart gridlines, so adjust them to your own plan before posting.*
Pair: $BIRBUSDT (Perp)
I'm watching $BIRB right now because this chart is moving fast. It sat in a quiet range near 0.0807, then climbed step by step, and the last leg went almost straight up. Price is sitting near 0.1217, right under the 24h high of 0.1224, with the day up roughly 48%.
I'm not chasing a candle like this. If it pulls back and buyers show up, I'm ready.
**Entry Level**
0.1050 – 0.1065, only after buyers react and hold the zone
**TP1**
0.1153
**TP2**
0.1224 (retest of the current high)
**TP3**
0.1245 (just above the high, if the breakout holds)
**Stop-Loss**
0.0970. A close below it means the breakout structure has failed.
**Disclaimer**
This is not financial advice, just my own chart view. The market can reverse fast, especially after a run like this, and no setup is guaranteed. Always use a stop-loss and size your position for the risk. Do your own research before trading.
*Note: I read these levels from the chart gridlines, so adjust them to your own plan before posting.*
1
450
·
--
Рост
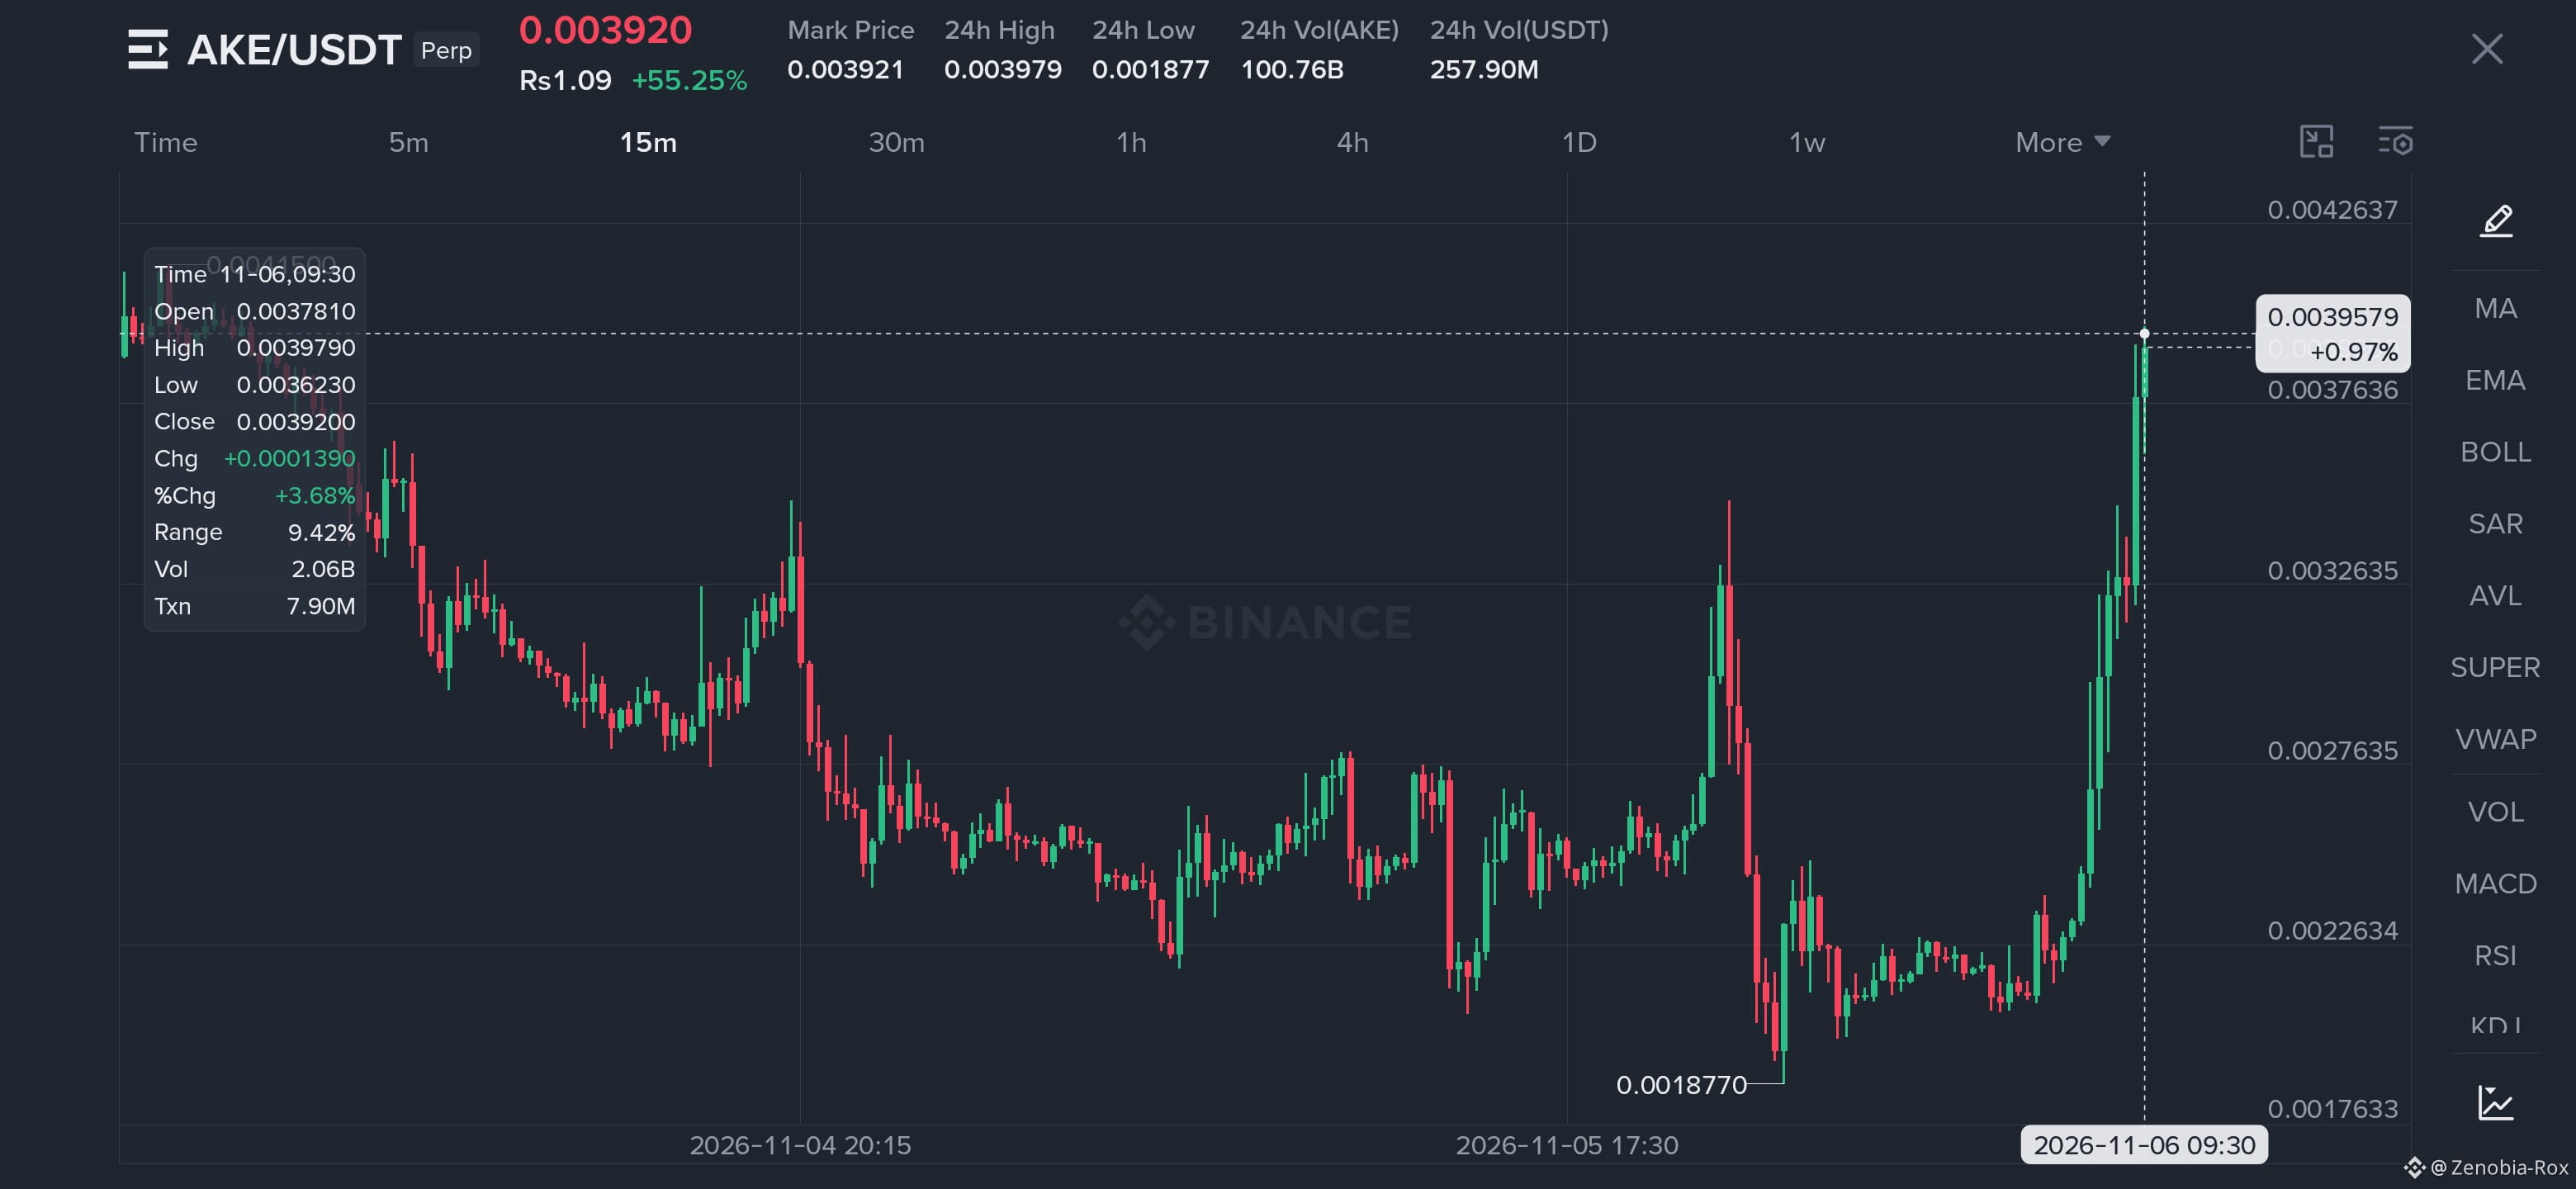
🚀 $AKE /USDT – Bulls Are Making a Serious Statement!
I'm watching $AKE closely because this 15M chart is showing an aggressive bullish breakout. Price has surged over 55%, pushed through the previous resistance zone, and is now testing the $0.00392 area.
Momentum is impressive, but I don't want to chase a vertical candle. A healthy pullback and successful retest could offer a much better opportunity. 👀
Entry Level: $0.00360 – $0.00375
🎯 TP1: $0.00405
🎯 TP2: $0.00425
🎯 TP3: $0.00455
🛑 STOP LOSS: $0.00325
My Take: If $AKE holds above the breakout zone, another bullish leg could develop. However, losing $0.00325 would weaken this setup. Watch volume and avoid FOMO entries.
⚠️ DISCLAIMER: This is a personal technical analysis, not financial advice. Crypto trading carries high risk. Always manage your risk and do your own research.
{future}(AKEUSDT)
🚀 $AKE /USDT – Bulls Are Making a Serious Statement!
I'm watching $AKE closely because this 15M chart is showing an aggressive bullish breakout. Price has surged over 55%, pushed through the previous resistance zone, and is now testing the $0.00392 area.
Momentum is impressive, but I don't want to chase a vertical candle. A healthy pullback and successful retest could offer a much better opportunity. 👀
Entry Level: $0.00360 – $0.00375
🎯 TP1: $0.00405
🎯 TP2: $0.00425
🎯 TP3: $0.00455
🛑 STOP LOSS: $0.00325
My Take: If $AKE holds above the breakout zone, another bullish leg could develop. However, losing $0.00325 would weaken this setup. Watch volume and avoid FOMO entries.
⚠️ DISCLAIMER: This is a personal technical analysis, not financial advice. Crypto trading carries high risk. Always manage your risk and do your own research.
I'm watching $AKE closely because this 15M chart is showing an aggressive bullish breakout. Price has surged over 55%, pushed through the previous resistance zone, and is now testing the $0.00392 area.
Momentum is impressive, but I don't want to chase a vertical candle. A healthy pullback and successful retest could offer a much better opportunity. 👀
Entry Level: $0.00360 – $0.00375
🎯 TP1: $0.00405
🎯 TP2: $0.00425
🎯 TP3: $0.00455
🛑 STOP LOSS: $0.00325
My Take: If $AKE holds above the breakout zone, another bullish leg could develop. However, losing $0.00325 would weaken this setup. Watch volume and avoid FOMO entries.
⚠️ DISCLAIMER: This is a personal technical analysis, not financial advice. Crypto trading carries high risk. Always manage your risk and do your own research.
634
·
--
Рост
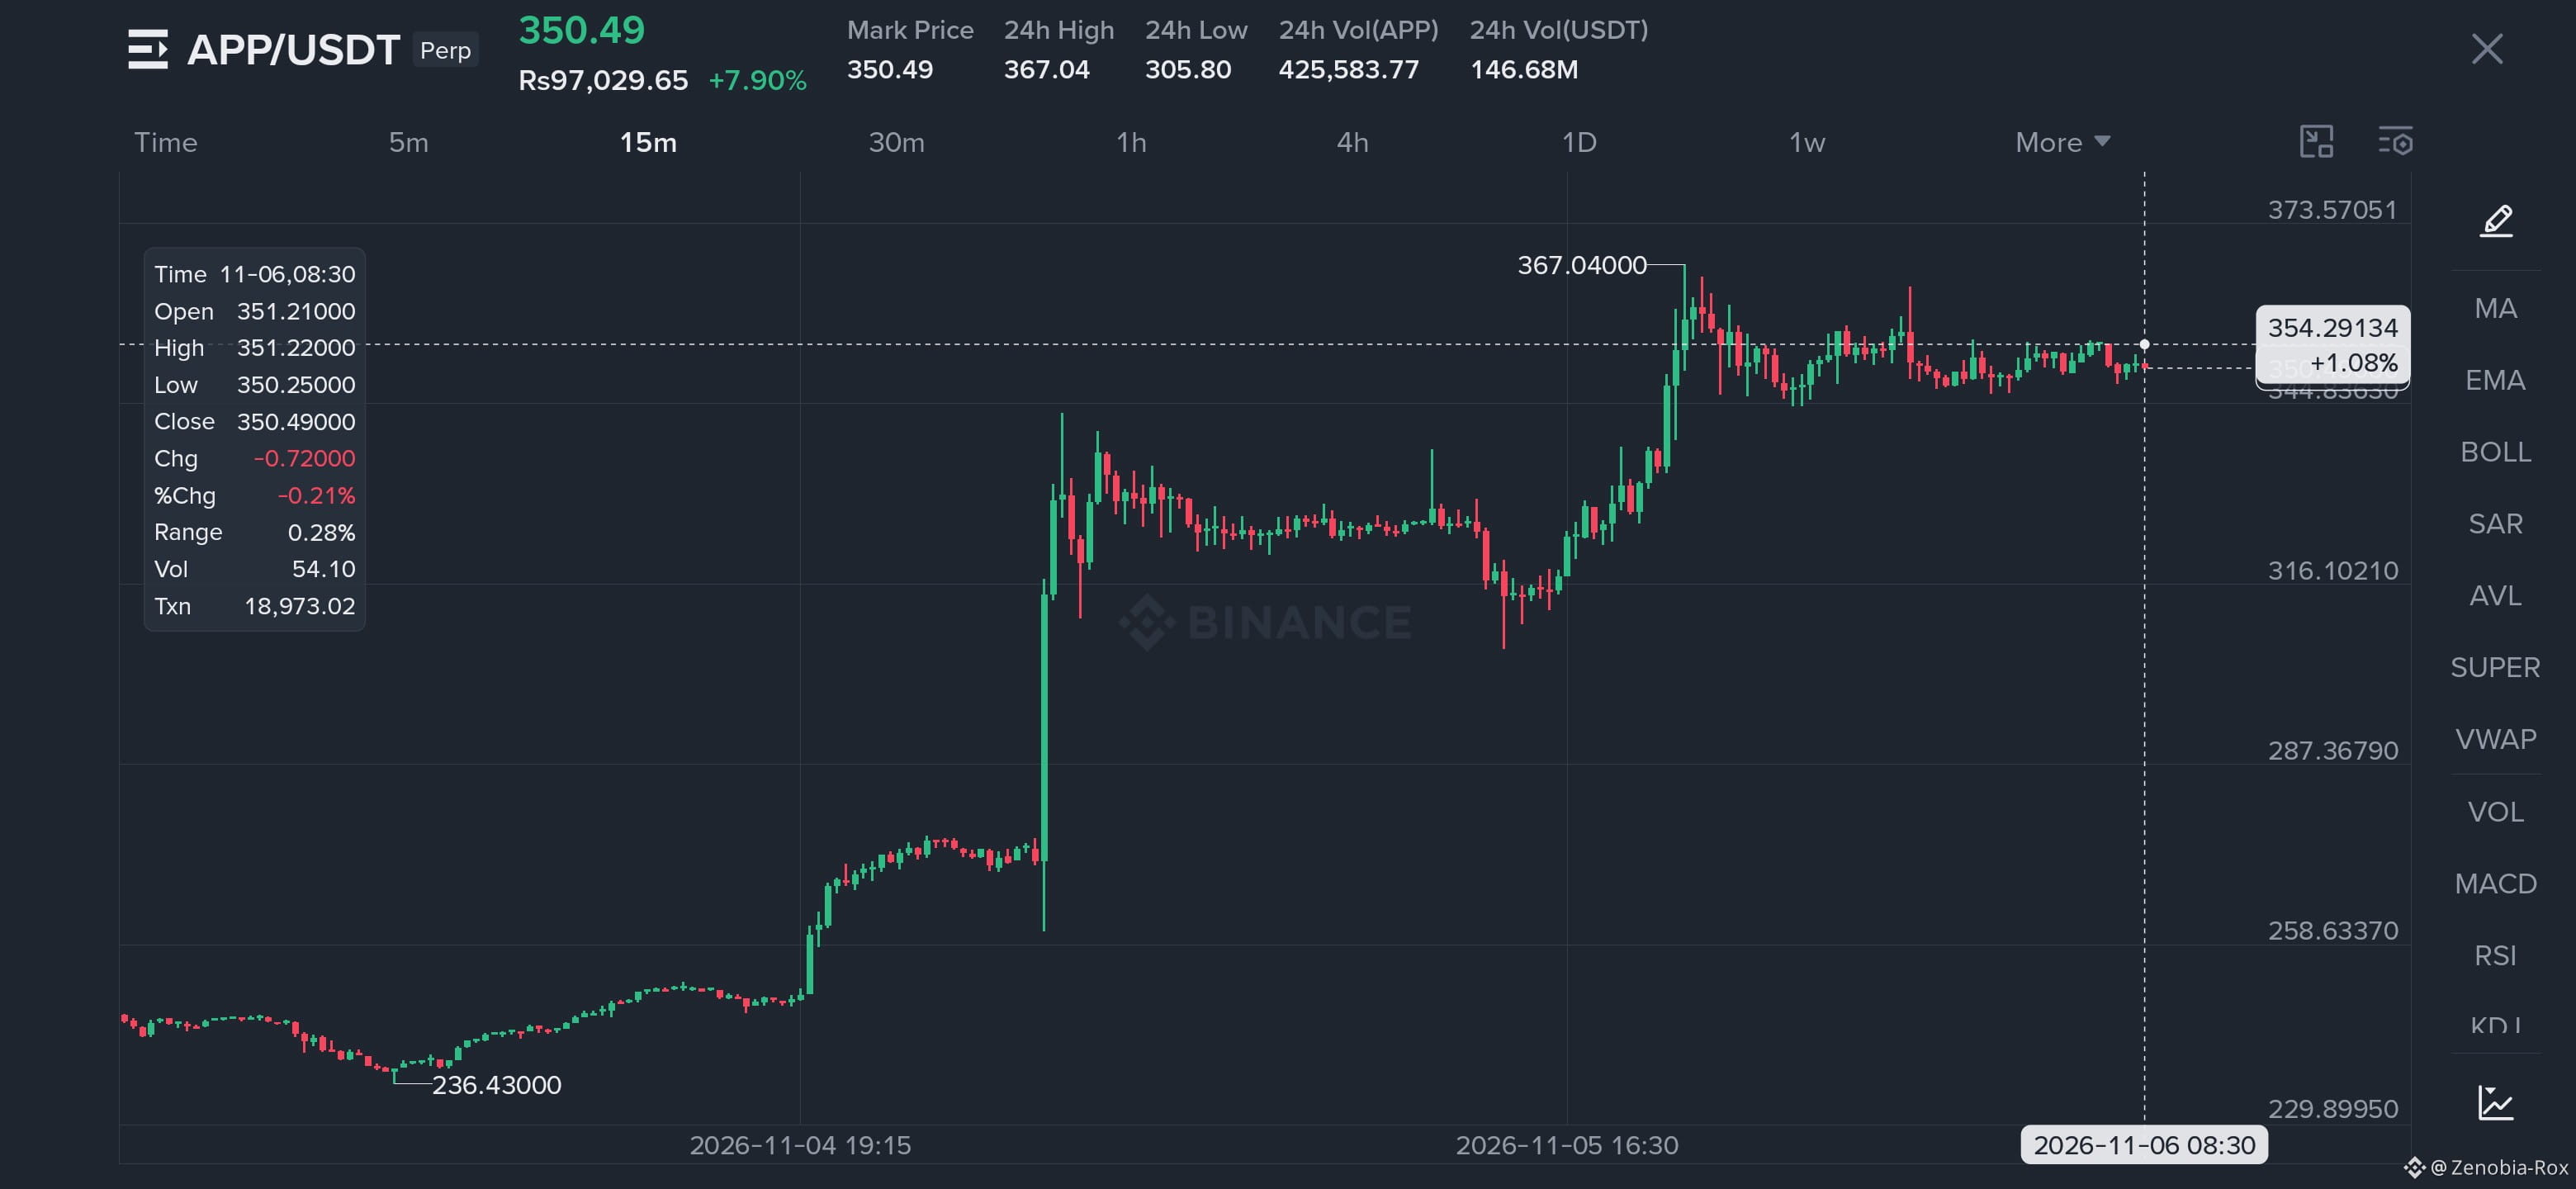
🚀 $APP /USDT – Bulls Are Holding Their Ground!
I'm watching $APP closely because the 15M chart is showing an impressive bullish move. After a strong breakout, price has pushed toward $367 and is now consolidating around $350.49.
What interests me here is whether buyers can defend the current support and prepare for another leg higher. I don't want to chase the pump, but a healthy pullback could offer an interesting opportunity. 👀
📍 Entry Level: $344 – $350
🎯 TP1: $358
🎯 TP2: $367
🎯 TP3: $378
🛑 STOP LOSS: $337
My View: Bullish above $344, but I want to see buyers maintain momentum before expecting another breakout. A rejection near resistance could bring a deeper pullback.
⚠️ DISCLAIMER: This is my personal technical analysis, not financial advice. Crypto trading involves significant risk. Always manage your position size and use proper risk management. Do your own research before entering any trade.
{future}(APPUSDT)
🚀 $APP /USDT – Bulls Are Holding Their Ground!
I'm watching $APP closely because the 15M chart is showing an impressive bullish move. After a strong breakout, price has pushed toward $367 and is now consolidating around $350.49.
What interests me here is whether buyers can defend the current support and prepare for another leg higher. I don't want to chase the pump, but a healthy pullback could offer an interesting opportunity. 👀
📍 Entry Level: $344 – $350
🎯 TP1: $358
🎯 TP2: $367
🎯 TP3: $378
🛑 STOP LOSS: $337
My View: Bullish above $344, but I want to see buyers maintain momentum before expecting another breakout. A rejection near resistance could bring a deeper pullback.
⚠️ DISCLAIMER: This is my personal technical analysis, not financial advice. Crypto trading involves significant risk. Always manage your position size and use proper risk management. Do your own research before entering any trade.
I'm watching $APP closely because the 15M chart is showing an impressive bullish move. After a strong breakout, price has pushed toward $367 and is now consolidating around $350.49.
What interests me here is whether buyers can defend the current support and prepare for another leg higher. I don't want to chase the pump, but a healthy pullback could offer an interesting opportunity. 👀
📍 Entry Level: $344 – $350
🎯 TP1: $358
🎯 TP2: $367
🎯 TP3: $378
🛑 STOP LOSS: $337
My View: Bullish above $344, but I want to see buyers maintain momentum before expecting another breakout. A rejection near resistance could bring a deeper pullback.
⚠️ DISCLAIMER: This is my personal technical analysis, not financial advice. Crypto trading involves significant risk. Always manage your position size and use proper risk management. Do your own research before entering any trade.
1
573
·
--
Рост
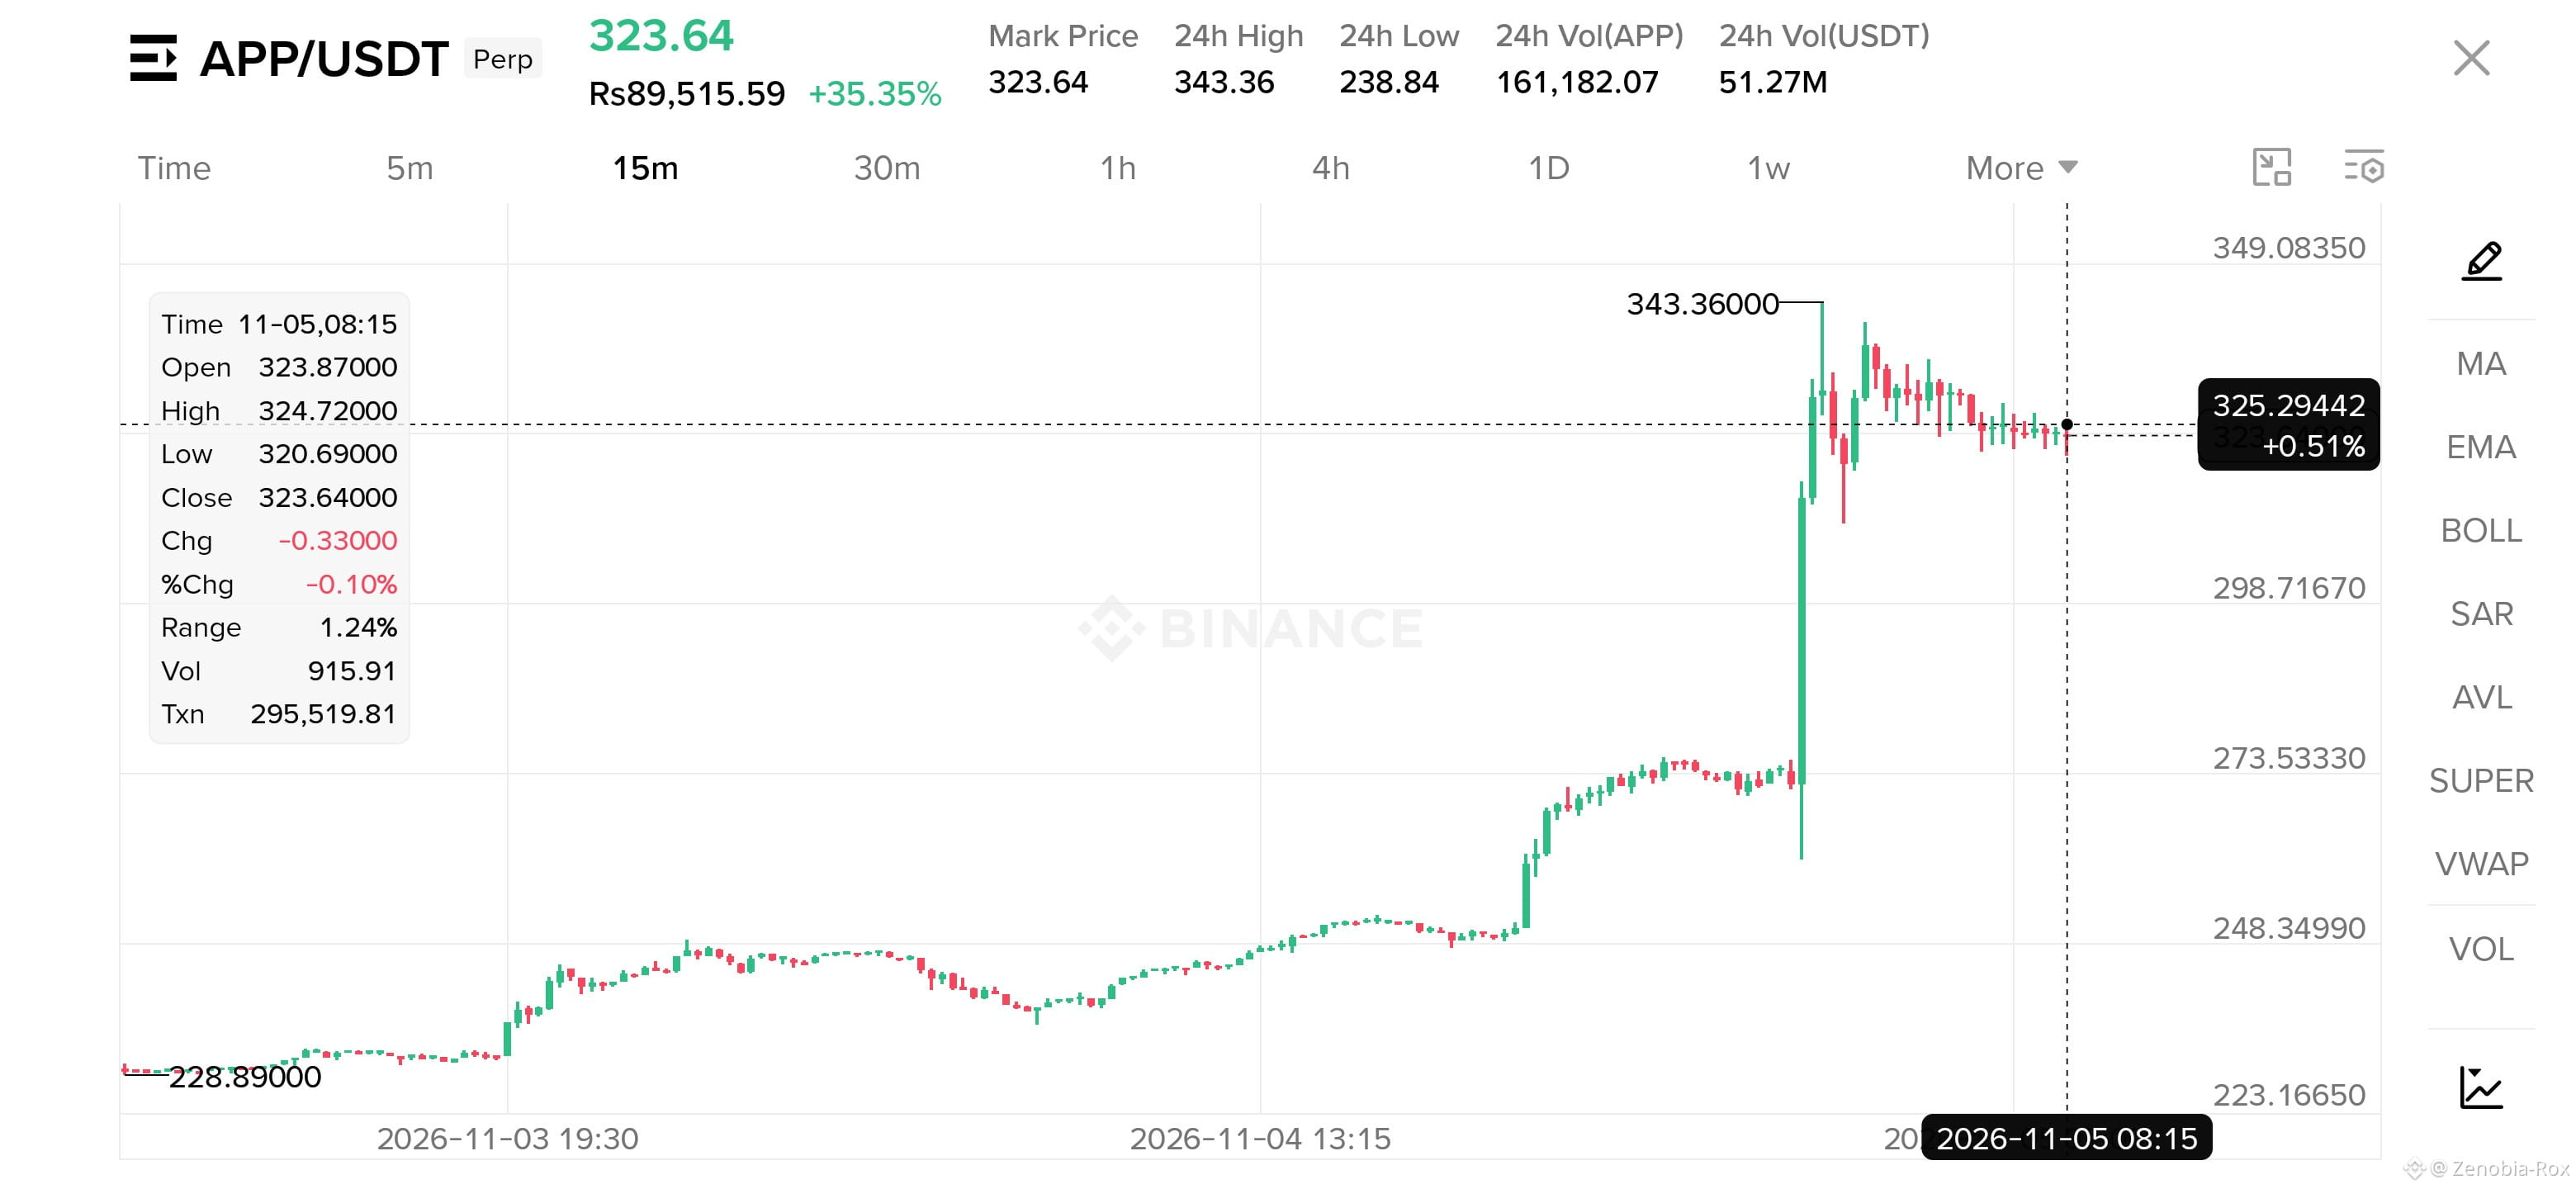
$APP /USDT Perp: Personal Hook, I'm Watching This One Closely**
I'm watching $APP /USDT very closely right now. This chart is wild. 👀
It was quietly grinding up from ~228 and then boom, one massive green candle exploded straight to **343.36**. Now it's cooling off around **323**, still up over **35%** on the day with **51M USDT** in volume. Buyers are clearly not done, but the market is catching its breath. This is exactly the zone where patient traders win.
📍 **Entry Level:** 318 – 324 (wait for a dip or a hold above 320 support)$APP
🎯 **TP1:** 335
🎯 **TP2:** 343 (retest of the recent high)
🎯 **TP3:** 358+ (if momentum breaks out)
🛑 **Stop Loss:** 308 (a close below this and the setup is invalid)
💭 My take: after a vertical pump like this, the smart move is not chasing. I want to see price hold above 320 and build a base. If it does, continuation is on the table. If it loses 308, I'm out, no emotions.
⚠️ **DISCLAIMER:** This is not financial advice. It's just my personal chart view for educational purposes. Crypto and futures trading carry very high risk, especially with leverage. Always do your own research, manage your risk, and never trade money you can't afford to lose.
{future}(APPUSDT)
$APP /USDT Perp: Personal Hook, I'm Watching This One Closely**
I'm watching $APP /USDT very closely right now. This chart is wild. 👀
It was quietly grinding up from ~228 and then boom, one massive green candle exploded straight to **343.36**. Now it's cooling off around **323**, still up over **35%** on the day with **51M USDT** in volume. Buyers are clearly not done, but the market is catching its breath. This is exactly the zone where patient traders win.
📍 **Entry Level:** 318 – 324 (wait for a dip or a hold above 320 support)$APP
🎯 **TP1:** 335
🎯 **TP2:** 343 (retest of the recent high)
🎯 **TP3:** 358+ (if momentum breaks out)
🛑 **Stop Loss:** 308 (a close below this and the setup is invalid)
💭 My take: after a vertical pump like this, the smart move is not chasing. I want to see price hold above 320 and build a base. If it does, continuation is on the table. If it loses 308, I'm out, no emotions.
⚠️ **DISCLAIMER:** This is not financial advice. It's just my personal chart view for educational purposes. Crypto and futures trading carry very high risk, especially with leverage. Always do your own research, manage your risk, and never trade money you can't afford to lose.
I'm watching $APP /USDT very closely right now. This chart is wild. 👀
It was quietly grinding up from ~228 and then boom, one massive green candle exploded straight to **343.36**. Now it's cooling off around **323**, still up over **35%** on the day with **51M USDT** in volume. Buyers are clearly not done, but the market is catching its breath. This is exactly the zone where patient traders win.
📍 **Entry Level:** 318 – 324 (wait for a dip or a hold above 320 support)$APP
🎯 **TP1:** 335
🎯 **TP2:** 343 (retest of the recent high)
🎯 **TP3:** 358+ (if momentum breaks out)
🛑 **Stop Loss:** 308 (a close below this and the setup is invalid)
💭 My take: after a vertical pump like this, the smart move is not chasing. I want to see price hold above 320 and build a base. If it does, continuation is on the table. If it loses 308, I'm out, no emotions.
⚠️ **DISCLAIMER:** This is not financial advice. It's just my personal chart view for educational purposes. Crypto and futures trading carry very high risk, especially with leverage. Always do your own research, manage your risk, and never trade money you can't afford to lose.
1
249
·
--
Рост
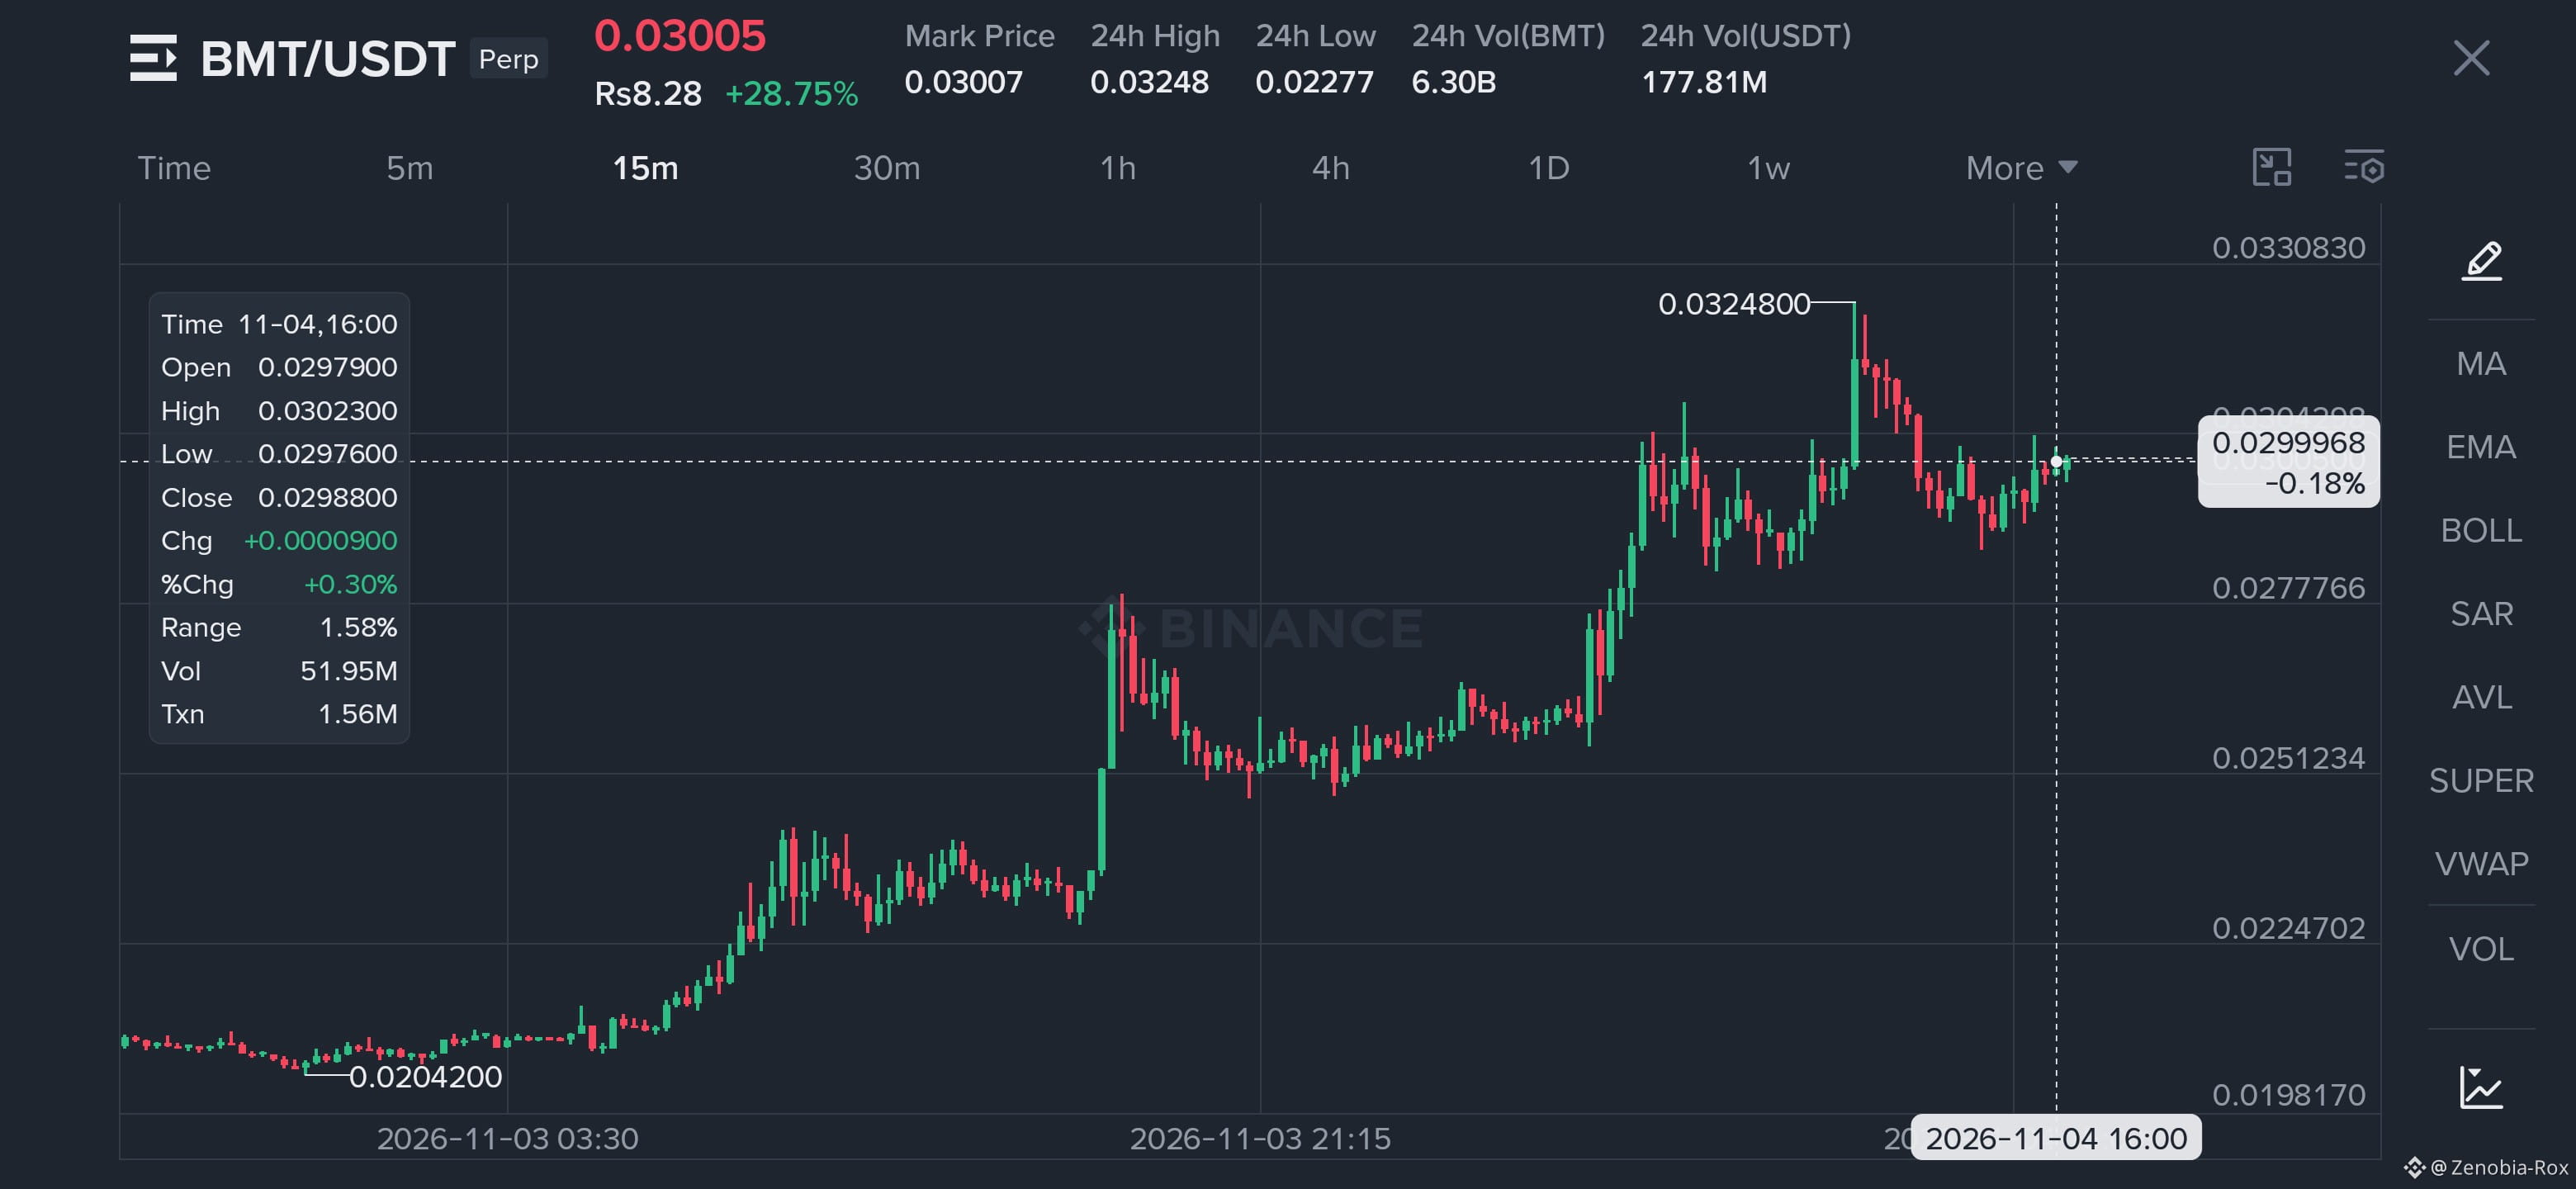
👀 **Personal hook: I'm watching $BMT like a hawk right now.**
It ripped +28% in 24h, tagged 0.03248, then pulled back and has been quietly building a base around 0.0299. Bulls are holding the line, and this is the kind of calm before a move that I don't like to ignore. 🔥
📊 **$BMT /USDT Perp (15m): Long Setup**
🎯 **Entry:** 0.0296 – 0.0300
(Ideally on a dip, or on a clean 15m close above 0.0305)
✅ **TP1:** 0.0306
✅ **TP2:** 0.0316
🚀 **TP3:** 0.0325+ (retest of the 24h high, and a breakout above it opens the door higher)
🛑 **Stop Loss:** 0.0288
(Below the pullback lows. If it breaks, the idea is invalid, and I'm out with no emotions.)
💡 Once TP1 hits, I'll move my stop to breakeven and let the rest run.
⚠️ **DISCLAIMER:** This is only my personal view, not financial advice. Crypto futures are highly volatile and leverage can wipe out your account fast. Use low leverage, size your position carefully, never risk more than you can afford to lose, and always do your own research (DYOR).
{spot}(BMTUSDT)
#BMT #crypto #Binance #FuturesTrading
👀 **Personal hook: I'm watching $BMT like a hawk right now.**
It ripped +28% in 24h, tagged 0.03248, then pulled back and has been quietly building a base around 0.0299. Bulls are holding the line, and this is the kind of calm before a move that I don't like to ignore. 🔥
📊 **$BMT /USDT Perp (15m): Long Setup**
🎯 **Entry:** 0.0296 – 0.0300
(Ideally on a dip, or on a clean 15m close above 0.0305)
✅ **TP1:** 0.0306
✅ **TP2:** 0.0316
🚀 **TP3:** 0.0325+ (retest of the 24h high, and a breakout above it opens the door higher)
🛑 **Stop Loss:** 0.0288
(Below the pullback lows. If it breaks, the idea is invalid, and I'm out with no emotions.)
💡 Once TP1 hits, I'll move my stop to breakeven and let the rest run.
⚠️ **DISCLAIMER:** This is only my personal view, not financial advice. Crypto futures are highly volatile and leverage can wipe out your account fast. Use low leverage, size your position carefully, never risk more than you can afford to lose, and always do your own research (DYOR).
#BMT #crypto #Binance #FuturesTrading
It ripped +28% in 24h, tagged 0.03248, then pulled back and has been quietly building a base around 0.0299. Bulls are holding the line, and this is the kind of calm before a move that I don't like to ignore. 🔥
📊 **$BMT /USDT Perp (15m): Long Setup**
🎯 **Entry:** 0.0296 – 0.0300
(Ideally on a dip, or on a clean 15m close above 0.0305)
✅ **TP1:** 0.0306
✅ **TP2:** 0.0316
🚀 **TP3:** 0.0325+ (retest of the 24h high, and a breakout above it opens the door higher)
🛑 **Stop Loss:** 0.0288
(Below the pullback lows. If it breaks, the idea is invalid, and I'm out with no emotions.)
💡 Once TP1 hits, I'll move my stop to breakeven and let the rest run.
⚠️ **DISCLAIMER:** This is only my personal view, not financial advice. Crypto futures are highly volatile and leverage can wipe out your account fast. Use low leverage, size your position carefully, never risk more than you can afford to lose, and always do your own research (DYOR).
#BMT #crypto #Binance #FuturesTrading
1
430
·
--
Рост
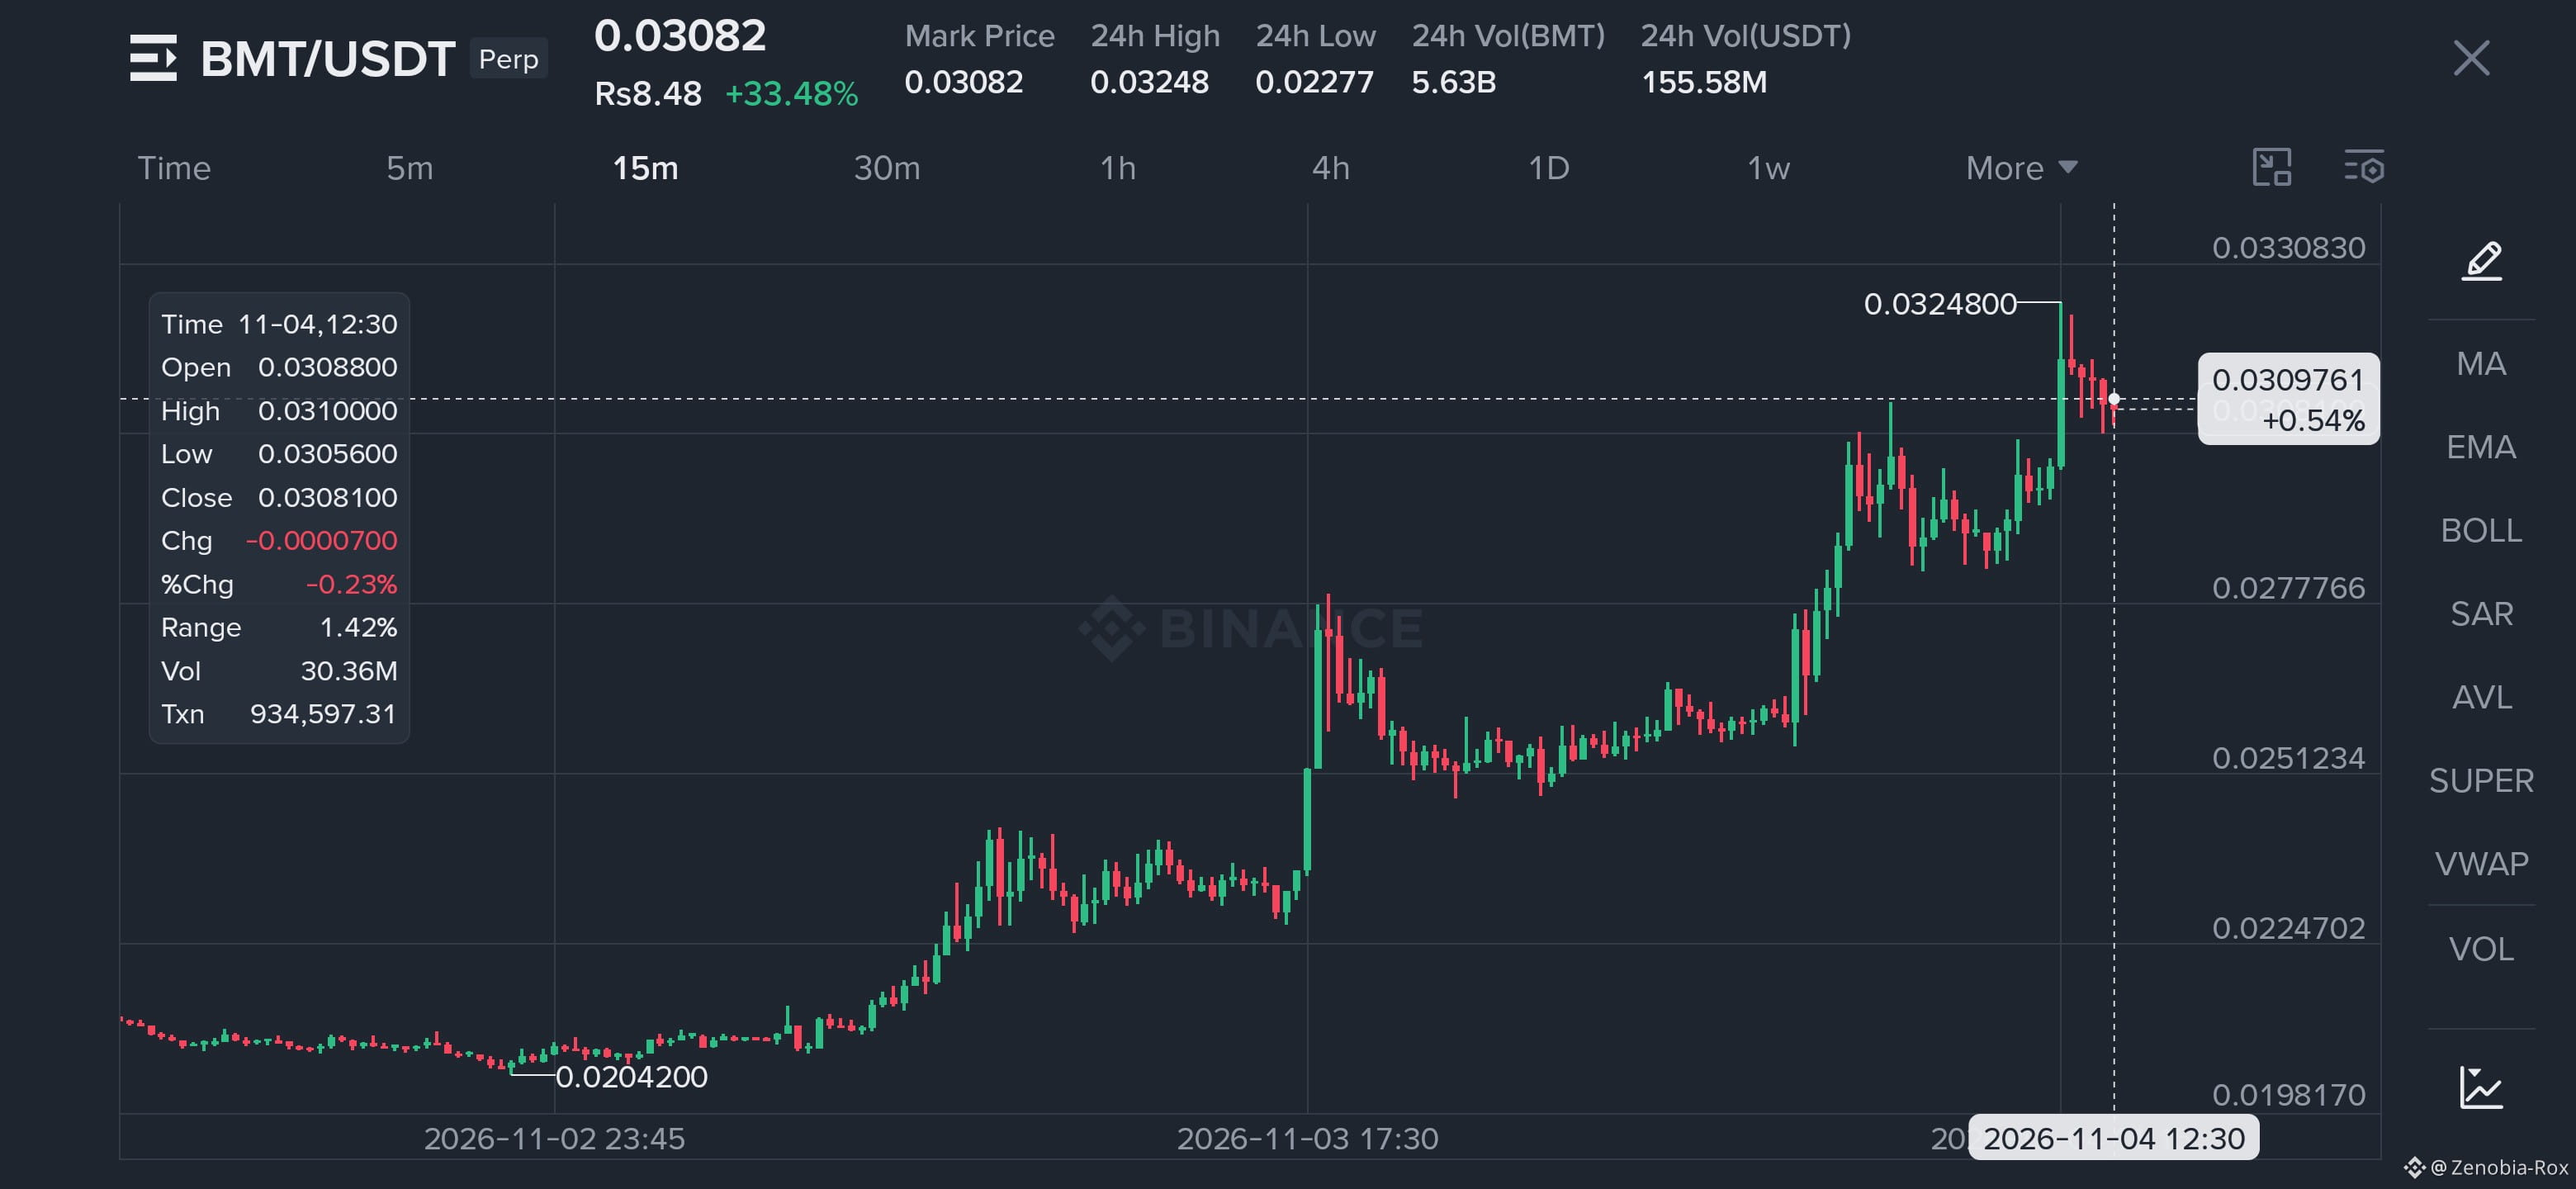
🔥 $BMT /USDT – Bulls Are Still In Control!
I'm watching $BMT closely because this chart is showing some serious momentum. Price has climbed more than 33% in 24 hours, breaking out from its previous consolidation zone and reaching a high near $0.03248.
Now we're seeing a small cooldown around $0.0308. I don't want to chase the green candles blindly. A healthy pullback followed by renewed buying pressure could create another interesting opportunity. 👀
The key is whether buyers can defend the breakout structure and push toward a fresh high.
🎯 Entry Level: $0.0298 – $0.0305
🥇 TP1: $0.0318
🥈 TP2: $0.0325
🥉 TP3: $0.0340
🛑 STOP LOSS: $0.0288
DISCLAIMER: This is a technical trading setup based on the visible 15-minute chart, not guaranteed financial advice. Wait for confirmation, manage your risk, and never enter with more than you can afford to lose.
{spot}(BMTUSDT)
#BMT #BMTUSDT #Binance #cryptotrading #altcoins
🔥 $BMT /USDT – Bulls Are Still In Control!
I'm watching $BMT closely because this chart is showing some serious momentum. Price has climbed more than 33% in 24 hours, breaking out from its previous consolidation zone and reaching a high near $0.03248.
Now we're seeing a small cooldown around $0.0308. I don't want to chase the green candles blindly. A healthy pullback followed by renewed buying pressure could create another interesting opportunity. 👀
The key is whether buyers can defend the breakout structure and push toward a fresh high.
🎯 Entry Level: $0.0298 – $0.0305
🥇 TP1: $0.0318
🥈 TP2: $0.0325
🥉 TP3: $0.0340
🛑 STOP LOSS: $0.0288
DISCLAIMER: This is a technical trading setup based on the visible 15-minute chart, not guaranteed financial advice. Wait for confirmation, manage your risk, and never enter with more than you can afford to lose.
#BMT #BMTUSDT #Binance #cryptotrading #altcoins
I'm watching $BMT closely because this chart is showing some serious momentum. Price has climbed more than 33% in 24 hours, breaking out from its previous consolidation zone and reaching a high near $0.03248.
Now we're seeing a small cooldown around $0.0308. I don't want to chase the green candles blindly. A healthy pullback followed by renewed buying pressure could create another interesting opportunity. 👀
The key is whether buyers can defend the breakout structure and push toward a fresh high.
🎯 Entry Level: $0.0298 – $0.0305
🥇 TP1: $0.0318
🥈 TP2: $0.0325
🥉 TP3: $0.0340
🛑 STOP LOSS: $0.0288
DISCLAIMER: This is a technical trading setup based on the visible 15-minute chart, not guaranteed financial advice. Wait for confirmation, manage your risk, and never enter with more than you can afford to lose.
#BMT #BMTUSDT #Binance #cryptotrading #altcoins
1
412
·
--
Рост
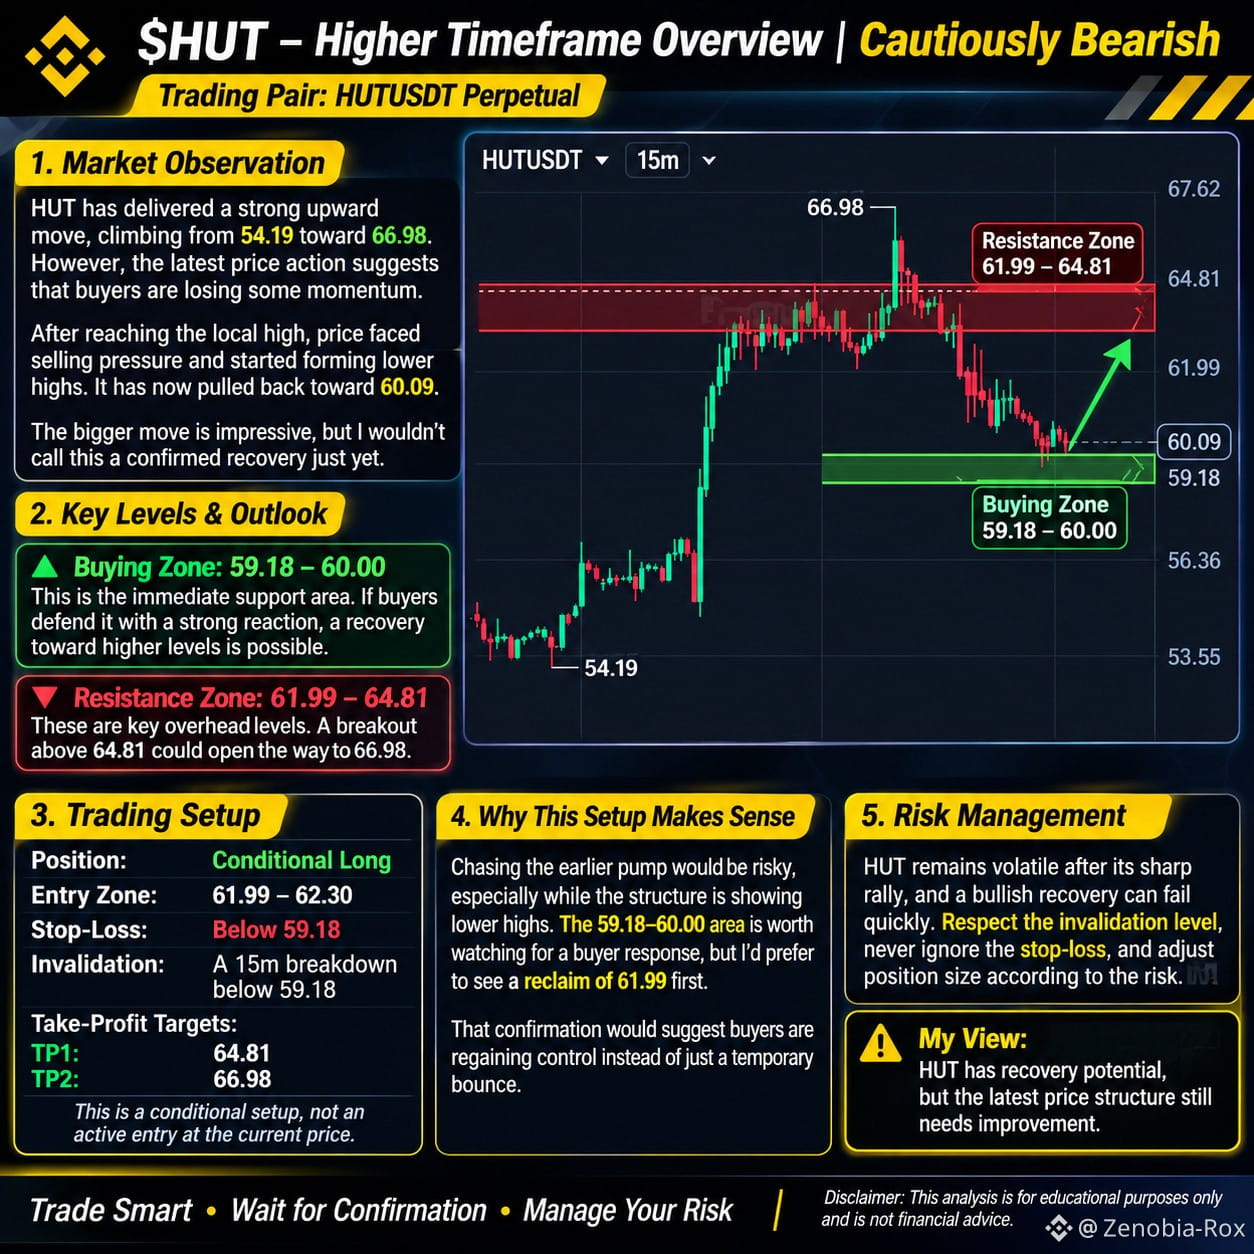
$HUT – Higher Timeframe Overview | Cautiously Bearish
Trading Pair: HUTUSDT Perpetual
Current Price: 60.09 USDT 24H Change: +9.31% 24H High: 66.98 24H Low: 54.19 Chart Timeframe: 15M
### 1\. Natural Market Observation
HUT has delivered a strong upward move, climbing from the 54.19 region toward 66.98. However, the latest price action suggests that buyers are losing some momentum.
After reaching the local high, price faced clear selling pressure and started forming lower highs and lower lows. It has now pulled back toward 60.09.
The bigger intraday move is still impressive, but I wouldn't call this a confirmed recovery just yet. The market needs to show that buyers can defend support and reclaim important resistance levels.
### 2\. Current Outlook and Key Levels
Buying Zone: 59.18 – 60.00
This is the immediate support area worth monitoring. Price is approaching the 59.18 level after a series of lower highs.
If buyers defend this region and produce a convincing bullish reaction, a recovery toward the previous resistance levels becomes possible.
However, a support touch alone is not a buy signal. I would prefer to see a strong 15-minute recovery candle and follow-through.
Resistance Zone: 61.99 – 64.81
This is the important overhead supply area.
The 61.99 region represents the first meaningful recovery hurdle, while 64.81 is a stronger resistance reference from the recent price structure.
A sustained reclaim above 61.99 would improve the short-term outlook. A breakout and consolidation above 64.81 could open the way toward the previous high of 66.98.
### 3\. Trading Setup
Position: Conditional Long – Only After Confirmation
Entry Zone: 61.99 – 62.30 (after a confirmed reclaim and successful retest)
Stop-Loss: Below 59.18
Invalidation: A decisive 15-minute breakdown below 59.18 would invalidate the bullish recovery setup and increase the risk of further downside.
Take-Profit Targets:
* TP1: 64.81
* TP2: 66.98
* TP3: No additional target confirmed by the supplied chart.
{future}(HUTUSDT)
$HUT – Higher Timeframe Overview | Cautiously Bearish
Trading Pair: HUTUSDT Perpetual
Current Price: 60.09 USDT 24H Change: +9.31% 24H High: 66.98 24H Low: 54.19 Chart Timeframe: 15M
### 1\. Natural Market Observation
HUT has delivered a strong upward move, climbing from the 54.19 region toward 66.98. However, the latest price action suggests that buyers are losing some momentum.
After reaching the local high, price faced clear selling pressure and started forming lower highs and lower lows. It has now pulled back toward 60.09.
The bigger intraday move is still impressive, but I wouldn't call this a confirmed recovery just yet. The market needs to show that buyers can defend support and reclaim important resistance levels.
### 2\. Current Outlook and Key Levels
Buying Zone: 59.18 – 60.00
This is the immediate support area worth monitoring. Price is approaching the 59.18 level after a series of lower highs.
If buyers defend this region and produce a convincing bullish reaction, a recovery toward the previous resistance levels becomes possible.
However, a support touch alone is not a buy signal. I would prefer to see a strong 15-minute recovery candle and follow-through.
Resistance Zone: 61.99 – 64.81
This is the important overhead supply area.
The 61.99 region represents the first meaningful recovery hurdle, while 64.81 is a stronger resistance reference from the recent price structure.
A sustained reclaim above 61.99 would improve the short-term outlook. A breakout and consolidation above 64.81 could open the way toward the previous high of 66.98.
### 3\. Trading Setup
Position: Conditional Long – Only After Confirmation
Entry Zone: 61.99 – 62.30 (after a confirmed reclaim and successful retest)
Stop-Loss: Below 59.18
Invalidation: A decisive 15-minute breakdown below 59.18 would invalidate the bullish recovery setup and increase the risk of further downside.
Take-Profit Targets:
* TP1: 64.81
* TP2: 66.98
* TP3: No additional target confirmed by the supplied chart.
Trading Pair: HUTUSDT Perpetual
Current Price: 60.09 USDT 24H Change: +9.31% 24H High: 66.98 24H Low: 54.19 Chart Timeframe: 15M
### 1\. Natural Market Observation
HUT has delivered a strong upward move, climbing from the 54.19 region toward 66.98. However, the latest price action suggests that buyers are losing some momentum.
After reaching the local high, price faced clear selling pressure and started forming lower highs and lower lows. It has now pulled back toward 60.09.
The bigger intraday move is still impressive, but I wouldn't call this a confirmed recovery just yet. The market needs to show that buyers can defend support and reclaim important resistance levels.
### 2\. Current Outlook and Key Levels
Buying Zone: 59.18 – 60.00
This is the immediate support area worth monitoring. Price is approaching the 59.18 level after a series of lower highs.
If buyers defend this region and produce a convincing bullish reaction, a recovery toward the previous resistance levels becomes possible.
However, a support touch alone is not a buy signal. I would prefer to see a strong 15-minute recovery candle and follow-through.
Resistance Zone: 61.99 – 64.81
This is the important overhead supply area.
The 61.99 region represents the first meaningful recovery hurdle, while 64.81 is a stronger resistance reference from the recent price structure.
A sustained reclaim above 61.99 would improve the short-term outlook. A breakout and consolidation above 64.81 could open the way toward the previous high of 66.98.
### 3\. Trading Setup
Position: Conditional Long – Only After Confirmation
Entry Zone: 61.99 – 62.30 (after a confirmed reclaim and successful retest)
Stop-Loss: Below 59.18
Invalidation: A decisive 15-minute breakdown below 59.18 would invalidate the bullish recovery setup and increase the risk of further downside.
Take-Profit Targets:
* TP1: 64.81
* TP2: 66.98
* TP3: No additional target confirmed by the supplied chart.
2
447
·
--
Рост
**🔥 $BMT /USDT Perp: I'm Watching This One Closely 🔥**
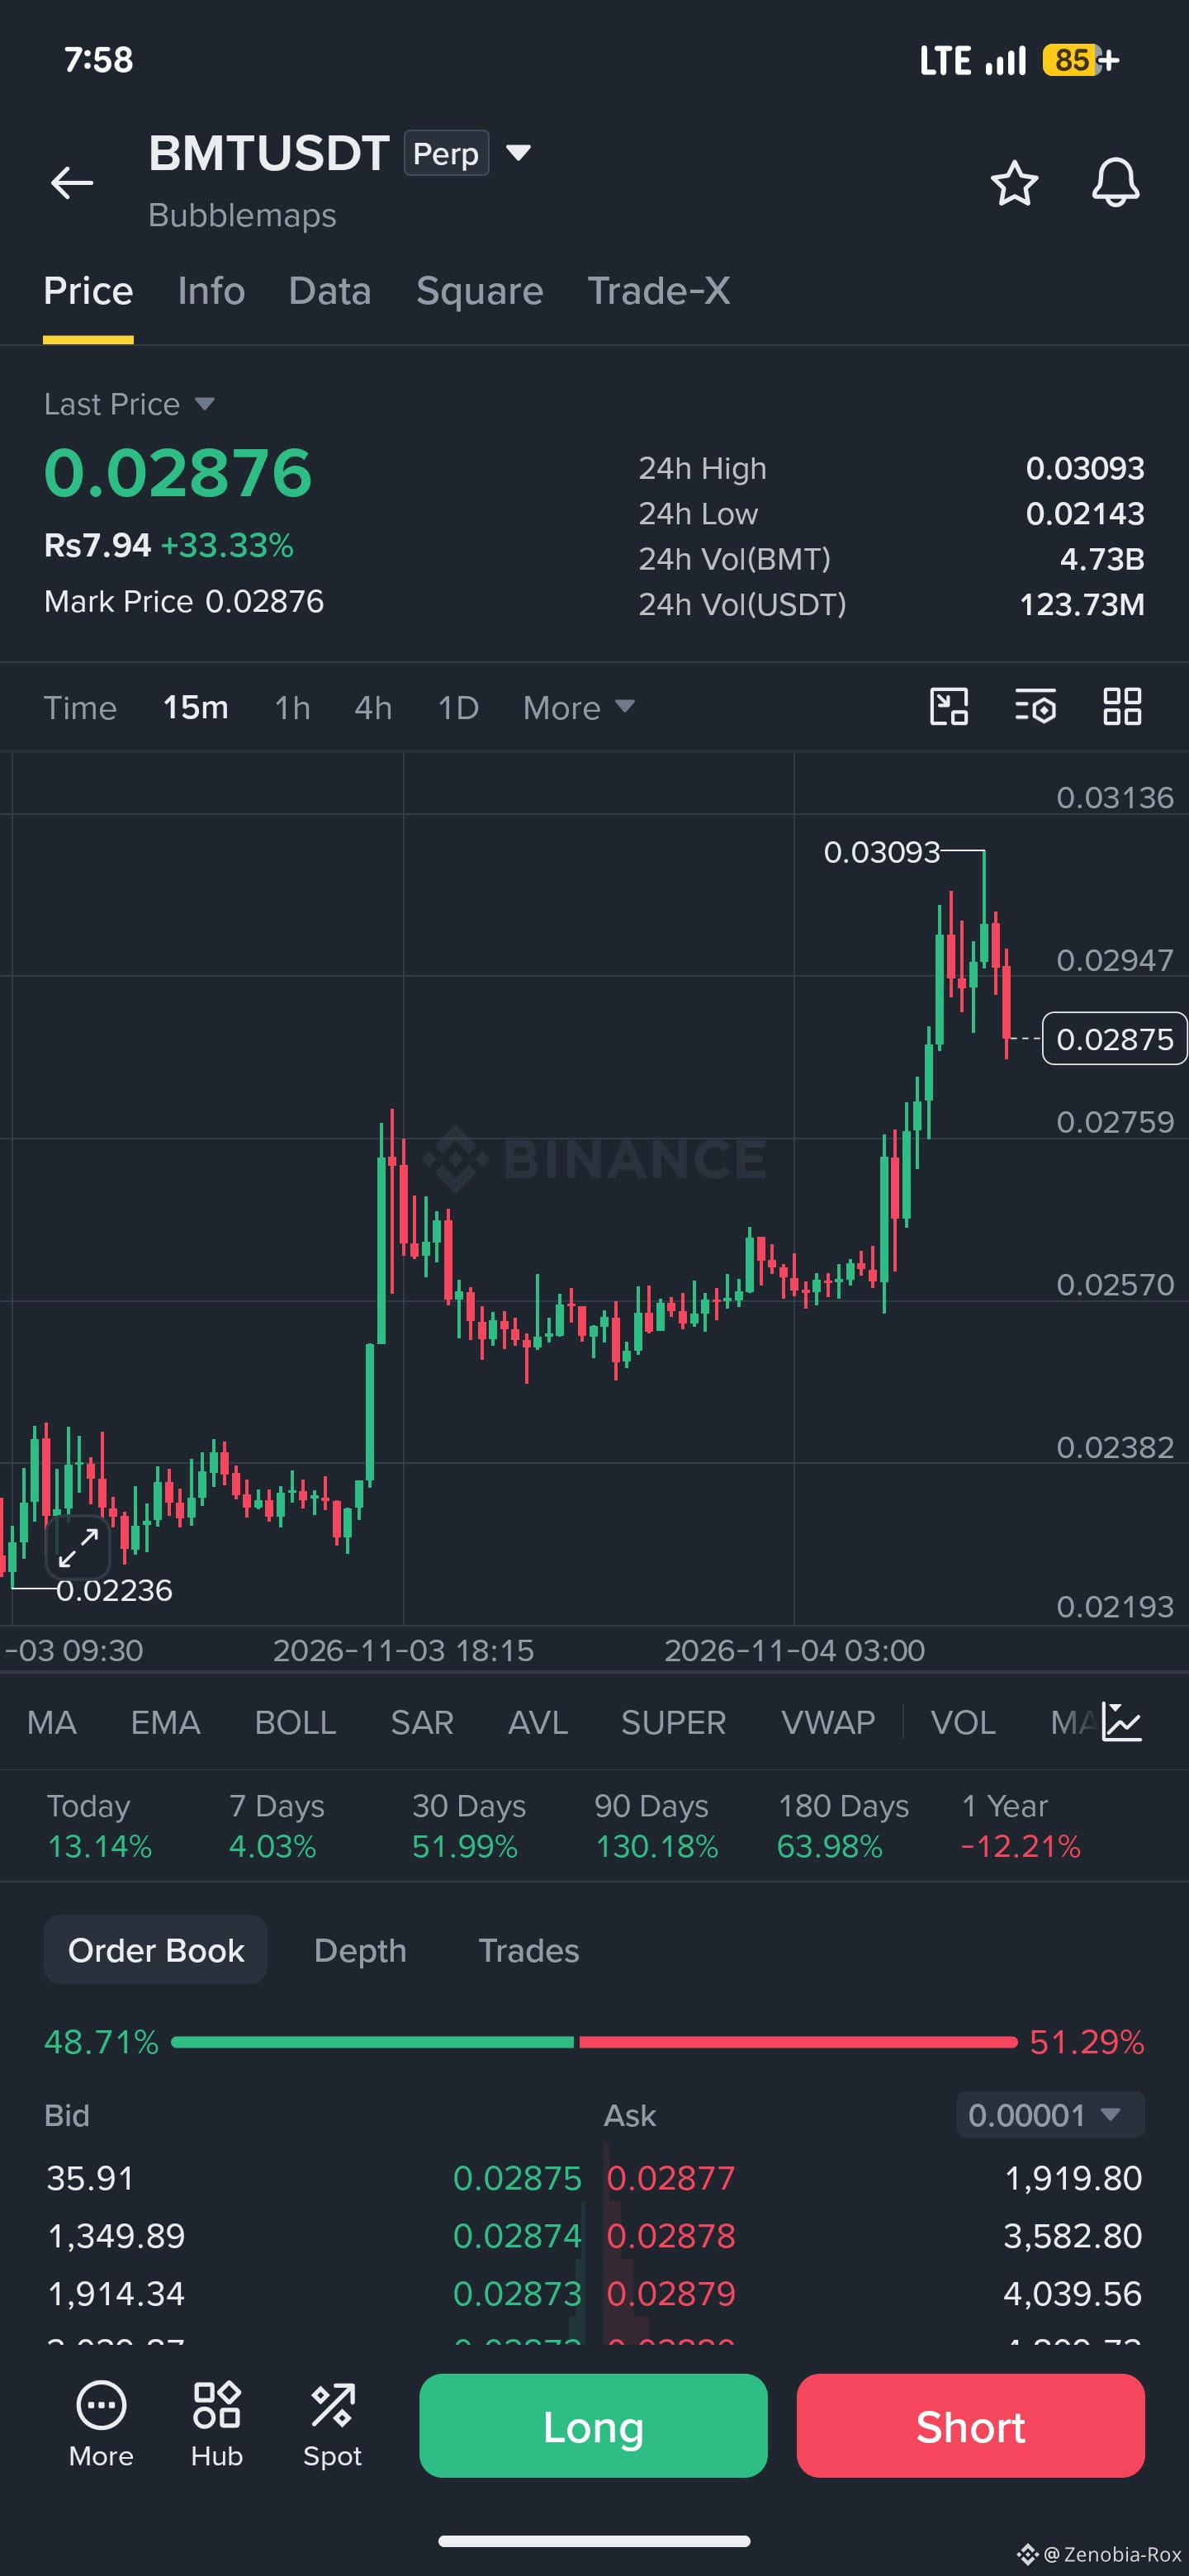
Personal hok: I'm watching **$BMT (Bubblemaps)** right now, and honestly, this chart has my attention. Price jumped from the 0.0214 zone to a high of 0.03093, up +33% on the day, with 123M USDT in volume. After that spike it's cooling off in a small pullback. Bulls and bears are both awake. Let's see who blinks first. 👀
📍 **Entry Level:** 0.02830 – 0.02875 (on a dip or retest of this zone)
🎯 **TP1:** 0.03000
🎯 **TP2:** 0.03093 (24h high, a key breakout test)
🎯 **TP3:** 0.03300+ (if momentum and volume stay strong)
🛑 **Stop Loss:** 0.02690 (below the recent support; a close under this and the setup is dead)
⚡ Keep leverage low, size small, and don't chase green candles. Patience pays.
⚠️ **DISCLAIMER:** This is not financial advice. It's just my personal chart view, shared for educational purposes. Crypto futures are highly volatile and risky, and you can lose your whole capital. Always do your own research (DYOR) and only trade what you can afford to lose.
{spot}(BMTUSDT)
#BMT #Bubblemaps #Binance #cryptotrading #futures
**🔥 $BMT /USDT Perp: I'm Watching This One Closely 🔥**
Personal hok: I'm watching **$BMT (Bubblemaps)** right now, and honestly, this chart has my attention. Price jumped from the 0.0214 zone to a high of 0.03093, up +33% on the day, with 123M USDT in volume. After that spike it's cooling off in a small pullback. Bulls and bears are both awake. Let's see who blinks first. 👀
📍 **Entry Level:** 0.02830 – 0.02875 (on a dip or retest of this zone)
🎯 **TP1:** 0.03000
🎯 **TP2:** 0.03093 (24h high, a key breakout test)
🎯 **TP3:** 0.03300+ (if momentum and volume stay strong)
🛑 **Stop Loss:** 0.02690 (below the recent support; a close under this and the setup is dead)
⚡ Keep leverage low, size small, and don't chase green candles. Patience pays.
⚠️ **DISCLAIMER:** This is not financial advice. It's just my personal chart view, shared for educational purposes. Crypto futures are highly volatile and risky, and you can lose your whole capital. Always do your own research (DYOR) and only trade what you can afford to lose.
#BMT #Bubblemaps #Binance #cryptotrading #futures
Personal hok: I'm watching **$BMT (Bubblemaps)** right now, and honestly, this chart has my attention. Price jumped from the 0.0214 zone to a high of 0.03093, up +33% on the day, with 123M USDT in volume. After that spike it's cooling off in a small pullback. Bulls and bears are both awake. Let's see who blinks first. 👀
📍 **Entry Level:** 0.02830 – 0.02875 (on a dip or retest of this zone)
🎯 **TP1:** 0.03000
🎯 **TP2:** 0.03093 (24h high, a key breakout test)
🎯 **TP3:** 0.03300+ (if momentum and volume stay strong)
🛑 **Stop Loss:** 0.02690 (below the recent support; a close under this and the setup is dead)
⚡ Keep leverage low, size small, and don't chase green candles. Patience pays.
⚠️ **DISCLAIMER:** This is not financial advice. It's just my personal chart view, shared for educational purposes. Crypto futures are highly volatile and risky, and you can lose your whole capital. Always do your own research (DYOR) and only trade what you can afford to lose.
#BMT #Bubblemaps #Binance #cryptotrading #futures
2
708
·
--
Рост
{spot}(HYPEUSDT)
**I'm watching $HYPE closely right now. 👀🔥**
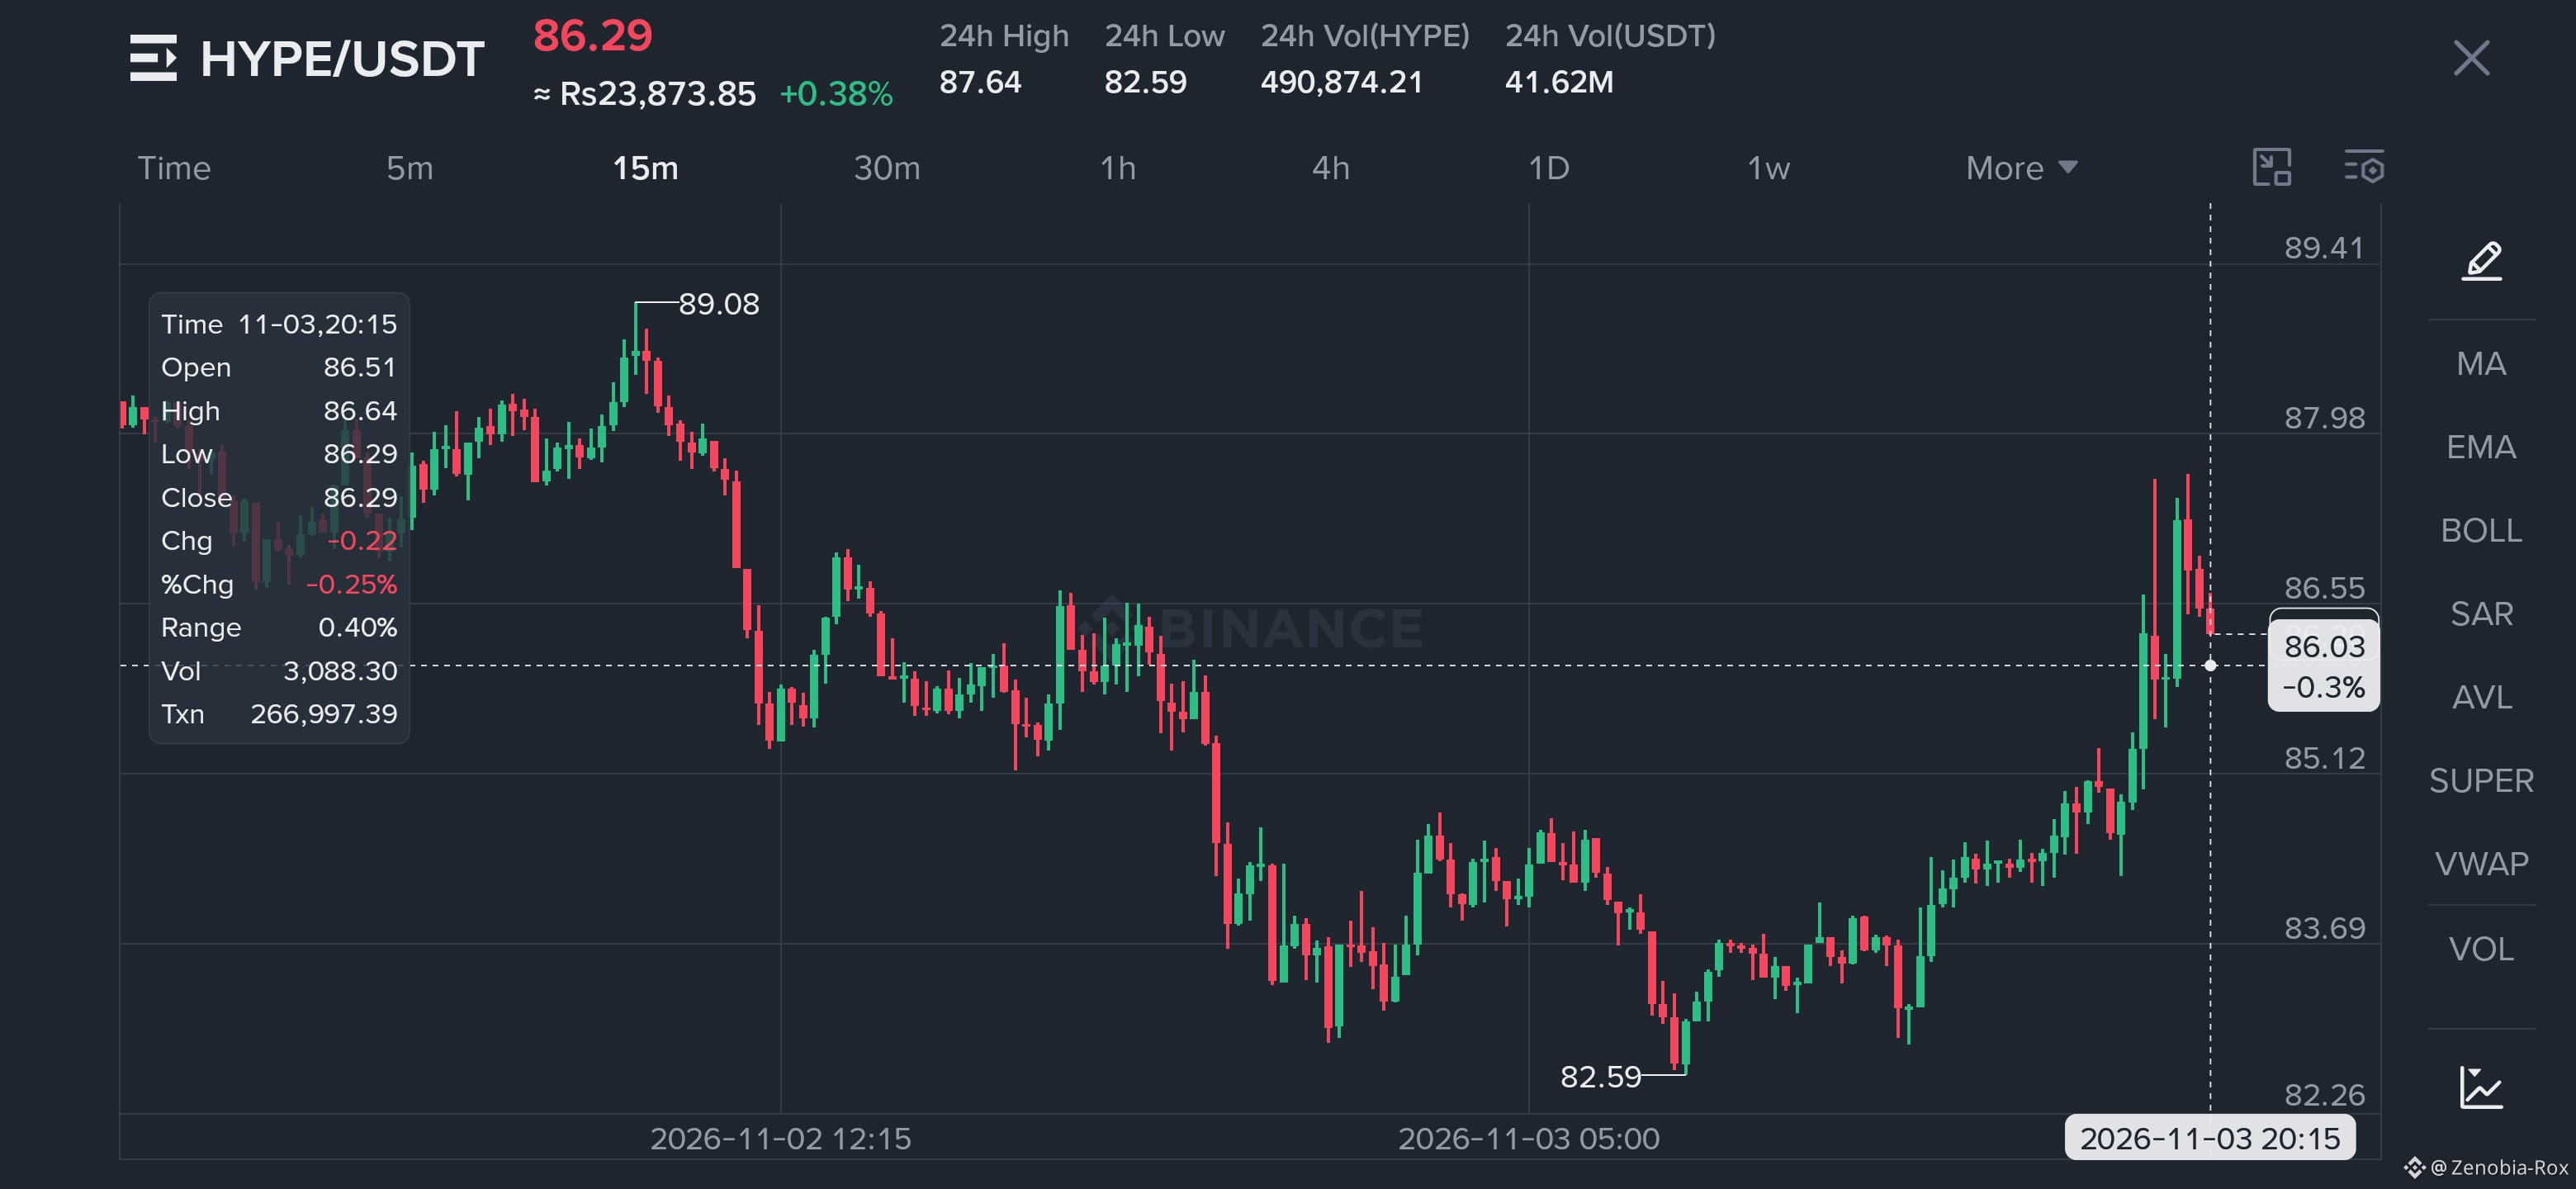
$HYPE just ripped from the 82.59 low to a spike near 88, and now it's cooling at 86.29. I don't think the move is over. It's catching its breath. A strong bounce, a pullback, and buyers still defending the dip. That's the kind of setup I like to see.
📍 **Entry:** 85.60 – 86.30 (scale in, don't chase)
🎯 **TP1:** 87.64 (the 24h high, where I'd take some profit)
🎯 **TP2:** 89.08 (recent swing high, where I'd start trailing my stop)
🎯 **TP3:** 91.00 (the breakout dream 🚀)
🛑 **Stop Loss:** 83.60 (below support, so if it breaks I'm out with no ego)
Patience pays here. If it dips into my entry zone, I'm ready. If it runs without me, I let it go. There's always another setup. 💪
⚠️ **Disclaimer:** This is not financial advice. It's just my personal view and chart analysis. Crypto is highly volatile and you can lose money. Do your own research, manage your risk, and never trade more than you can afford to lose.
#HYPE #HYPEUSDT #Crypto #Binance #trading
**I'm watching $HYPE closely right now. 👀🔥**
$HYPE just ripped from the 82.59 low to a spike near 88, and now it's cooling at 86.29. I don't think the move is over. It's catching its breath. A strong bounce, a pullback, and buyers still defending the dip. That's the kind of setup I like to see.
📍 **Entry:** 85.60 – 86.30 (scale in, don't chase)
🎯 **TP1:** 87.64 (the 24h high, where I'd take some profit)
🎯 **TP2:** 89.08 (recent swing high, where I'd start trailing my stop)
🎯 **TP3:** 91.00 (the breakout dream 🚀)
🛑 **Stop Loss:** 83.60 (below support, so if it breaks I'm out with no ego)
Patience pays here. If it dips into my entry zone, I'm ready. If it runs without me, I let it go. There's always another setup. 💪
⚠️ **Disclaimer:** This is not financial advice. It's just my personal view and chart analysis. Crypto is highly volatile and you can lose money. Do your own research, manage your risk, and never trade more than you can afford to lose.
#HYPE #HYPEUSDT #Crypto #Binance #trading
$HYPE just ripped from the 82.59 low to a spike near 88, and now it's cooling at 86.29. I don't think the move is over. It's catching its breath. A strong bounce, a pullback, and buyers still defending the dip. That's the kind of setup I like to see.
📍 **Entry:** 85.60 – 86.30 (scale in, don't chase)
🎯 **TP1:** 87.64 (the 24h high, where I'd take some profit)
🎯 **TP2:** 89.08 (recent swing high, where I'd start trailing my stop)
🎯 **TP3:** 91.00 (the breakout dream 🚀)
🛑 **Stop Loss:** 83.60 (below support, so if it breaks I'm out with no ego)
Patience pays here. If it dips into my entry zone, I'm ready. If it runs without me, I let it go. There's always another setup. 💪
⚠️ **Disclaimer:** This is not financial advice. It's just my personal view and chart analysis. Crypto is highly volatile and you can lose money. Do your own research, manage your risk, and never trade more than you can afford to lose.
#HYPE #HYPEUSDT #Crypto #Binance #trading
2
328
Войдите, чтобы посмотреть больше материала
Присоединяйтесь к пользователям криптовалют по всему миру на Binance Square
⚡️ Получайте новейшую и полезную информацию о криптоактивах.
💬 Нам доверяет крупнейшая в мире криптобиржа.
👍 Получите достоверные аналитические данные от верифицированных создателей контента.
Эл. почта/номер телефона
В тренде
NvidiaInvestigatesAfterHuang’sAffairApology
Просмотров: 233,451
1,886 обсуждают
Nvidia Board Opens Probe Into Whether Huang Was Target of Foreign Intelligence Effort
Binance News
·Лайков: 21
·Просмотров: 55.3k
CPITestsDecemberRateOutlook
Просмотров: 682,111
2,958 обсуждают
AnthropicRejectsIPODelayValuationinQuestion
Просмотров: 52,534
503 обсуждают