

حسينہ
38 Публикации

حسينہ
Отправить жалобу
Заблокировать пользователя
No Enjoyment Like Reading 📚
Открытая сделка
Трейдер с регулярными сделками
1.1 г
3 подписок(и/а)
52 подписчиков(а)
129 понравилось
Посты
Портфель
·
--
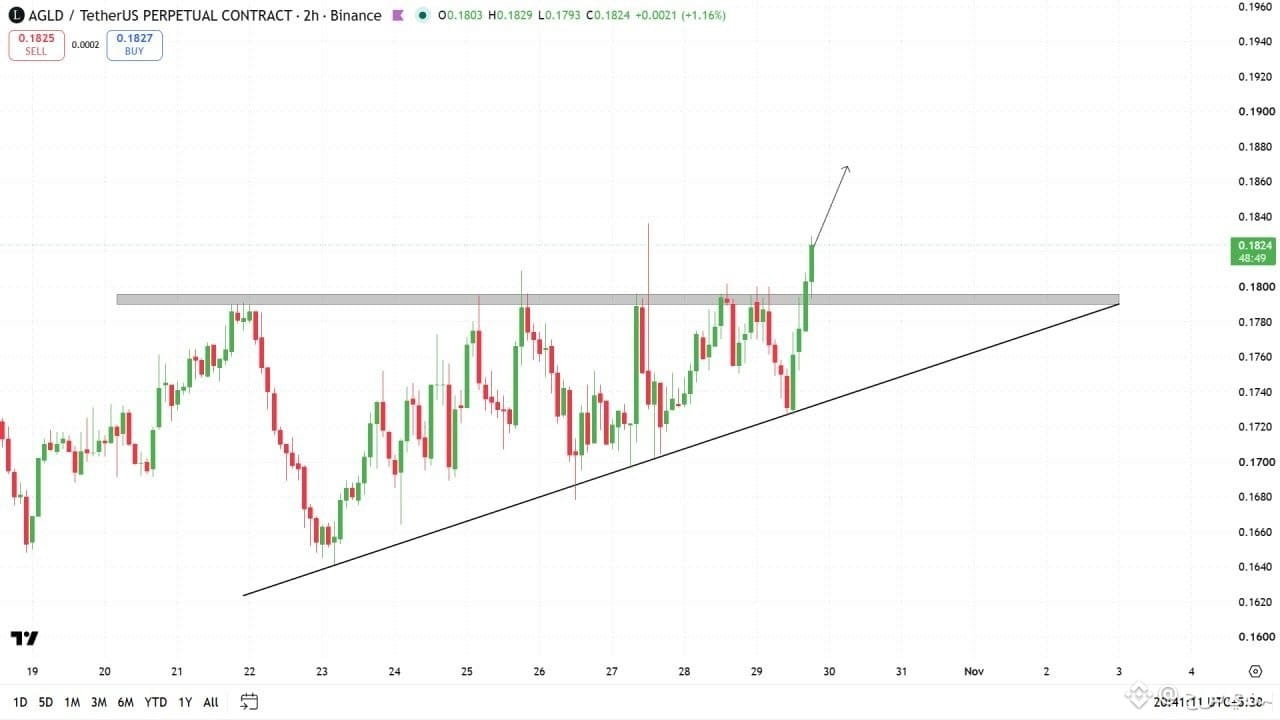
$AGLD /USDT looks bullish after that breakout. We could see a pump coming, so track it. #AGLD
{future}(AGLDUSDT)
$AGLD /USDT looks bullish after that breakout. We could see a pump coming, so track it. #AGLD
2
3
·
--
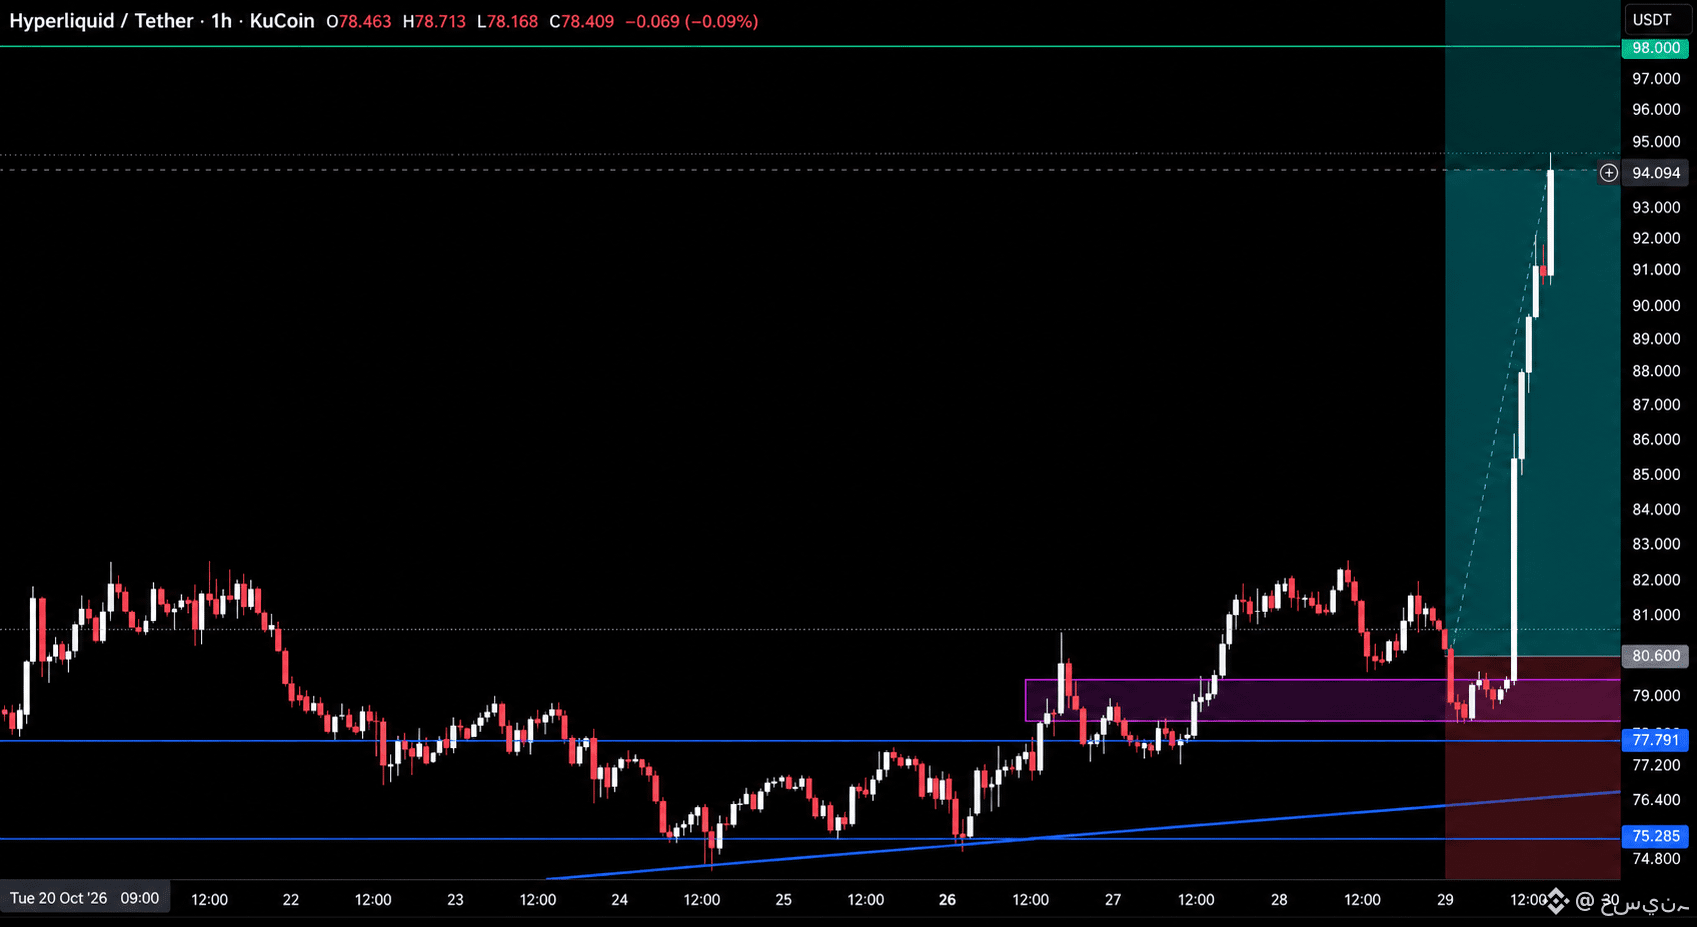
$HYPE is trading at 94.094, tracing its way up exactly as projected in our setup and hitting three targets along the way, after NYSE owner ICE announced a US perpetual futures market on Hyperliquid with Trade.xyz, pending regulatory approval.
Hold above the 80.000 breakout level and this keeps extending toward our final target at 98.000. Lose it and this drops back toward the 78.300 to 79.400 zone. #HYPE
{future}(HYPEUSDT)
$HYPE is trading at 94.094, tracing its way up exactly as projected in our setup and hitting three targets along the way, after NYSE owner ICE announced a US perpetual futures market on Hyperliquid with Trade.xyz, pending regulatory approval.
Hold above the 80.000 breakout level and this keeps extending toward our final target at 98.000. Lose it and this drops back toward the 78.300 to 79.400 zone. #HYPE
Hold above the 80.000 breakout level and this keeps extending toward our final target at 98.000. Lose it and this drops back toward the 78.300 to 79.400 zone. #HYPE
HYPE+12,60%
ICEUS+1,39%
2
437
·
--
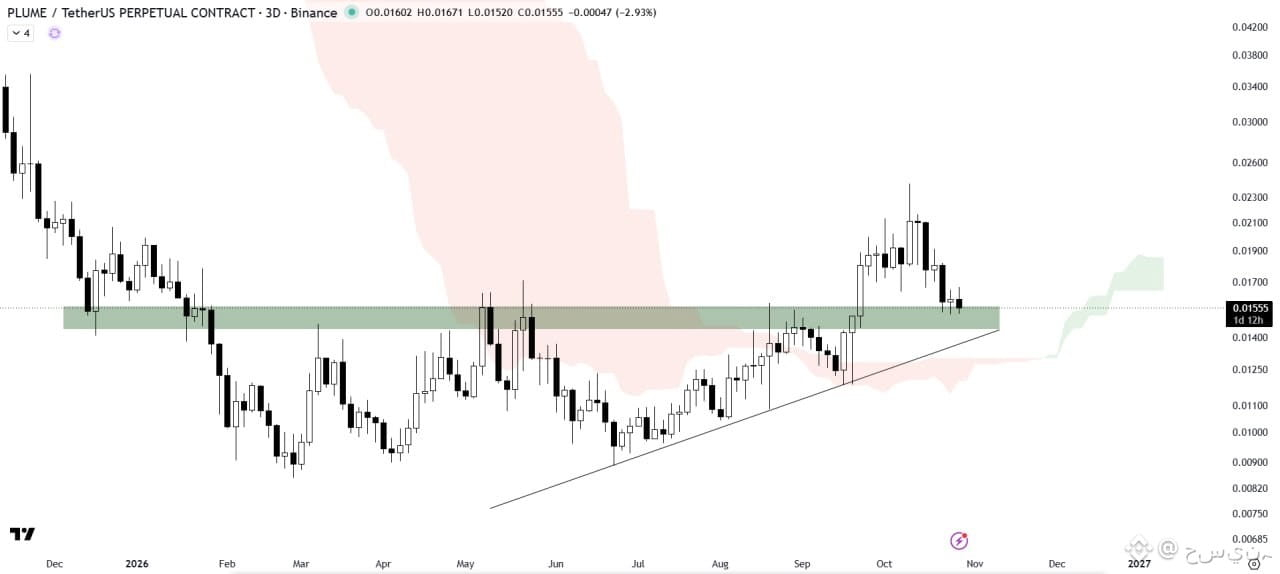
$PLUME is retesting the breakout level of the ascending triangle pattern, while the Ichimoku cloud is acting as a key support zone, reinforcing the bullish structure.
A successful retest and sustained hold above the breakout level could provide strong bullish confirmation and trigger a significant upward rally.
Keep a close eye on upcoming price action to confirm the continuation of bullish momentum. #PLUME
{future}(PLUMEUSDT)
$PLUME is retesting the breakout level of the ascending triangle pattern, while the Ichimoku cloud is acting as a key support zone, reinforcing the bullish structure.
A successful retest and sustained hold above the breakout level could provide strong bullish confirmation and trigger a significant upward rally.
Keep a close eye on upcoming price action to confirm the continuation of bullish momentum. #PLUME
A successful retest and sustained hold above the breakout level could provide strong bullish confirmation and trigger a significant upward rally.
Keep a close eye on upcoming price action to confirm the continuation of bullish momentum. #PLUME
1
29
·
--
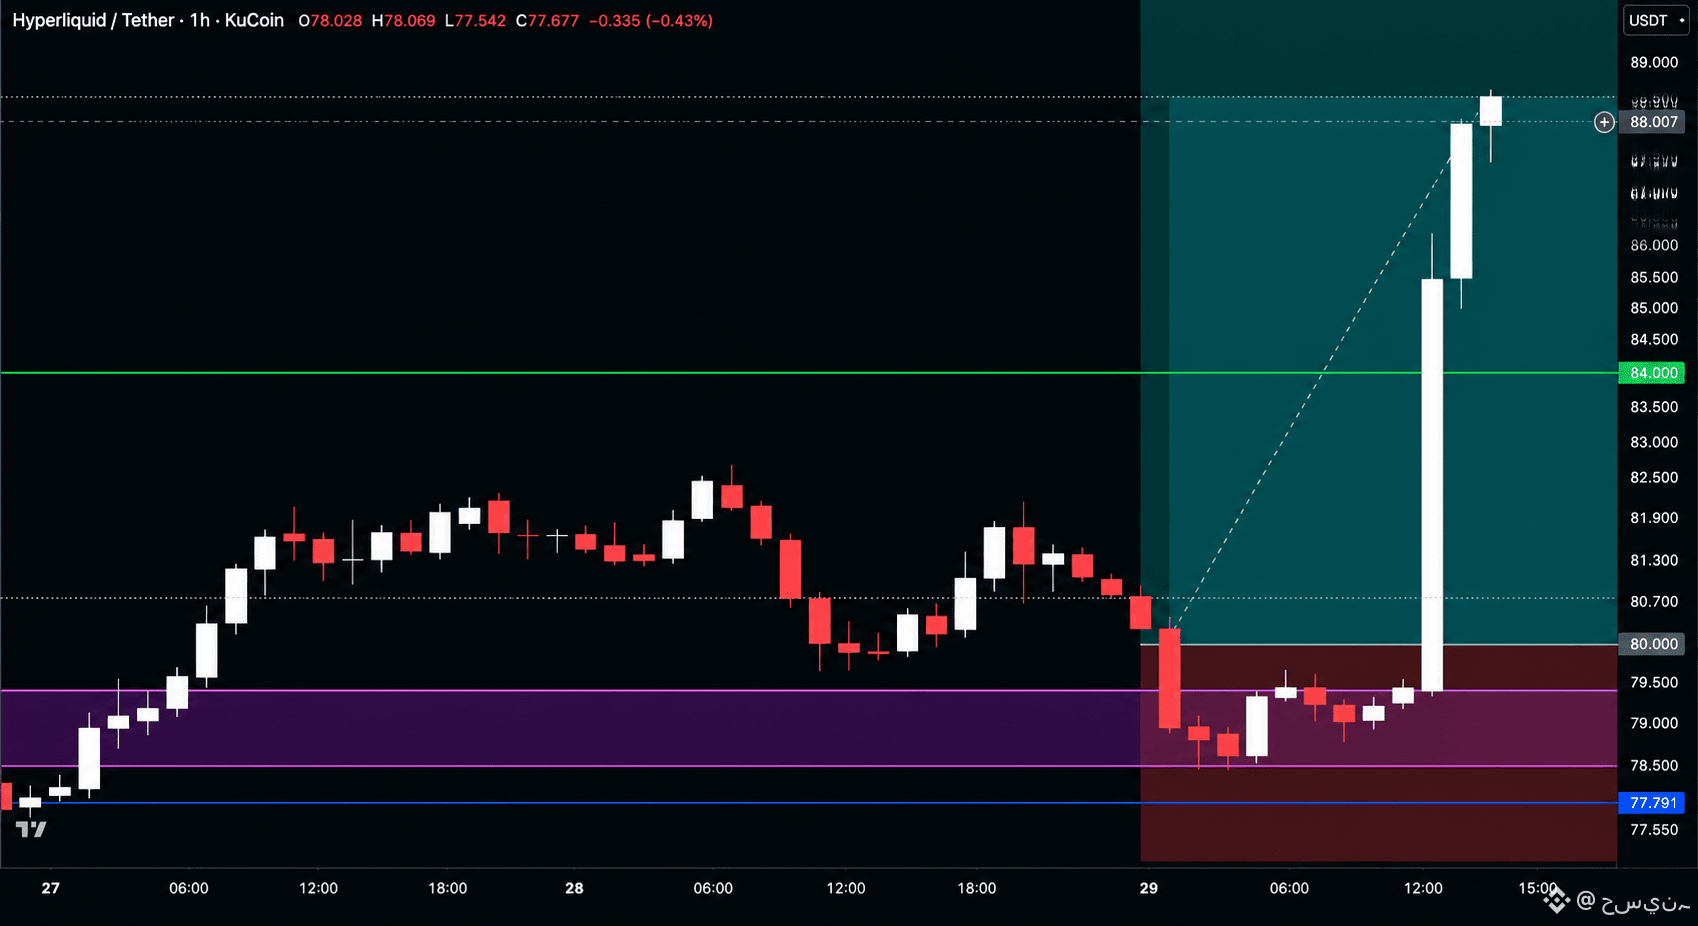
$HYPE /USDT (2-5x)
Direction: LONG
ENTRY: 79.600 - 80.000
TARGETS: 84.000 - 88.000 - 93.000 - 98.000 - 103.000 - 109.000 - 116.000 - 125.000
STOP LOSS: 72.000
4H FVG confluent with ascending trendline confluent with stacked horizontal support at entry. #HYPE
{future}(HYPEUSDT)
$HYPE /USDT (2-5x)
Direction: LONG
ENTRY: 79.600 - 80.000
TARGETS: 84.000 - 88.000 - 93.000 - 98.000 - 103.000 - 109.000 - 116.000 - 125.000
STOP LOSS: 72.000
4H FVG confluent with ascending trendline confluent with stacked horizontal support at entry. #HYPE
Direction: LONG
ENTRY: 79.600 - 80.000
TARGETS: 84.000 - 88.000 - 93.000 - 98.000 - 103.000 - 109.000 - 116.000 - 125.000
STOP LOSS: 72.000
4H FVG confluent with ascending trendline confluent with stacked horizontal support at entry. #HYPE
1
146
·
--
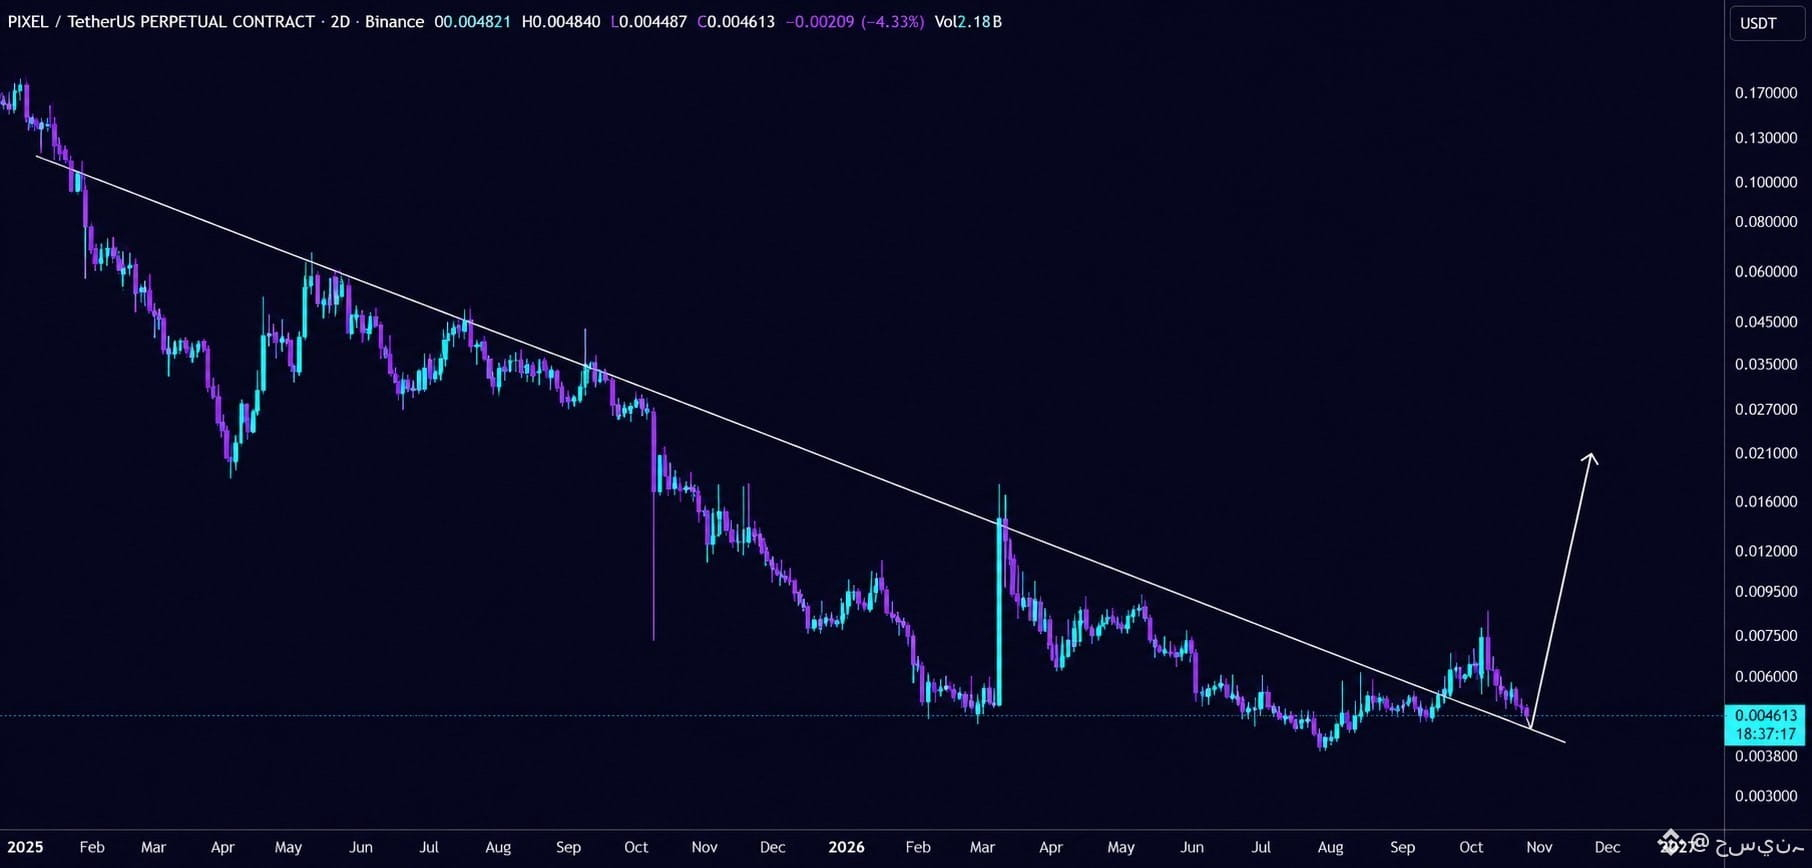
$PIXEL :Major Breakout Ahead?
#PIXEL is retesting a long-term descending trendline that has kept the price under pressure for nearly two years.
The $0.0045–$0.0046 area is the key level to watch. A successful retest would strengthen the bullish setup and open the way for a move toward $0.01, with $0.02 as the bigger target.
I’m looking for buyers to defend this zone and kick off a strong recovery.
1
237
·
--
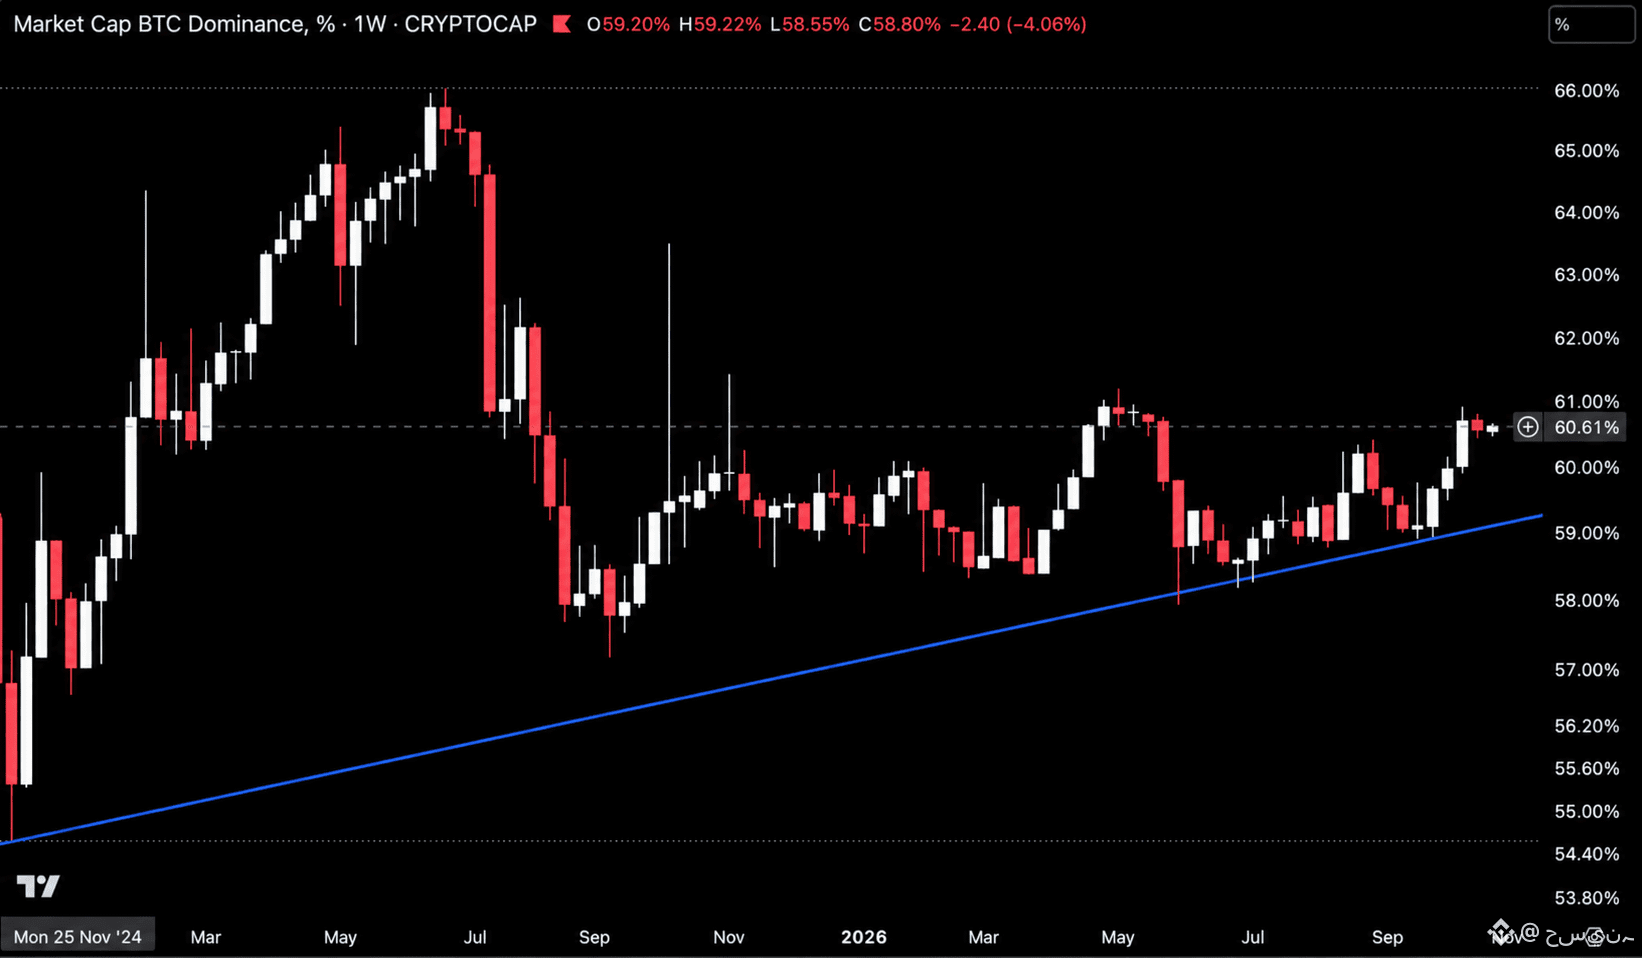
$BTC .D is trading at 60.61%, pressing into the 61.00% resistance on the weekly while holding the rising trendline from late 2024 near 59.30%, a squeeze that keeps altcoins under pressure for now.
A rejection at 61.00% sends dominance back toward 60.00% to 59.30%, giving altcoins room to recover. A weekly close above 61.20% extends BTC control and puts altcoins under heavier pressure. #BTC
A rejection at 61.00% sends dominance back toward 60.00% to 59.30%, giving altcoins room to recover. A weekly close above 61.20% extends BTC control and puts altcoins under heavier pressure. #BTC
1
72
·
--
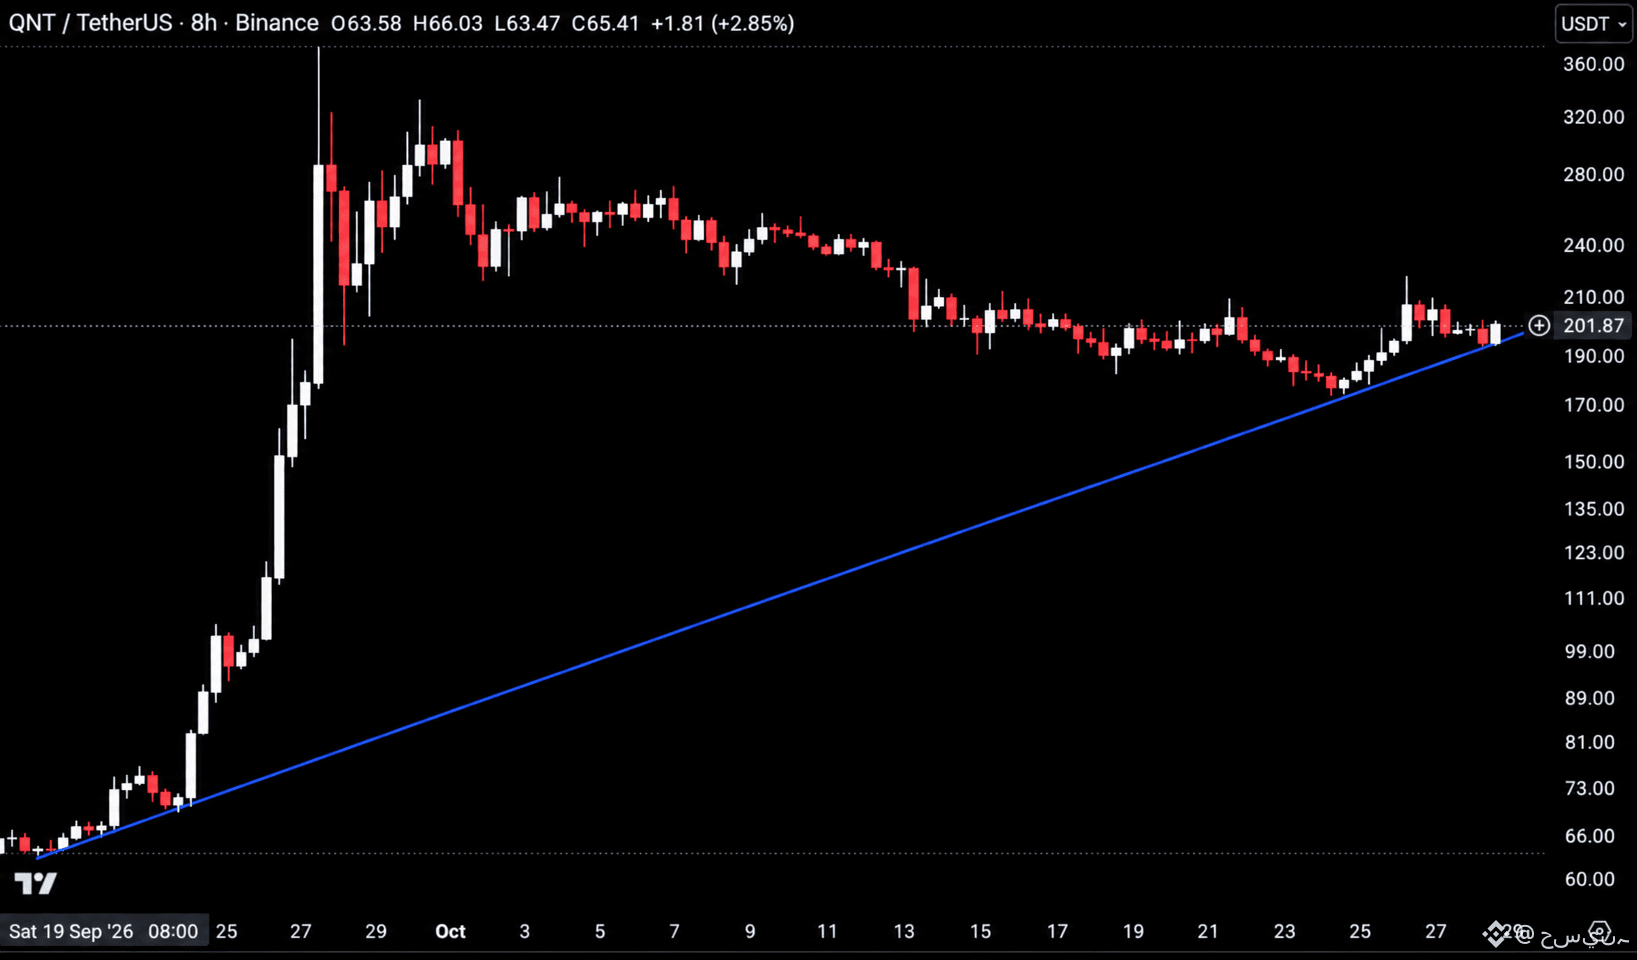
$QNT is trading at 195, testing the rising trendline from September near 195.00 after a slide from highs near 370.00, with price compressing in a tight range just above it. Hold this trendline and this pushes back toward 210.00 to 240.00. Lose it and the trendline breaks, opening the door toward 170.00 to 150.00. #QNT
{future}(QNTUSDT)
$QNT is trading at 195, testing the rising trendline from September near 195.00 after a slide from highs near 370.00, with price compressing in a tight range just above it. Hold this trendline and this pushes back toward 210.00 to 240.00. Lose it and the trendline breaks, opening the door toward 170.00 to 150.00. #QNT
3
887
·
--
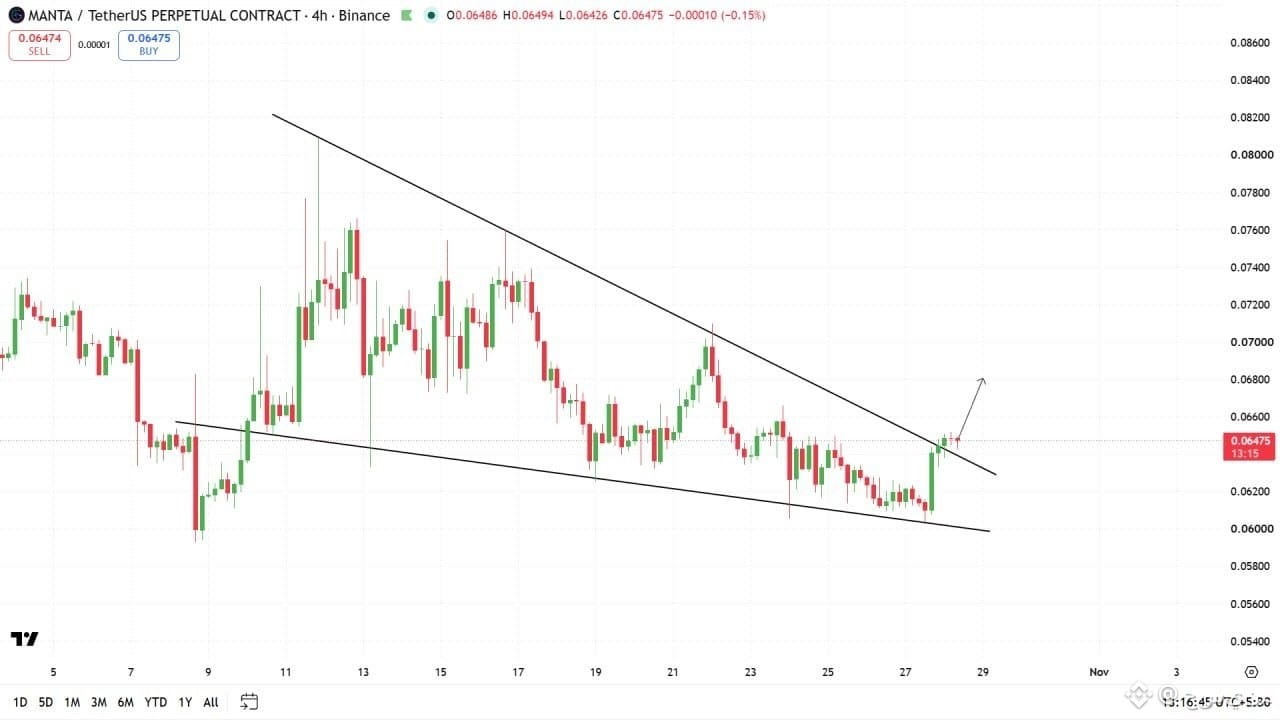
$MANTA looks bullish after that breakout. We could see a pump coming, so track it. #MANTA
{future}(MANTAUSDT)
$MANTA looks bullish after that breakout. We could see a pump coming, so track it. #MANTA
2
11
·
--
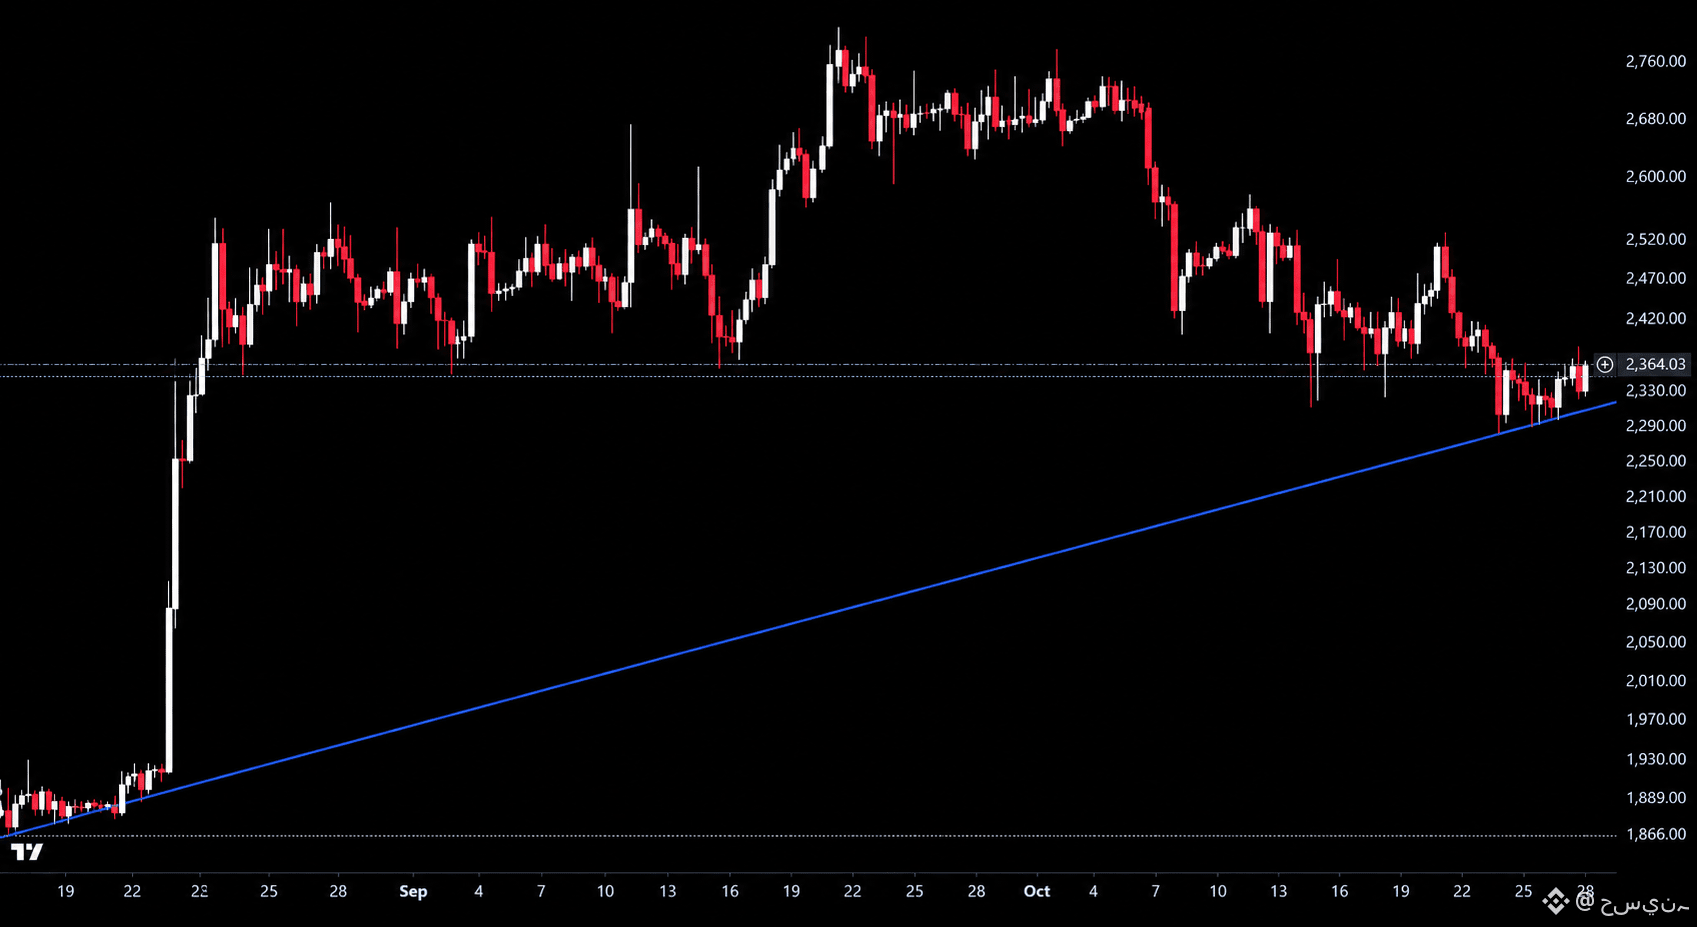
$ETH is trading at 2,364.03, bouncing off the rising trendline from August near 2,310 after the FOMC held the target range unchanged, following a slide from highs near 2,780.
Hold this trendline and this pushes back toward 2,420 to 2,520. Lose it and this drops back toward 2,250 to 2,170. #ETH
{future}(ETHUSDT)
$ETH is trading at 2,364.03, bouncing off the rising trendline from August near 2,310 after the FOMC held the target range unchanged, following a slide from highs near 2,780.
Hold this trendline and this pushes back toward 2,420 to 2,520. Lose it and this drops back toward 2,250 to 2,170. #ETH
Hold this trendline and this pushes back toward 2,420 to 2,520. Lose it and this drops back toward 2,250 to 2,170. #ETH
2
88
·
--
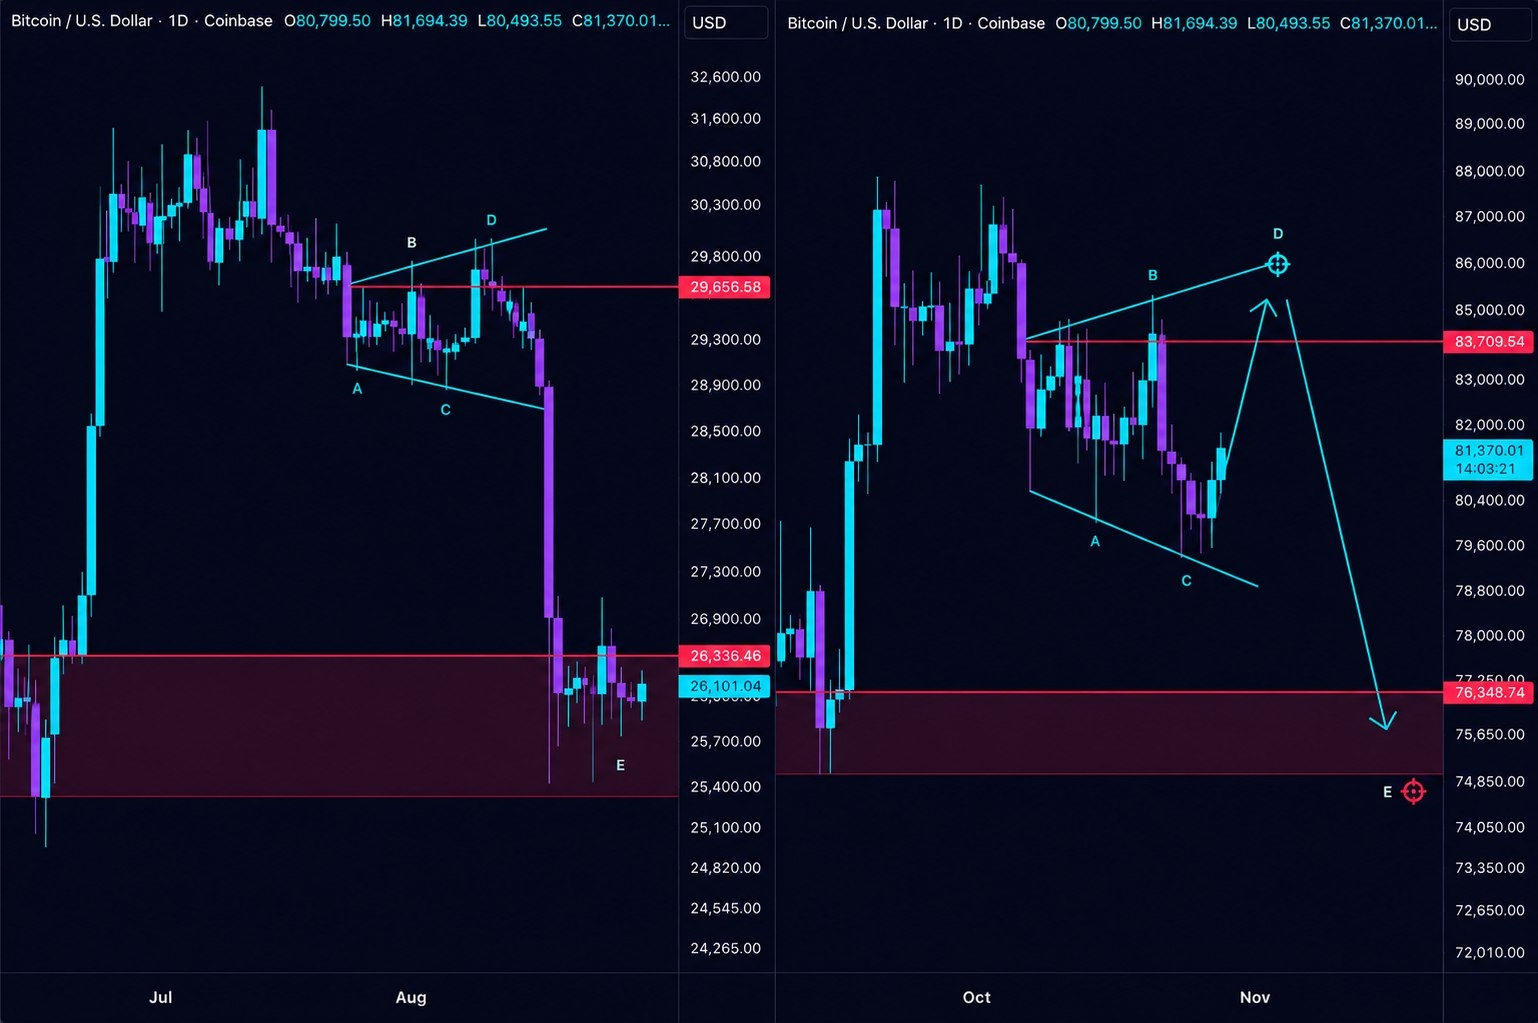
$BTC : Is August 2023 About to Repeat Itself?
Bitcoin’s current price action looks remarkably similar to August 2023. Spot buyers are stepping in, and I’m watching for a local bounce toward $85K before another correction toward $75K–$76K.
Despite that, the higher-timeframe structure remains bullish in my view. A dip to $75K would bring BTC back toward the weekly MA50 and yearly rolling VWAP, creating a strong area for buyers to step in.
The bigger bullish move is still ahead. #BTC
{future}(BTCUSDT)
$BTC : Is August 2023 About to Repeat Itself?
Bitcoin’s current price action looks remarkably similar to August 2023. Spot buyers are stepping in, and I’m watching for a local bounce toward $85K before another correction toward $75K–$76K.
Despite that, the higher-timeframe structure remains bullish in my view. A dip to $75K would bring BTC back toward the weekly MA50 and yearly rolling VWAP, creating a strong area for buyers to step in.
The bigger bullish move is still ahead. #BTC
2
34
·
--
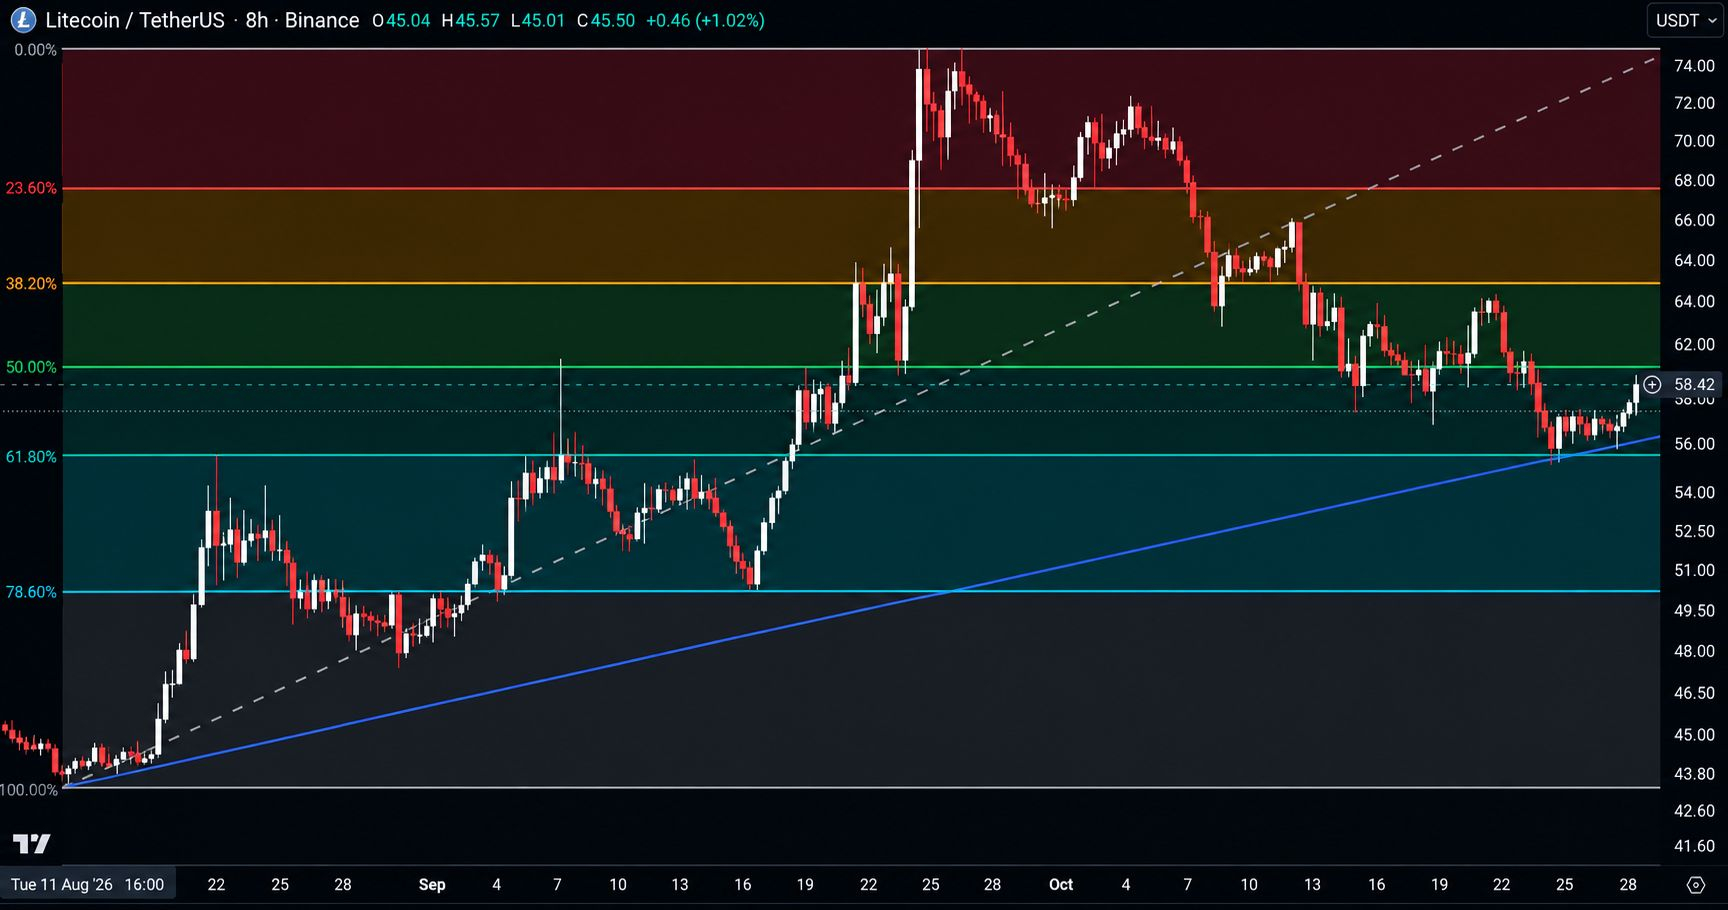
$LTC is trading at 58.42, bouncing from its retest of the 61.8% Fibonacci level near 55.30, which is holding as support alongside the rising trendline from August after the pullback from highs near 74.00.
Hold the 61.8% level and this pushes back toward the 50% level near 59.30 and the 38.2% level near 62.80. Lose it and this drops toward the 78.6% level near 50.00. #LTC
{future}(LTCUSDT)
$LTC is trading at 58.42, bouncing from its retest of the 61.8% Fibonacci level near 55.30, which is holding as support alongside the rising trendline from August after the pullback from highs near 74.00.
Hold the 61.8% level and this pushes back toward the 50% level near 59.30 and the 38.2% level near 62.80. Lose it and this drops toward the 78.6% level near 50.00. #LTC
Hold the 61.8% level and this pushes back toward the 50% level near 59.30 and the 38.2% level near 62.80. Lose it and this drops toward the 78.6% level near 50.00. #LTC
2
159
·
--
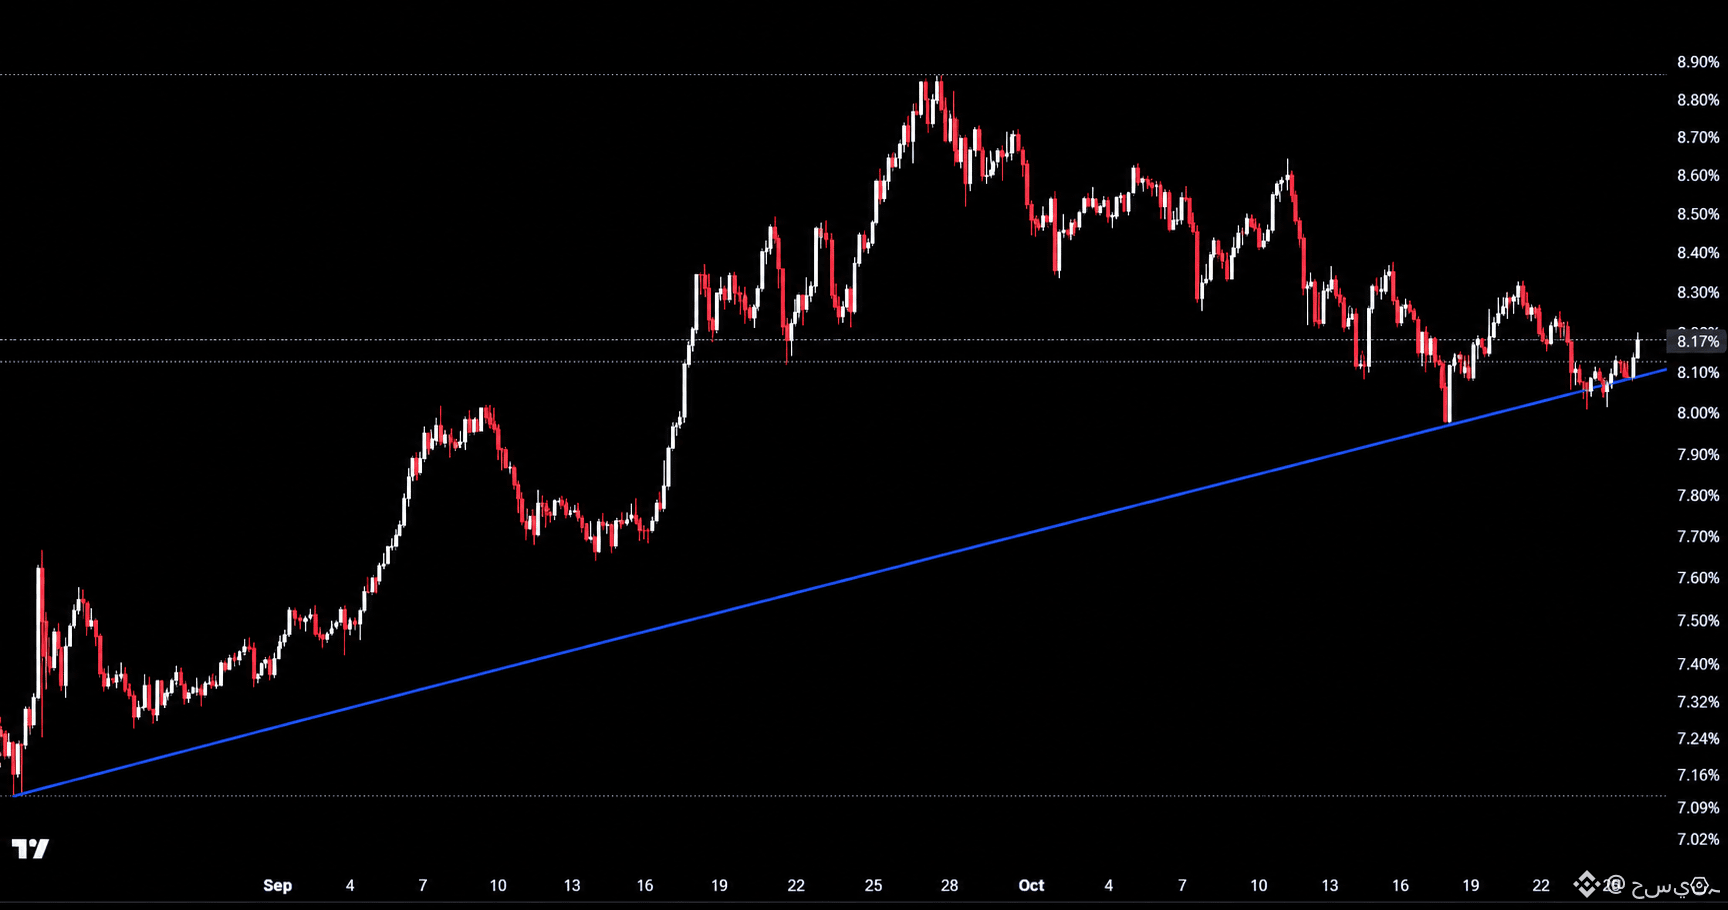
$Altcoin dominance (excluding the top 10) is at 8.17%, retesting the rising trendline from August near 8.08% once again and bouncing from it, a structure that keeps favoring altcoins as long as it holds.
Hold this trendline and dominance pushes back toward 8.30% to 8.60%, with altcoins gaining ground on Bitcoin. Lose it and this drops toward 7.80% to 7.70%, and the altcoin rotation stalls. #Altcoins
Hold this trendline and dominance pushes back toward 8.30% to 8.60%, with altcoins gaining ground on Bitcoin. Lose it and this drops toward 7.80% to 7.70%, and the altcoin rotation stalls. #Altcoins
2
44
·
--
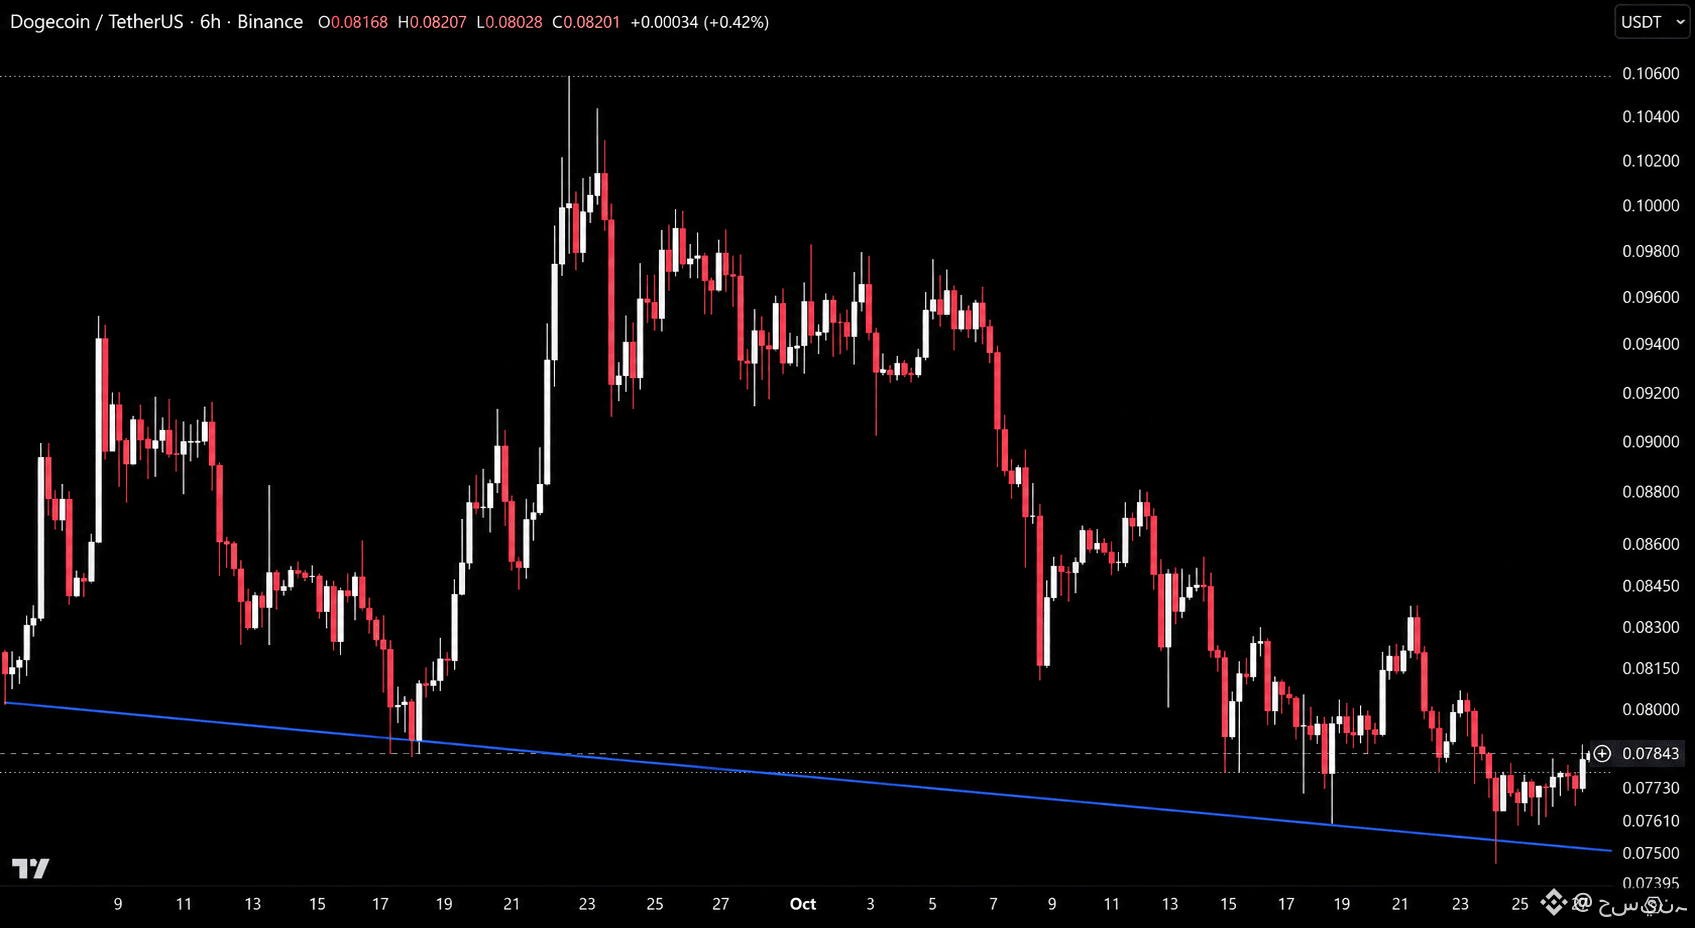
$DOGE is trading at 0.07943, bouncing off the descending support line from early September near 0.07520 after a wick low and a slide from highs near 0.10600.
Hold this support and this pushes back toward 0.08000 to 0.08300. Lose it and the line breaks, opening the door toward 0.07400. #DOGE
{future}(DOGEUSDT)
$DOGE is trading at 0.07943, bouncing off the descending support line from early September near 0.07520 after a wick low and a slide from highs near 0.10600.
Hold this support and this pushes back toward 0.08000 to 0.08300. Lose it and the line breaks, opening the door toward 0.07400. #DOGE
Hold this support and this pushes back toward 0.08000 to 0.08300. Lose it and the line breaks, opening the door toward 0.07400. #DOGE
2
319
·
--
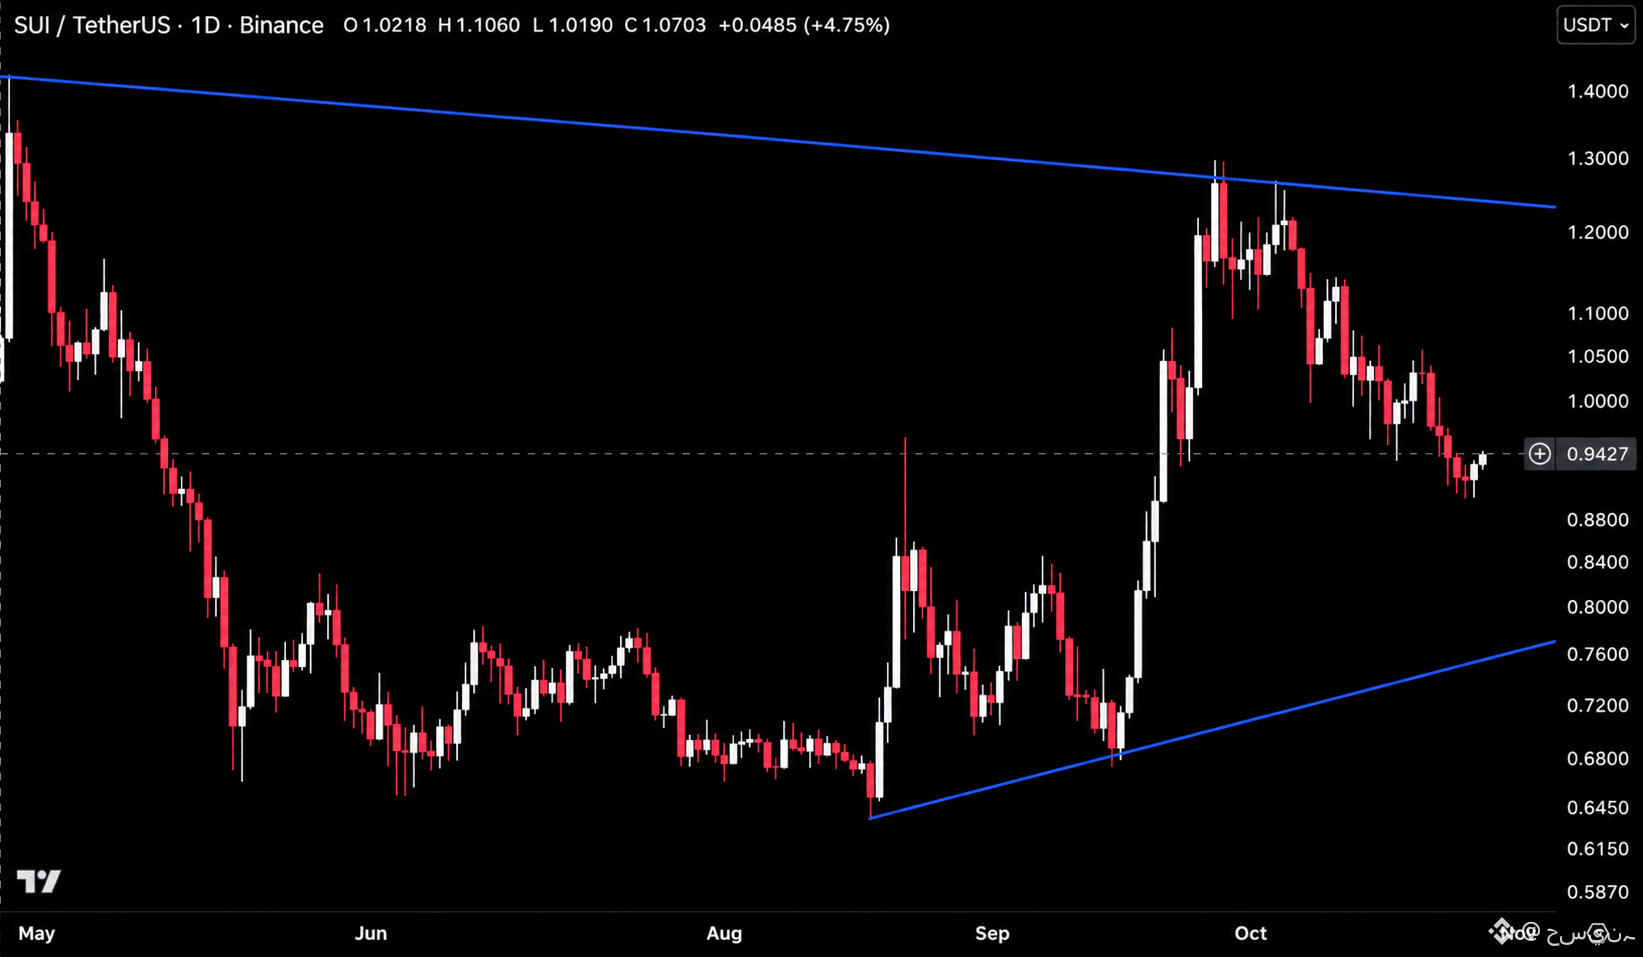
$SUI
is trading at 0.9427, bouncing from the 0.9000 zone inside a symmetrical triangle on the daily after a slide from highs near 1.3000, with descending resistance near 1.2300 and rising support near 0.7700.
Hold 0.9000 and this pushes back toward 1.0000 to 1.0500. Lose it and this drops toward the rising trendline near 0.7700, with 0.8800 to 0.8400 as the first support. #SUI
{future}(SUIUSDT)
$SUI
is trading at 0.9427, bouncing from the 0.9000 zone inside a symmetrical triangle on the daily after a slide from highs near 1.3000, with descending resistance near 1.2300 and rising support near 0.7700.
Hold 0.9000 and this pushes back toward 1.0000 to 1.0500. Lose it and this drops toward the rising trendline near 0.7700, with 0.8800 to 0.8400 as the first support. #SUI
2
535
·
--
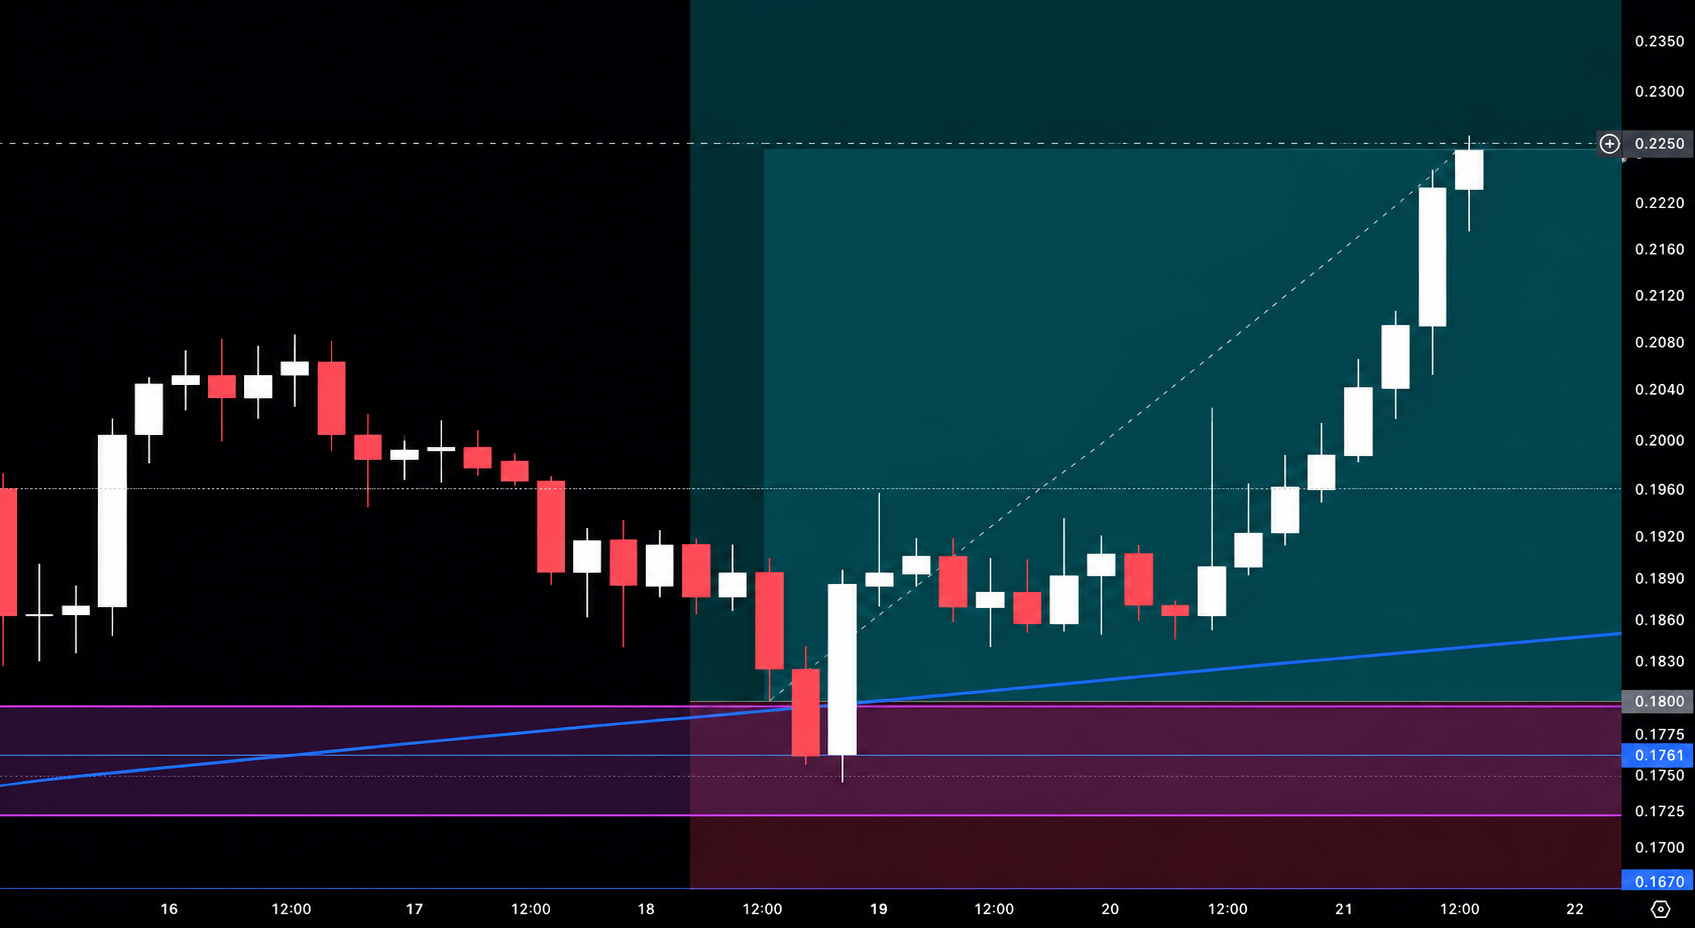
$ENA /USDT (2–5x)
Direction: LONG
ENTRY: 0.1780 – 0.1800
TARGETS:
0.1890 – 0.2000 – 0.2120 – 0.2250 – 0.2400 – 0.2550 – 0.2750 – 0.3000
STOP LOSS: 0.1620
8H FVG confluent with ascending trendline support and a horizontal level at entry. #ENA
{future}(ENAUSDT)
$ENA /USDT (2–5x)
Direction: LONG
ENTRY: 0.1780 – 0.1800
TARGETS:
0.1890 – 0.2000 – 0.2120 – 0.2250 – 0.2400 – 0.2550 – 0.2750 – 0.3000
STOP LOSS: 0.1620
8H FVG confluent with ascending trendline support and a horizontal level at entry. #ENA
Direction: LONG
ENTRY: 0.1780 – 0.1800
TARGETS:
0.1890 – 0.2000 – 0.2120 – 0.2250 – 0.2400 – 0.2550 – 0.2750 – 0.3000
STOP LOSS: 0.1620
8H FVG confluent with ascending trendline support and a horizontal level at entry. #ENA
2
311
·
--
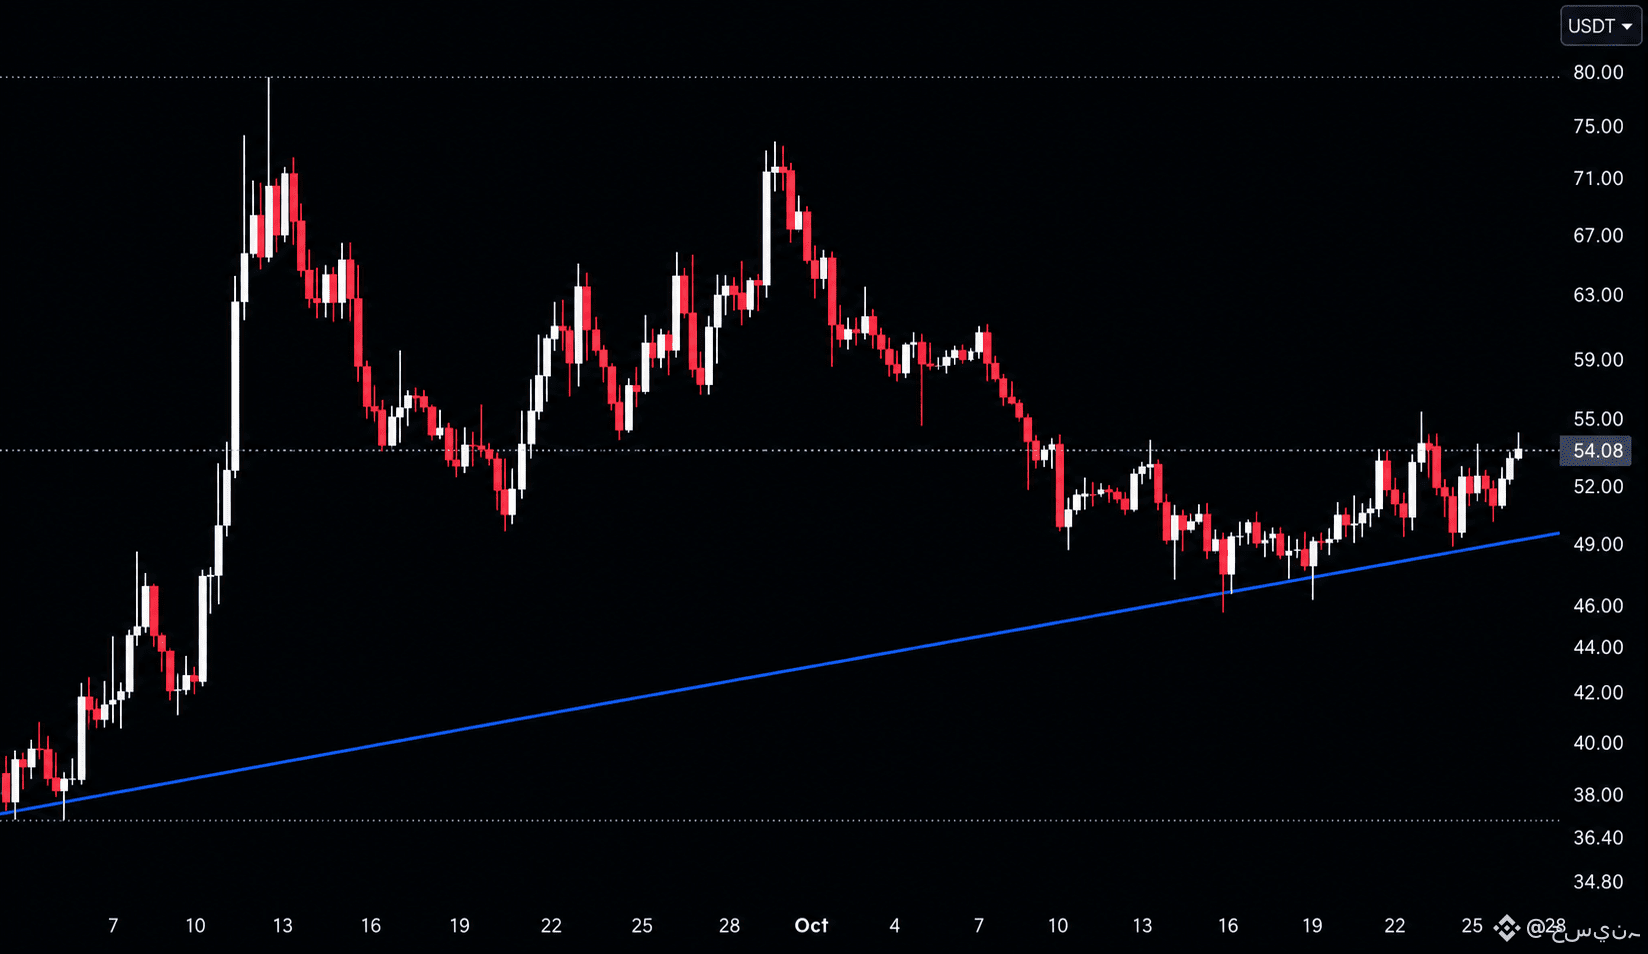
$DASH is trading at 55, bouncing off the rising trendline from late August near 49.00 and pressing into the 55.00 resistance after a slide from highs near 79.00.
A break above 55.00 pushes this toward 59.00 to 63.00. A rejection here sends this back toward the trendline near 49.00, and losing it opens the door toward 46.00 to 44.00. #DASH
{future}(DASHUSDT)
$DASH is trading at 55, bouncing off the rising trendline from late August near 49.00 and pressing into the 55.00 resistance after a slide from highs near 79.00.
A break above 55.00 pushes this toward 59.00 to 63.00. A rejection here sends this back toward the trendline near 49.00, and losing it opens the door toward 46.00 to 44.00. #DASH
A break above 55.00 pushes this toward 59.00 to 63.00. A rejection here sends this back toward the trendline near 49.00, and losing it opens the door toward 46.00 to 44.00. #DASH
2
7
·
--
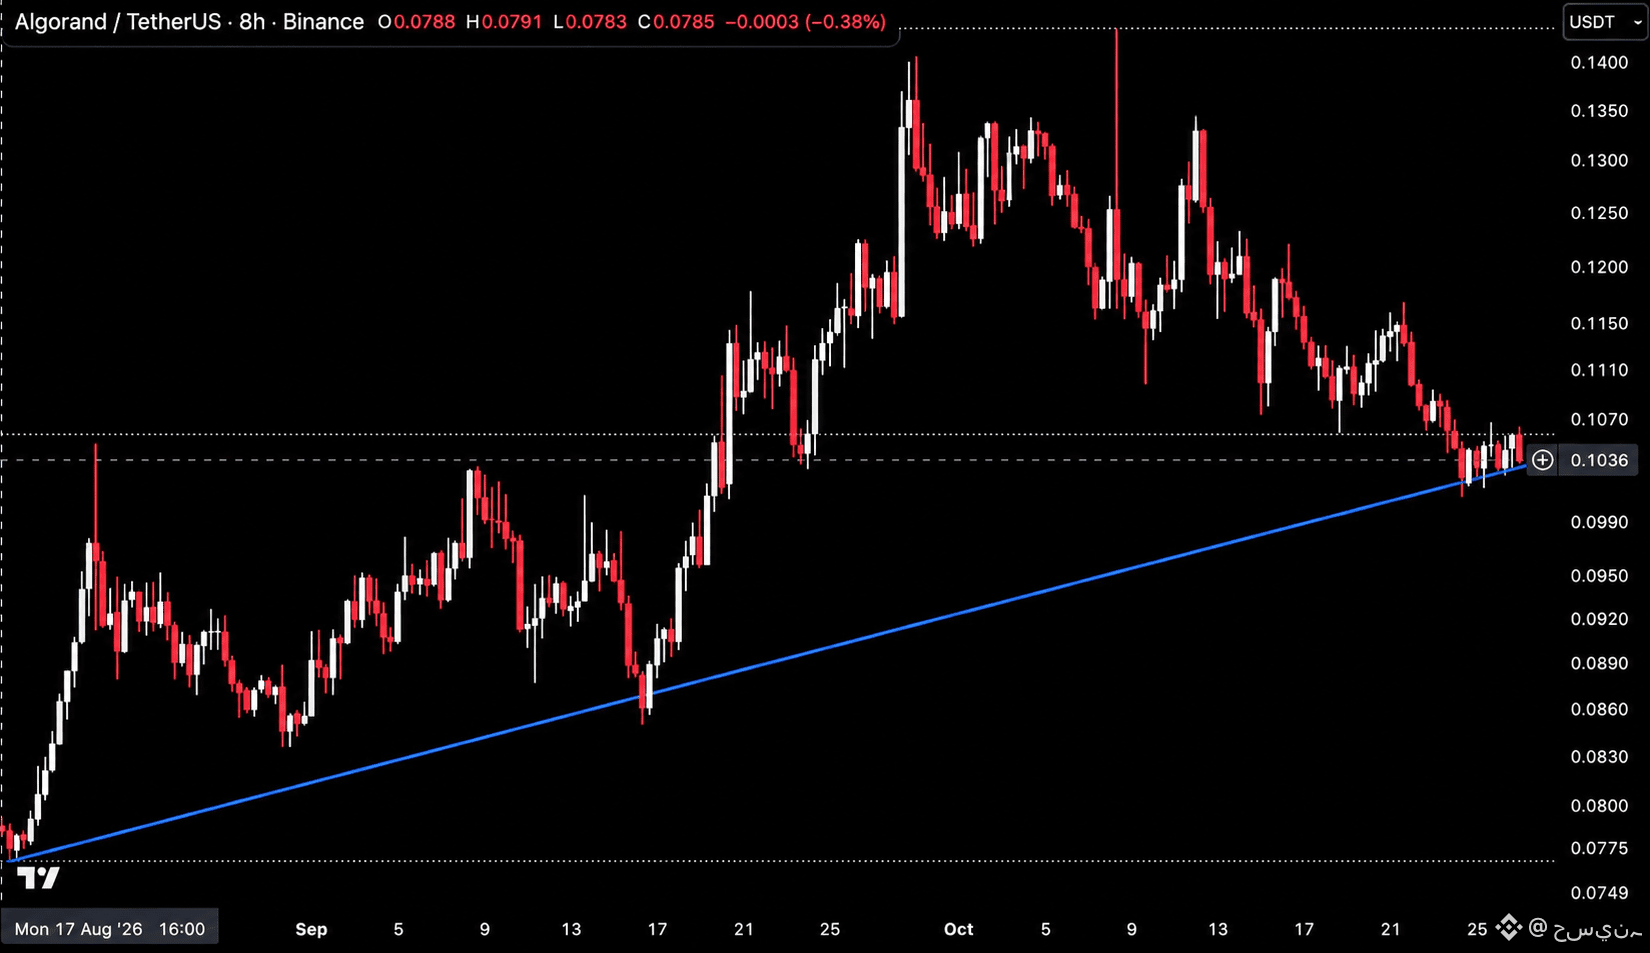
$ALGO is trading at 0.1033, testing the rising trendline from August near 0.1030 after a slide from highs near 0.1400, with price compressing just above it.
Hold this trendline and this pushes back toward 0.1070 to 0.1150. Lose it and the trendline breaks, opening the door toward 0.0990 to 0.0920. #ALGO
{future}(ALGOUSDT)
$ALGO is trading at 0.1033, testing the rising trendline from August near 0.1030 after a slide from highs near 0.1400, with price compressing just above it.
Hold this trendline and this pushes back toward 0.1070 to 0.1150. Lose it and the trendline breaks, opening the door toward 0.0990 to 0.0920. #ALGO
Hold this trendline and this pushes back toward 0.1070 to 0.1150. Lose it and the trendline breaks, opening the door toward 0.0990 to 0.0920. #ALGO
2
11
·
--
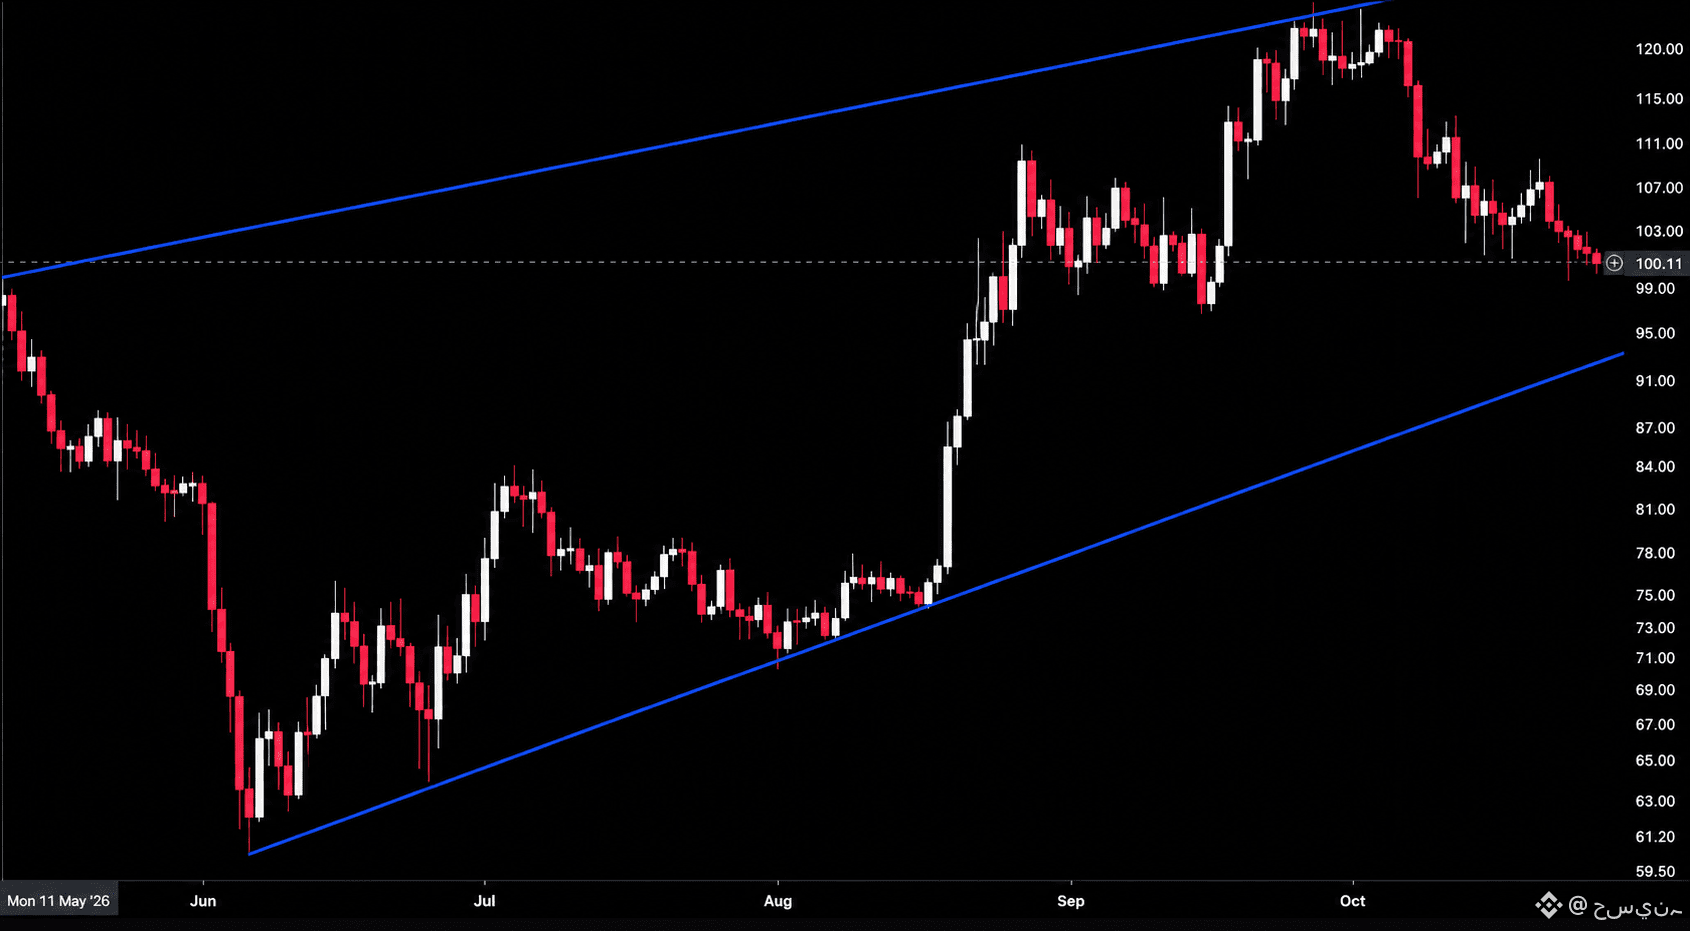
$SOL is trading at 101, sliding inside the rising channel from June after rejecting from the upper trendline near 122.00, with price now approaching the 99.00 to 95.00 support area and the channel’s lower trendline near 92.00 below.
Hold the 99.00 to 95.00 area and this bounces back toward 103.00 to 107.00. Lose it and this drops toward the channel support near 92.00 to 87.00. #SOL
{future}(SOLUSDT)
$SOL is trading at 101, sliding inside the rising channel from June after rejecting from the upper trendline near 122.00, with price now approaching the 99.00 to 95.00 support area and the channel’s lower trendline near 92.00 below.
Hold the 99.00 to 95.00 area and this bounces back toward 103.00 to 107.00. Lose it and this drops toward the channel support near 92.00 to 87.00. #SOL
Hold the 99.00 to 95.00 area and this bounces back toward 103.00 to 107.00. Lose it and this drops toward the channel support near 92.00 to 87.00. #SOL
2
492
·
--
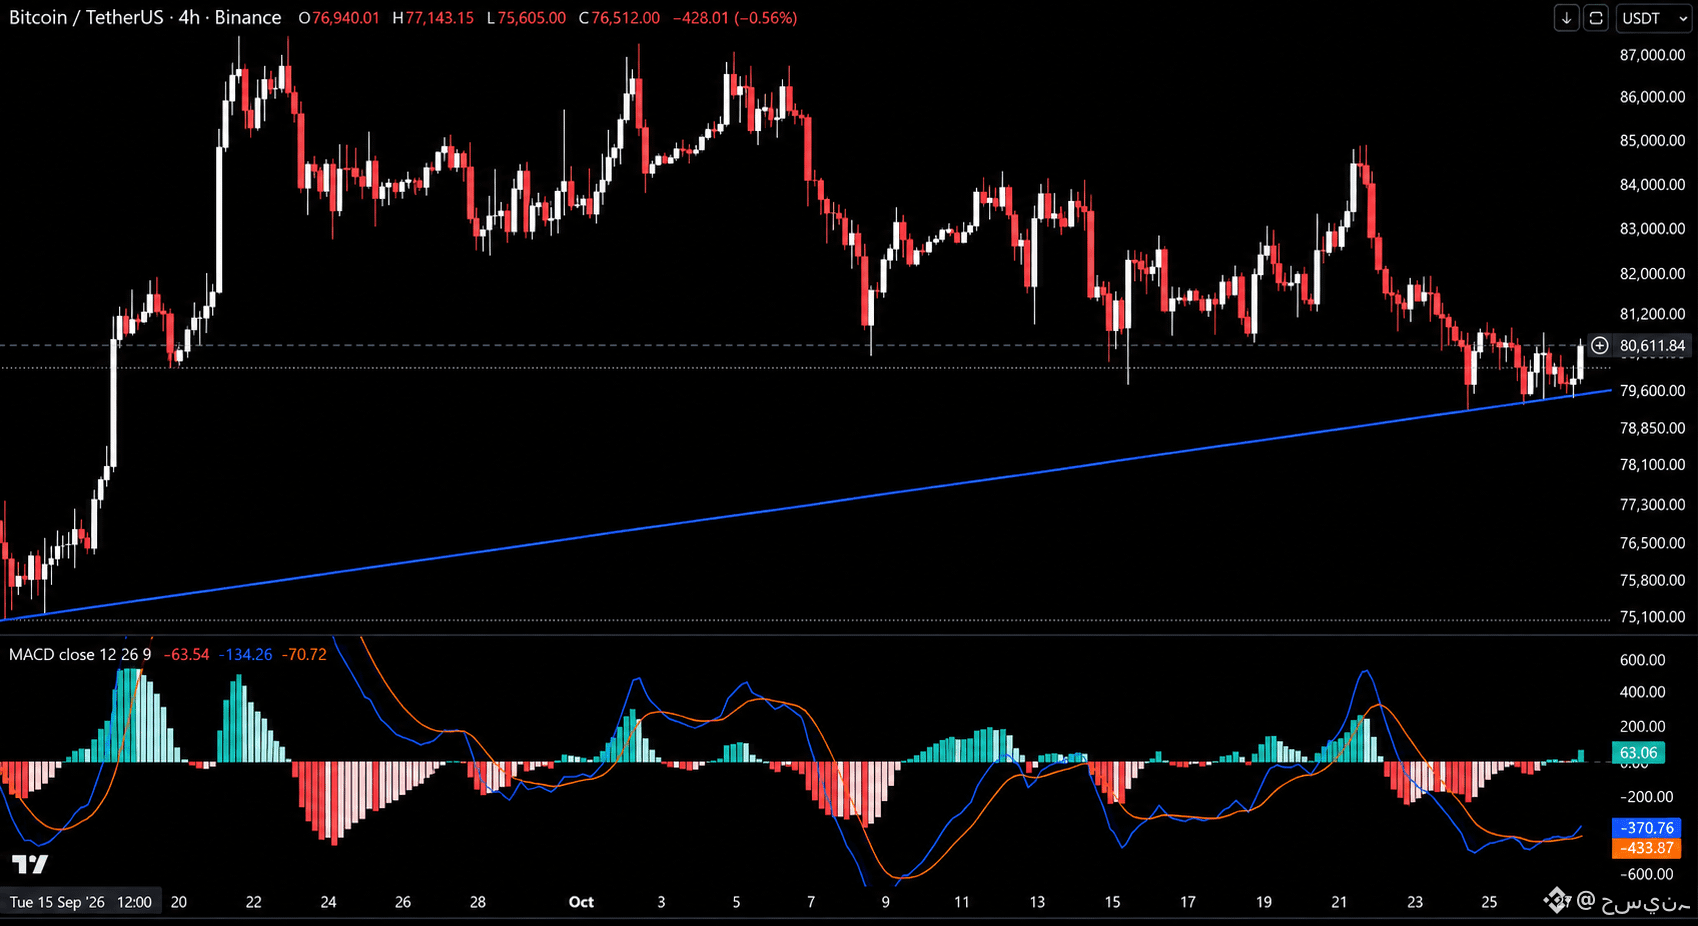
$BTC is trading at 80,611.84, bouncing off the rising trendline from September near 79,600, with the 4h MACD turning bullish as the MACD line pulls further above its signal line.
Hold this trendline and the MACD cross keeps building toward 82,000 to 84,000. Lose it and the cross fails, with 78,850 to 78,100 in play. #Btc
{future}(BTCUSDT)
$BTC is trading at 80,611.84, bouncing off the rising trendline from September near 79,600, with the 4h MACD turning bullish as the MACD line pulls further above its signal line.
Hold this trendline and the MACD cross keeps building toward 82,000 to 84,000. Lose it and the cross fails, with 78,850 to 78,100 in play. #Btc
Hold this trendline and the MACD cross keeps building toward 82,000 to 84,000. Lose it and the cross fails, with 78,850 to 78,100 in play. #Btc
2
44
·
--
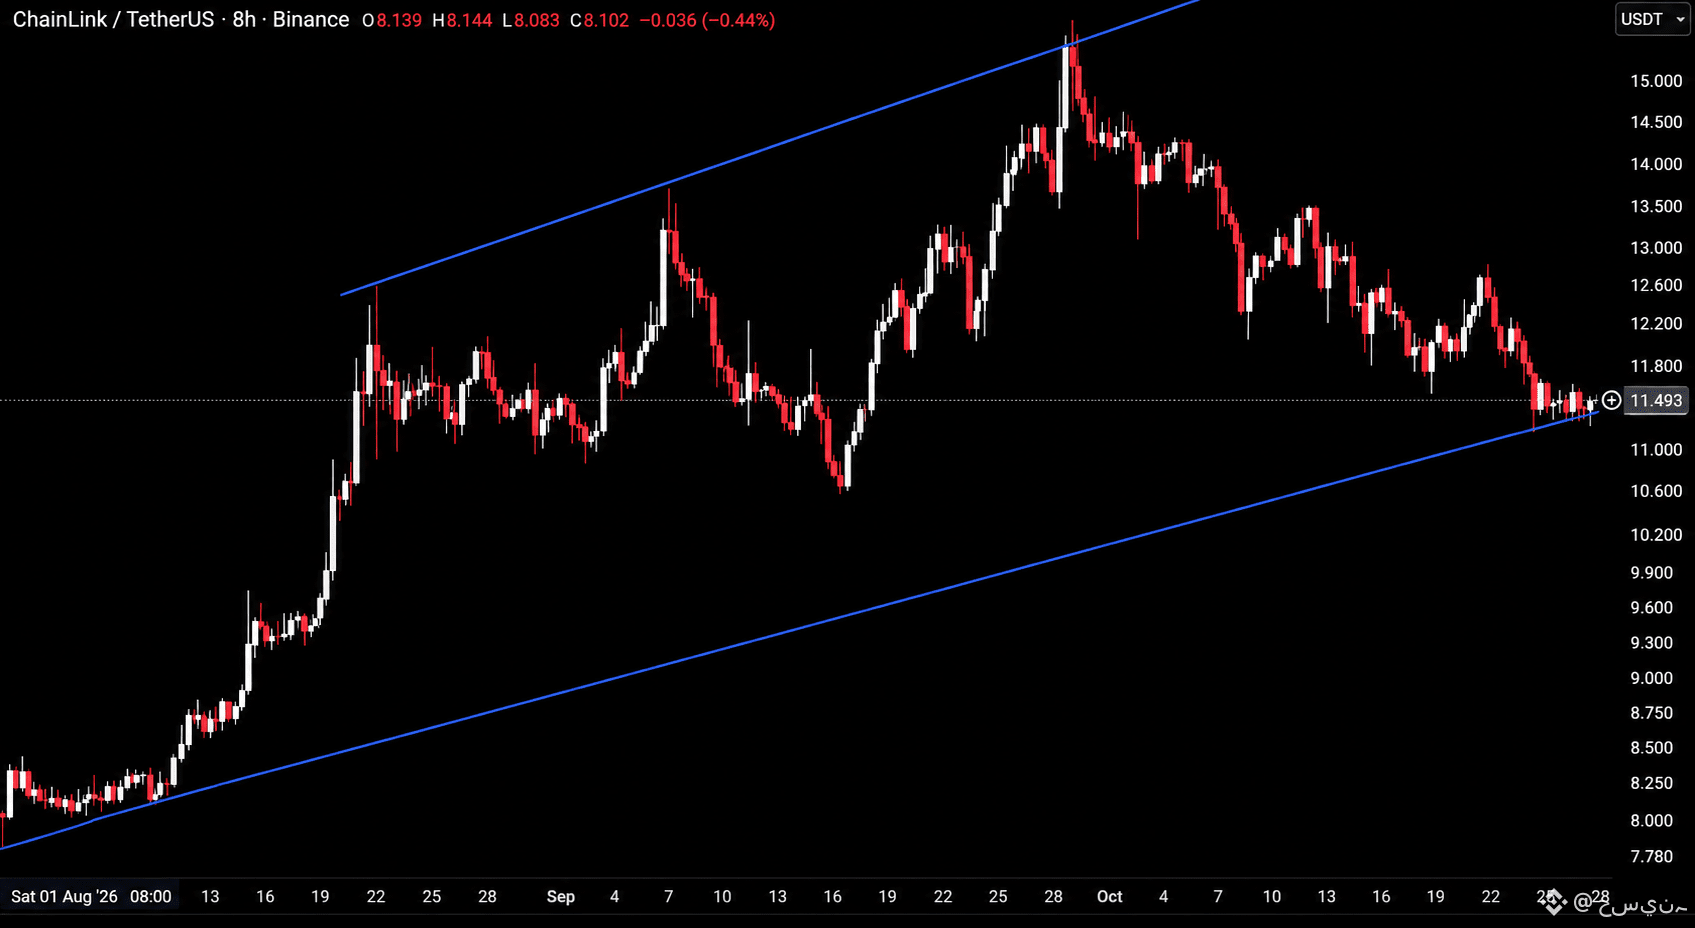
$LINK is trading at 11.55, testing the rising trendline from August near 11.300, which also acts as the lower boundary of the rising channel, after a steady slide from highs near 15.500.
Hold this trendline and this bounces back toward 12.200 to 12.600. Lose it and the channel breaks, opening the door toward 10.600 to 10.200. #LINK
{future}(LINKUSDT)
$LINK is trading at 11.55, testing the rising trendline from August near 11.300, which also acts as the lower boundary of the rising channel, after a steady slide from highs near 15.500.
Hold this trendline and this bounces back toward 12.200 to 12.600. Lose it and the channel breaks, opening the door toward 10.600 to 10.200. #LINK
Hold this trendline and this bounces back toward 12.200 to 12.600. Lose it and the channel breaks, opening the door toward 10.600 to 10.200. #LINK
2
117
Войдите, чтобы посмотреть больше материала
Присоединяйтесь к пользователям криптовалют по всему миру на Binance Square
⚡️ Получайте новейшую и полезную информацию о криптоактивах.
💬 Нам доверяет крупнейшая в мире криптобиржа.
👍 Получите достоверные аналитические данные от верифицированных создателей контента.
Эл. почта/номер телефона
В тренде
FedWatch
Просмотров: 16.3M
39,394 обсуждают
🚨 🇺🇸 PETER SCHIFF JUST THREW A BIG WARNING AT THE FED!
Peter Schiff is calling Kevin Warsh’s tough talk on inflation a “bluff,” and his prediction could have major implications for the markets.
Schiff believes the Fed could eventually return to money printing through quantitative easing (QE) and even cut interest rates next year, despite inflation continuing to rise.
Think about that for a moment.
🔥 Inflation could remain a problem. 🔥 The Fed could still move toward easier monetary policy. 🔥 More liquidity could flow into financial markets.
If this scenario plays out, it could create a very different market environment for stocks, gold, Bitcoin, and the wider crypto market.
But there’s a catch: if inflation stays high, the Fed could face a difficult choice between fighting rising prices and supporting the economy.
Will Warsh stick to a tough inflation policy, or will the Fed eventually change direction?
The next move could matter a lot for investors.
#FedWatch #EarningsSeason #USMidtermElections #BrazilCryptoExchangesMustApplyForLicensesByFriday #StanDruckenmillerBecomesInvestorInTradeXYZ
Jackson Liam
·Лайков: 4
·Просмотров: 8.4k
EarningsSeason
Просмотров: 6.4M
32,090 обсуждают
USMidtermElections
Просмотров: 42,628
619 обсуждают