

Uswa Abdullah
574 Публикации

Uswa Abdullah
Отправить жалобу
Заблокировать пользователя
cryptocurrency mining
Открытая сделка
Трейдер с регулярными сделками
4.9 г
3.6K+ подписок(и/а)
811 подписчиков(а)
217 понравилось
Посты
Портфель
Все
Цитирования
Активно
·
--
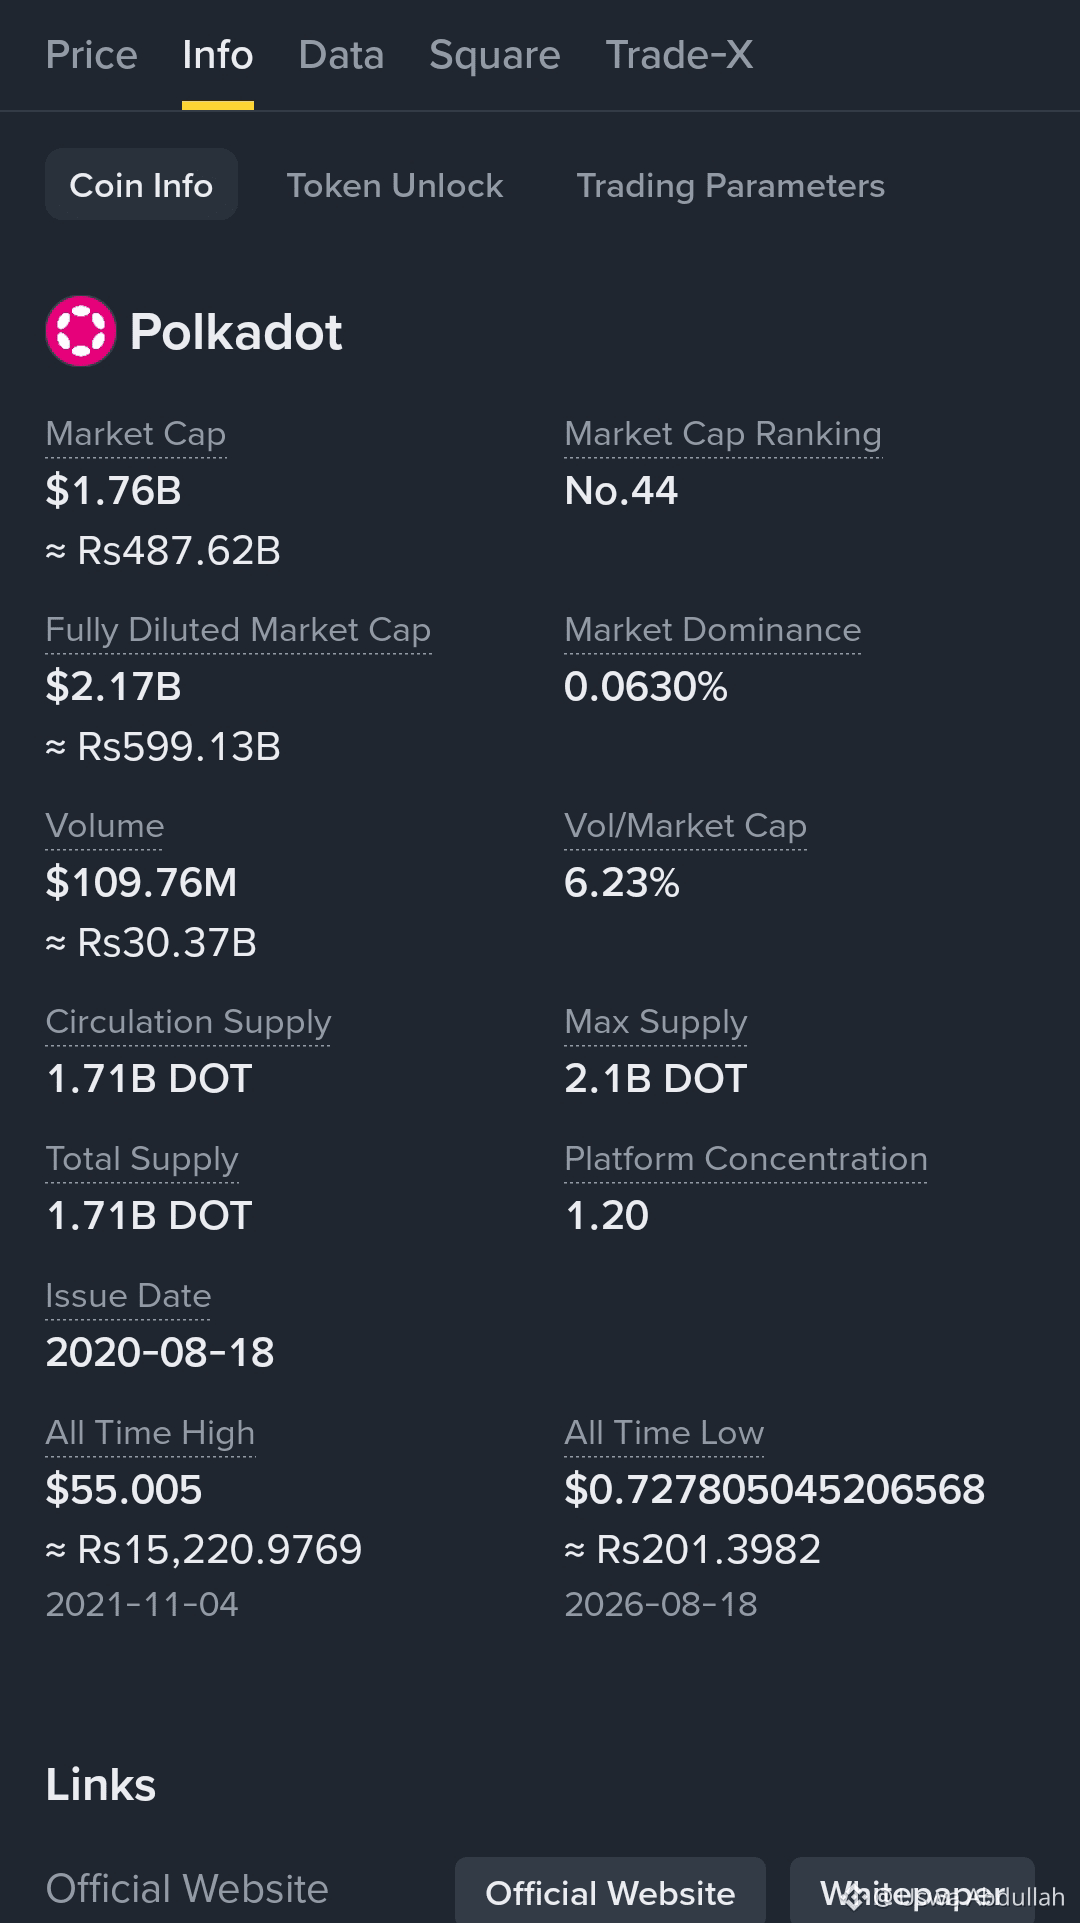
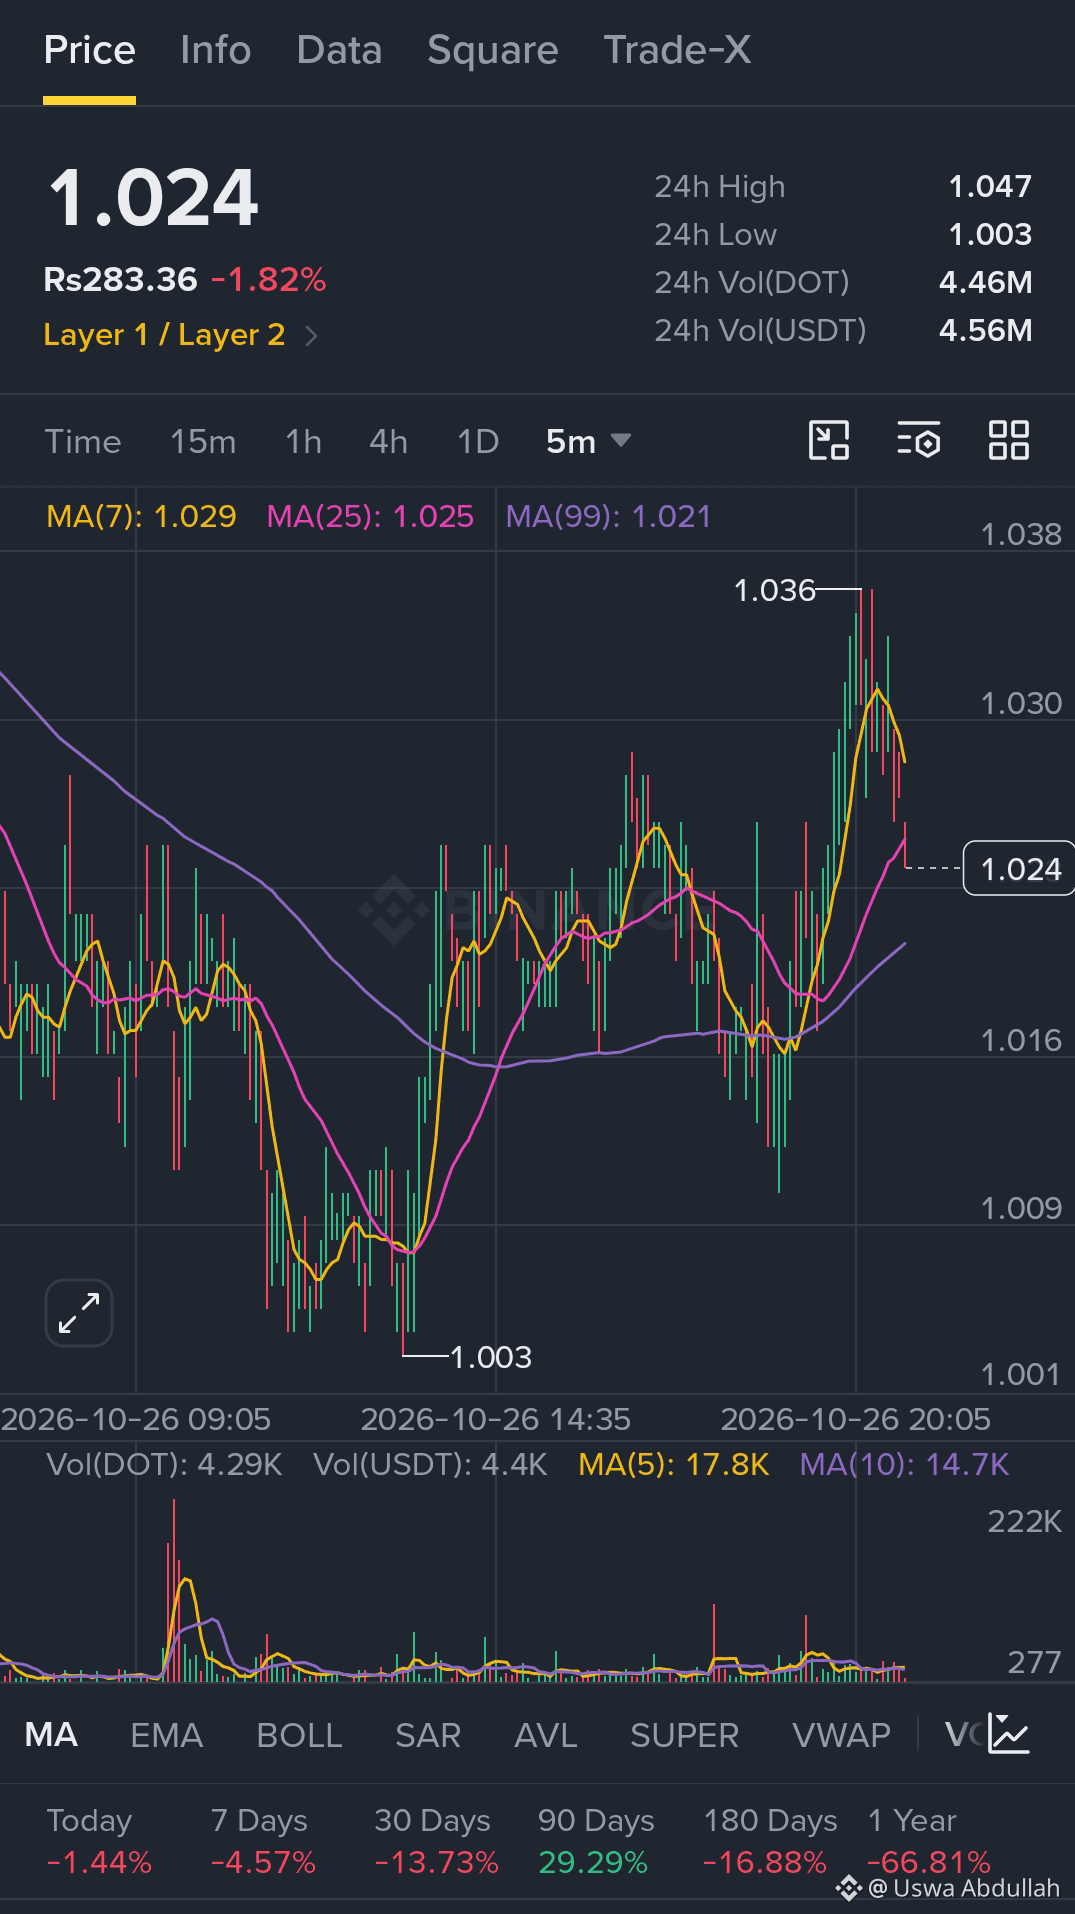
$DOT 🚀🚀 Trade Plan — TP & SL
#AllTimeHighPrice $55 🔥🔥Going to $2 soon
#BinancePick #EarningsSeason
{spot}(DOTUSDT)
Potential LONG setup
Enter only after support holds and price confirms a rebound.
Entry zone $1.010–$1.025
TP1 $1.045
TP2 $1.060
TP3 $1.089
Stop-loss $0.998
Potential SHORT setup
Consider only if $DOT breaks support and confirms a bearish retest.
Entry: $1.004–$1.010 after confirmation
TP1: $0.990
TP2: $0.963
Stop-loss: $1.025
📈 Short Analysis Article
$DOT: Bears Still Have Control — Can Bulls Recover?
Polkadot ($DOT ) is facing short-term selling pressure as traders watch the $1.00 support zone. A recovery above $1.045 could open the door toward $1.089, while a confirmed breakdown below $1.006 may expose $0.963.
Bullish trigger: Break and hold above $1.045 with strong volume.
Bearish trigger: Lose $1.006 and fail to reclaim it.
Final outlook: Cautious until #DOT_UPDATE confirms a breakout. Avoid entering solely on price predictions, and keep position sizes appropriate for the risk.
#DOT #Polkadot #CryptoAnalysis #TP_SL #BinanceSquare #CryptoTrading
$DOT 🚀🚀 Trade Plan — TP & SL
#AllTimeHighPrice $55 🔥🔥Going to $2 soon
#BinancePick #EarningsSeason
Potential LONG setup
Enter only after support holds and price confirms a rebound.
Entry zone $1.010–$1.025
TP1 $1.045
TP2 $1.060
TP3 $1.089
Stop-loss $0.998
Potential SHORT setup
Consider only if $DOT breaks support and confirms a bearish retest.
Entry: $1.004–$1.010 after confirmation
TP1: $0.990
TP2: $0.963
Stop-loss: $1.025
📈 Short Analysis Article
$DOT : Bears Still Have Control — Can Bulls Recover?
Polkadot ($DOT ) is facing short-term selling pressure as traders watch the $1.00 support zone. A recovery above $1.045 could open the door toward $1.089, while a confirmed breakdown below $1.006 may expose $0.963.
Bullish trigger: Break and hold above $1.045 with strong volume.
Bearish trigger: Lose $1.006 and fail to reclaim it.
Final outlook: Cautious until #DOT_UPDATE confirms a breakout. Avoid entering solely on price predictions, and keep position sizes appropriate for the risk.
#DOT #Polkadot #CryptoAnalysis #TP_SL #BinanceSquare #CryptoTrading
14
·
--
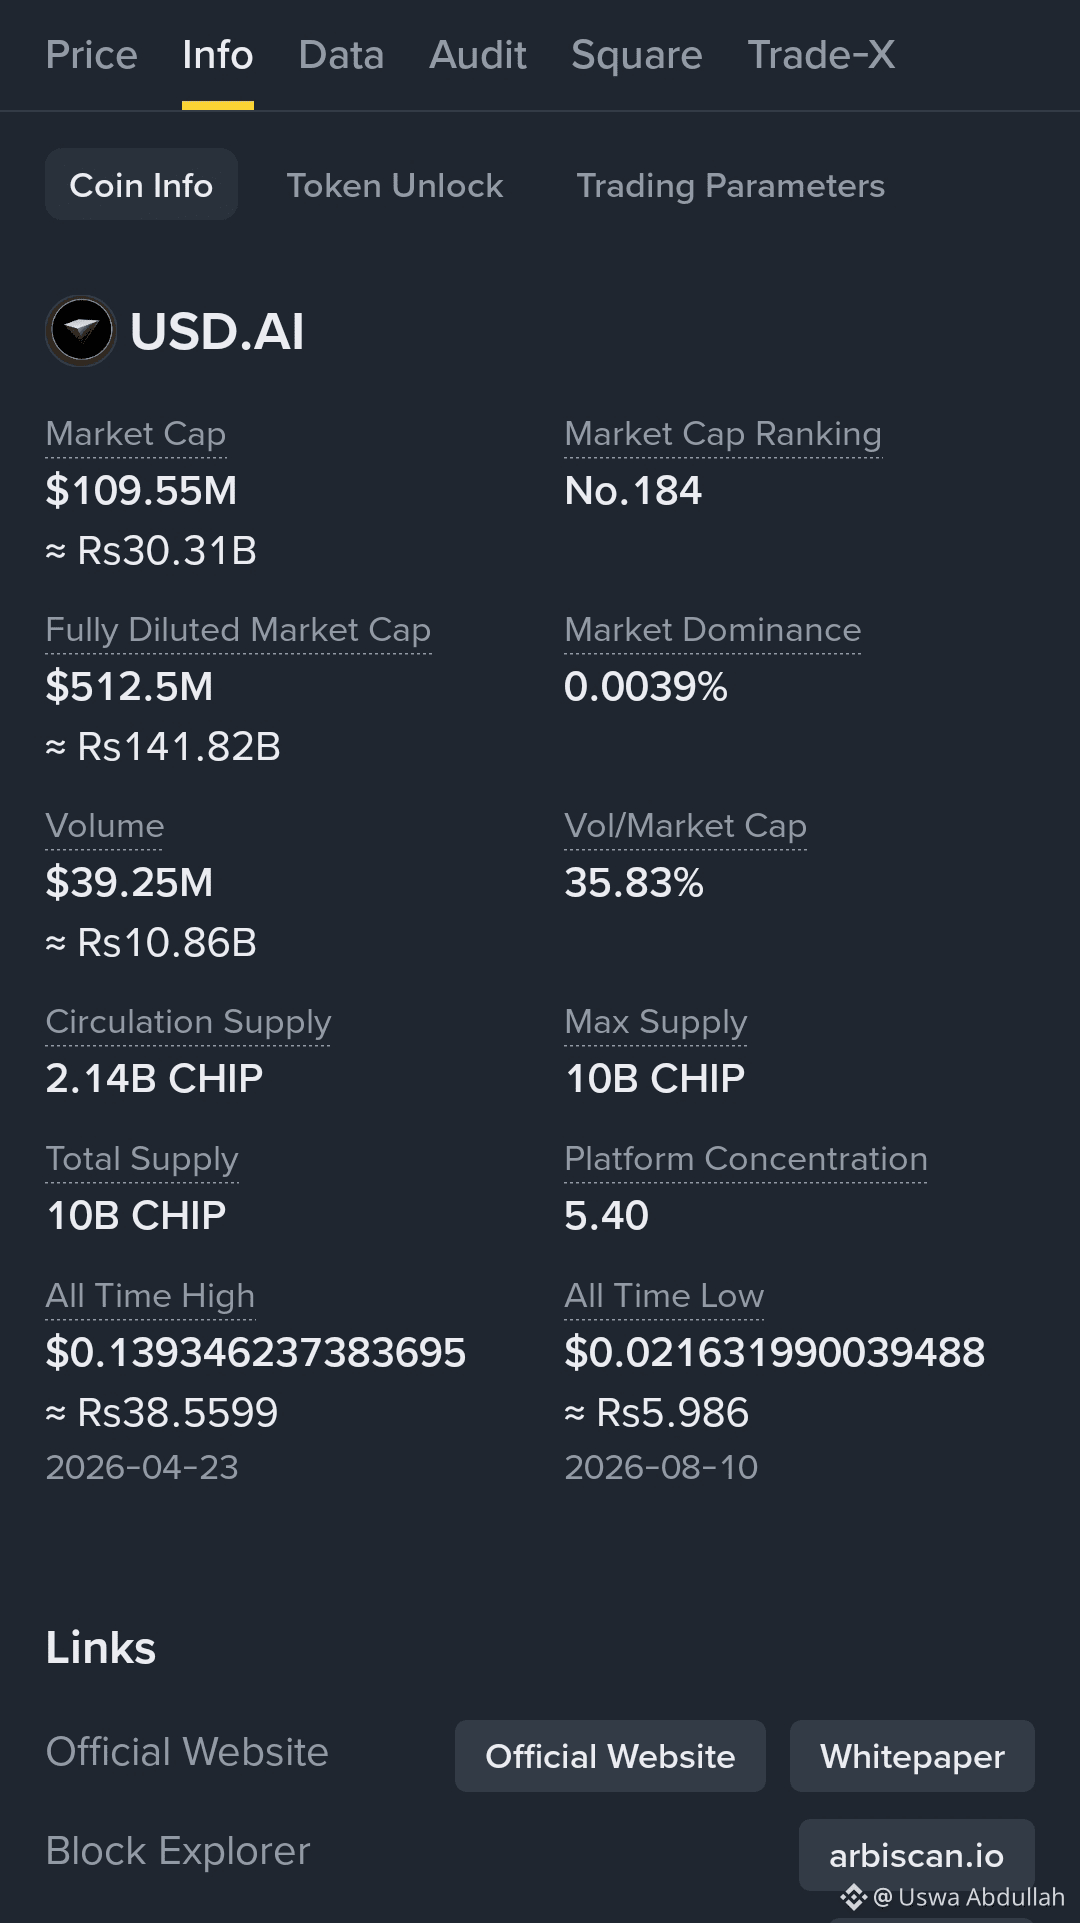
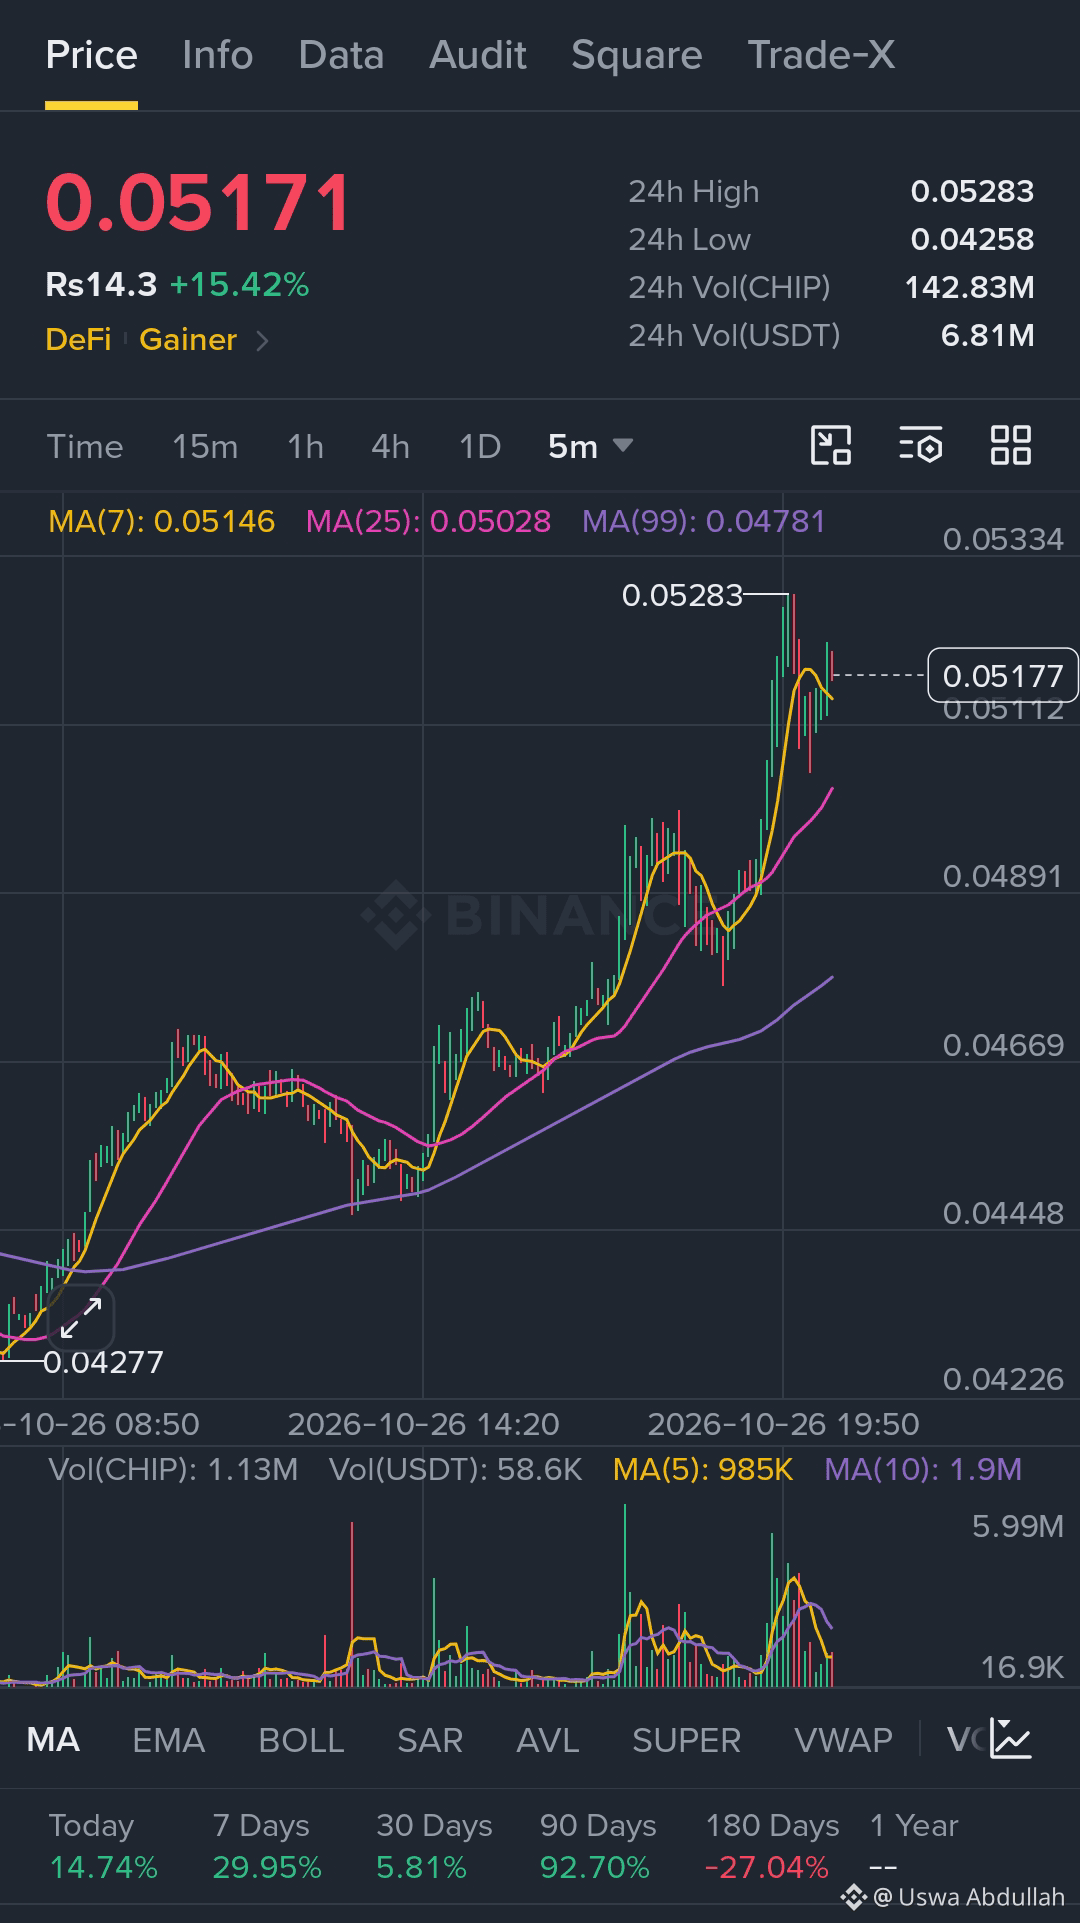
$CHIP #HotTrends 🚀🚀🔥
#AllTimeHighPrice $0.1
#BinancePick
{spot}(CHIPUSDT)
Lower support $0.0450
important Levels to Watch
Level Price
Resistance 2 $0.0590
Resistance 1 $0.0543
Support 1 $0.0512
Support 2 $0.0495
Lower support $0.0450
🐂 Bullish Scenario
A sustained hourly close above $0.0543 with increasing volume could open the way toward $0.0590 and potentially $0.0650.
🐻 Bearish Scenario
A break below $0.0512 could expose $0.0495 and then the $0.0450 area.
⚠️ Final Verdict
$CHIP is attempting a recovery, but volatility remains high. Watch the $0.0543 breakout level and avoid chasing sudden price spikes without confirmation.
This is market commentary, not financial advice. Always manage risk and do your own research.
#CHIP #USDAI #CryptoAnalysis #Altcoins #BinanceSquare #CryptoTrading
$CHIP #HotTrends 🚀🚀🔥
#AllTimeHighPrice $0.1
#BinancePick
Lower support $0.0450
important Levels to Watch
Level Price
Resistance 2 $0.0590
Resistance 1 $0.0543
Support 1 $0.0512
Support 2 $0.0495
Lower support $0.0450
🐂 Bullish Scenario
A sustained hourly close above $0.0543 with increasing volume could open the way toward $0.0590 and potentially $0.0650.
🐻 Bearish Scenario
A break below $0.0512 could expose $0.0495 and then the $0.0450 area.
⚠️ Final Verdict
$CHIP is attempting a recovery, but volatility remains high. Watch the $0.0543 breakout level and avoid chasing sudden price spikes without confirmation.
This is market commentary, not financial advice. Always manage risk and do your own research.
#CHIP #USDAI #CryptoAnalysis #Altcoins #BinanceSquare #CryptoTrading
9
·
--
🚀 $KAT Coin Short Analysis Today | October 26
#AllTimeHighPrice $0.02
#BinancePick
🔥 $KAT Showing Strong Momentum!
{spot}(KATUSDT)
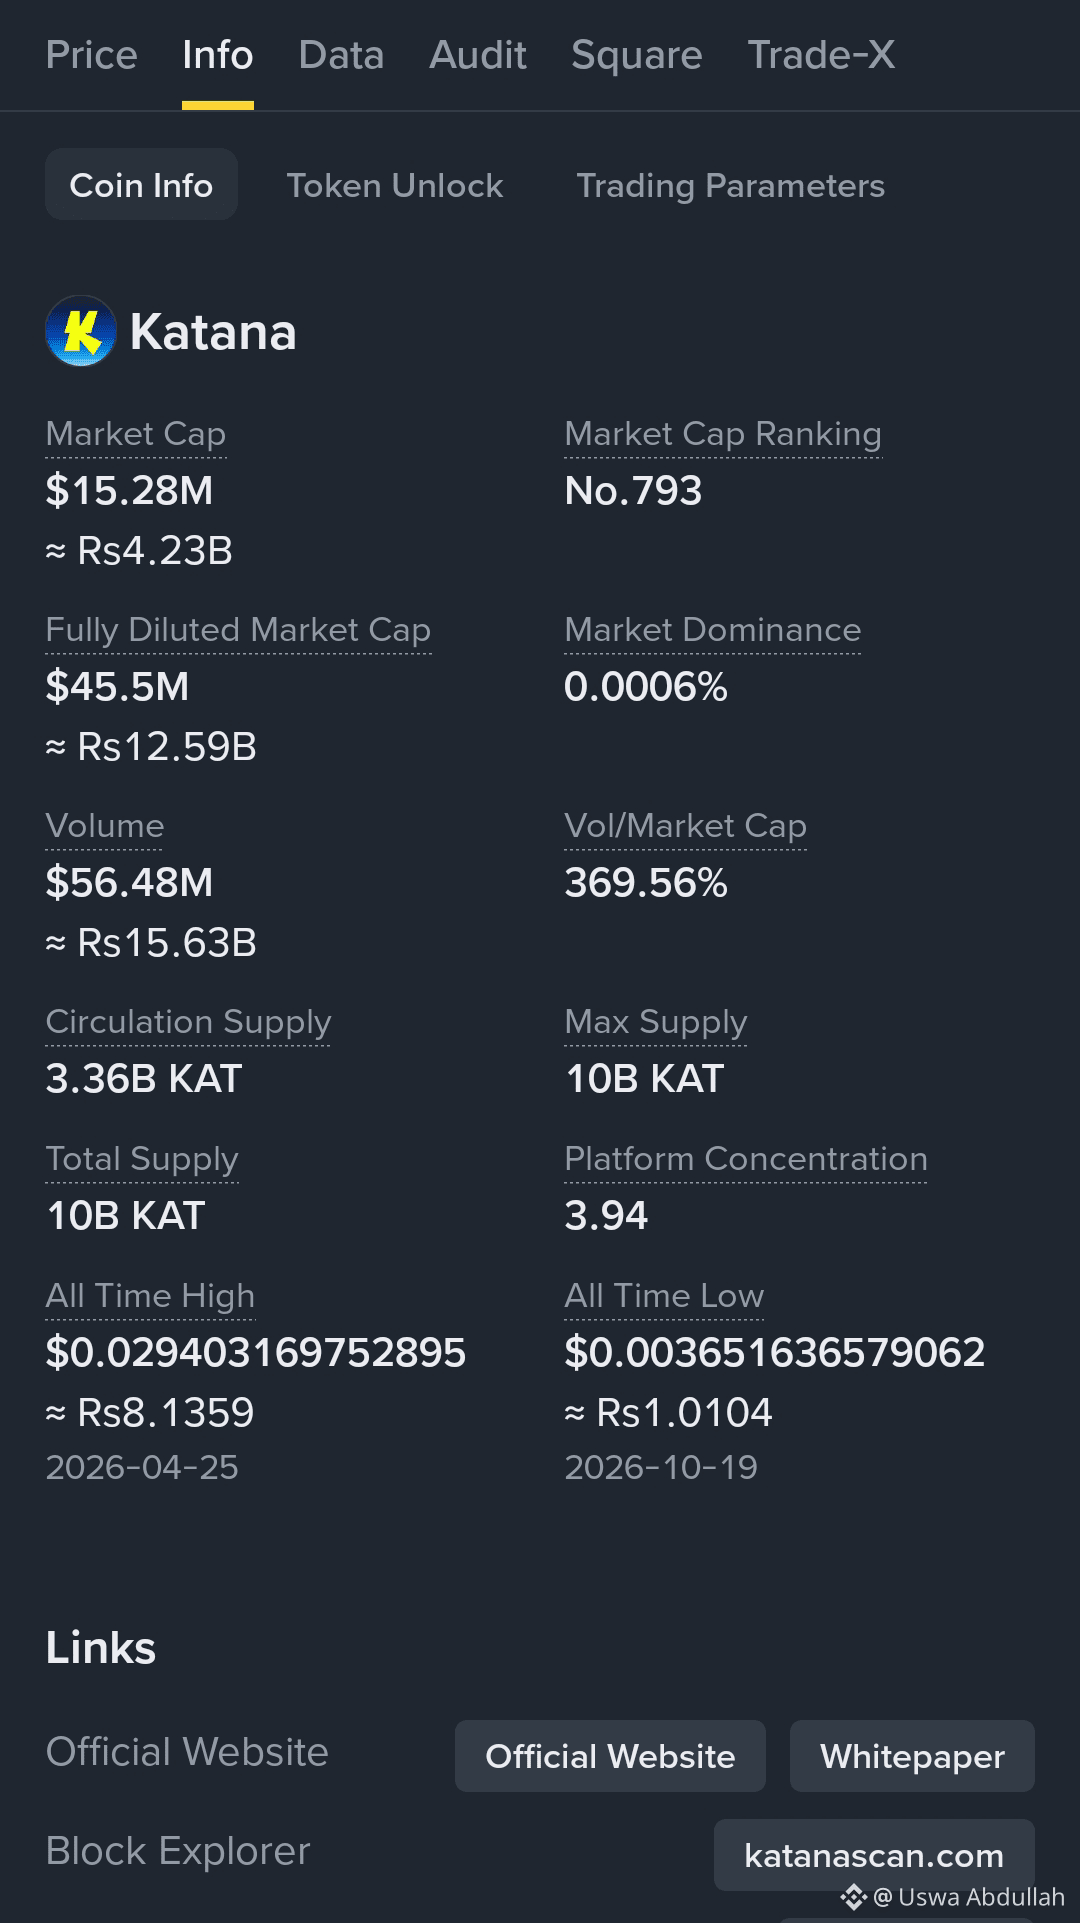
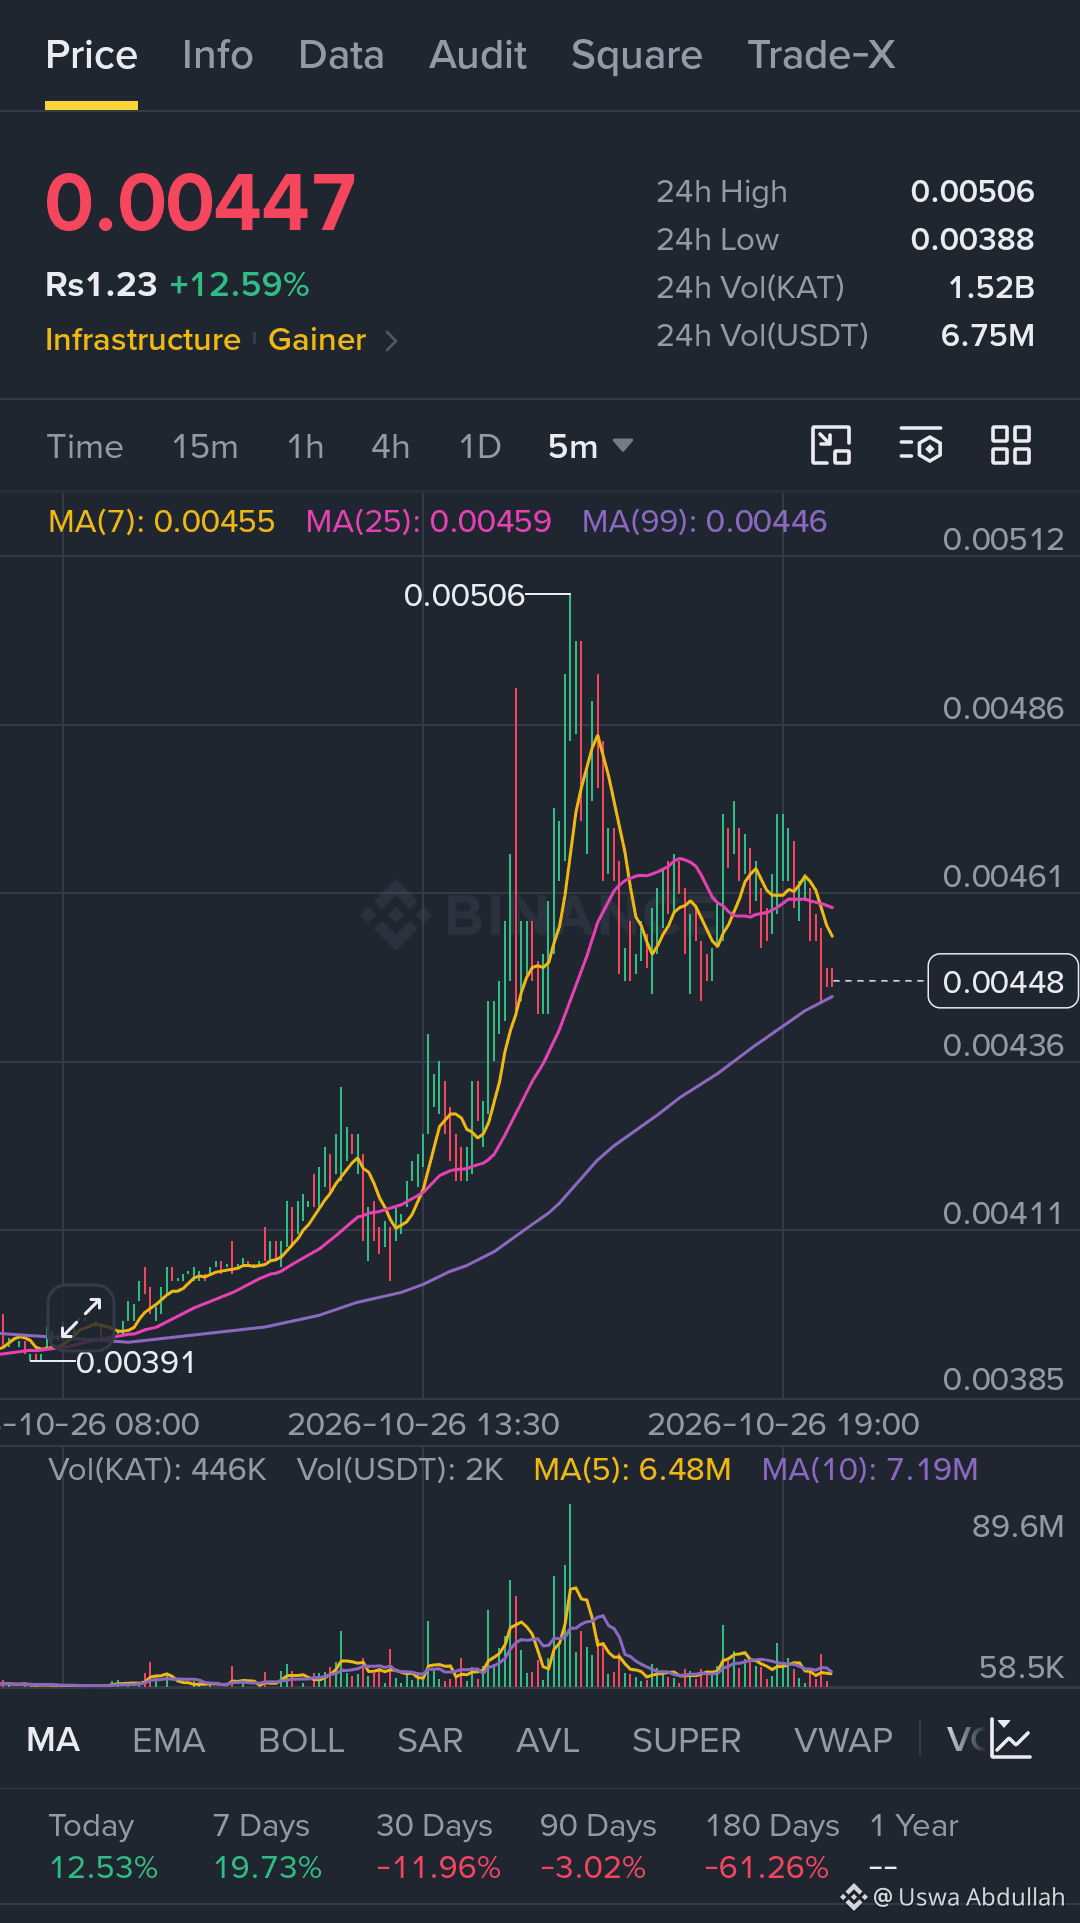
$KAT (Katana) is attracting market attention with a sharp increase in trading activity. The token recently traded around $0.00455, gaining approximately 14% over 24 hours. However, volatility remains high, so traders should watch for confirmation before entering.
📊 Key Levels to Watch
- 🟢 Support: $0.00420–$0.00400
- 🚀 Resistance: $0.00480–$0.00510
- 🎯 Bullish target: $0.00550
- 🔥 Extended target: $0.00600
- ⚠️ Bearish risk: A breakdown below $0.00400 could trigger further selling.
📈 Bullish Scenario: If #KAT breaks above $0.00510 with strong volume, another upward move may follow.
📉 Bearish Scenario: Rejection near resistance or a loss of support could lead to a pullback.
💡 My View: #KAT has positive short-term momentum, but chasing a sudden pump can be risky. Watch volume, price action, and Bitcoin's trend before making a decision.
#KAT #Katana #CryptoAnalysis #BinanceSquare #Altcoins #CryptoTrading
🚀 $KAT Coin Short Analysis Today | October 26
#AllTimeHighPrice $0.02
#BinancePick
🔥 $KAT Showing Strong Momentum!
$KAT (Katana) is attracting market attention with a sharp increase in trading activity. The token recently traded around $0.00455, gaining approximately 14% over 24 hours. However, volatility remains high, so traders should watch for confirmation before entering.
📊 Key Levels to Watch
- 🟢 Support: $0.00420–$0.00400
- 🚀 Resistance: $0.00480–$0.00510
- 🎯 Bullish target: $0.00550
- 🔥 Extended target: $0.00600
- ⚠️ Bearish risk: A breakdown below $0.00400 could trigger further selling.
📈 Bullish Scenario: If #KAT breaks above $0.00510 with strong volume, another upward move may follow.
📉 Bearish Scenario: Rejection near resistance or a loss of support could lead to a pullback.
💡 My View: #KAT has positive short-term momentum, but chasing a sudden pump can be risky. Watch volume, price action, and Bitcoin's trend before making a decision.
#KAT #Katana #CryptoAnalysis #BinanceSquare #Altcoins #CryptoTrading
10
·
--
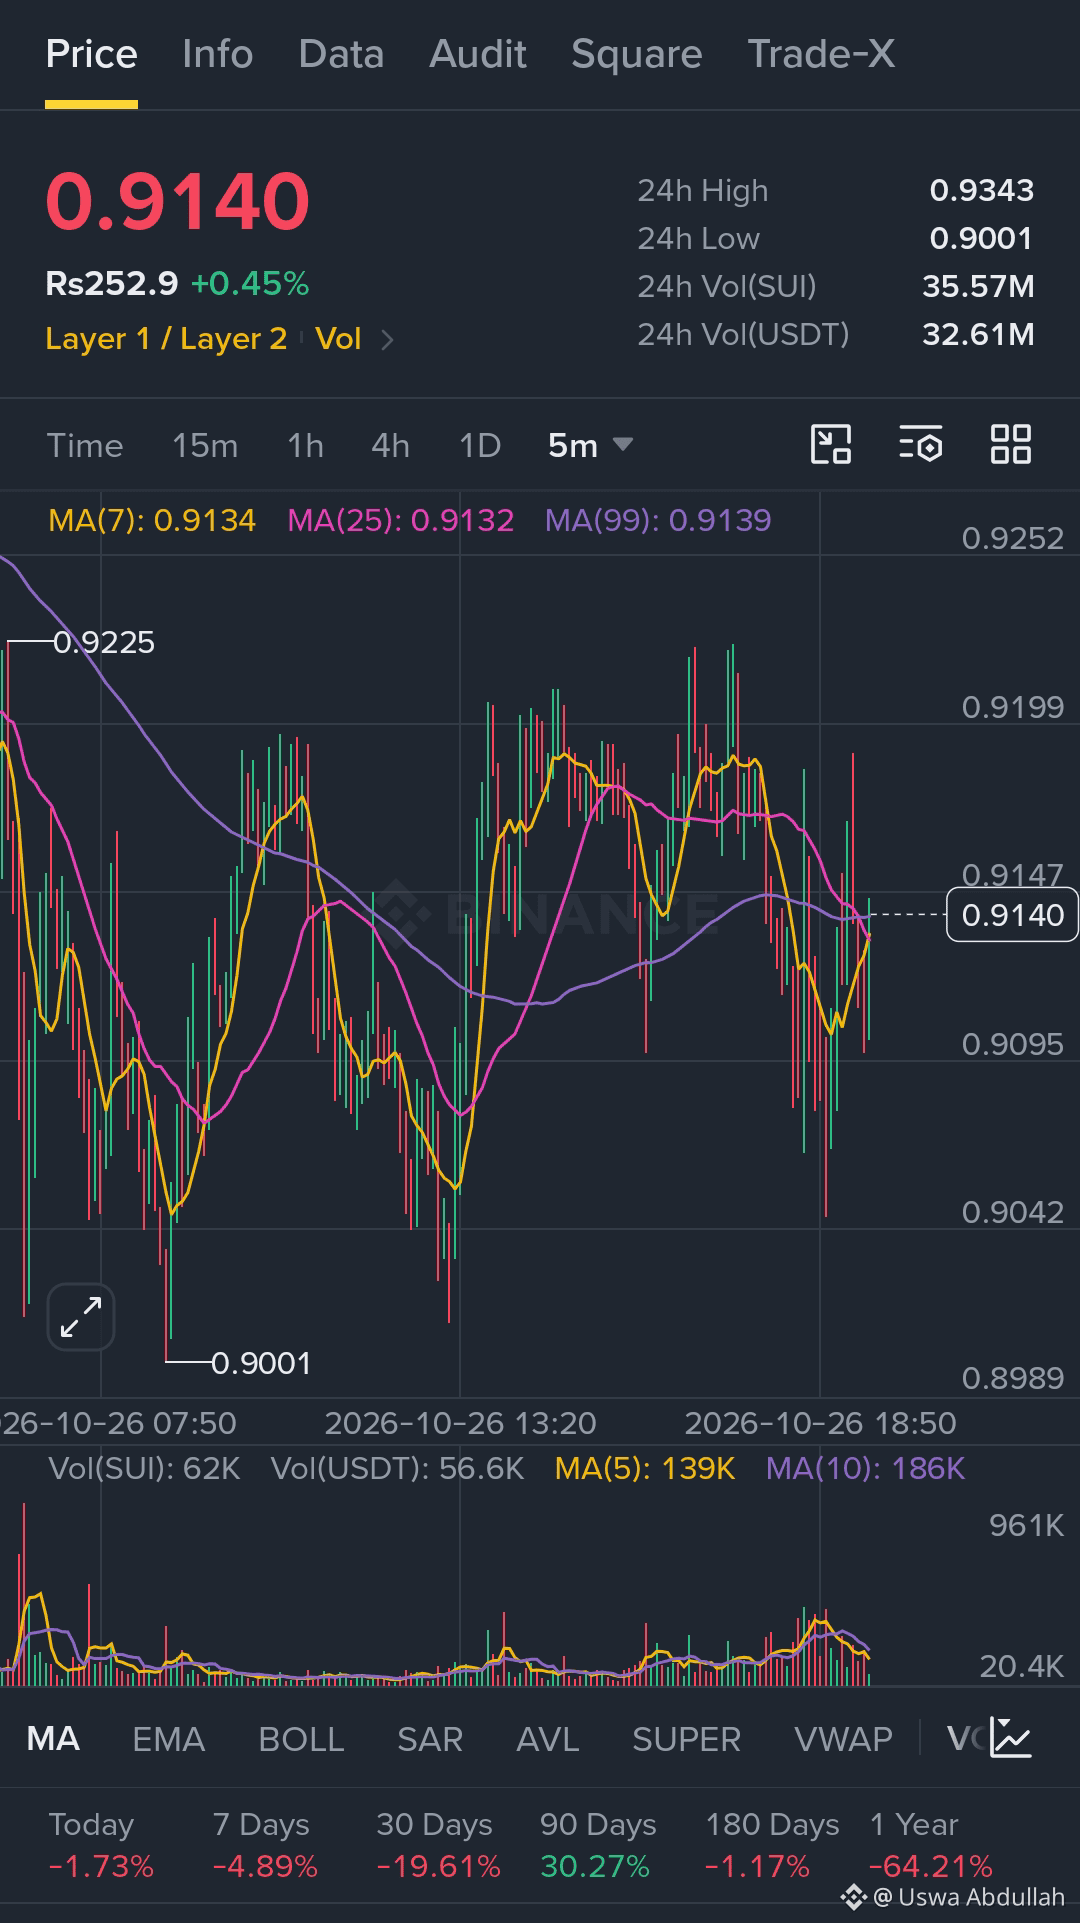
💰$SUI #TodayHotTrends 😎😎🚀🚀
#AllTimeHighprice $5.3
#BinancePick #EarningsSeason
{spot}(SUIUSDT)
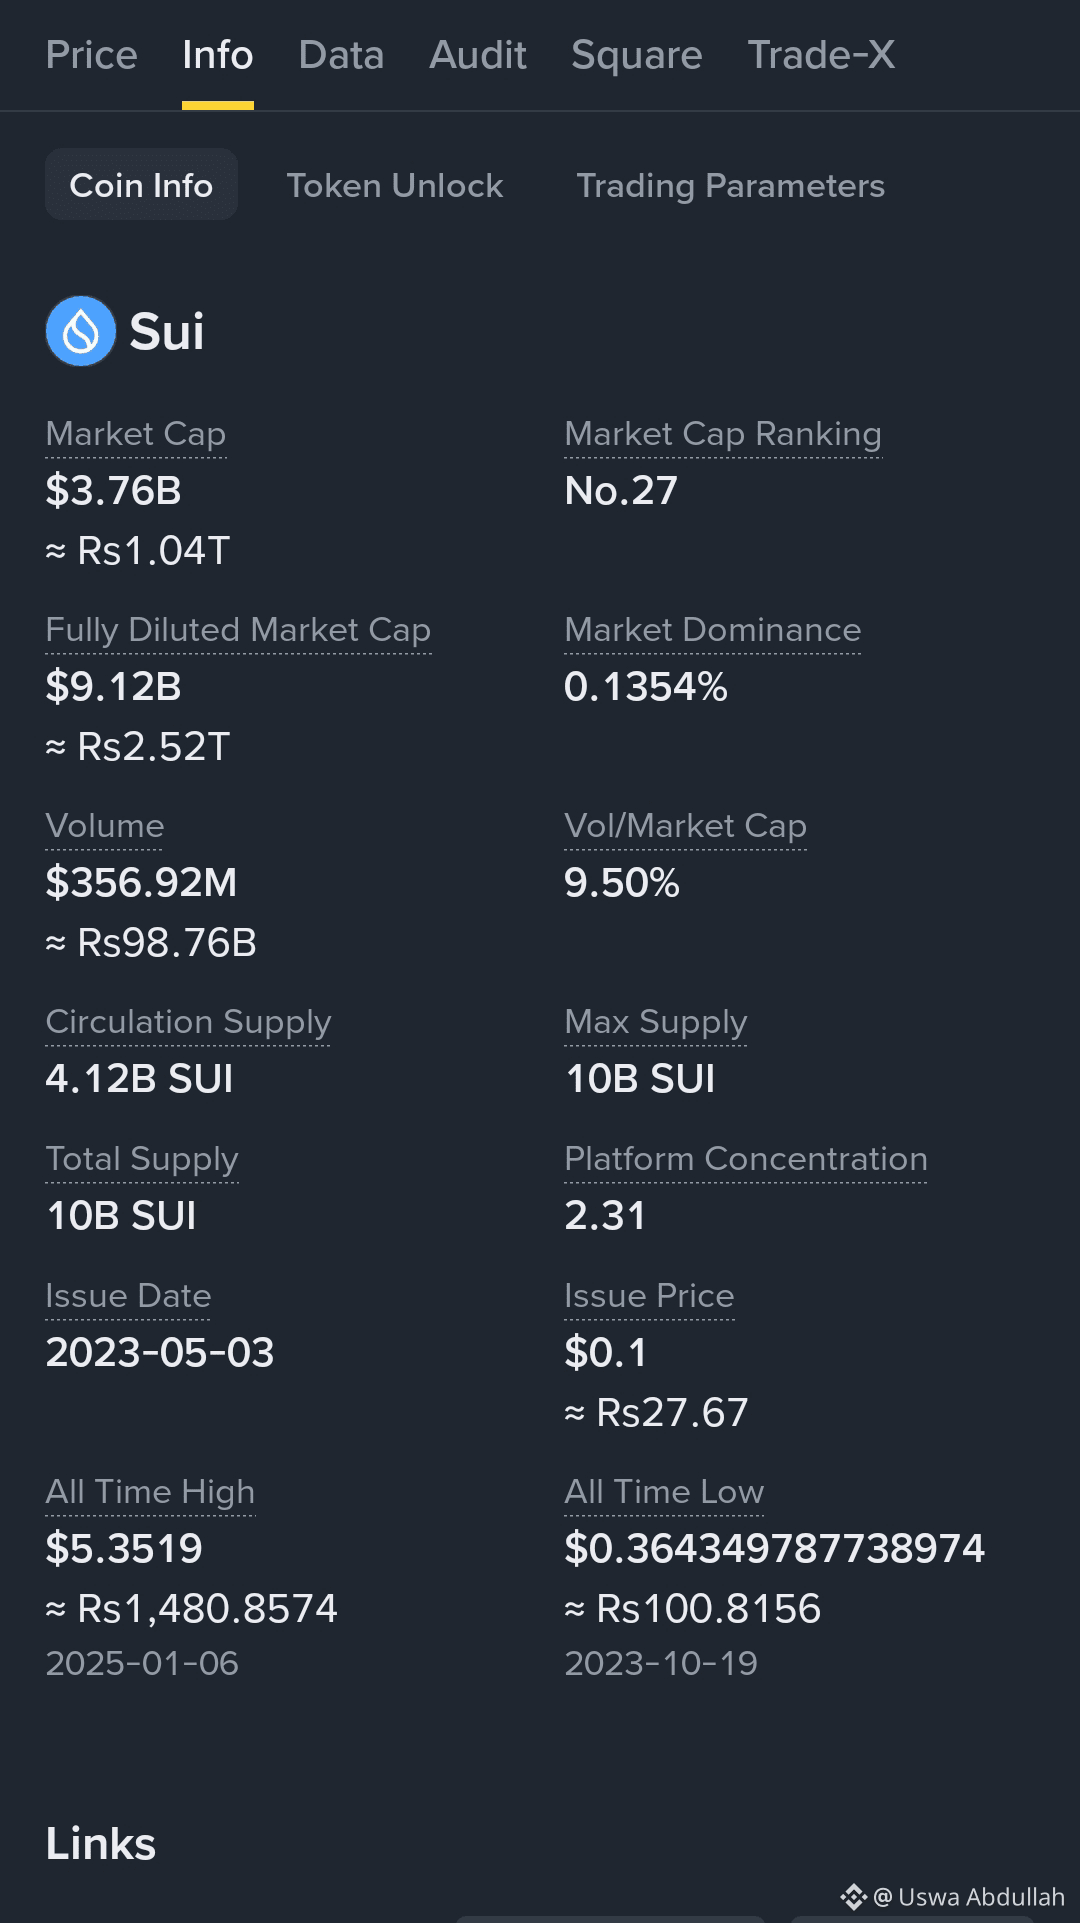
Technical analysis and price levels
Immediate support $0.85–$0.90
First resistance $0.95–$1.00
Major recovery target $1.10–$1.33
Bearish risk $0.80
Bullish scenario: $SUI holds $0.85–$0.90, buying volume increases, and price reclaims $1.00. A sustained breakout could open a path toward $1.10 and potentially $1.33.
Bearish scenario: #SUIPricePrediction loses $0.85 with strong selling volume. The next area to watch is around $0.80.
Trading approach
Avoid chasing a trade in the middle of a volatile range.
Consider a long setup only after support holds and a bullish reversal is confirmed.
Use a predefined stop-loss and manage position size carefully.
For more precise entry, take-profit (TP) and stop-loss (SL) levels, are you trading $SUI futures or spot?
💰$SUI #TodayHotTrends 😎😎🚀🚀
#AllTimeHighprice $5.3
#BinancePick #EarningsSeason
Technical analysis and price levels
Immediate support $0.85–$0.90
First resistance $0.95–$1.00
Major recovery target $1.10–$1.33
Bearish risk $0.80
Bullish scenario: $SUI holds $0.85–$0.90, buying volume increases, and price reclaims $1.00. A sustained breakout could open a path toward $1.10 and potentially $1.33.
Bearish scenario: #SUIPricePrediction loses $0.85 with strong selling volume. The next area to watch is around $0.80.
Trading approach
Avoid chasing a trade in the middle of a volatile range.
Consider a long setup only after support holds and a bullish reversal is confirmed.
Use a predefined stop-loss and manage position size carefully.
For more precise entry, take-profit (TP) and stop-loss (SL) levels, are you trading $SUI futures or spot?
8
·
--
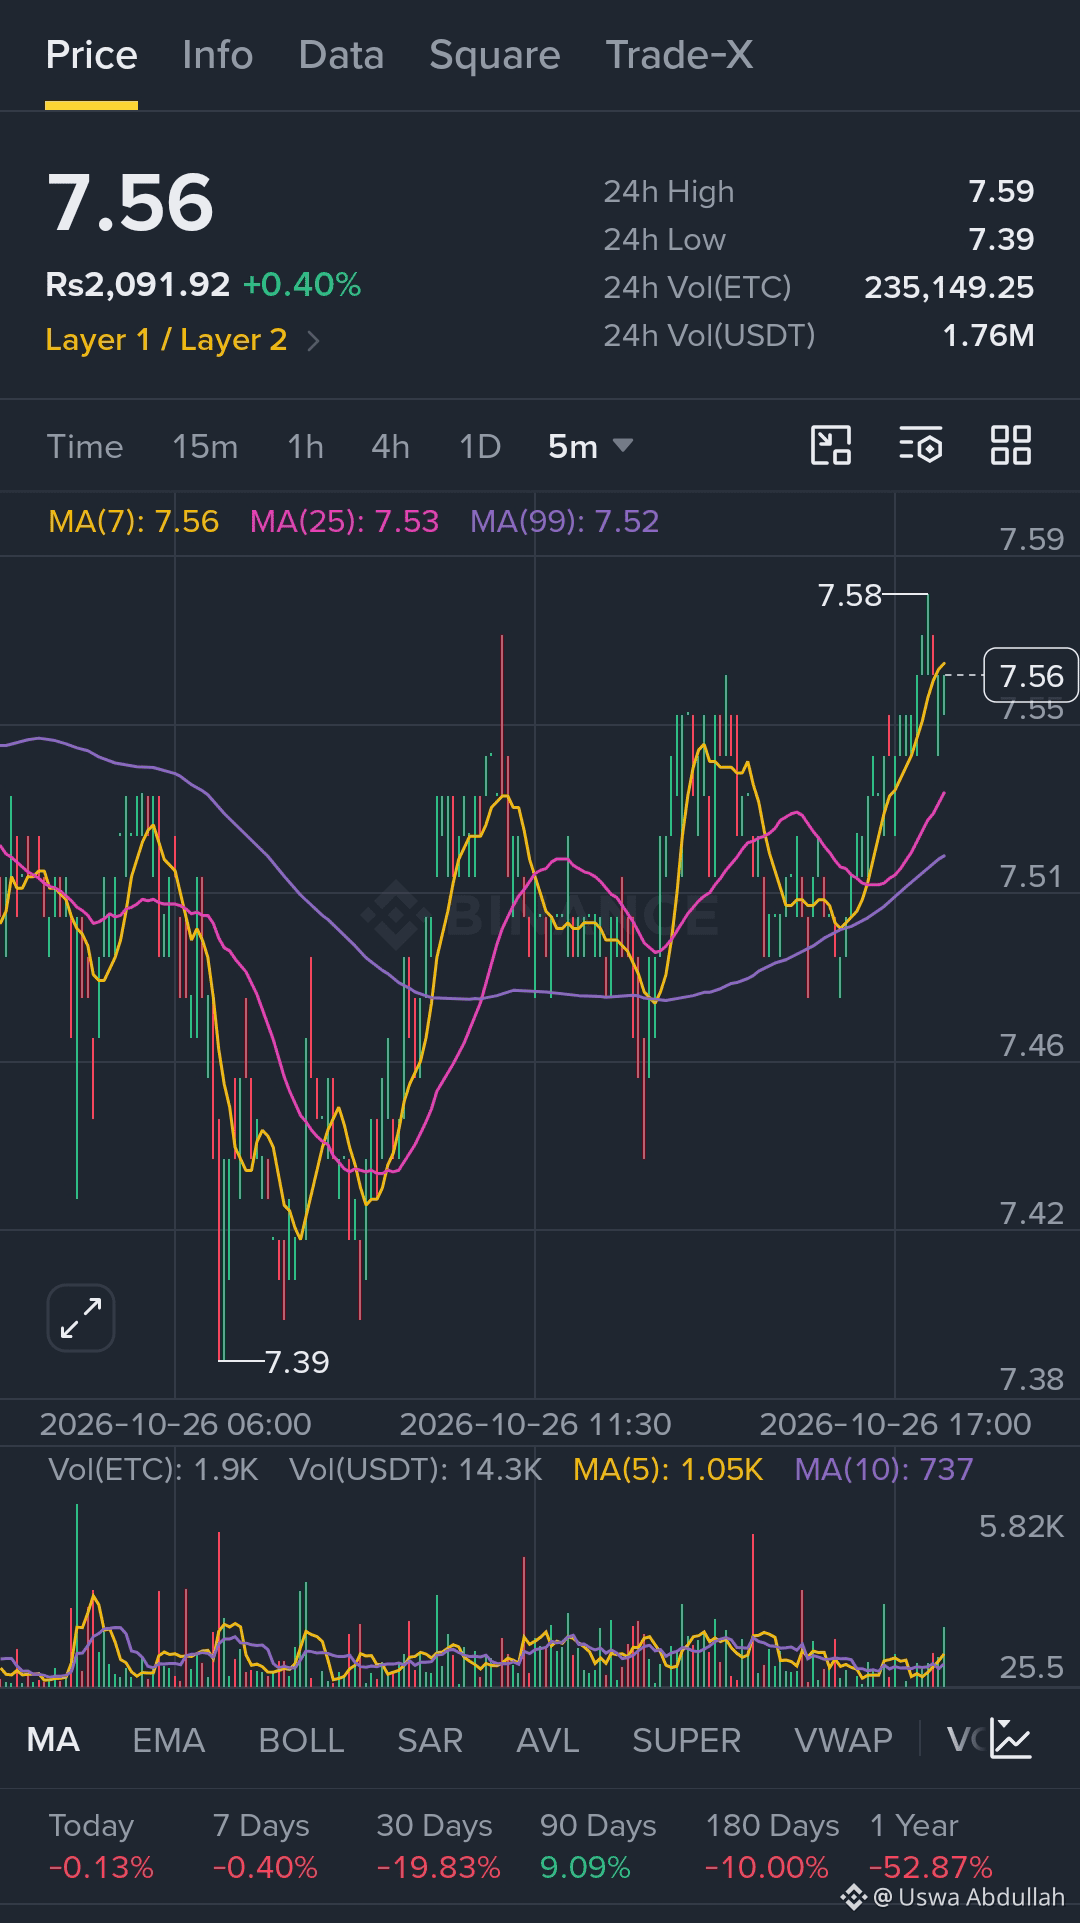
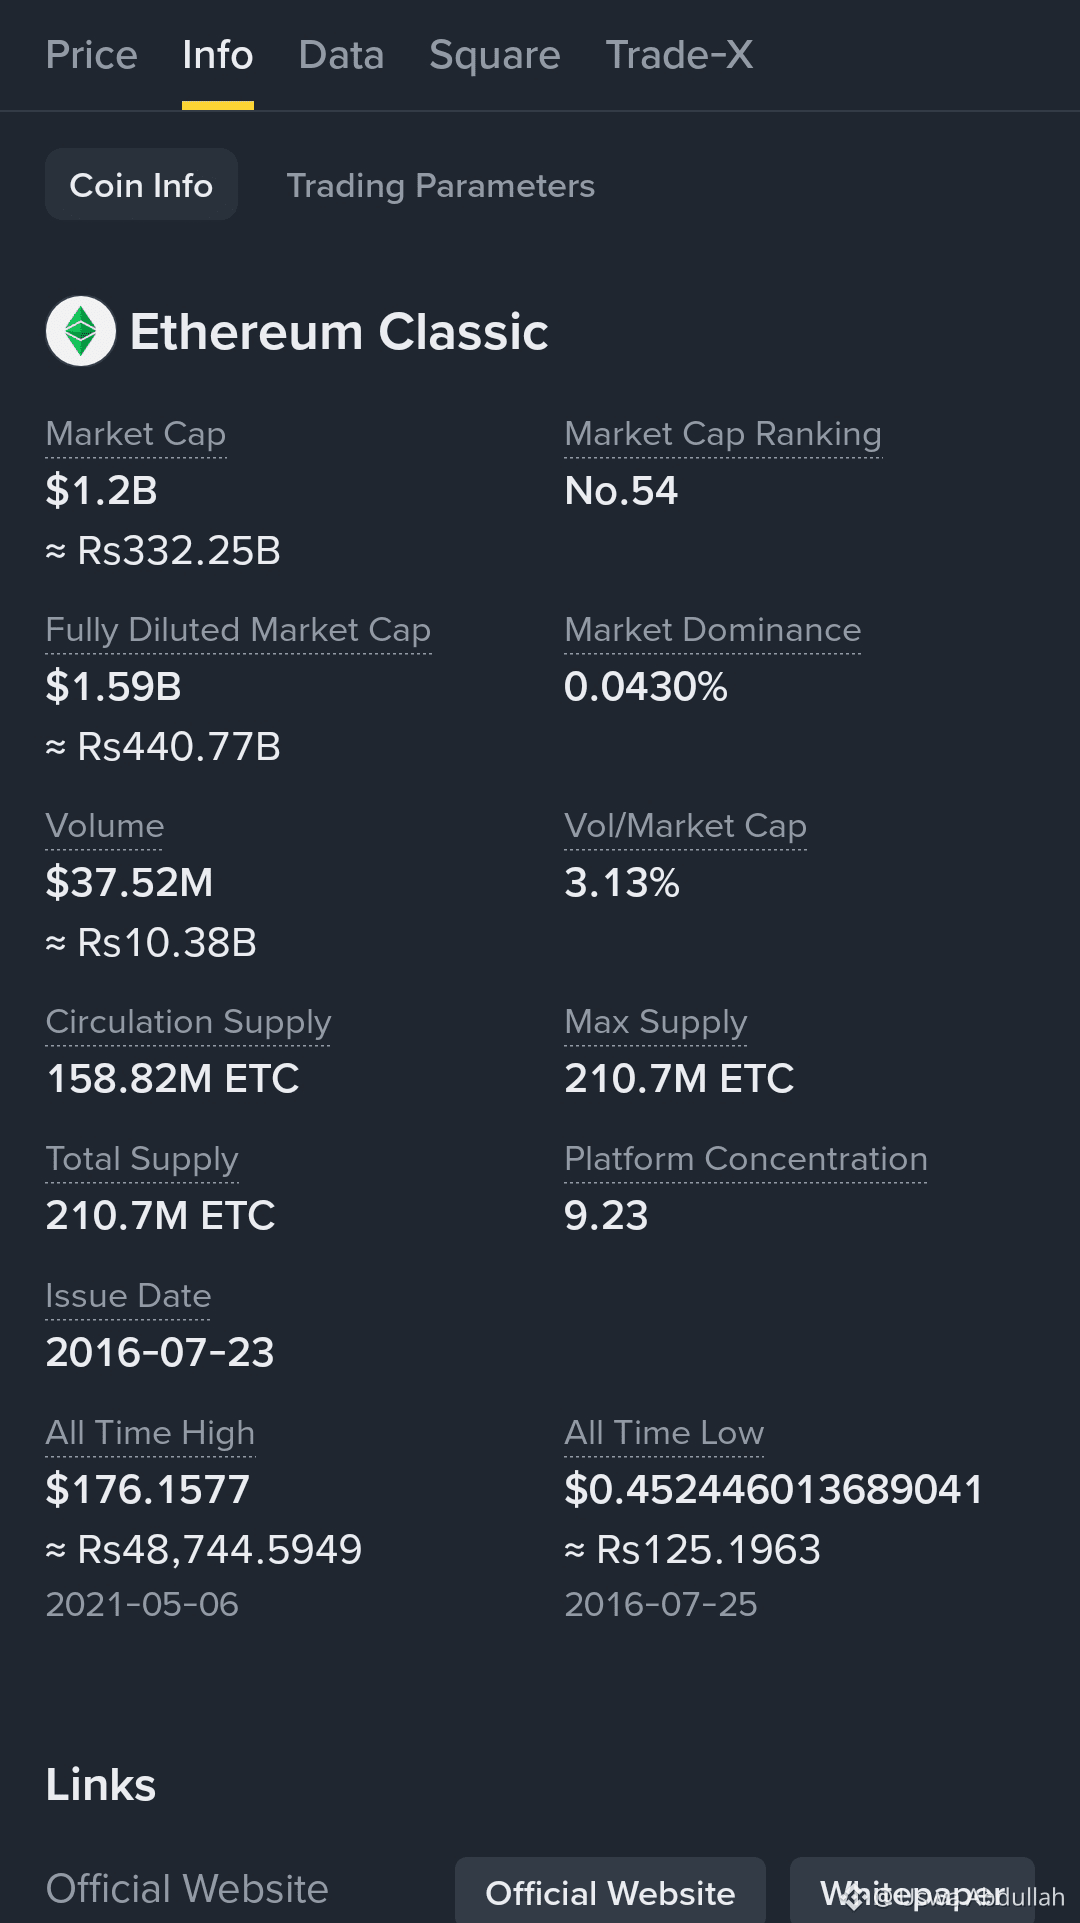
$ETC #hottrading 👇👇
#AllTimeHighPrice $176.15
#EarningsSeason #FranklinTempletonFilesForTwoDividendToBitcoinETFs
{spot}(ETCUSDT)
#ETCUSDT
$7.48–$7.60, after bearish confirmation
TP1 $7.32
TP2 $7.17
TP3 $7.09
Stop loss $7.70
These are illustrative short-trade levels based on nearby technical zones, not guaranteed outcomes. Confirm price action before entry.
🐻 Bearish Scenario
A break below $7.32 could expose $7.17 and $7.09. Weak momentum may keep sellers in control.
🐂 Bullish Reversal Scenario
If $ETC reclaims $7.65 and holds above it, a recovery toward $7.81–$8.05 may develop.
Final Verdict: $ETC remains under bearish pressure, but a breakdown is not guaranteed. Watch the $7.32 support and $7.65 resistance for confirmation.
$ETC #hottrading 👇👇
#AllTimeHighPrice $176.15
#EarningsSeason #FranklinTempletonFilesForTwoDividendToBitcoinETFs
#ETCUSDT
$7.48–$7.60, after bearish confirmation
TP1 $7.32
TP2 $7.17
TP3 $7.09
Stop loss $7.70
These are illustrative short-trade levels based on nearby technical zones, not guaranteed outcomes. Confirm price action before entry.
🐻 Bearish Scenario
A break below $7.32 could expose $7.17 and $7.09. Weak momentum may keep sellers in control.
🐂 Bullish Reversal Scenario
If $ETC reclaims $7.65 and holds above it, a recovery toward $7.81–$8.05 may develop.
Final Verdict: $ETC remains under bearish pressure, but a breakdown is not guaranteed. Watch the $7.32 support and $7.65 resistance for confirmation.
9
·
--
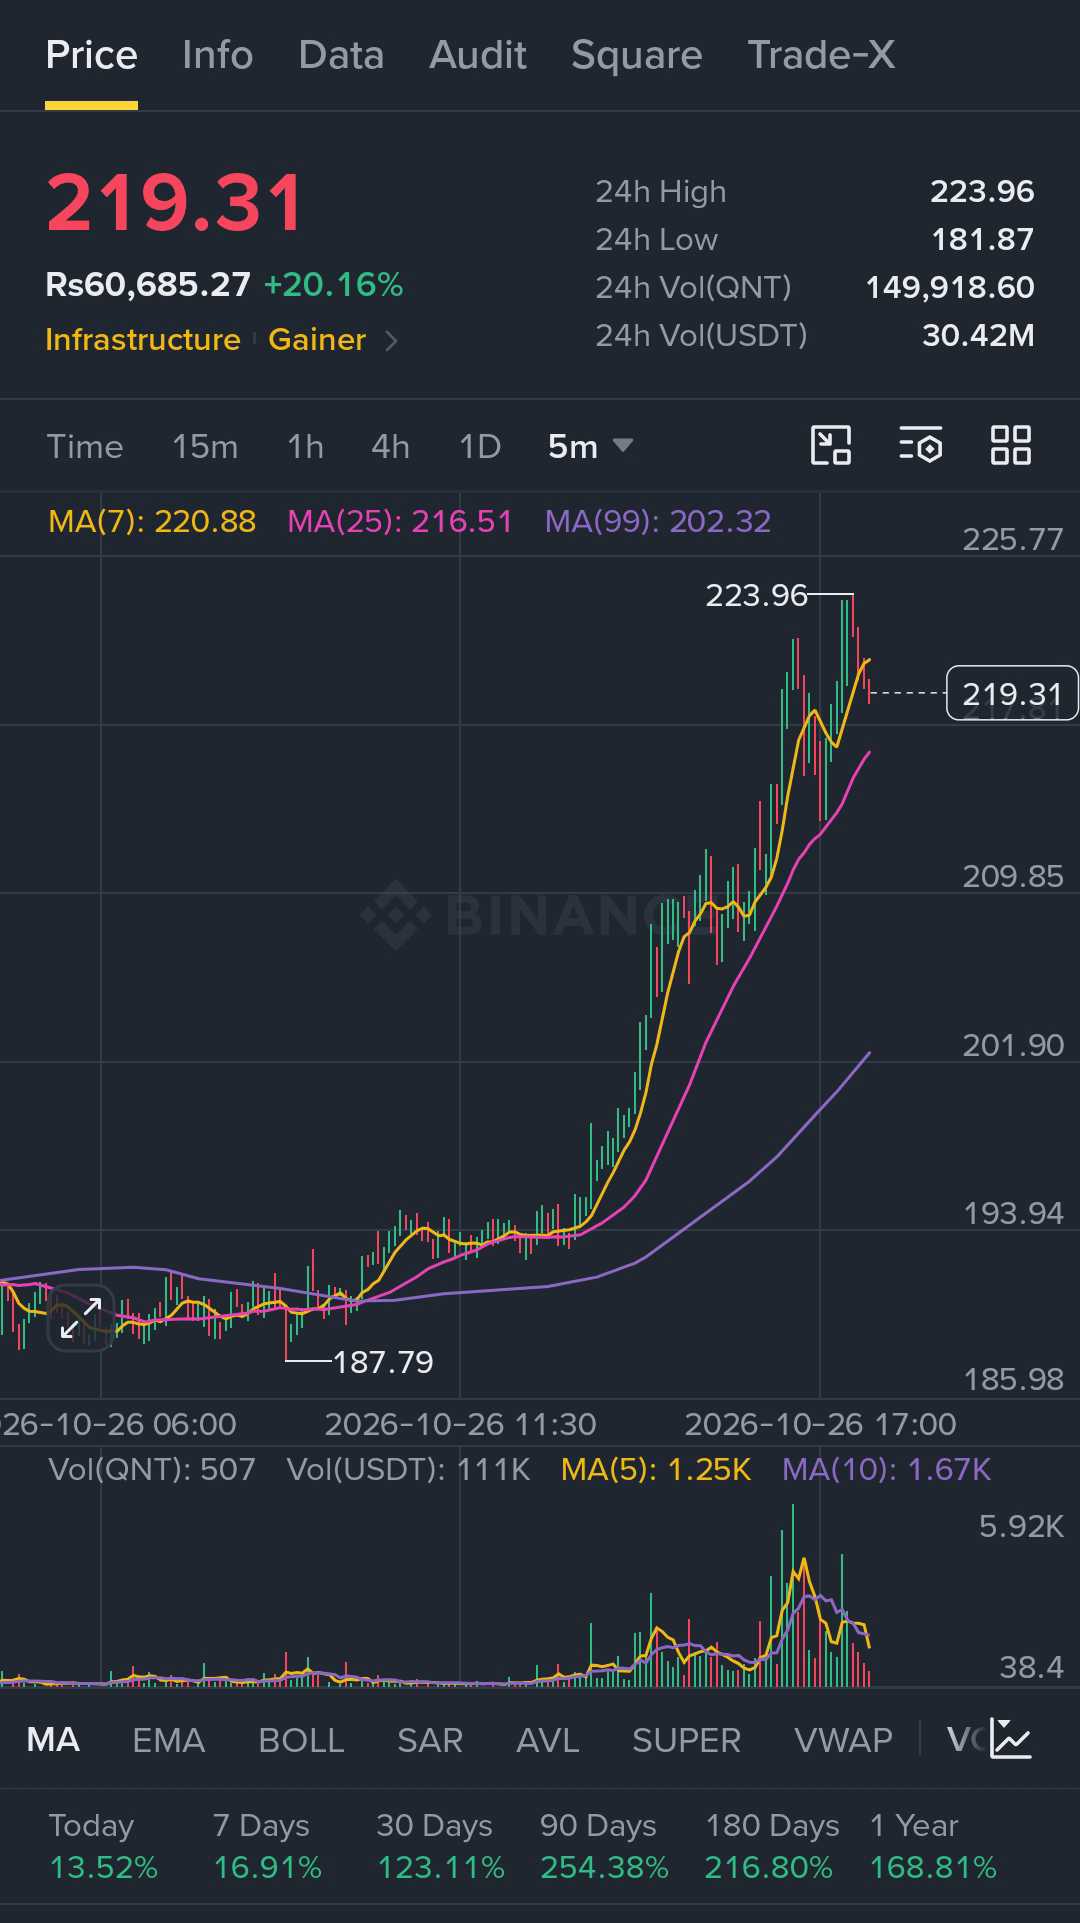
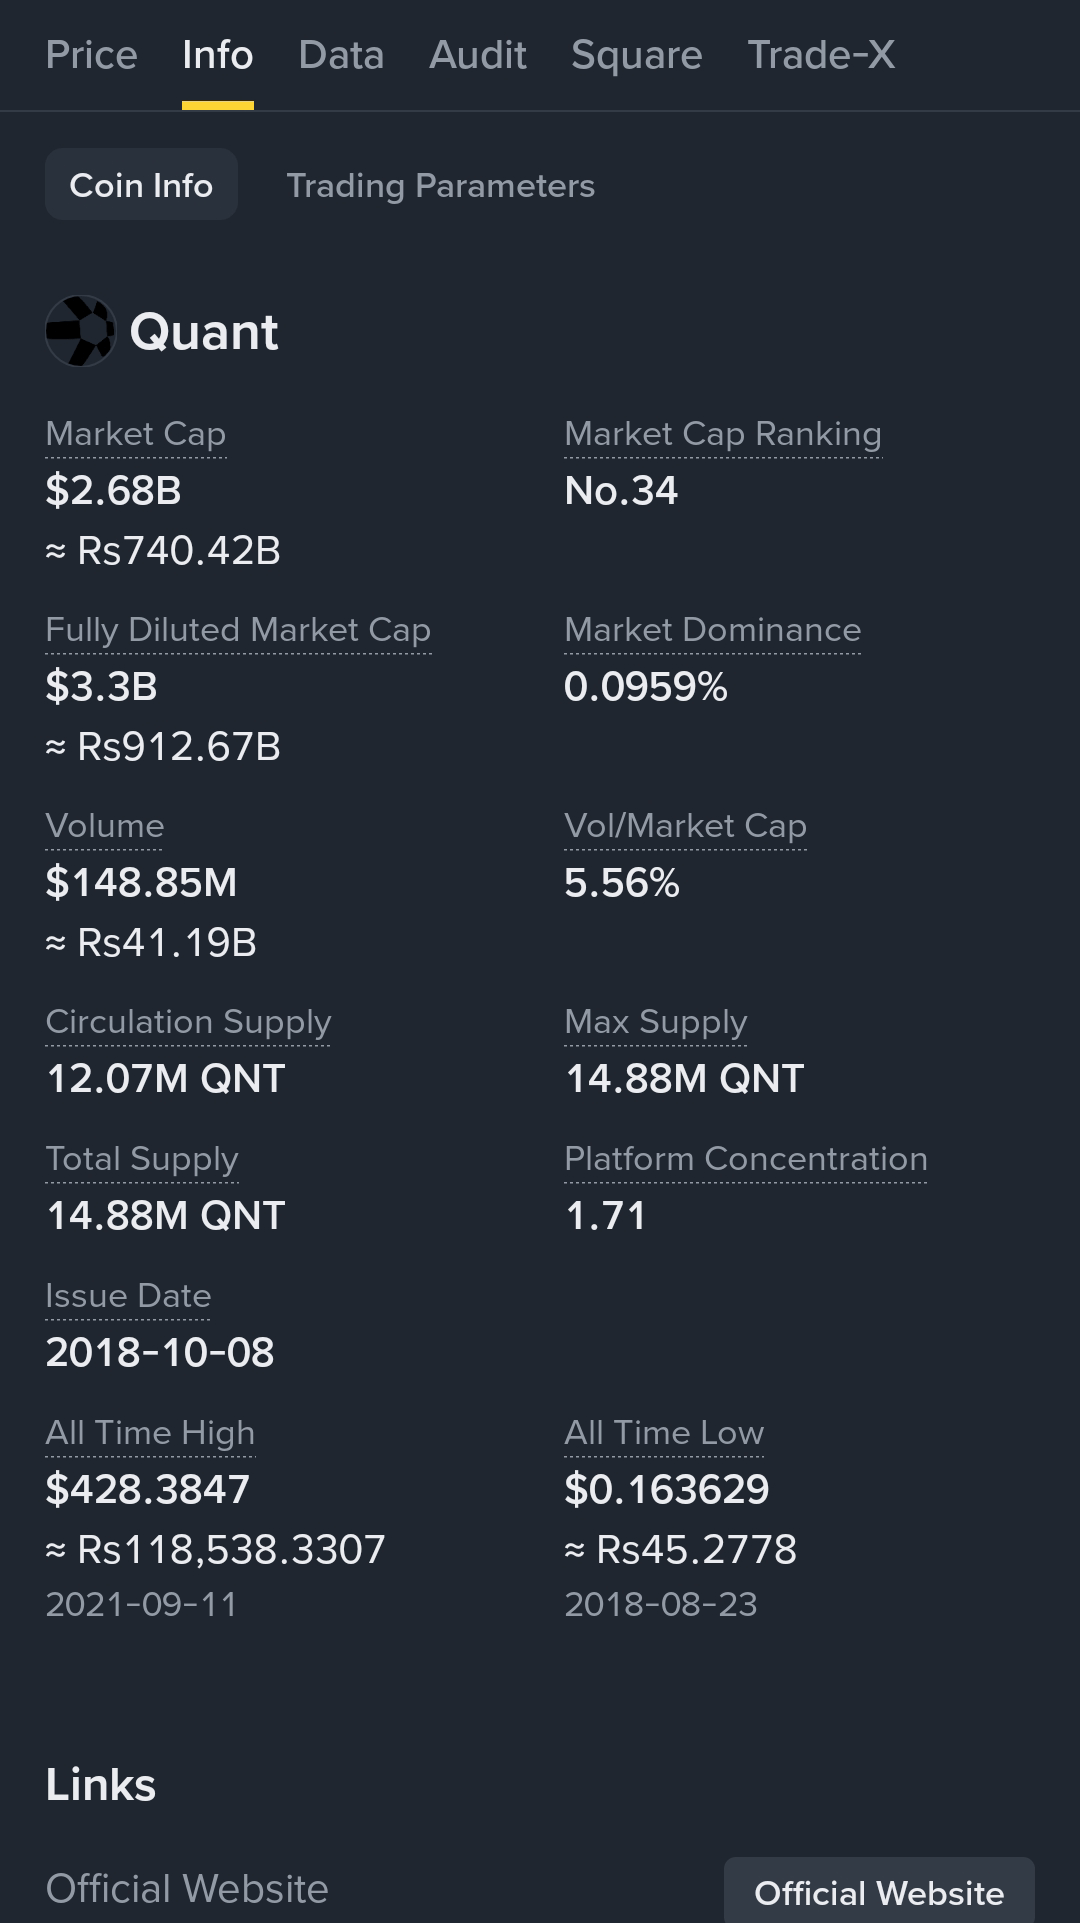
$QNT #TodayHotTrends 😎😎
#AllTimeHighPrice $428.3
#BinancePick #EarningsSeason
{spot}(QNTUSDT)
Coin Short Analysis Today — Bulls Target $200!
Quant (QNT) is showing a strong recovery attempt today, with recent reports placing its price around $189–$194. Buyers are trying to push toward the $200 resistance zone, but confirmation is still needed.
📊 Key Levels to Watch
Current trend: Short-term recovery, with volatility remaining high.
Resistance 1: $198–$200
Resistance 2: $210–$225
Support 1: $182–$185
Support 2: $171–$178
If QNT fails to break resistance and drops below $182, sellers could push the price toward $178 or $171.
🎯 Trading Plan — Example Levels
Setup Price
Entry zone $184–$189
Take Profit 1 $198
Take Profit 2 $208
Take Profit 3 $216
Take profit 4 $225
Stop Loss $179
$QNT #TodayHotTrends 😎😎
#AllTimeHighPrice $428.3
#BinancePick #EarningsSeason
Coin Short Analysis Today — Bulls Target $200!
Quant (QNT) is showing a strong recovery attempt today, with recent reports placing its price around $189–$194. Buyers are trying to push toward the $200 resistance zone, but confirmation is still needed.
📊 Key Levels to Watch
Current trend: Short-term recovery, with volatility remaining high.
Resistance 1: $198–$200
Resistance 2: $210–$225
Support 1: $182–$185
Support 2: $171–$178
If QNT fails to break resistance and drops below $182, sellers could push the price toward $178 or $171.
🎯 Trading Plan — Example Levels
Setup Price
Entry zone $184–$189
Take Profit 1 $198
Take Profit 2 $208
Take Profit 3 $216
Take profit 4 $225
Stop Loss $179
6
·
--
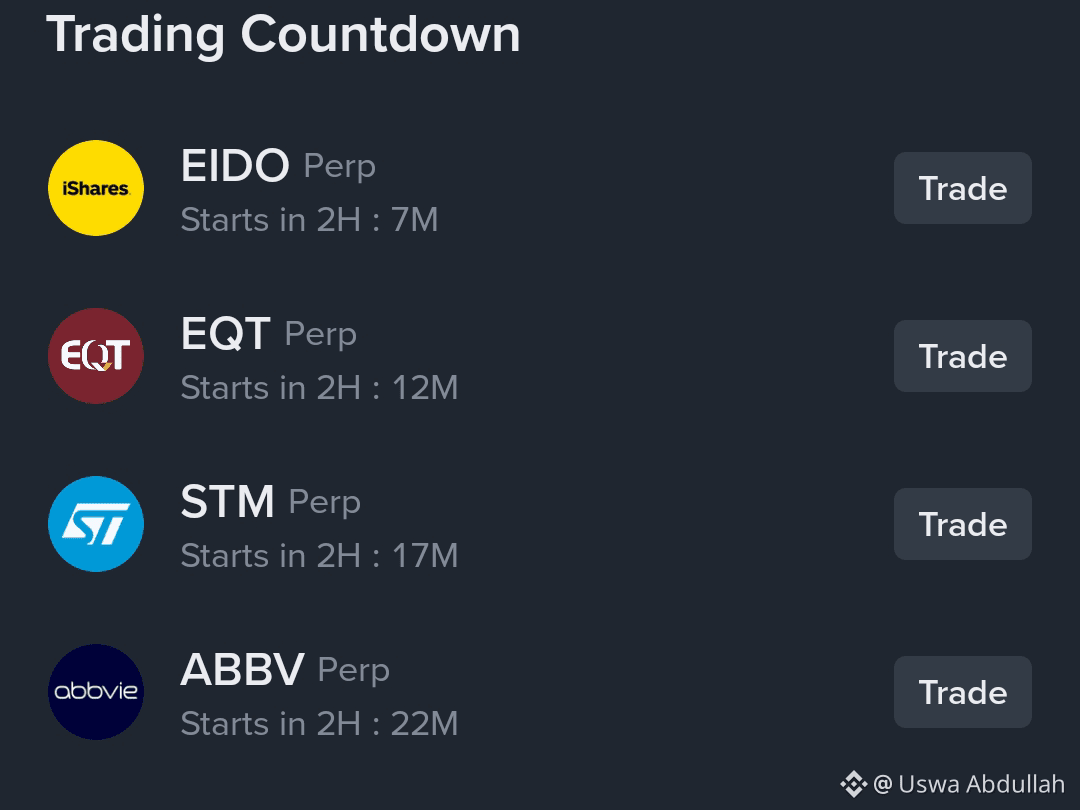
EQTUS-3,73%
EIDOETF-0,84%
STMUS+3,04%
5
·
--
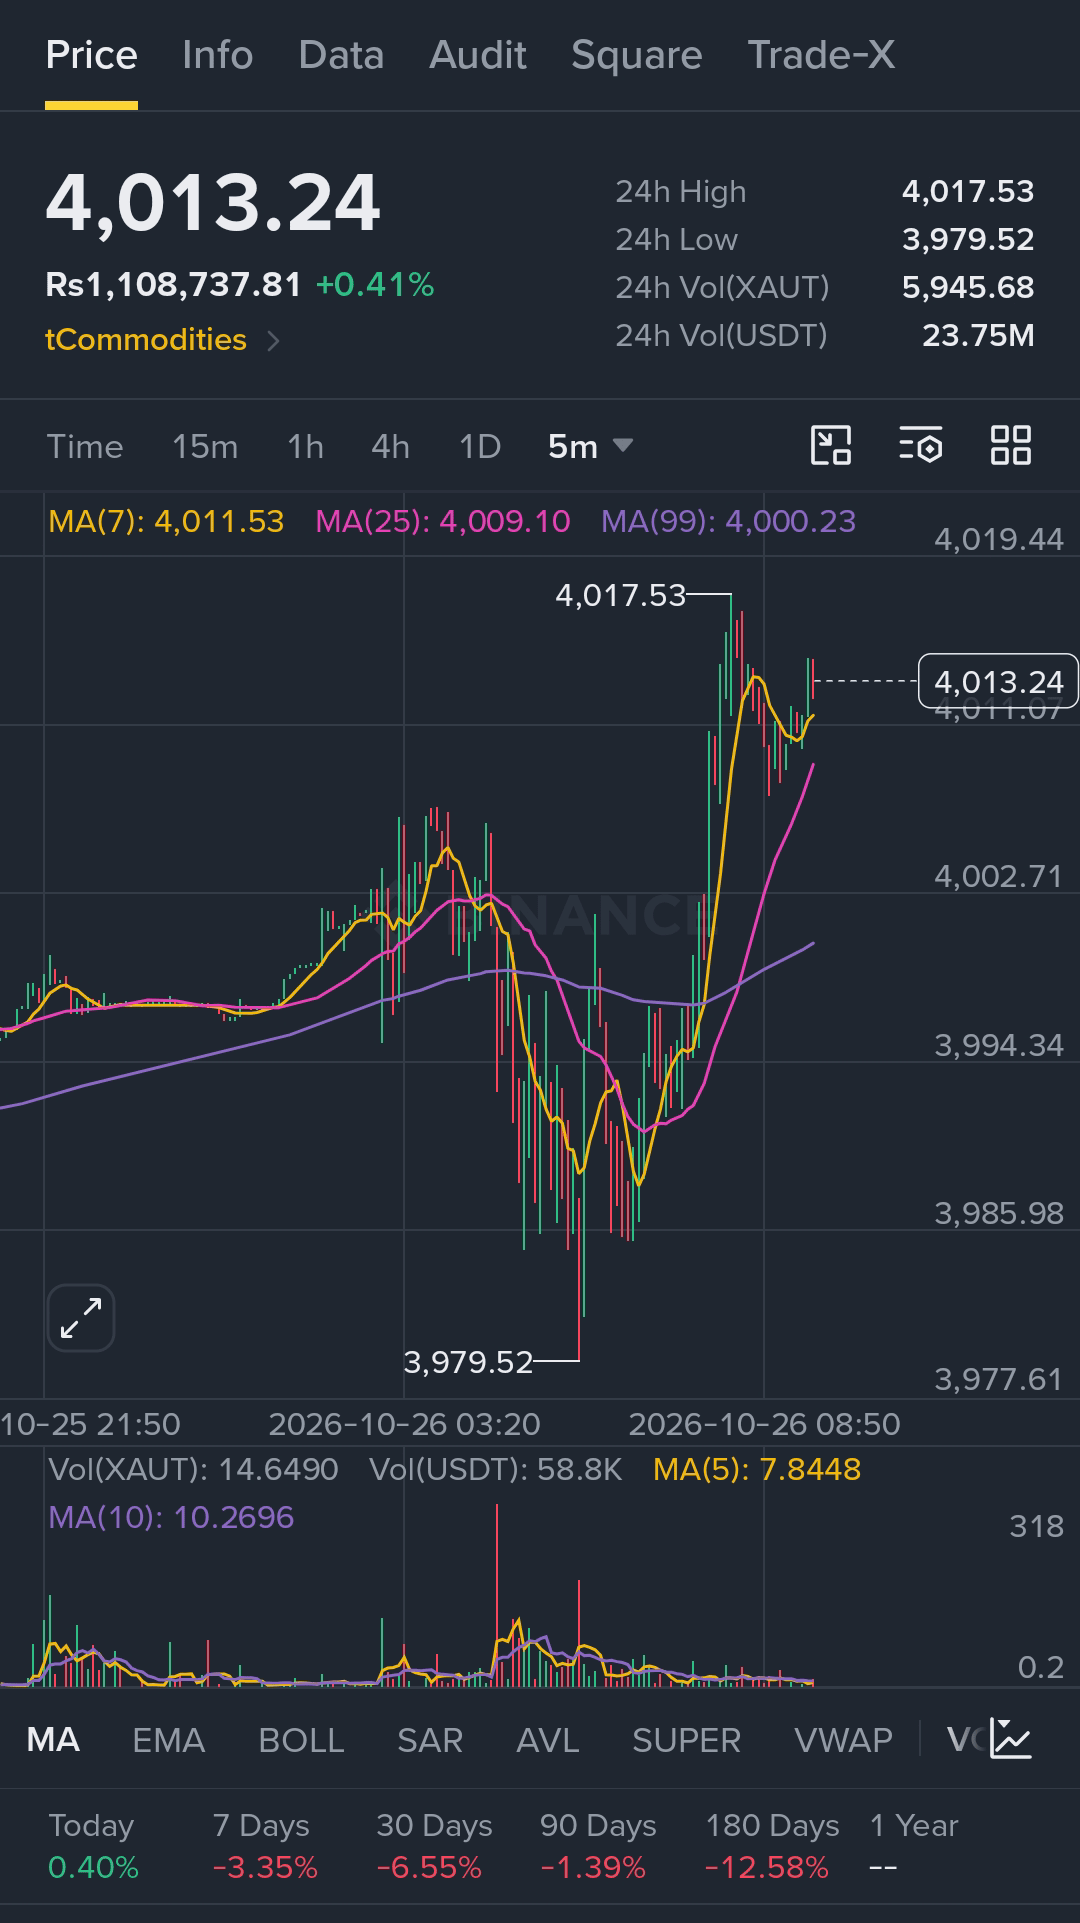
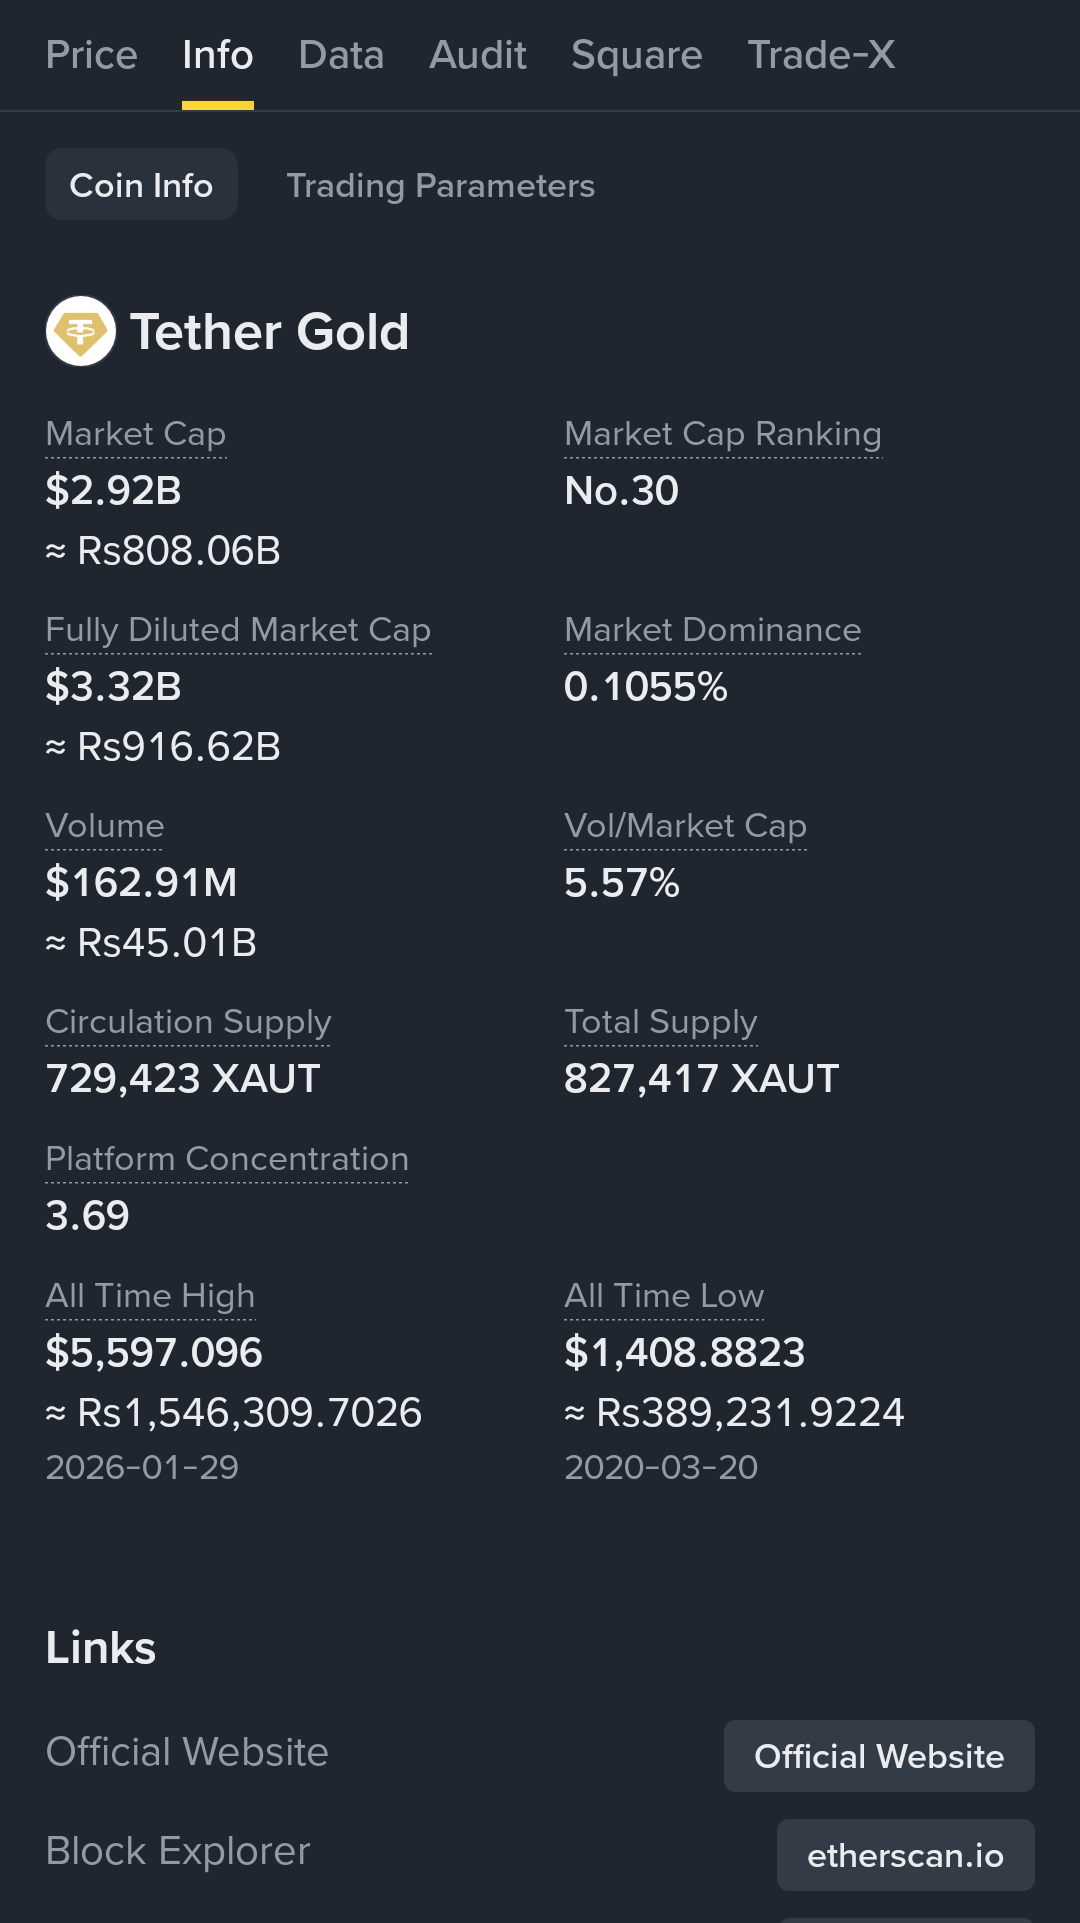
$XAUT #TodayHotTrends 🚀🚀🔥
#BinancePick
#AllTimeHighPriceGold $5597.096
{spot}(XAUTUSDT)
Reference price: $3,994
Support: $3,980 / $3,923
Resistance: $4,013 / $4,069
Bullish trigger: Break and hold above $4,013
Bearish trigger: Breakdown below $3,980
📊 Trading outlook
If $XAUT breaks below $3,980, further downside toward $3,923 is possible. If buyers push the price above $4,013, a recovery toward $4,069 could develop.
Conclusion: The short-term trend is bearish, but confirmation is important before entering a trade. .
#XAUT #TetherGold #GoldAnalysis #CryptoMarket #TradingSignals📞📞📞👇
$XAUT #TodayHotTrends 🚀🚀🔥
#BinancePick
#AllTimeHighPriceGold $5597.096
Reference price: $3,994
Support: $3,980 / $3,923
Resistance: $4,013 / $4,069
Bullish trigger: Break and hold above $4,013
Bearish trigger: Breakdown below $3,980
📊 Trading outlook
If $XAUT breaks below $3,980, further downside toward $3,923 is possible. If buyers push the price above $4,013, a recovery toward $4,069 could develop.
Conclusion: The short-term trend is bearish, but confirmation is important before entering a trade. .
#XAUT #TetherGold #GoldAnalysis #CryptoMarket #TradingSignals📞📞📞👇
17
·
--
$ENA #todaypredictions 🚀🚀🔥
#Goingto 0.5$
#Alltimehighprice $1.5
{spot}(ENAUSDT)
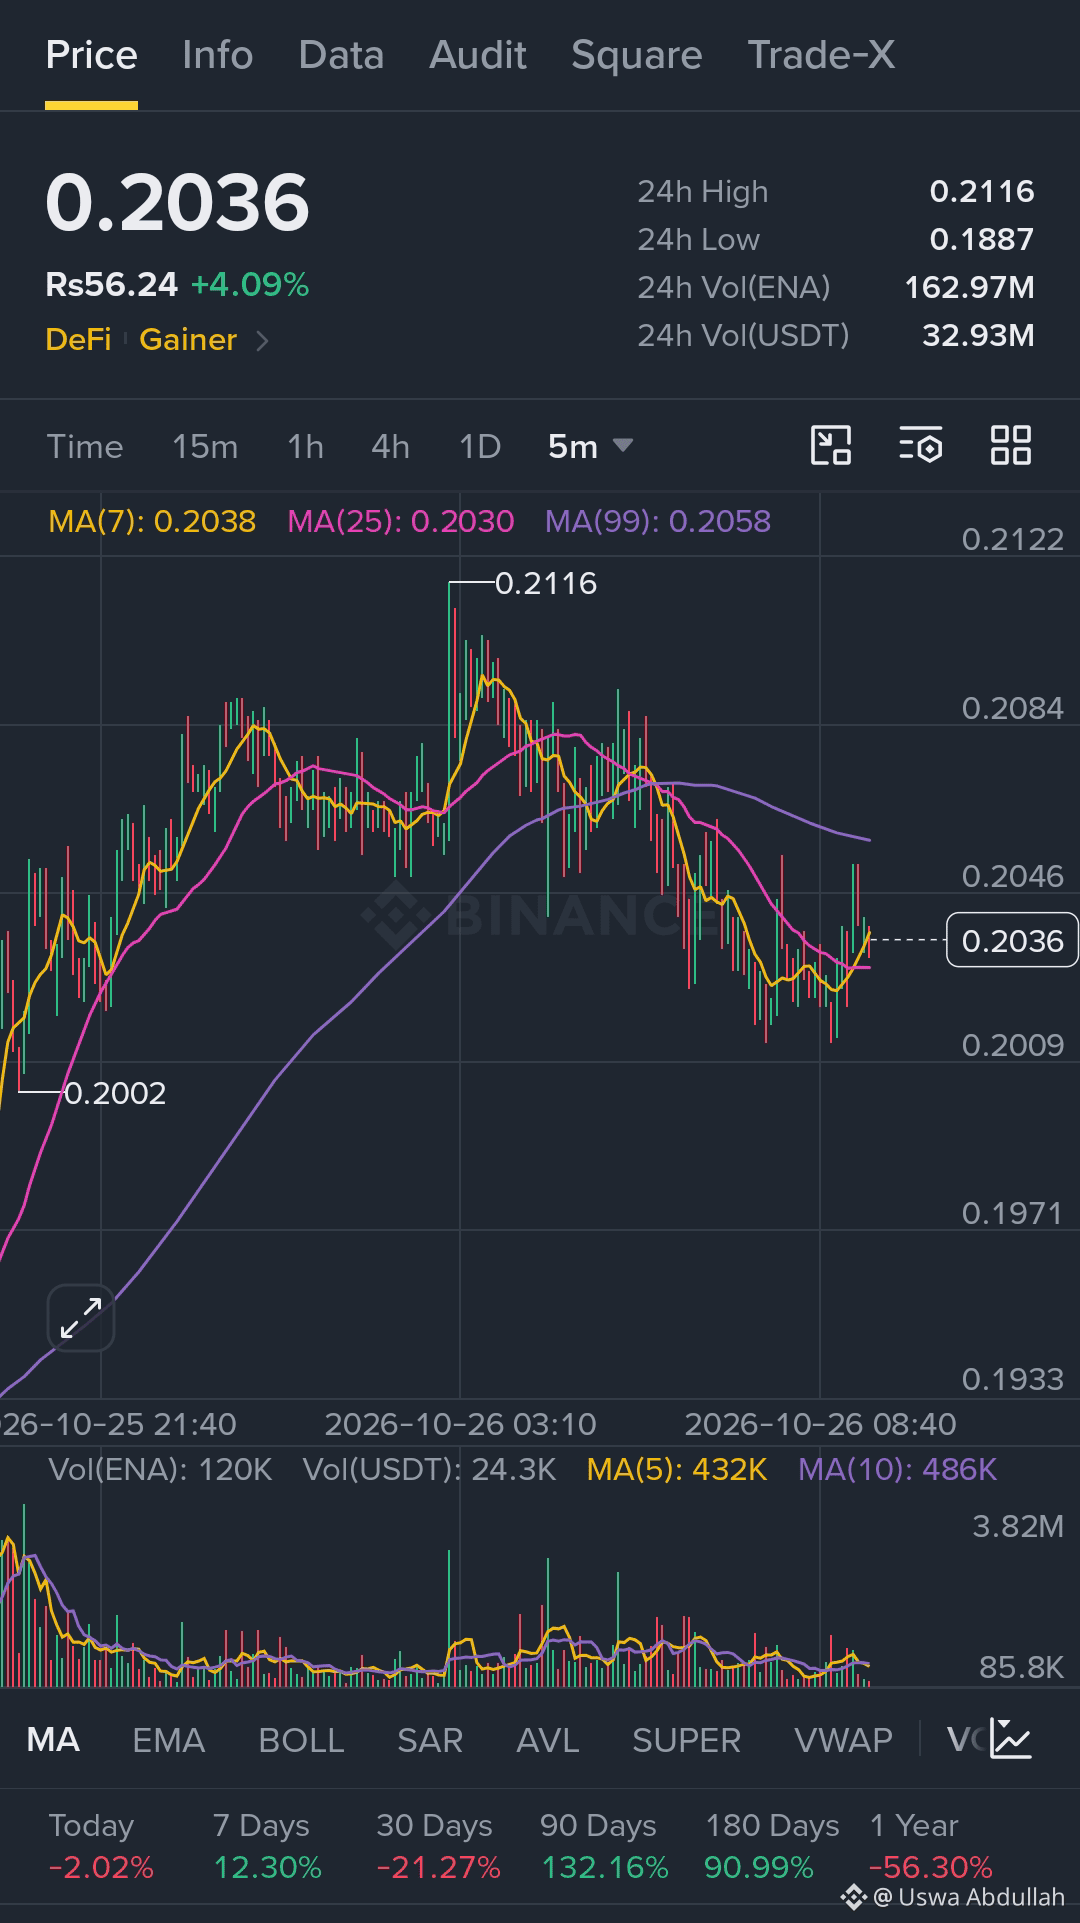
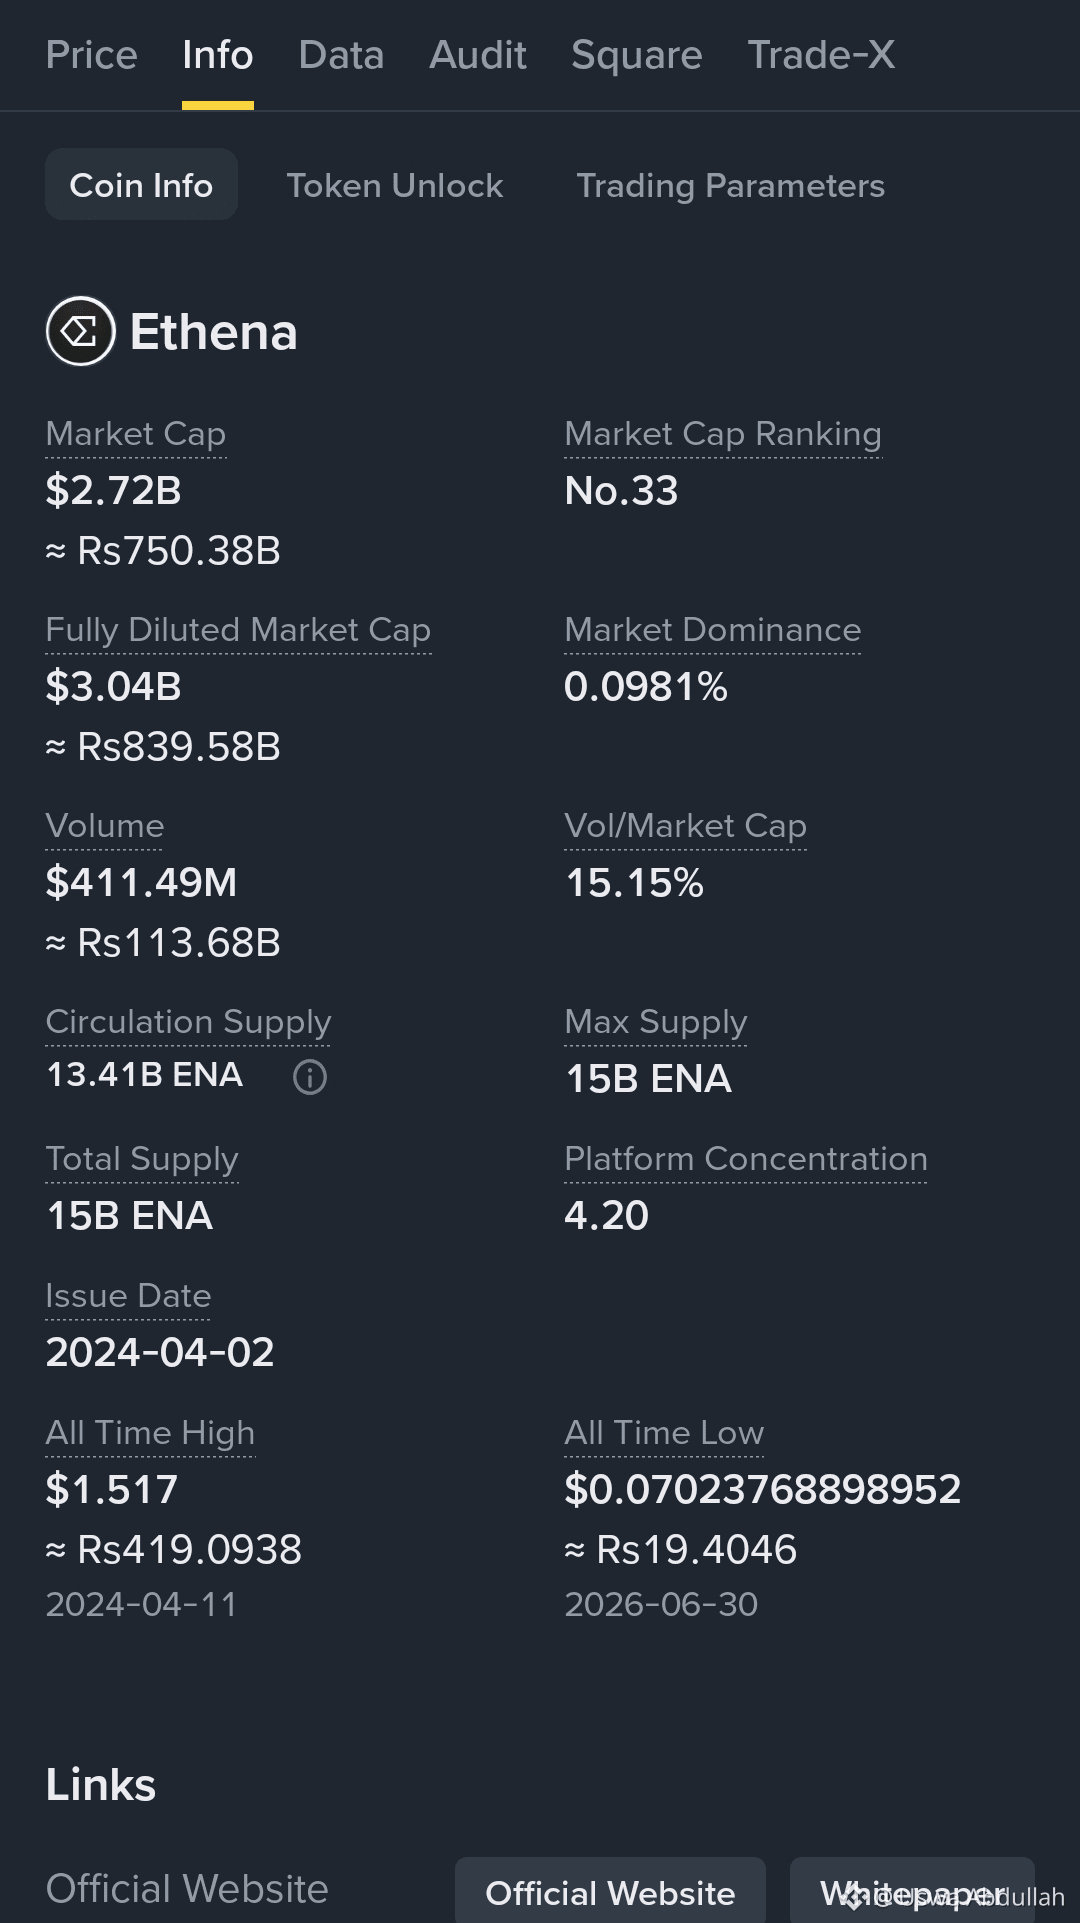
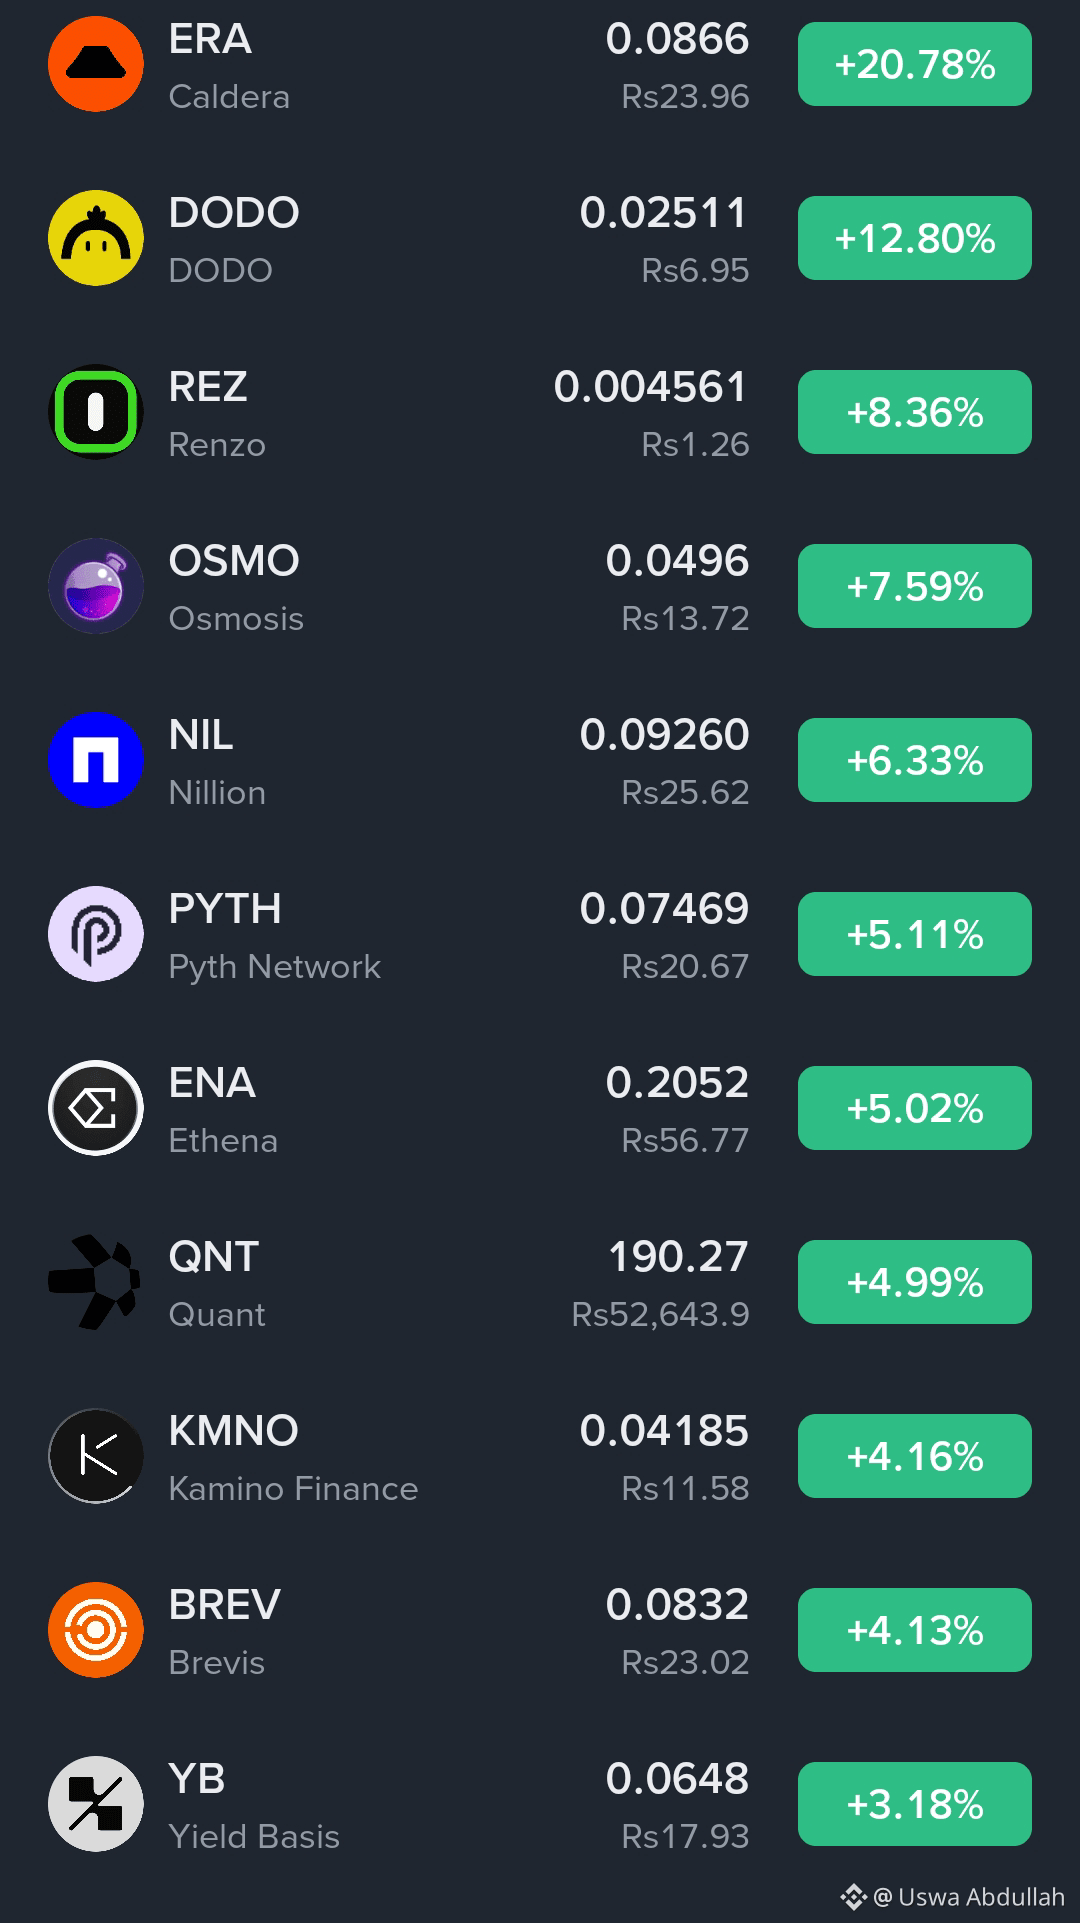
is trading around $0.206–$0.207, with short-term technical indicators leaning bullish. The key level to watch is $0.19 support, while resistance near $0.22 could determine the next move.
🎯 Key Levels (#ENAUSDT )
Support: $0.200 – $0.190
Resistance: $0.212 – $0.220
TP1: $0.212
TP2: $0.220
TP3: $0.230
Stop-loss reference: $0.188
📊 Market Outlook: If ENA holds above $0.200 and breaks $0.212 with strong volume, another upward move may follow. A break below $0.190 could weaken the bullish structure and expose lower support.
$ENA #BinancePick
$ENA #todaypredictions 🚀🚀🔥
#Goingto 0.5$
#Alltimehighprice $1.5
is trading around $0.206–$0.207, with short-term technical indicators leaning bullish. The key level to watch is $0.19 support, while resistance near $0.22 could determine the next move.
🎯 Key Levels (#ENAUSDT )
Support: $0.200 – $0.190
Resistance: $0.212 – $0.220
TP1: $0.212
TP2: $0.220
TP3: $0.230
Stop-loss reference: $0.188
📊 Market Outlook: If ENA holds above $0.200 and breaks $0.212 with strong volume, another upward move may follow. A break below $0.190 could weaken the bullish structure and expose lower support.
$ENA #BinancePick
8
·
--
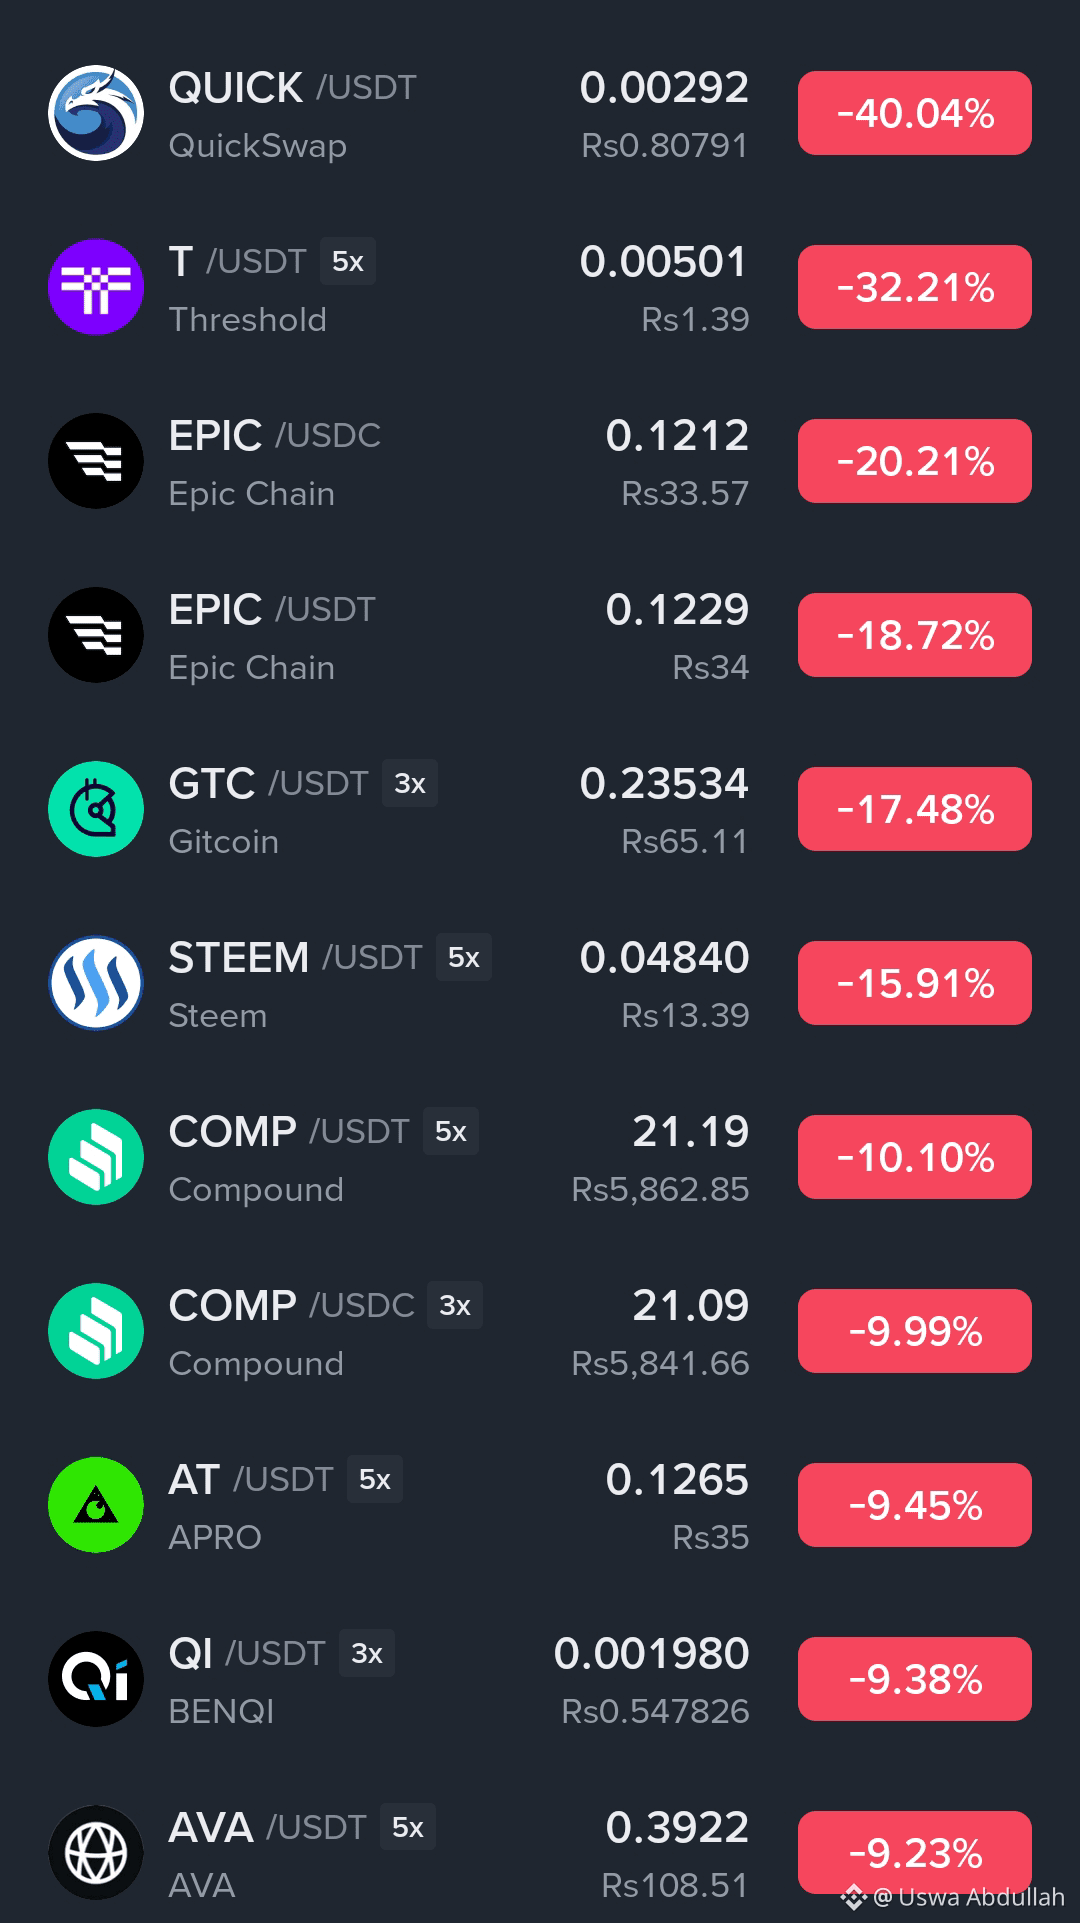
🤑$ERA #TopGainersOfTheMorning 😎😎🚀
#Goto 0.1
#AllTimeHighPrice $2
#EarningsSeason #ArgentineCourtDismissesLIBRACaseAgainstMilei
{spot}(ERAUSDT)
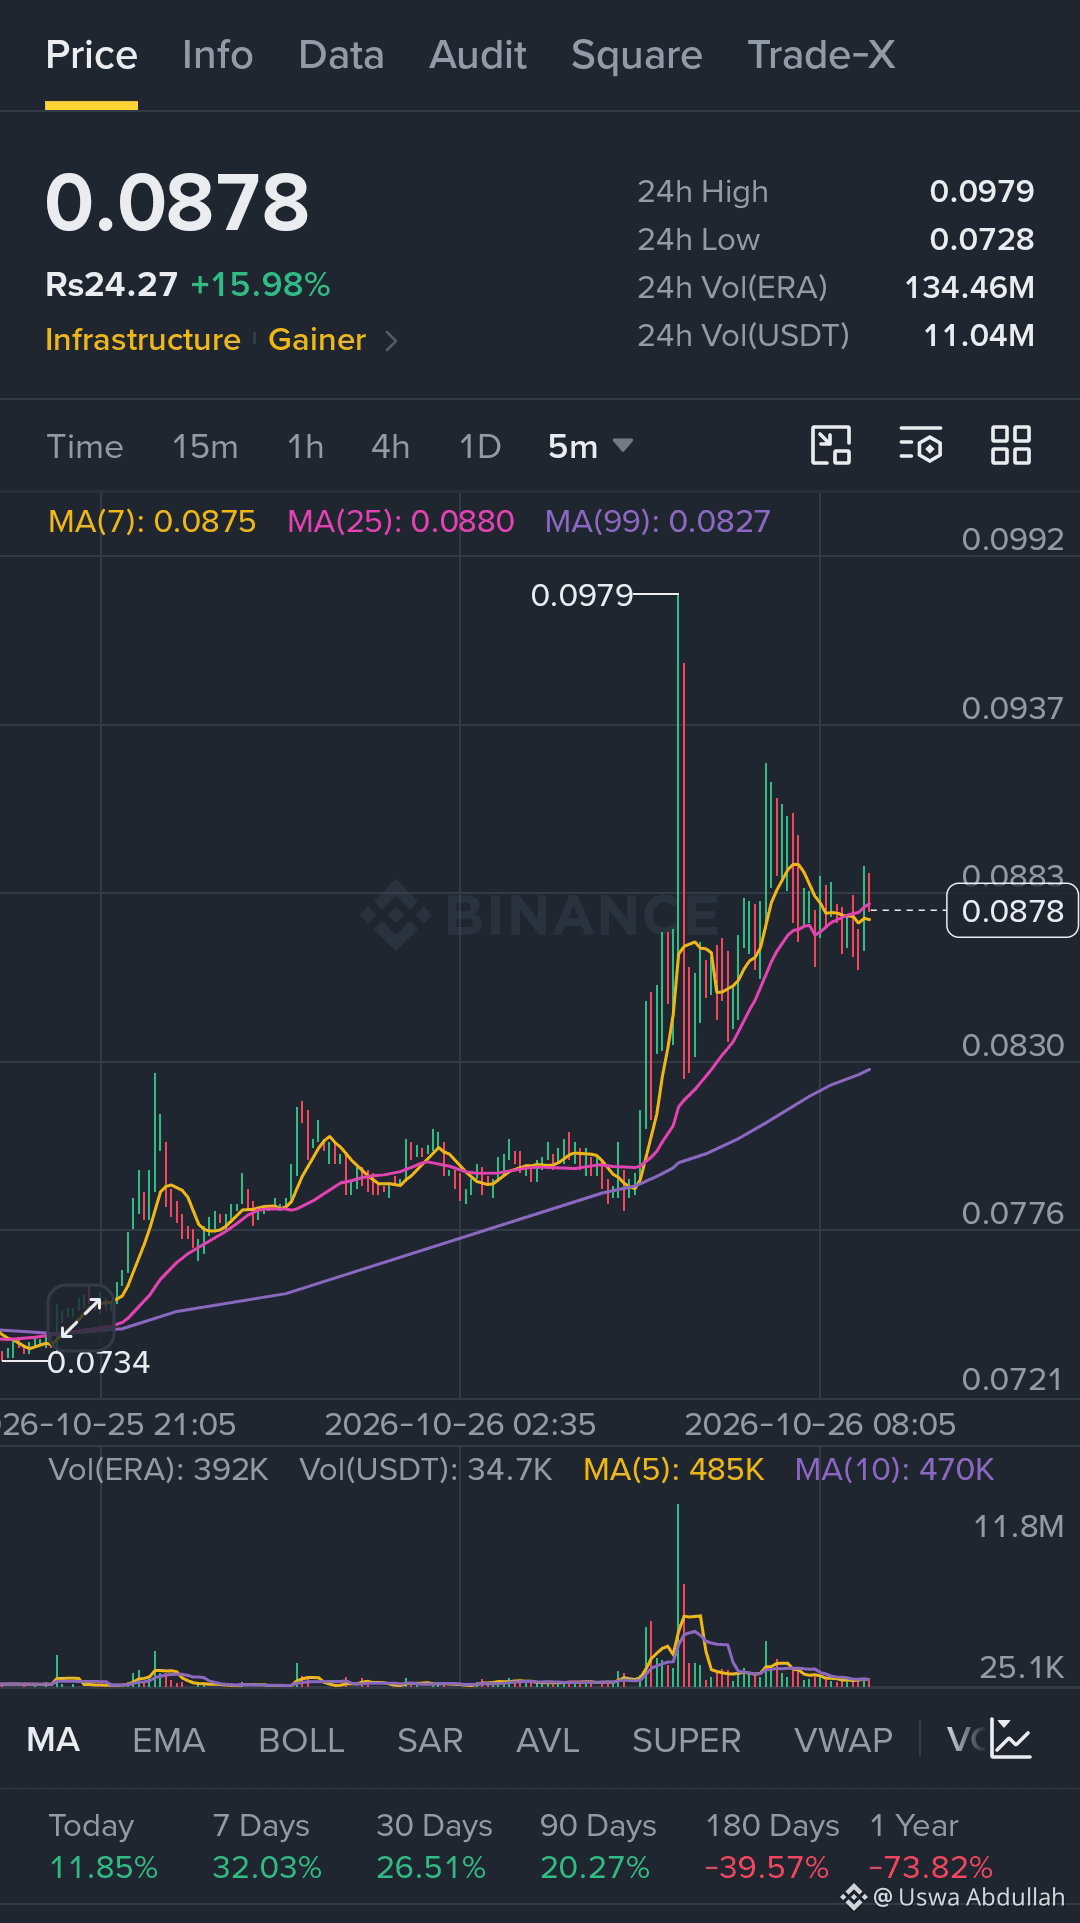
Technical levels to watch
Resistance: $0.0930
Next resistance: $0.1046
Support: $0.0746
Lower support: $0.0676
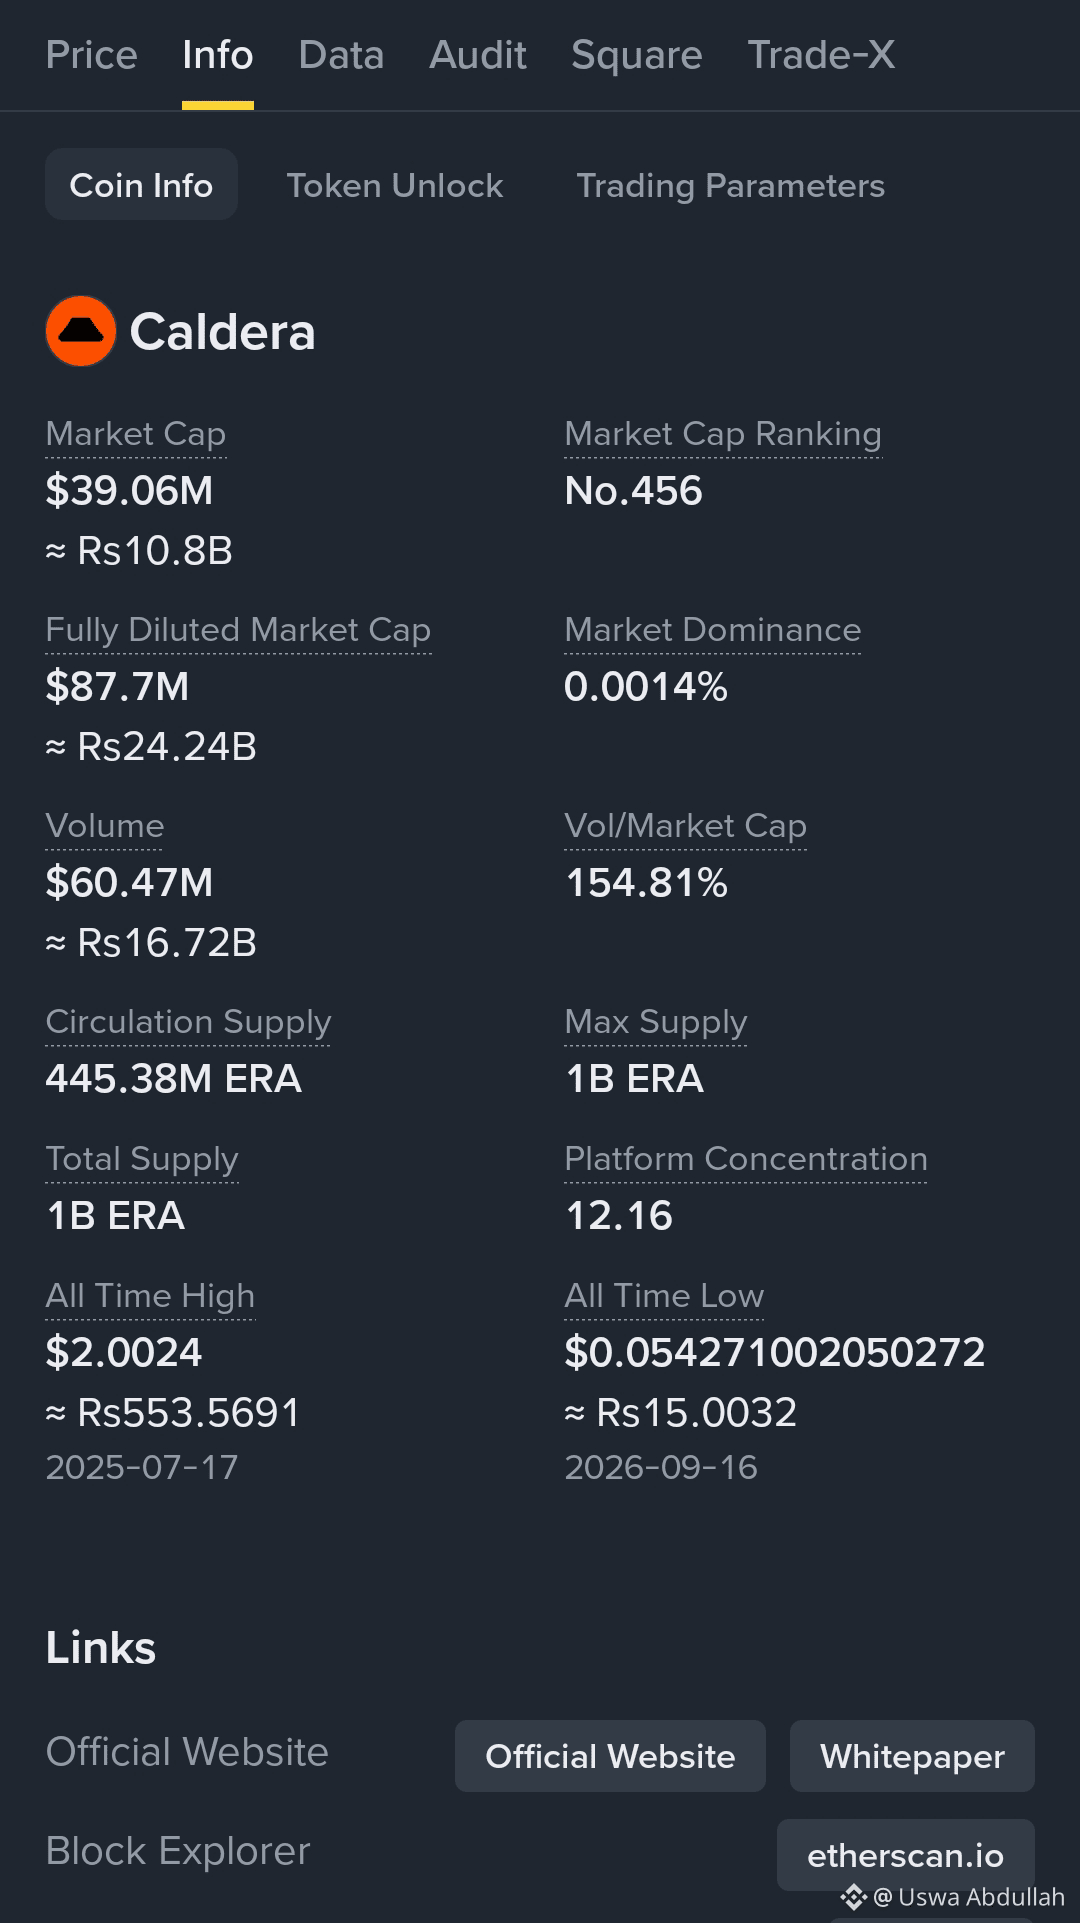
Market outlook: If ERA breaks above $0.0930 with strong volume, the price could move toward $0.1046. However, rejection near resistance may trigger profit-taking and a pullback toward support.
Trading strategy: Avoid chasing a sudden pump. Wait for breakout confirmation or a clear support reaction before entering a trade.
⚠️ Risk management: These are technical reference levels, not guaranteed targets. ERA is highly volatile, so use a stop-loss and manage position size carefully.
#ERA #CryptoAnalysis #Altcoins #BinanceSquare #CryptoTrading
🤑$ERA #TopGainersOfTheMorning 😎😎🚀
#Goto 0.1
#AllTimeHighPrice $2
#EarningsSeason #ArgentineCourtDismissesLIBRACaseAgainstMilei
Technical levels to watch
Resistance: $0.0930
Next resistance: $0.1046
Support: $0.0746
Lower support: $0.0676
Market outlook: If ERA breaks above $0.0930 with strong volume, the price could move toward $0.1046. However, rejection near resistance may trigger profit-taking and a pullback toward support.
Trading strategy: Avoid chasing a sudden pump. Wait for breakout confirmation or a clear support reaction before entering a trade.
⚠️ Risk management: These are technical reference levels, not guaranteed targets. ERA is highly volatile, so use a stop-loss and manage position size carefully.
#ERA #CryptoAnalysis #Altcoins #BinanceSquare #CryptoTrading
22
·
--
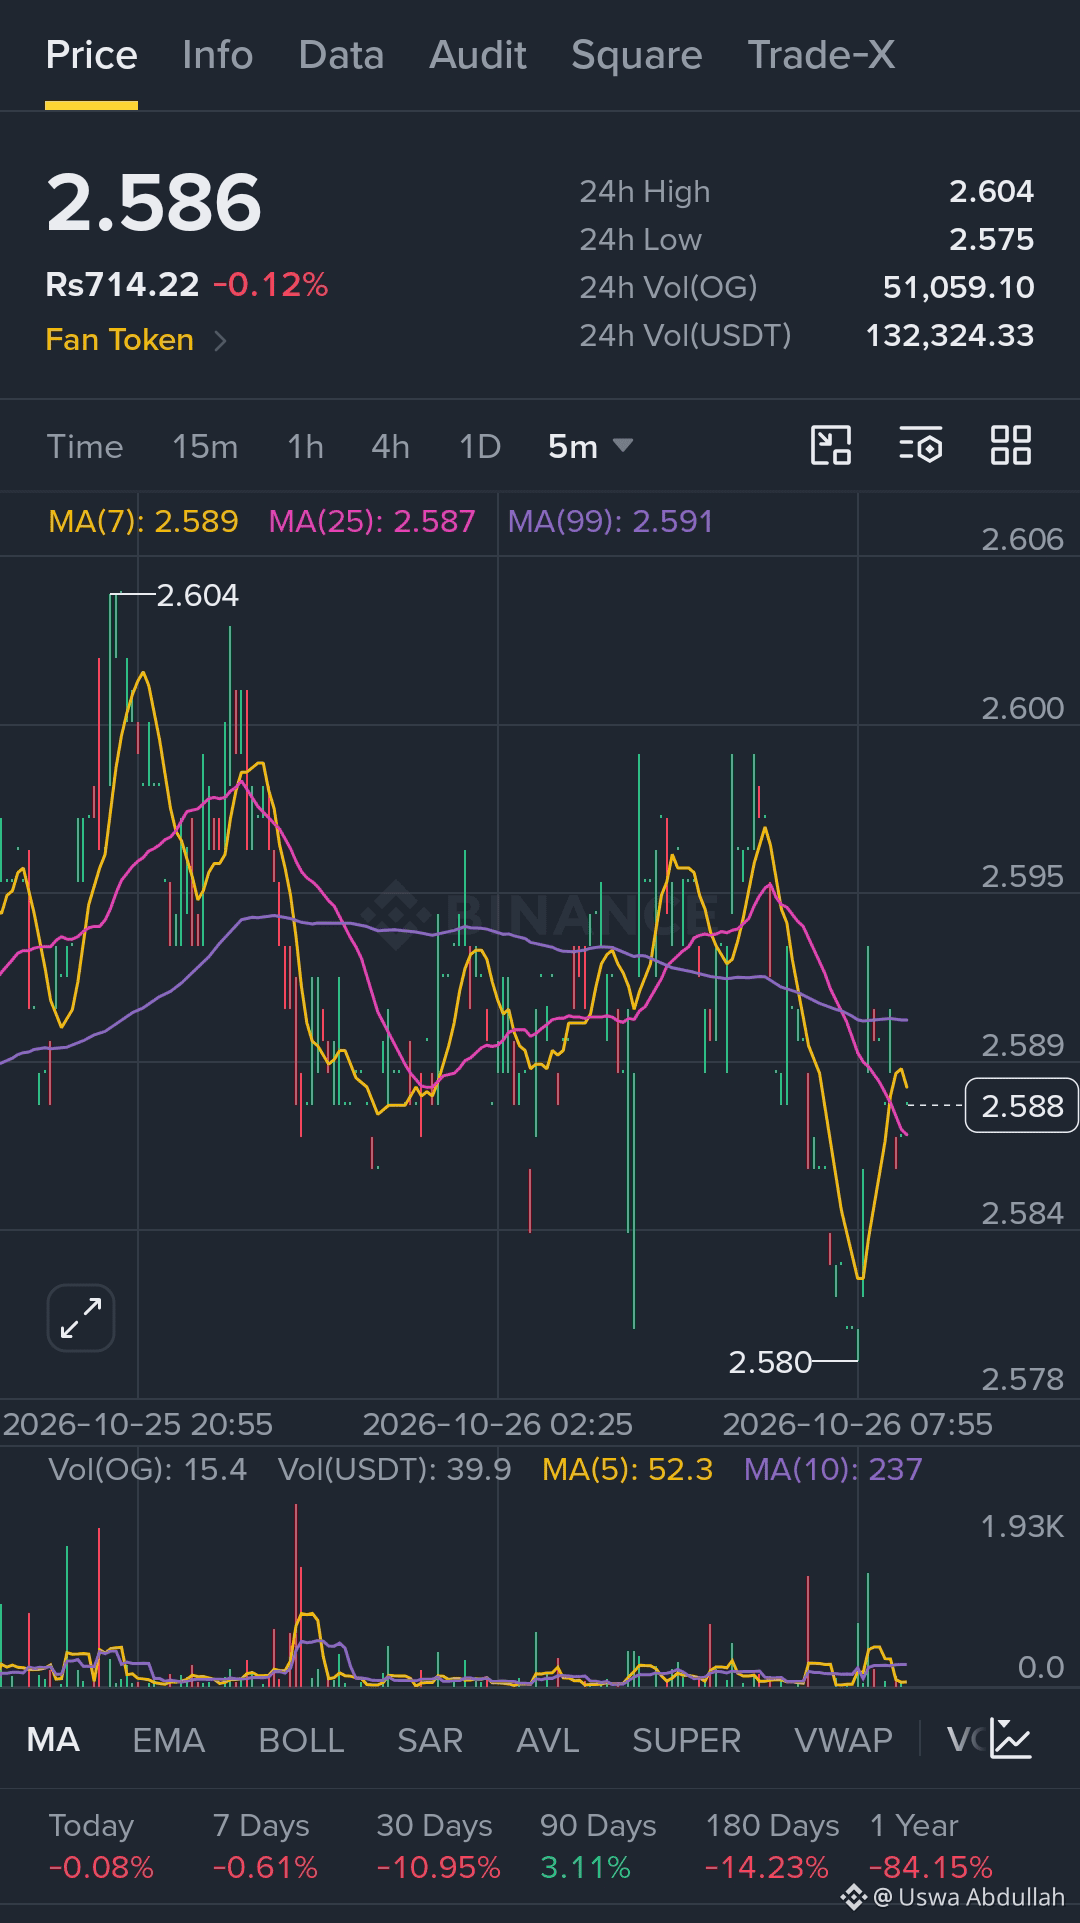
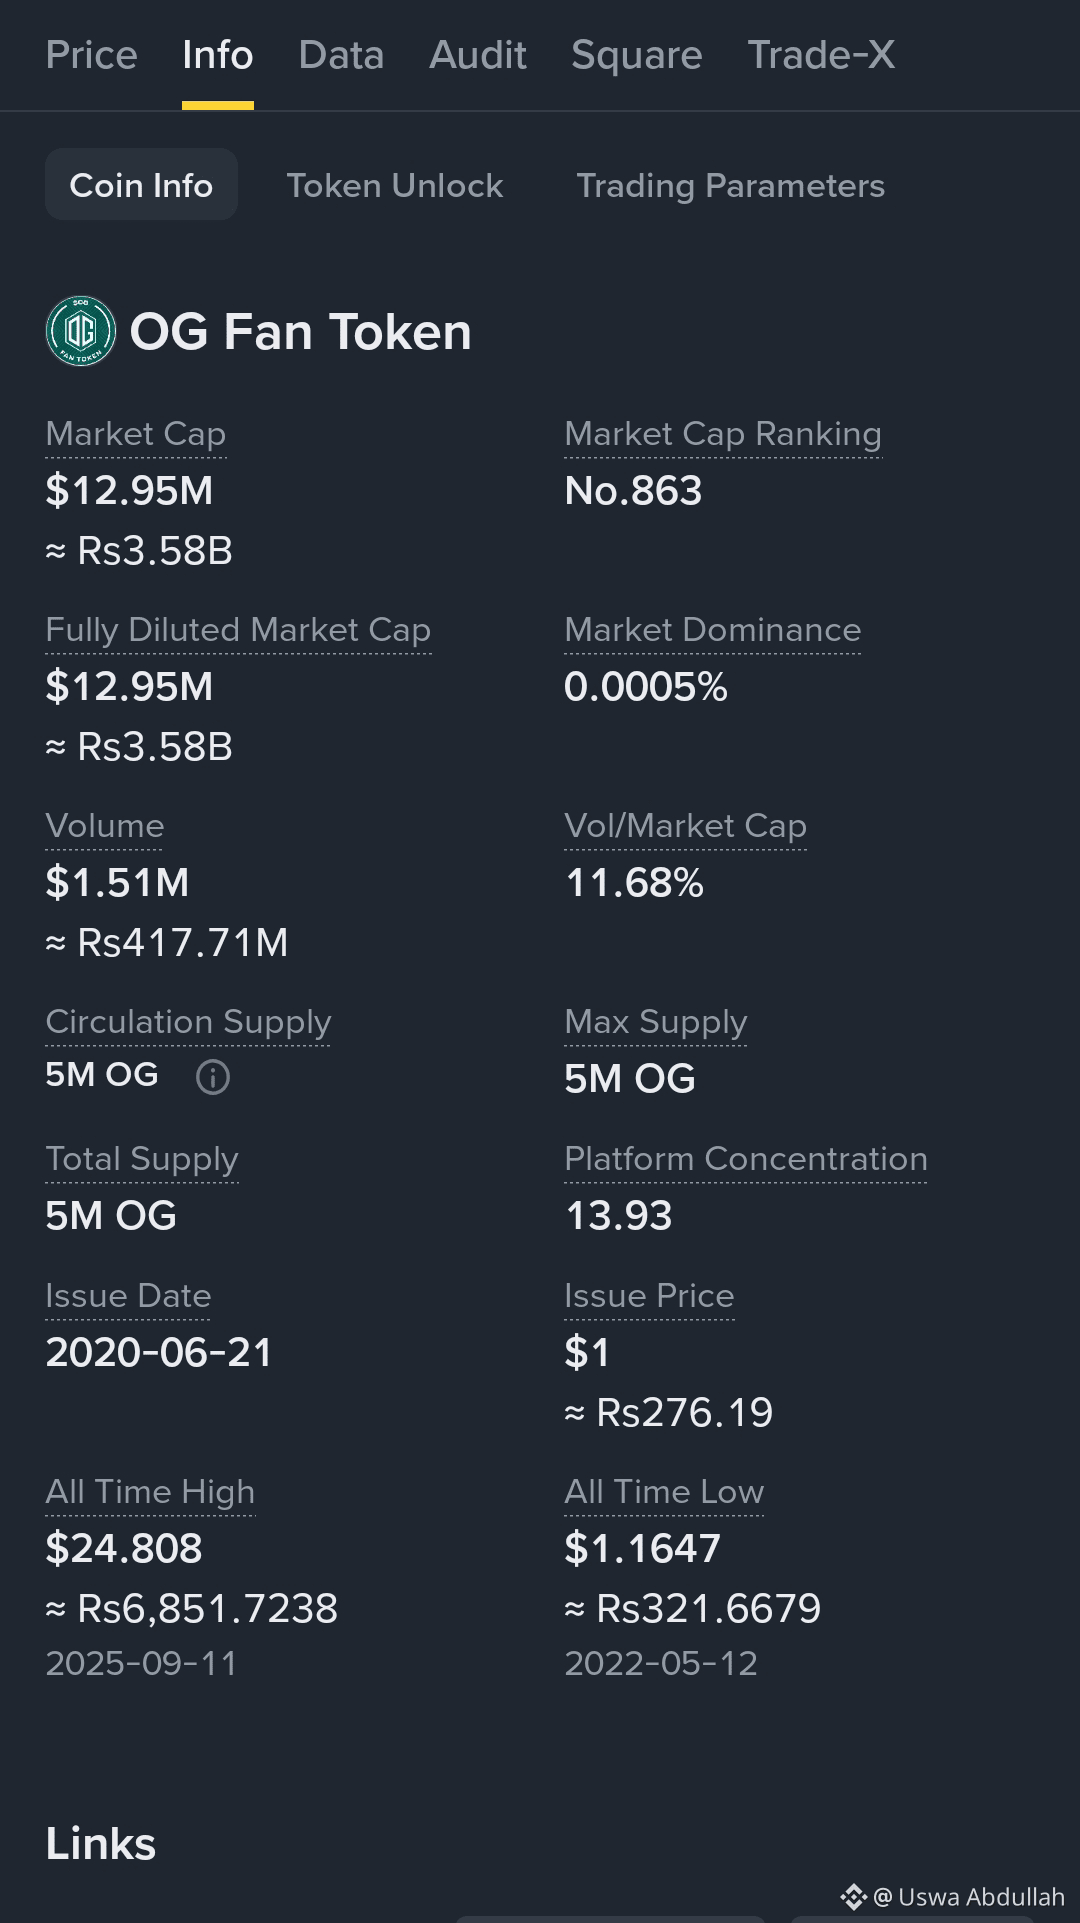
$OG #FanTokenRun 🚀🚀🤑
#GoTo $3
#AllTimeHighPrice $24.8
#BinancePick #EarningsSeason
{spot}(OGUSDT)
$2.58–$2.59
Bearish short-term trend
OG is showing bearish momentum, with its RSI near 38 and price trading below key moving averages. Sellers remain in control unless buyers reclaim resistance with stronger volume.
Key levels to watch
Support: $2.56, $2.52
Resistance: $2.62, $2.67
Bullish breakout: Above $2.67
Bearish breakdown: Below $2.52 could expose $2.48.
Market outlook: If $OG fails to break above $2.62, further downside is possible. A strong move above $2.67 could signal a short-term recovery.
$OG #FanTokenRun 🚀🚀🤑
#GoTo $3
#AllTimeHighPrice $24.8
#BinancePick #EarningsSeason
$2.58–$2.59
Bearish short-term trend
OG is showing bearish momentum, with its RSI near 38 and price trading below key moving averages. Sellers remain in control unless buyers reclaim resistance with stronger volume.
Key levels to watch
Support: $2.56, $2.52
Resistance: $2.62, $2.67
Bullish breakout: Above $2.67
Bearish breakdown: Below $2.52 could expose $2.48.
Market outlook: If $OG fails to break above $2.62, further downside is possible. A strong move above $2.67 could signal a short-term recovery.
37
·
--
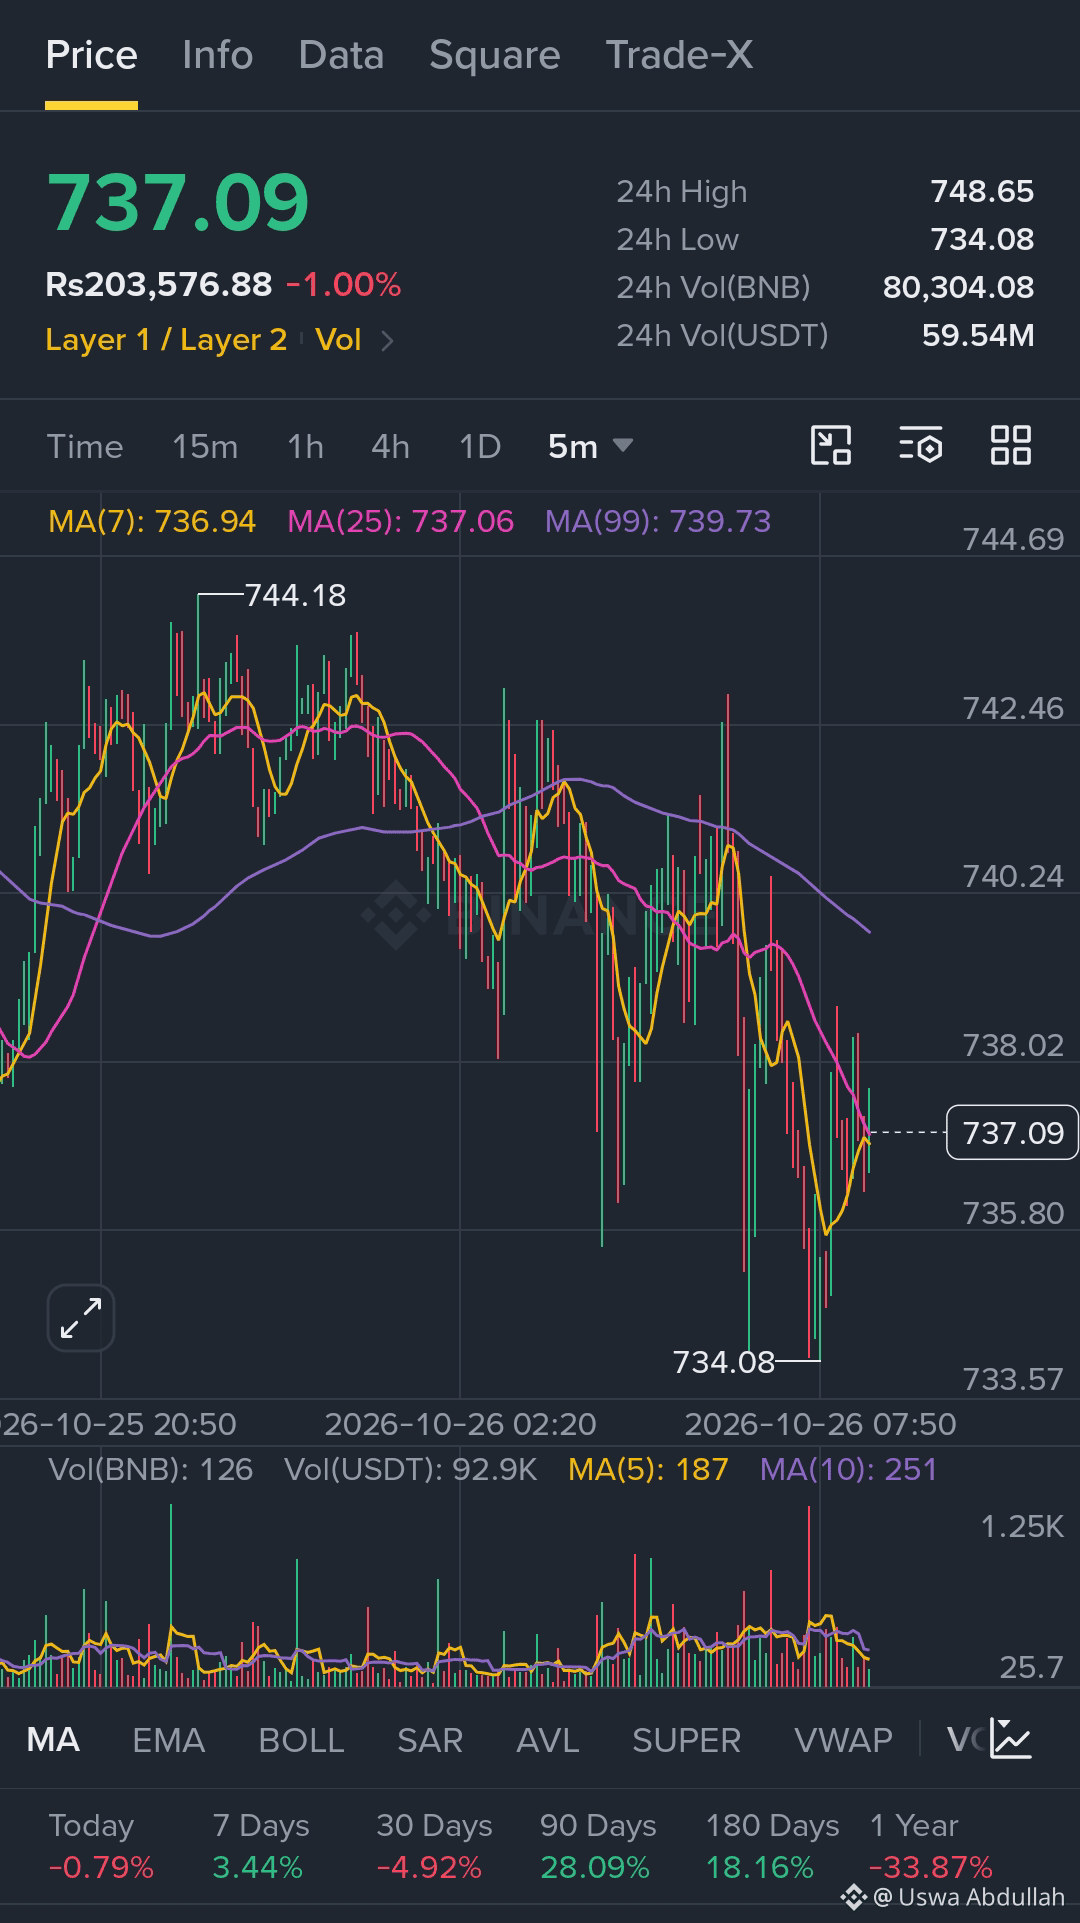
🚀 $BNB 😎😎 Coin Short Analysis Today
#BinancePick #EarningsSeason 🚀🚀
October 26, 2026 · BNB/USDT
$BNB ($BNB ) is trading around $739, with short-term selling pressure visible in technical indicators. RSI is near 41, suggesting weak momentum, although a rebound remains possible.
Current reference price
$739
Support
$731 / $712
Resistance
$747 / $756
Bullish breakout
Above $756
📉 Market outlook
* Bearish scenario: A break below $731 could lead to a retest of $712.
* Bullish scenario: A strong close above $747 may open the way toward $756 and $770.
* Strategy: Wait for confirmation at support or resistance rather than chasing price.
#BNB #BNBUSDT #CryptoAnalysis #BinanceSquare #TradingSignals
36
·
--
$BTC #todaybtcupdate 👇👇👇
#BinancePick #EarningsSeason
{spot}(BTCUSDT)
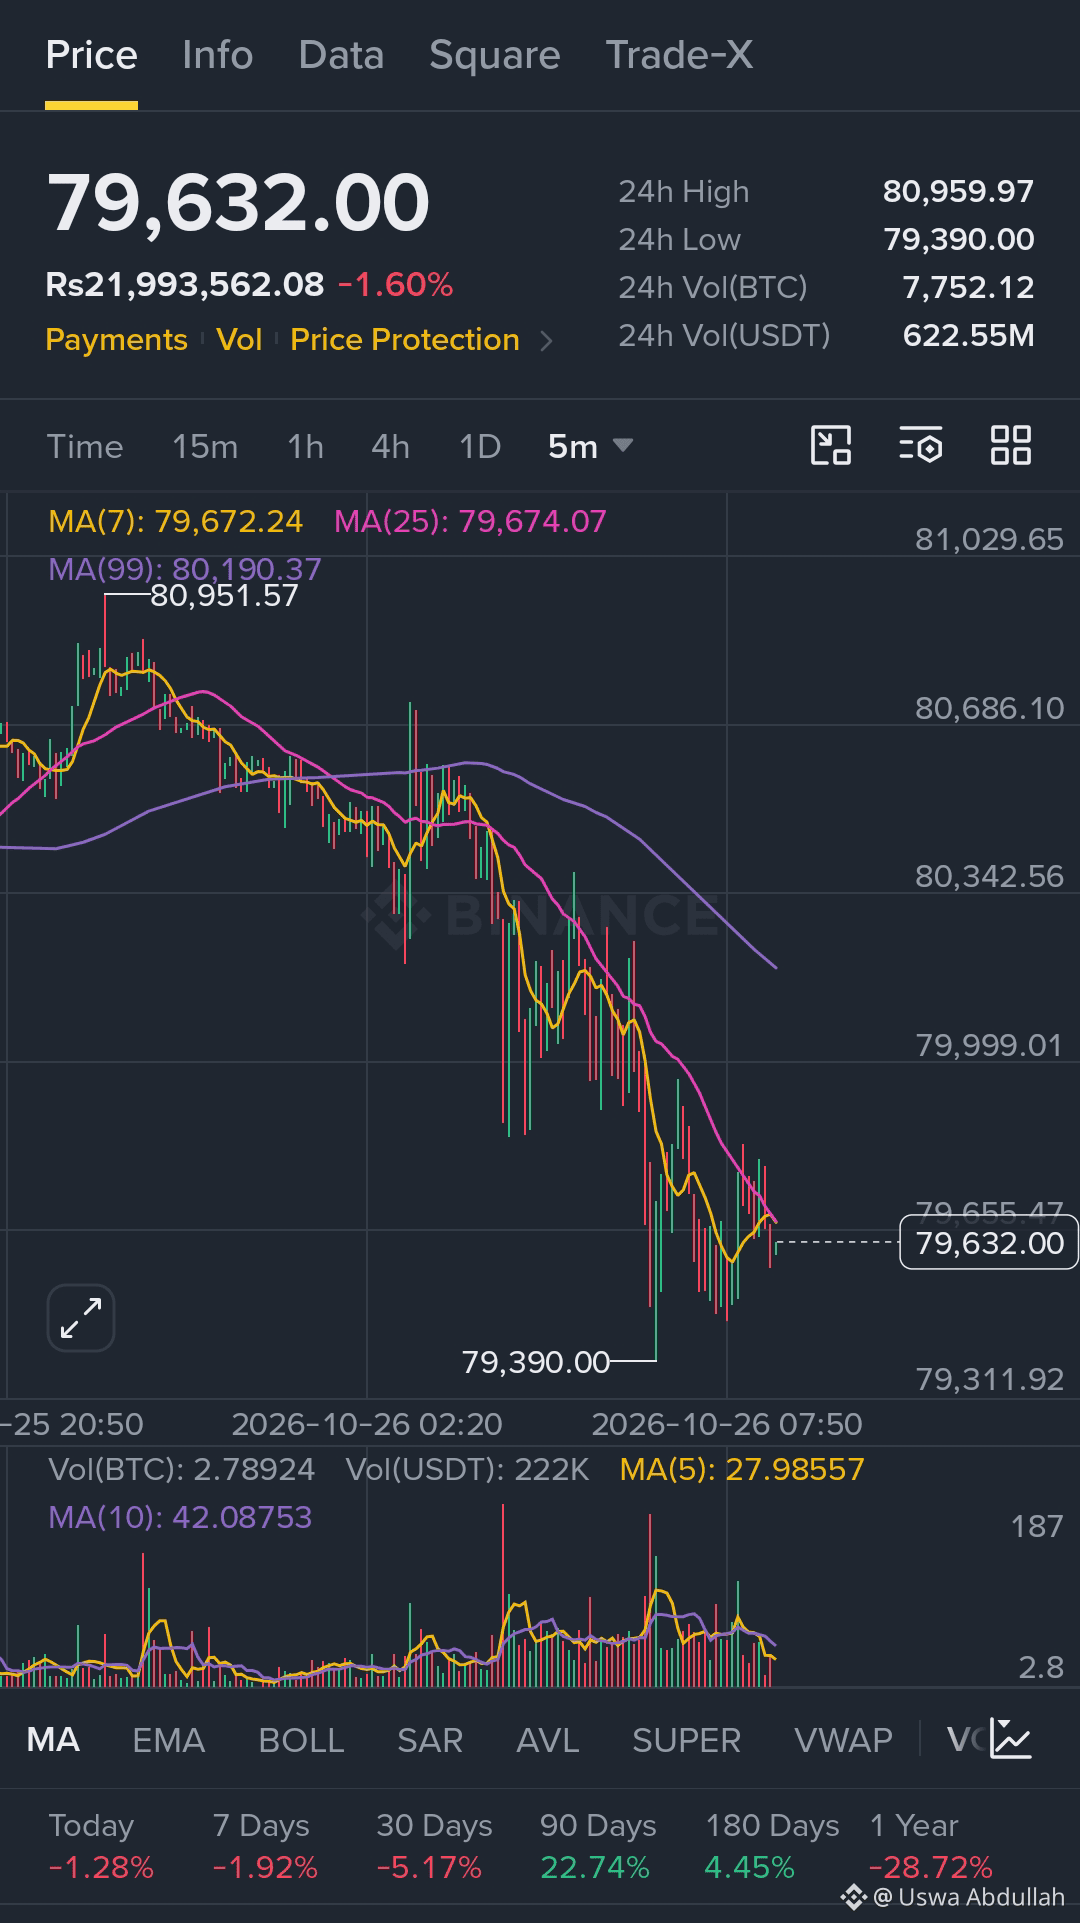
Bitcoin ($BTC ) is trading around $79,300–$80,200, with short-term bearish pressure. Technical indicators show selling momentum, while oversold readings suggest a possible relief bounce.
📊 Key Levels to Watch
Support: $79,000 – $78,100
Resistance: $80,200 – $80,850
Bullish breakout: Above $80,850 with strong volume
Bearish breakdown: Below $78,100 could extend losses.
📉 Market Outlook: BTC remains under short-term selling pressure. If resistance holds, another move toward support is possible. A strong breakout above resistance could trigger a recovery.
$BTC #todaybtcupdate 👇👇👇
#BinancePick #EarningsSeason
Bitcoin ($BTC ) is trading around $79,300–$80,200, with short-term bearish pressure. Technical indicators show selling momentum, while oversold readings suggest a possible relief bounce.
📊 Key Levels to Watch
Support: $79,000 – $78,100
Resistance: $80,200 – $80,850
Bullish breakout: Above $80,850 with strong volume
Bearish breakdown: Below $78,100 could extend losses.
📉 Market Outlook: BTC remains under short-term selling pressure. If resistance holds, another move toward support is possible. A strong breakout above resistance could trigger a recovery.
45

·
--
📉🔥 $FICO.US #Againpricejumpsoon $828🚀
#USQ3GDPAndSeptemberPCEDueNextWeek
#TOPTrendingCoinsToday
{stock_us}(FICO.US)
Stock — Short Analysis Today
Based on your 30-minute chart screenshot
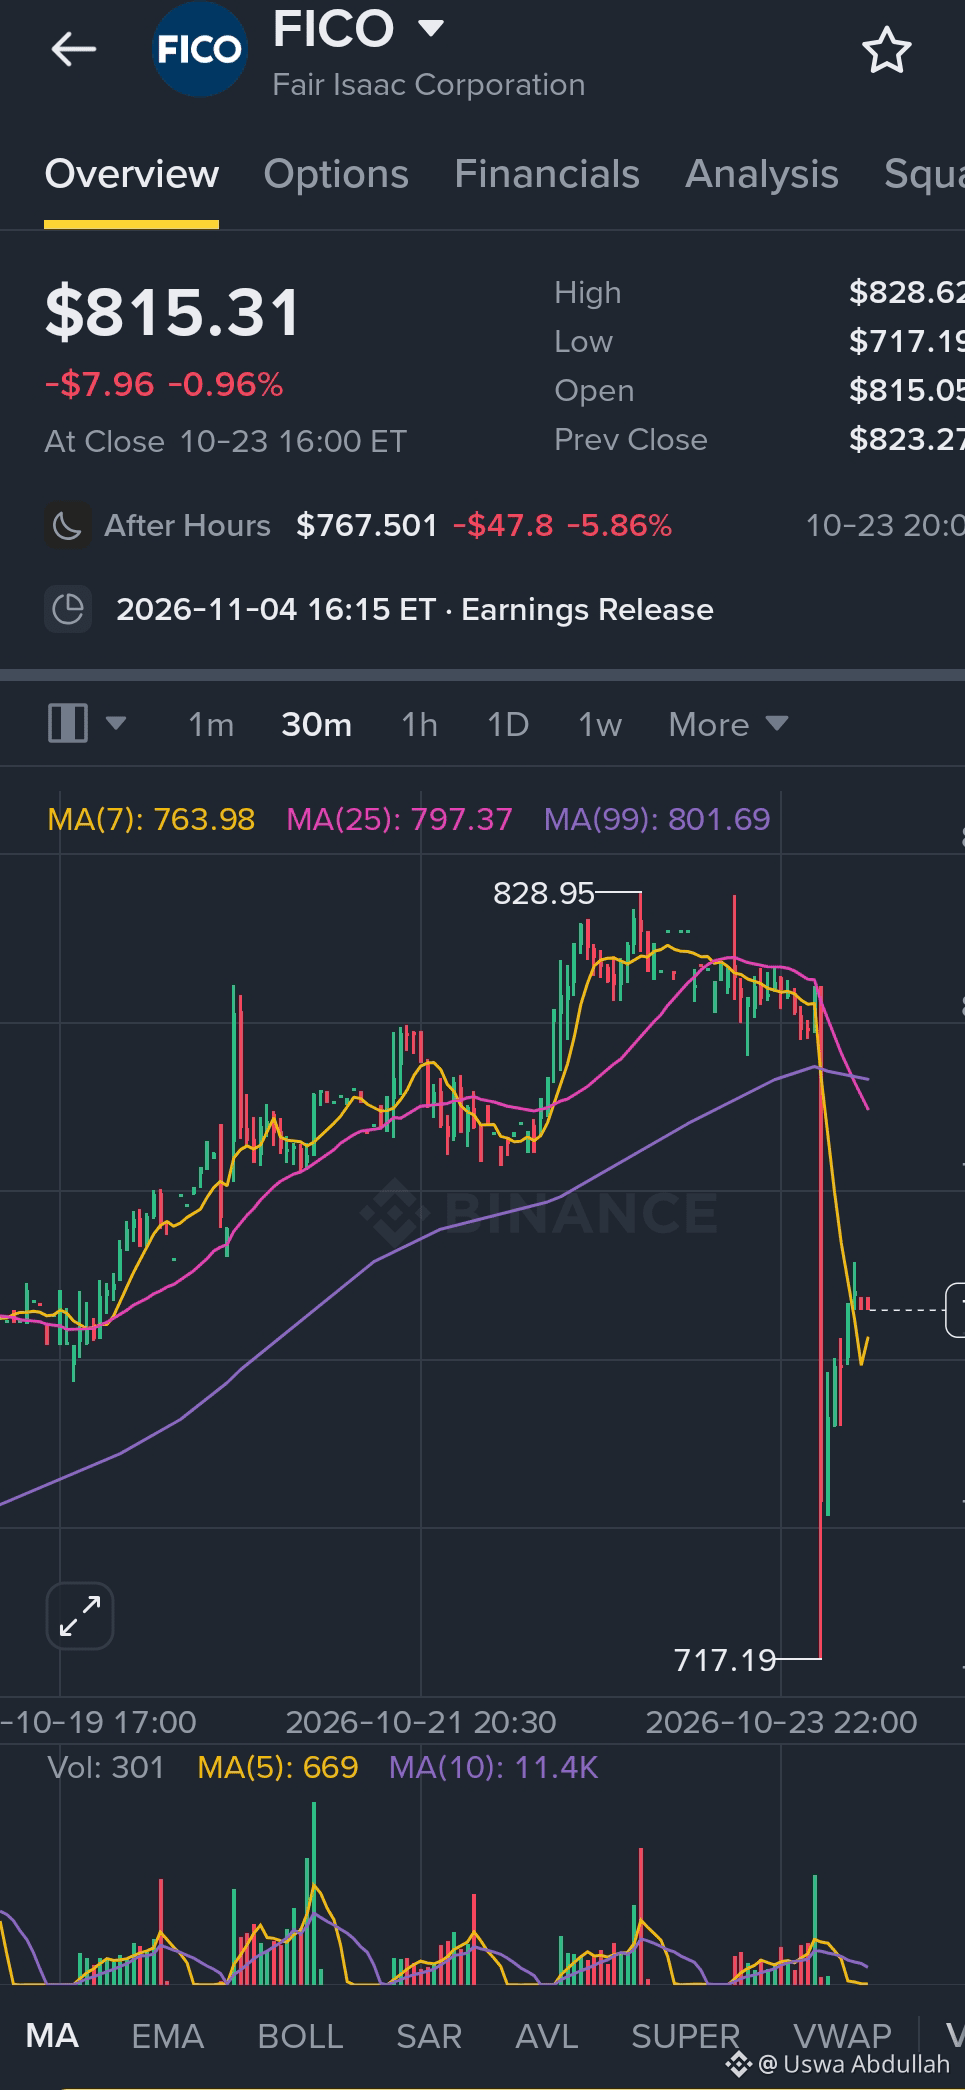
$FICO.US faces strong bearish pressure after a sharp sell-off. The chart shows a dramatic drop from the $810 area to an intraday low of $717.19, followed by a rebound toward $768.
* Current rebound: Price is near $768, but recovery strength remains uncertain.
* Trend: Bearish in the short term; price is below the displayed MA(25) at $797.37 and MA(99) at $801.69.
* Support: $760, $736, then $717.
* Resistance: $780–$785, followed by $797–$802.
Conclusion: $FICO.US remains bearish unless it reclaims resistance with strong buying volume. A break below $760 may signal another downward move, while a sustained recovery above $785 could improve the short-term outlook.
The sharp volatility may be linked to broader concerns about competition in mortgage credit scoring.
#FICO #StockMarket #TechnicalAnalysis #TradingSignals
📉🔥 $FICO.US #Againpricejumpsoon $828🚀
#USQ3GDPAndSeptemberPCEDueNextWeek
#TOPTrendingCoinsToday
Stock — Short Analysis Today
Based on your 30-minute chart screenshot
$FICO.US faces strong bearish pressure after a sharp sell-off. The chart shows a dramatic drop from the $810 area to an intraday low of $717.19, followed by a rebound toward $768.
* Current rebound: Price is near $768, but recovery strength remains uncertain.
* Trend: Bearish in the short term; price is below the displayed MA(25) at $797.37 and MA(99) at $801.69.
* Support: $760, $736, then $717.
* Resistance: $780–$785, followed by $797–$802.
Conclusion: $FICO.US remains bearish unless it reclaims resistance with strong buying volume. A break below $760 may signal another downward move, while a sustained recovery above $785 could improve the short-term outlook.
The sharp volatility may be linked to broader concerns about competition in mortgage credit scoring.
#FICO #StockMarket #TechnicalAnalysis #TradingSignals
FICOUS-9,64%
10
·
--
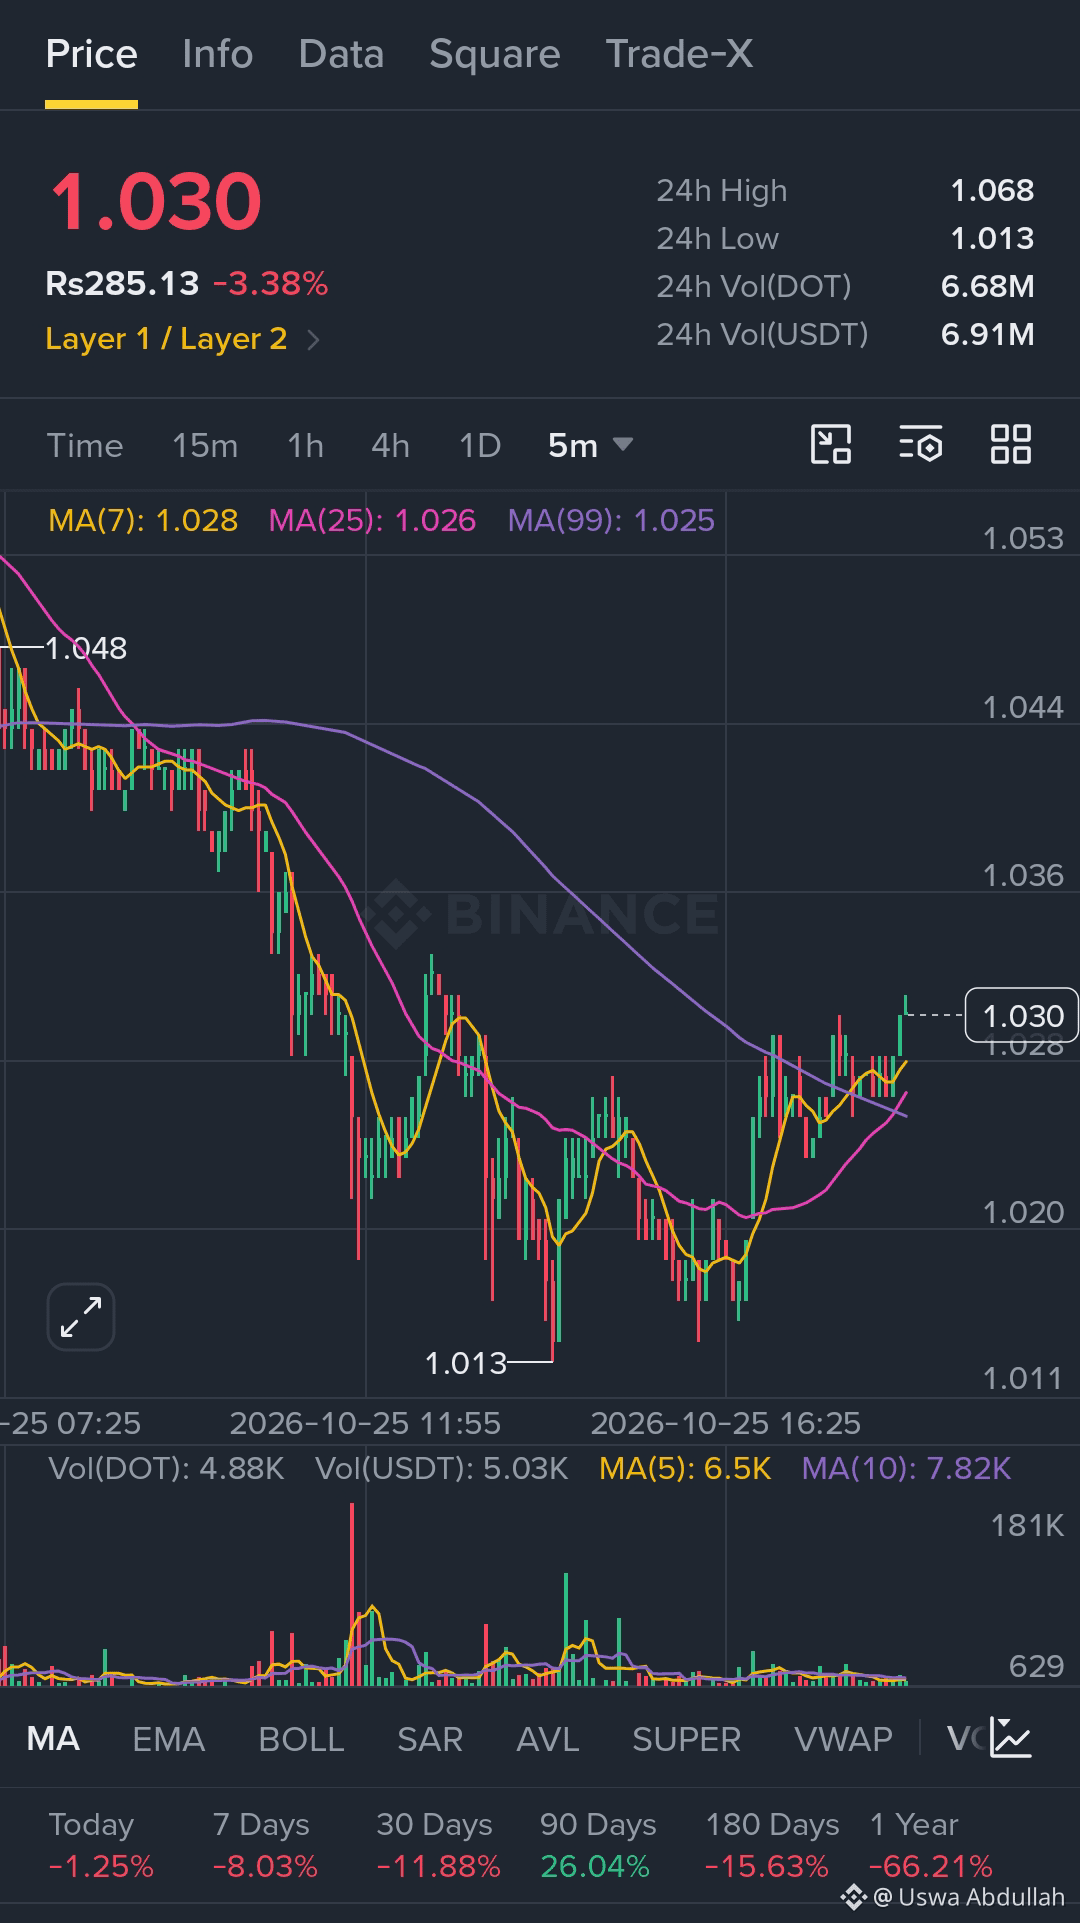
$DOT #TodayHotTrends 😎😎
#Priceejumpsoon $5
#AllTimehighprice $55
{spot}(DOTUSDT)
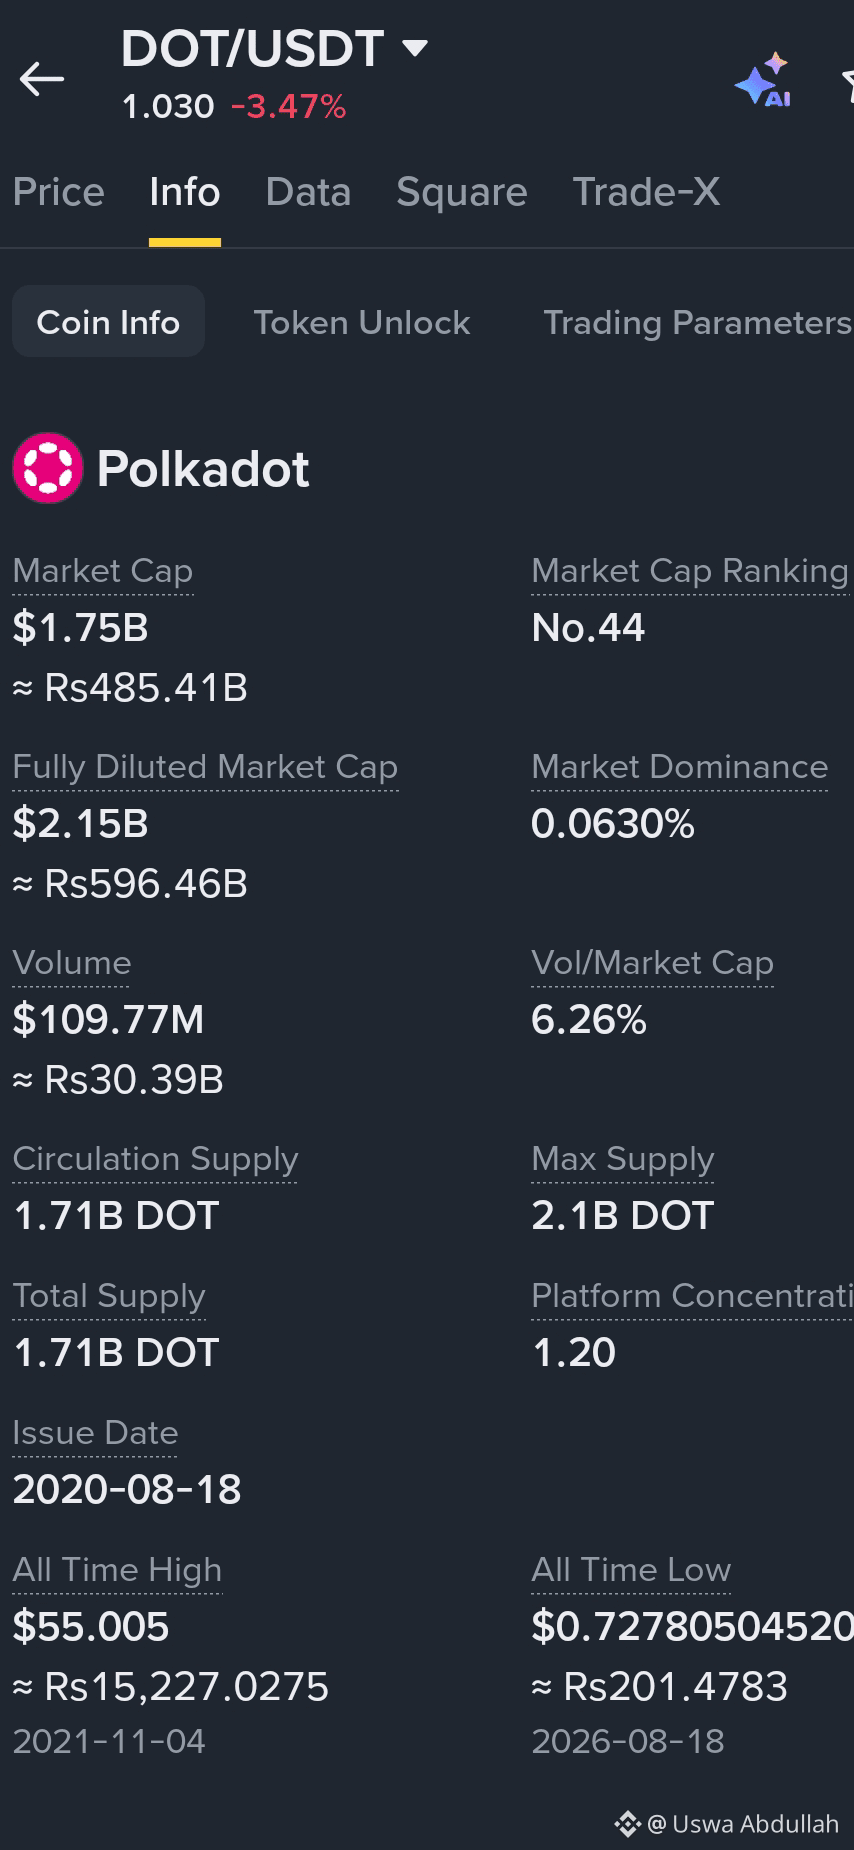
(Polkadot) — Short Analysis Today
October 25, 2026 · Market analysis
$DOT faces bearish pressure as sellers remain in control. Polkadot recently fell after failing to break the $1.18–$1.20 resistance zone. Latest reports put DOT near $1.02–$1.04, with momentum indicators showing weakness.
Support: $1.01, then $0.93–$0.95.
Resistance: $1.07, then $1.12–$1.15.
Bearish scenario: A confirmed break below $1.01 could open the way toward $0.95.
Bullish scenario: Reclaiming $1.07 with strong volume could trigger a short-term rebound.
$DOT #TodayHotTrends 😎😎
#Priceejumpsoon $5
#AllTimehighprice $55
(Polkadot) — Short Analysis Today
October 25, 2026 · Market analysis
$DOT faces bearish pressure as sellers remain in control. Polkadot recently fell after failing to break the $1.18–$1.20 resistance zone. Latest reports put DOT near $1.02–$1.04, with momentum indicators showing weakness.
Support: $1.01, then $0.93–$0.95.
Resistance: $1.07, then $1.12–$1.15.
Bearish scenario: A confirmed break below $1.01 could open the way toward $0.95.
Bullish scenario: Reclaiming $1.07 with strong volume could trigger a short-term rebound.
1
·
--
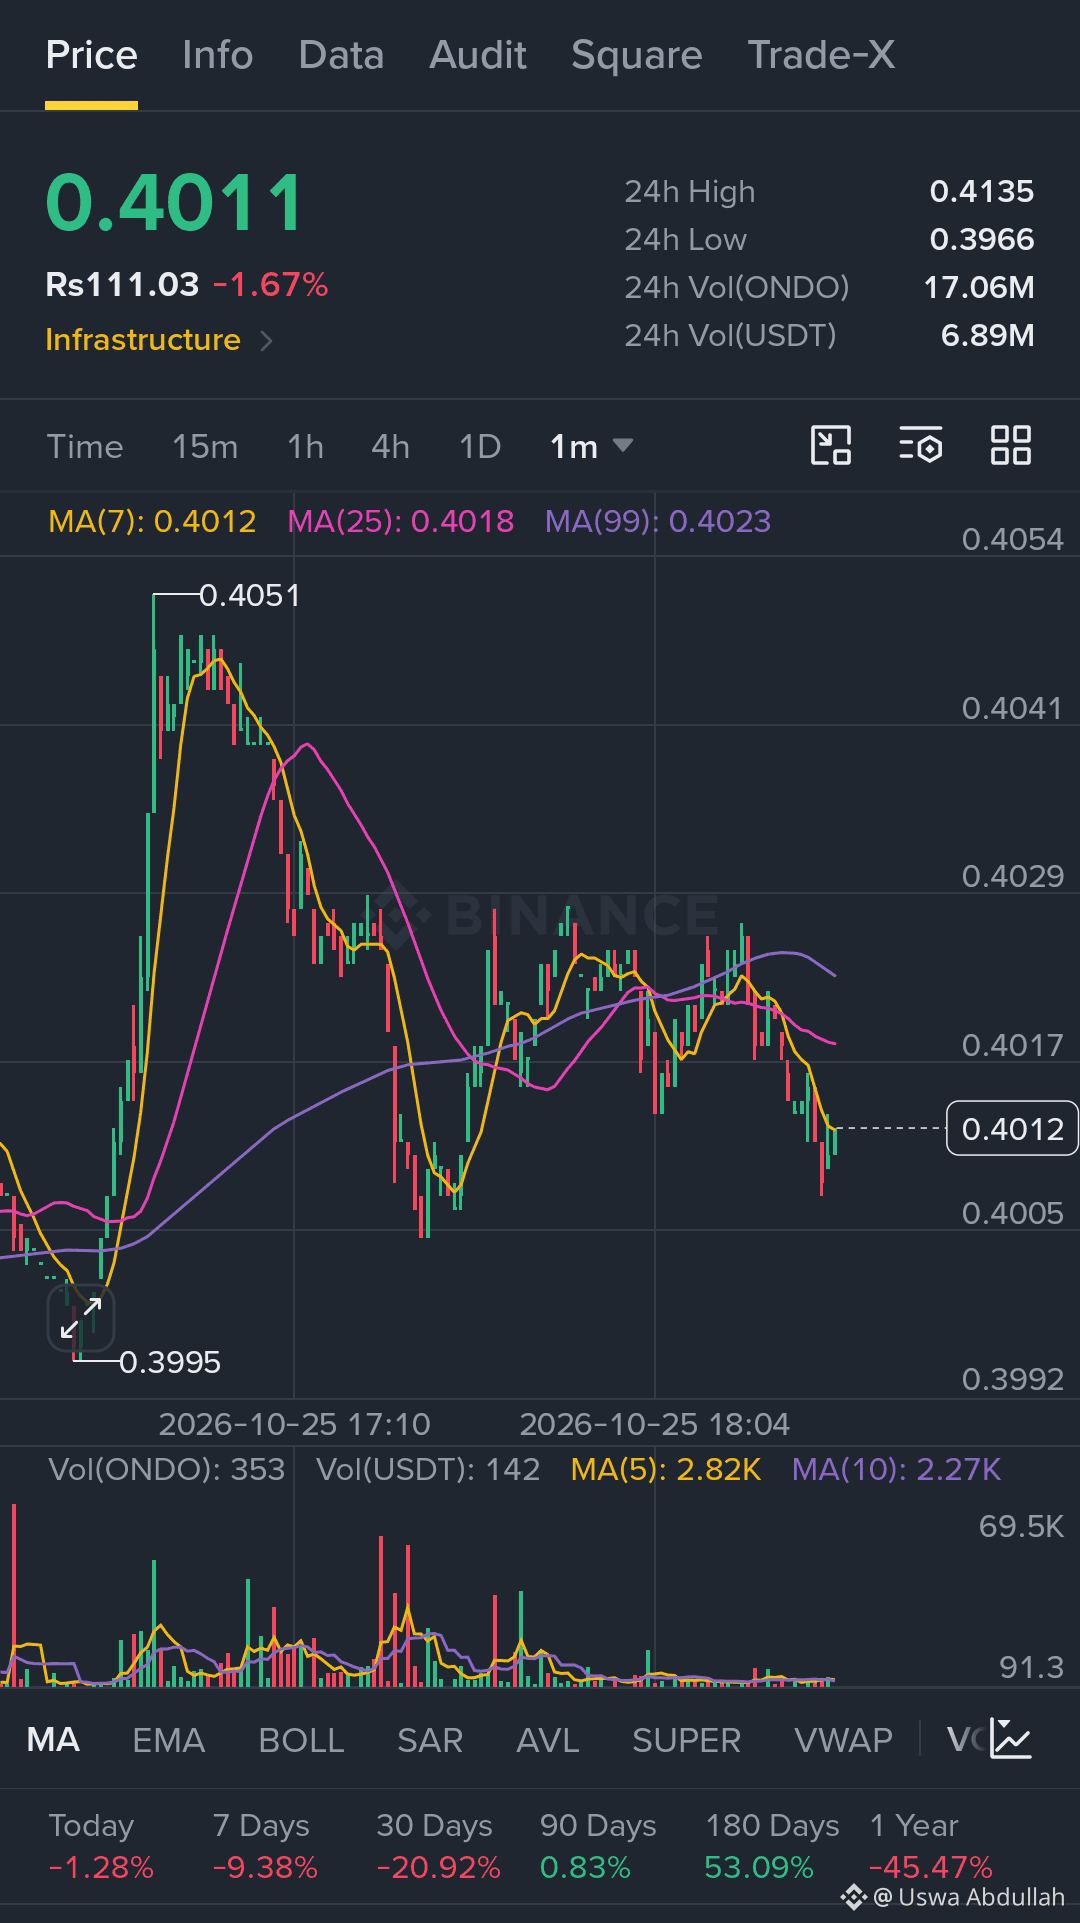
#ONDOUSDT #TodayHotTrends 😎😎😎
#SoonHighJump $1 🤑🤑
#AllTimeHighprice $2.1
{spot}(ONDOUSDT)
Illustrative levels based on the previously mentioned $0.40 support zone; verify the live price before trading.
Entry Zone $0.397–$0.403
TP1 $0.417
TP2 $0.425
TP3 $0.433
Stop Loss (SL) $0.389
### 🚀 $ONDO Coin — Short Analysis Article Today
$ONDO : Bulls Preparing for the Next Move? 📈
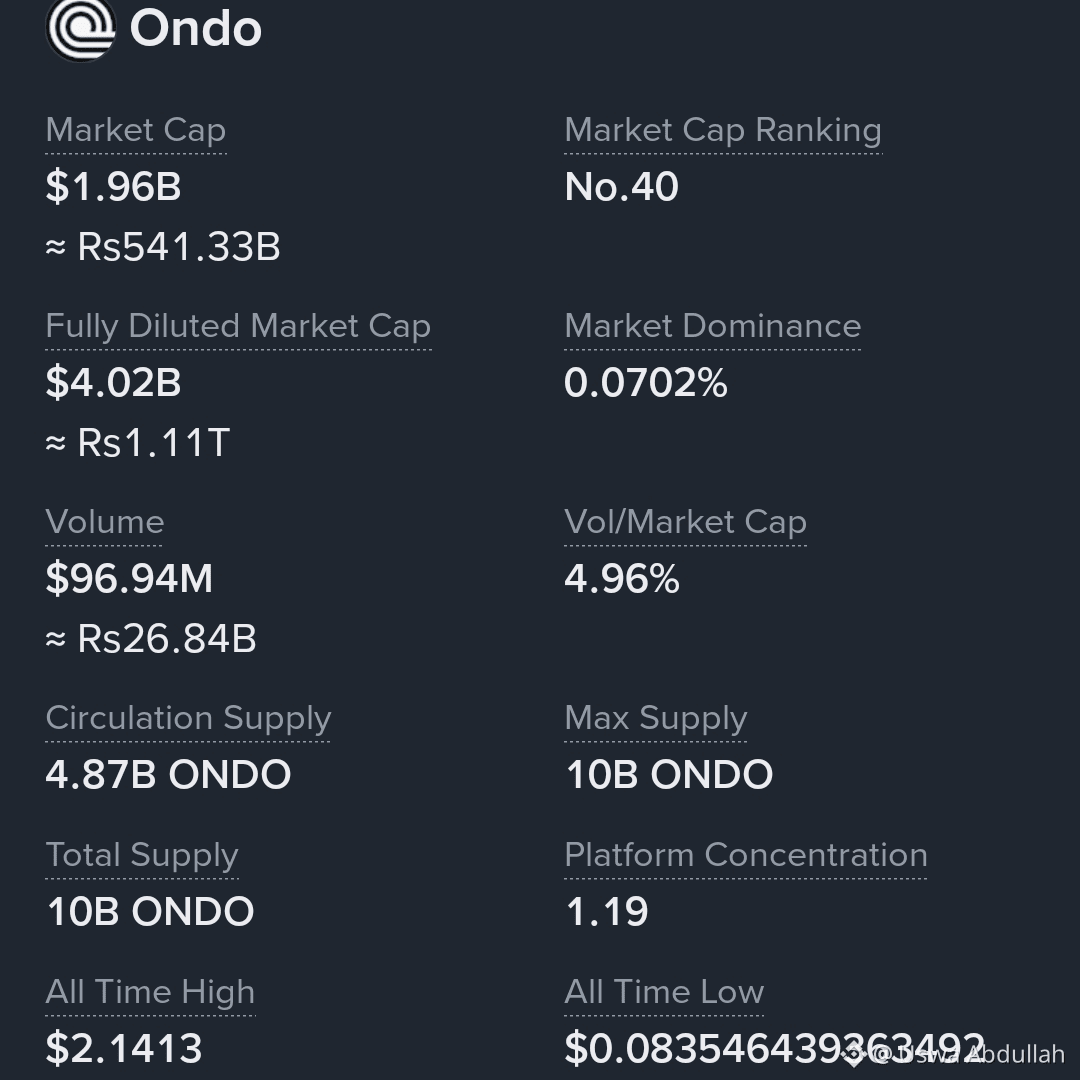
$ONDO is a key project in the real-world asset (RWA) tokenization sector, bringing traditional financial assets onto blockchain infrastructure.
🔹 Bullish scenario: If ONDO breaks above nearby resistance with strong trading volume, it could trigger a short-term recovery.
🔹 Bearish scenario: If support fails, selling pressure may increase and the price could move toward lower support zones.
📊 Key levels to watch today: Recent technical reports place ONDO near $0.40, with support around $0.397–$0.400 and resistance around $0.417–$0.433. A break below support could expose $0.38, while a confirmed breakout may improve the short-term outlook. These levels can change quickly.
#ONDO #OndoFinance #CryptoAnalysis #BinanceSquare #Altcoins
#ONDOUSDT #TodayHotTrends 😎😎😎
#SoonHighJump $1 🤑🤑
#AllTimeHighprice $2.1
Illustrative levels based on the previously mentioned $0.40 support zone; verify the live price before trading.
Entry Zone $0.397–$0.403
TP1 $0.417
TP2 $0.425
TP3 $0.433
Stop Loss (SL) $0.389
### 🚀 $ONDO Coin — Short Analysis Article Today
$ONDO : Bulls Preparing for the Next Move? 📈
$ONDO is a key project in the real-world asset (RWA) tokenization sector, bringing traditional financial assets onto blockchain infrastructure.
🔹 Bullish scenario: If ONDO breaks above nearby resistance with strong trading volume, it could trigger a short-term recovery.
🔹 Bearish scenario: If support fails, selling pressure may increase and the price could move toward lower support zones.
📊 Key levels to watch today: Recent technical reports place ONDO near $0.40, with support around $0.397–$0.400 and resistance around $0.417–$0.433. A break below support could expose $0.38, while a confirmed breakout may improve the short-term outlook. These levels can change quickly.
#ONDO #OndoFinance #CryptoAnalysis #BinanceSquare #Altcoins
14
Войдите, чтобы посмотреть больше материала
Присоединяйтесь к пользователям криптовалют по всему миру на Binance Square
⚡️ Получайте новейшую и полезную информацию о криптоактивах.
💬 Нам доверяет крупнейшая в мире криптобиржа.
👍 Получите достоверные аналитические данные от верифицированных создателей контента.
Эл. почта/номер телефона
В тренде
BinancePick
Просмотров: 2.8M
148,072 обсуждают
Join #EarningsSeason: Predict Earnings on Binance Pick, Share Your Take on Binance Square!
Binance Square Official
·Лайков: 403
·Просмотров: 341k
EarningsSeason
Просмотров: 5.1M
25,288 обсуждают
AnthropicTTMRevenueGrewAbout1200%
Просмотров: 3,125
147 обсуждают