

Avi51
267 Публикации

Avi51
Отправить жалобу
Заблокировать пользователя
📊 Crypto Market Analysis |Trading setups🚀BTC,XAU,Altcoin,Memecoins.Trends,Breakout & Market Insights 🔕 Not Financial Advice.Follow me I am Following
Открытая сделка
Трейдер с частыми сделками
5.4 г
15 подписок(и/а)
17 подписчиков(а)
83 понравилось
Посты
Портфель
Все
Видео
·
--
Рост
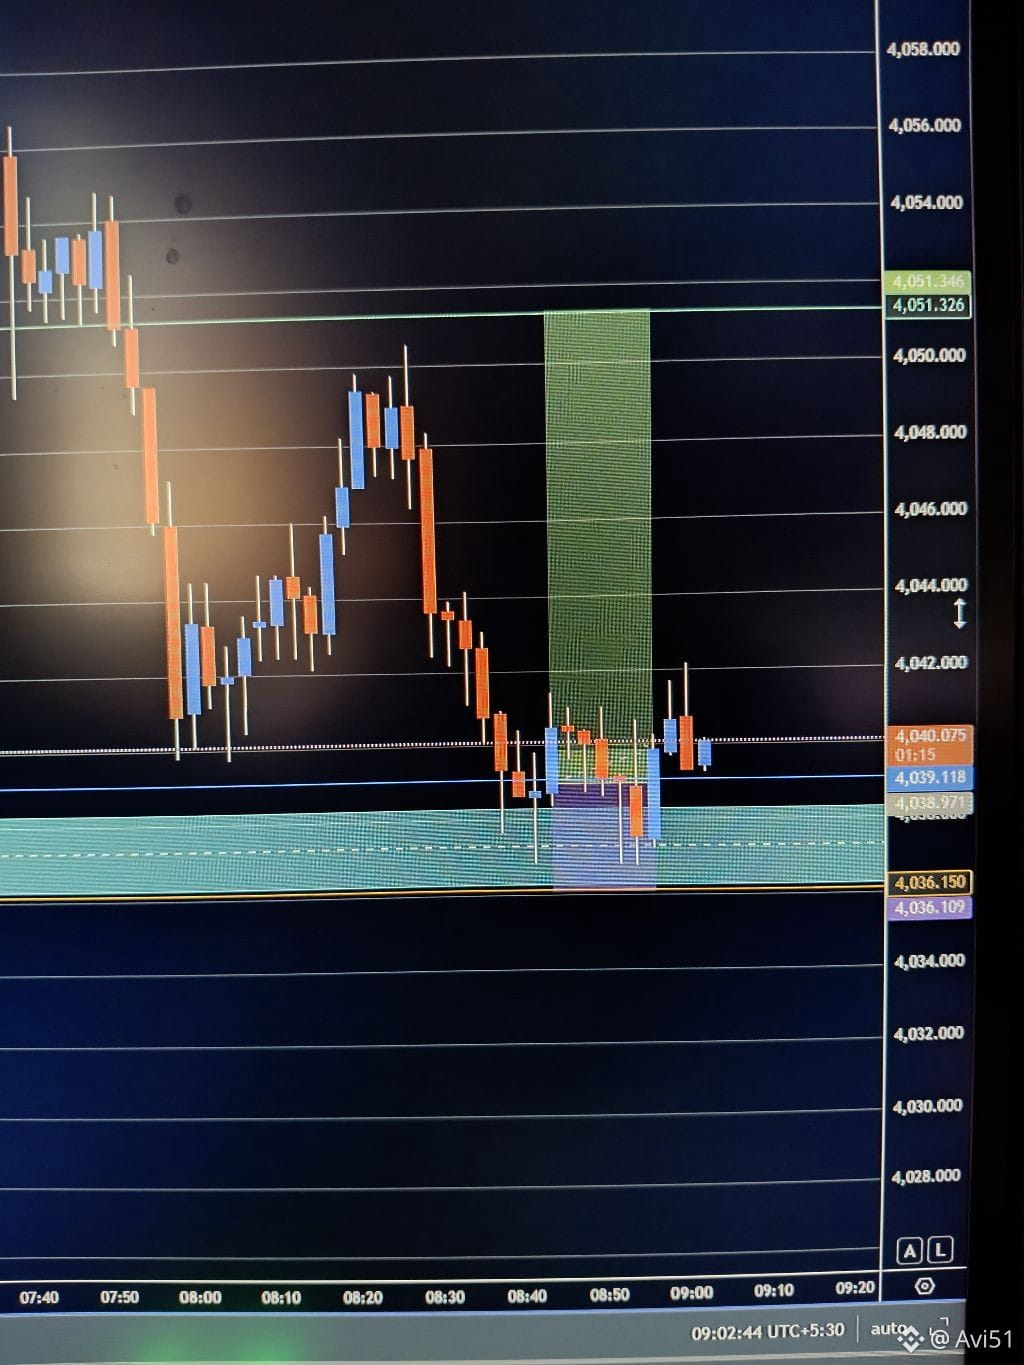
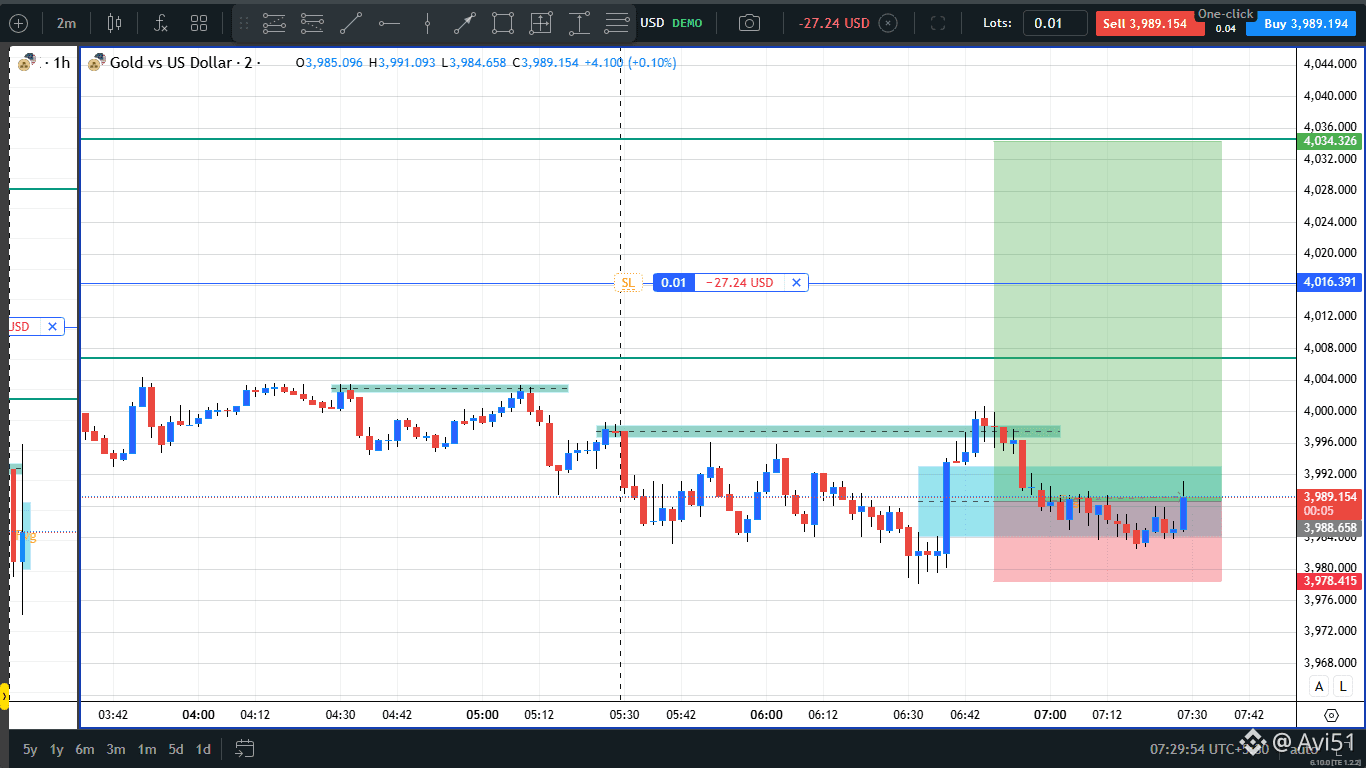
$XAU 🚀🚀🚀🚀
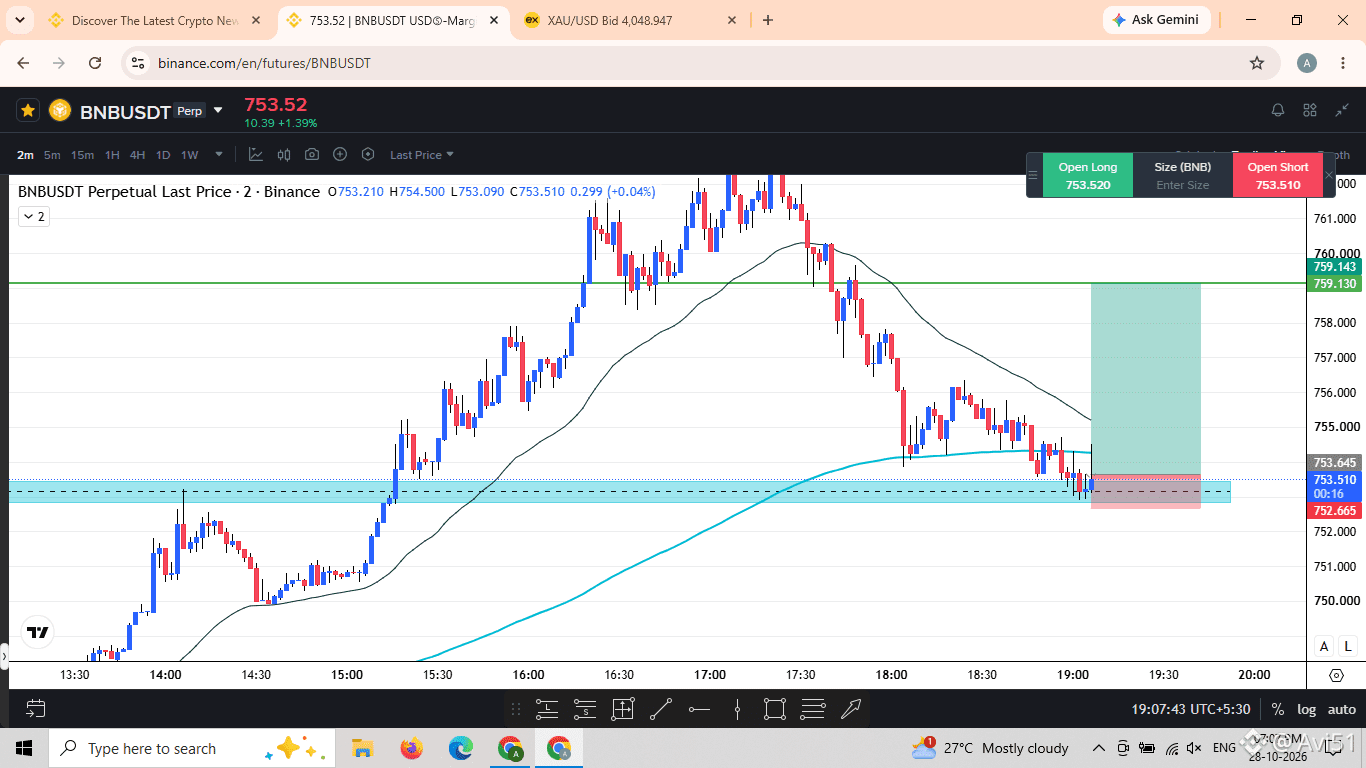
Long small amount
Entry 4039
stop Losses 4036
Tp 4051
Excess
{future}(XAUUSDT)
$XAU 🚀🚀🚀🚀
Long small amount
Entry 4039
stop Losses 4036
Tp 4051
Excess
Long small amount
Entry 4039
stop Losses 4036
Tp 4051
Excess
15
·
--
Рост
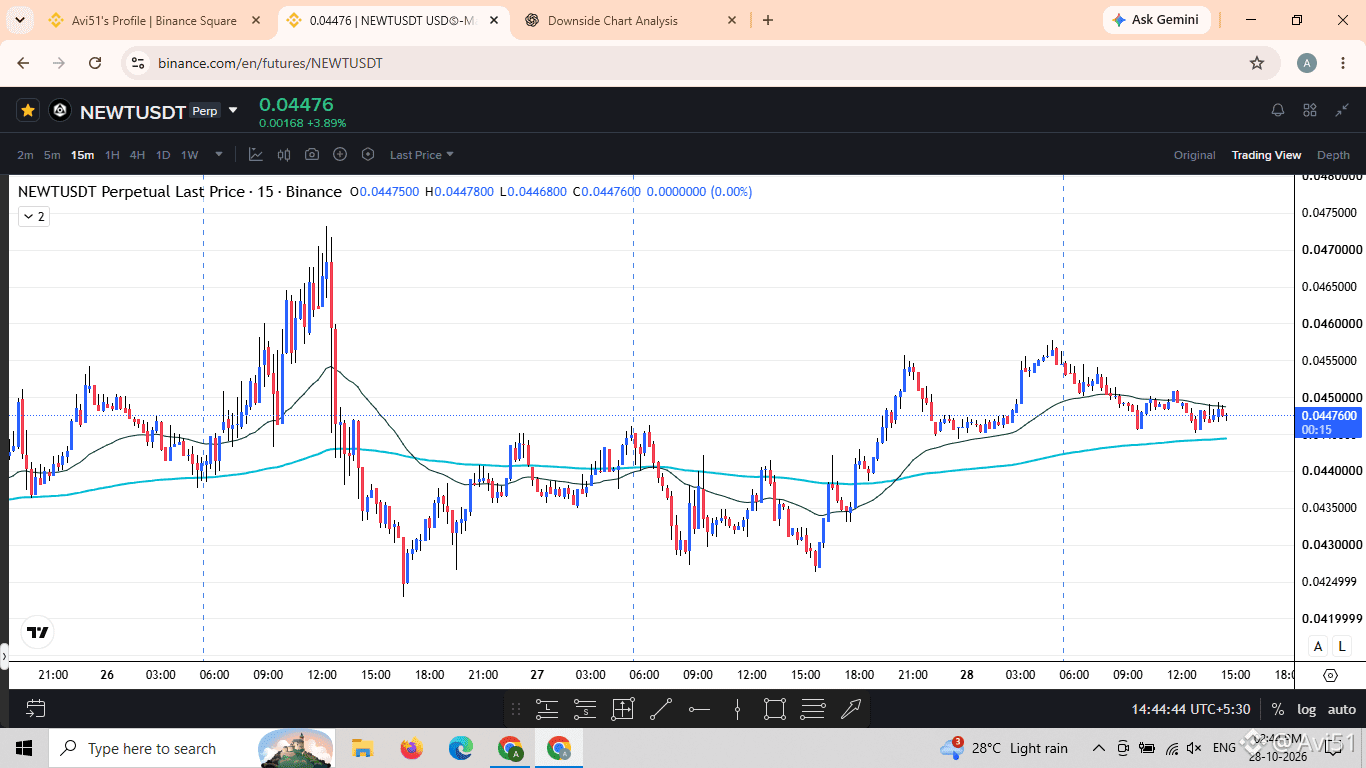
📉 $NEWT USDT UPDATE — A KEY LEVEL TO WATCH!
$NEWT USDT is losing some momentum after being rejected near $0.0456. The price is now consolidating around $0.04476, and the next move could depend on how buyers defend the current support zone.
{future}(NEWTUSDT)
🔴 Bearish scenario:
A breakdown below $0.0445 could open the door toward $0.0440 and $0.0435.
🟢 Bullish scenario:
If buyers reclaim $0.0450–$0.0452 with strong volume, we could see another move toward $0.0455.
📊 My strategy: Watch the support and resistance levels carefully. Confirmation matters more than guessing the direction.
⚠️ The setup is not guaranteed. Manage risk and avoid chasing sudden price movements.
#NEWT #NEWTUSDT #CryptoTrading #TechnicalAnalysis
📉 $NEWT USDT UPDATE — A KEY LEVEL TO WATCH!
$NEWT USDT is losing some momentum after being rejected near $0.0456. The price is now consolidating around $0.04476, and the next move could depend on how buyers defend the current support zone.
🔴 Bearish scenario:
A breakdown below $0.0445 could open the door toward $0.0440 and $0.0435.
🟢 Bullish scenario:
If buyers reclaim $0.0450–$0.0452 with strong volume, we could see another move toward $0.0455.
📊 My strategy: Watch the support and resistance levels carefully. Confirmation matters more than guessing the direction.
⚠️ The setup is not guaranteed. Manage risk and avoid chasing sudden price movements.
#NEWT #NEWTUSDT #CryptoTrading #TechnicalAnalysis
43
·
--
Рост
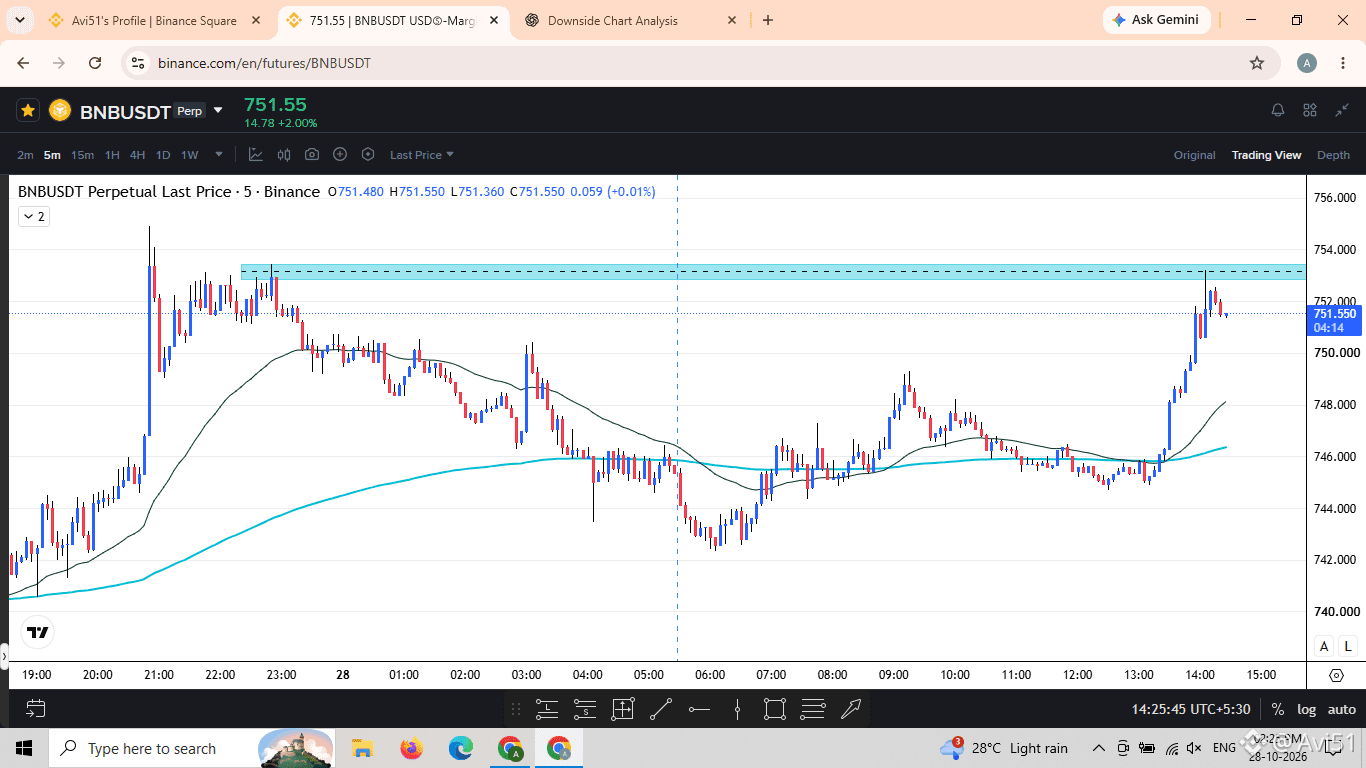
📊 $BNB USDT Chart Analysis — 5-Minute Timeframe
Current Price: $751.55
Market Direction: Short-term bullish, approaching strong resistance ⚠️
Setup: Potential rejection or bullish breakout
{future}(BNBUSDT)
the $753–$754 resistance zone is the key level to watch.
🟢 Bullish signal: Price is holding above the moving averages after a strong rally.🔴 Bearish signal: Rejection near $753–$754 could trigger a short-term pullback.📈 Resistance: $752.50–$754.00.📉 Support: $750.00, $748.00, and $746.00.
SELL Setup
Entry zone: $752.50–$753.50 after bearish confirmationStop-loss: $754.30Target 1: $751.00Target 2: $750.00Target 3: $748.00
BUY Setup
Entry: After a confirmed breakout and successful retest above $754Stop-loss: Below the retest lowPotential targets: $755 and $756
If buyers break above $754 with strong volume, we could see further upside toward $755–$756.
However, if the price gets rejected at resistance, a pullback toward $750 or even $748 could follow.
My focus is on confirmation rather than chasing the pump. Let the price action decide the next move.
⚠️ Manage risk carefully, especially on the 5-minute timeframe.
#BNB #BNBUSDT #CryptoTrading #TechnicalAnalysis
📊 $BNB USDT Chart Analysis — 5-Minute Timeframe
Current Price: $751.55
Market Direction: Short-term bullish, approaching strong resistance ⚠️
Setup: Potential rejection or bullish breakout
the $753–$754 resistance zone is the key level to watch.
🟢 Bullish signal: Price is holding above the moving averages after a strong rally.🔴 Bearish signal: Rejection near $753–$754 could trigger a short-term pullback.📈 Resistance: $752.50–$754.00.📉 Support: $750.00, $748.00, and $746.00.
SELL Setup
Entry zone: $752.50–$753.50 after bearish confirmationStop-loss: $754.30Target 1: $751.00Target 2: $750.00Target 3: $748.00
BUY Setup
Entry: After a confirmed breakout and successful retest above $754Stop-loss: Below the retest lowPotential targets: $755 and $756
If buyers break above $754 with strong volume, we could see further upside toward $755–$756.
However, if the price gets rejected at resistance, a pullback toward $750 or even $748 could follow.
My focus is on confirmation rather than chasing the pump. Let the price action decide the next move.
⚠️ Manage risk carefully, especially on the 5-minute timeframe.
#BNB #BNBUSDT #CryptoTrading #TechnicalAnalysis
62
·
--
Падение
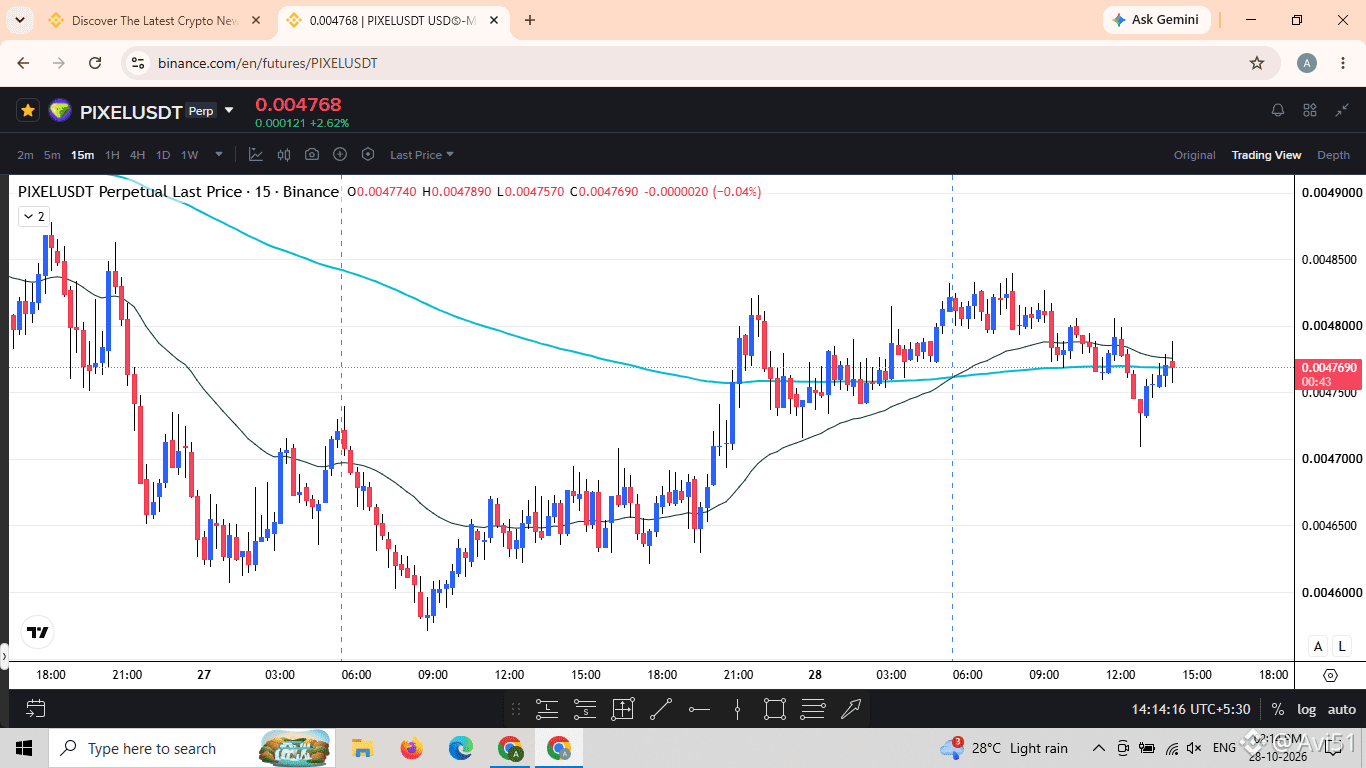
📉 $PIXEL USDT
$PIXEL USDT recently rallied from around 0.00458 to 0.00483, but the price has started pulling back from the recent high.
Trend: Short-term momentum is weakening after the recent rally.
Resistance: Sellers may appear near 0.00480–0.00483.Support: The price is testing the 0.00475–0.00476 area.Moving averages: Price is near the moving-average lines, suggesting indecision and a possible change in short-term momentum.
Downside risk: A confirmed break below 0.00475 could trigger another move lower.
📉 Possible SELL Setup
Entry zone: 0.00476–0.00479, only if bearish rejection is confirmed
Stop-loss: 0.00484
Target 1: 0.00472
Target 2: 0.00470
Target 3: 0.00465
Confirmation: A 15-minute candle closing below 0.00475, preferably with increasing selling volume, would strengthen the bearish scenario.
Invalidation: A sustained move above 0.00483 could weaken the downside setup.
⚠️ However, if buyers defend support and push the price above 0.00483, the bearish setup could fail.
🎯 My focus is on confirmation rather than chasing the move.
Trade carefully, manage your risk, and always wait for the chart to confirm the direction.
#PIXEL #CryptoTrading #TechnicalAnalysis #Altcoins
{future}(PIXELUSDT)
📉 $PIXEL USDT
$PIXEL USDT recently rallied from around 0.00458 to 0.00483, but the price has started pulling back from the recent high.
Trend: Short-term momentum is weakening after the recent rally.
Resistance: Sellers may appear near 0.00480–0.00483.Support: The price is testing the 0.00475–0.00476 area.Moving averages: Price is near the moving-average lines, suggesting indecision and a possible change in short-term momentum.
Downside risk: A confirmed break below 0.00475 could trigger another move lower.
📉 Possible SELL Setup
Entry zone: 0.00476–0.00479, only if bearish rejection is confirmed
Stop-loss: 0.00484
Target 1: 0.00472
Target 2: 0.00470
Target 3: 0.00465
Confirmation: A 15-minute candle closing below 0.00475, preferably with increasing selling volume, would strengthen the bearish scenario.
Invalidation: A sustained move above 0.00483 could weaken the downside setup.
⚠️ However, if buyers defend support and push the price above 0.00483, the bearish setup could fail.
🎯 My focus is on confirmation rather than chasing the move.
Trade carefully, manage your risk, and always wait for the chart to confirm the direction.
#PIXEL #CryptoTrading #TechnicalAnalysis #Altcoins
82
·
--
Падение
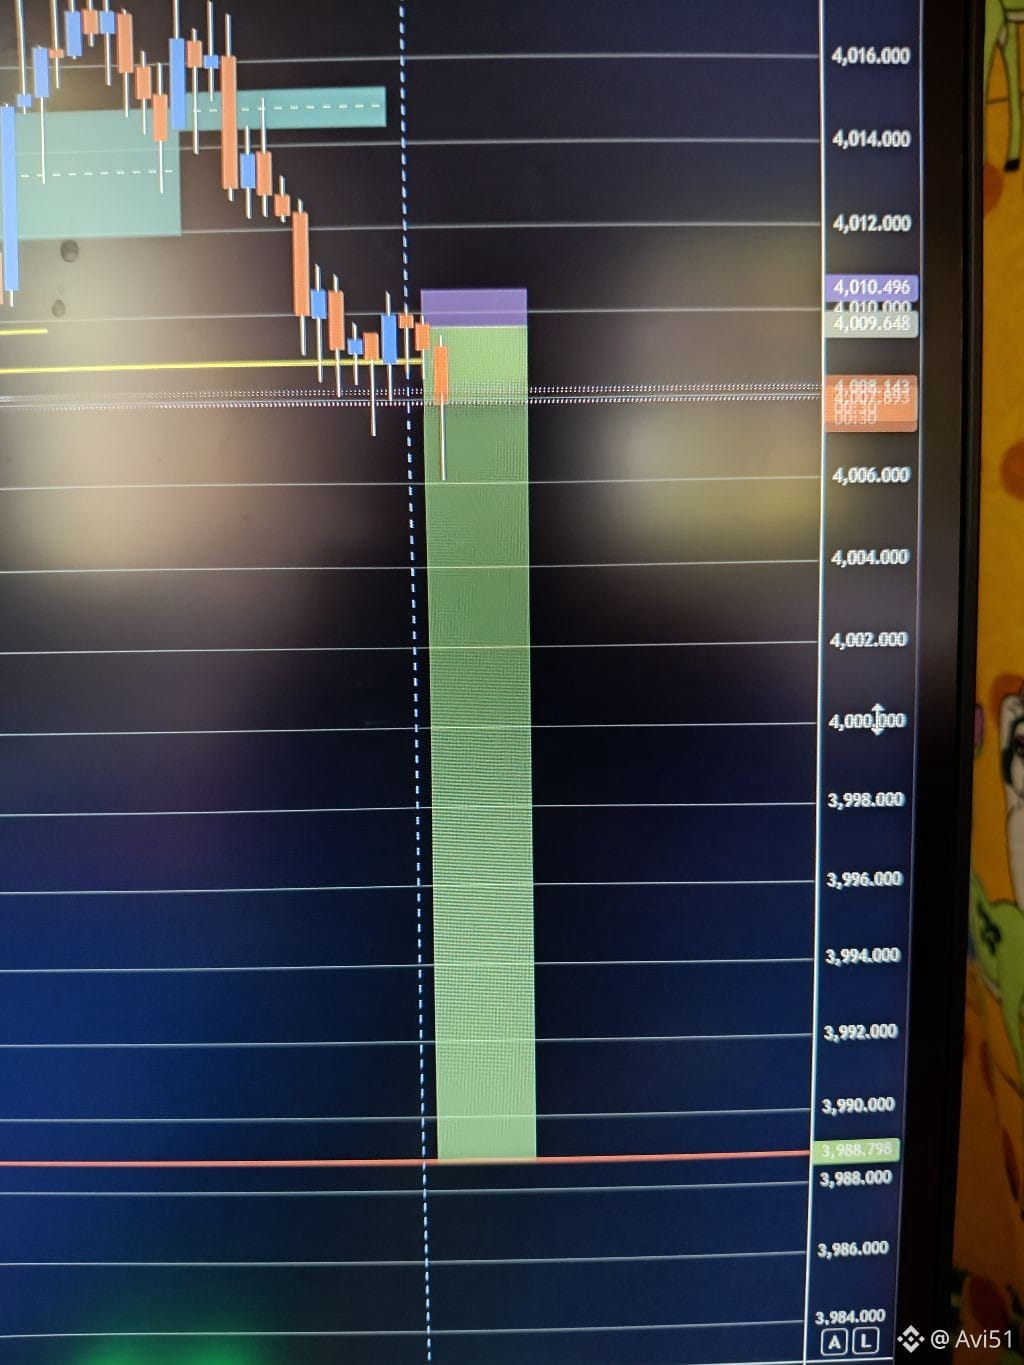
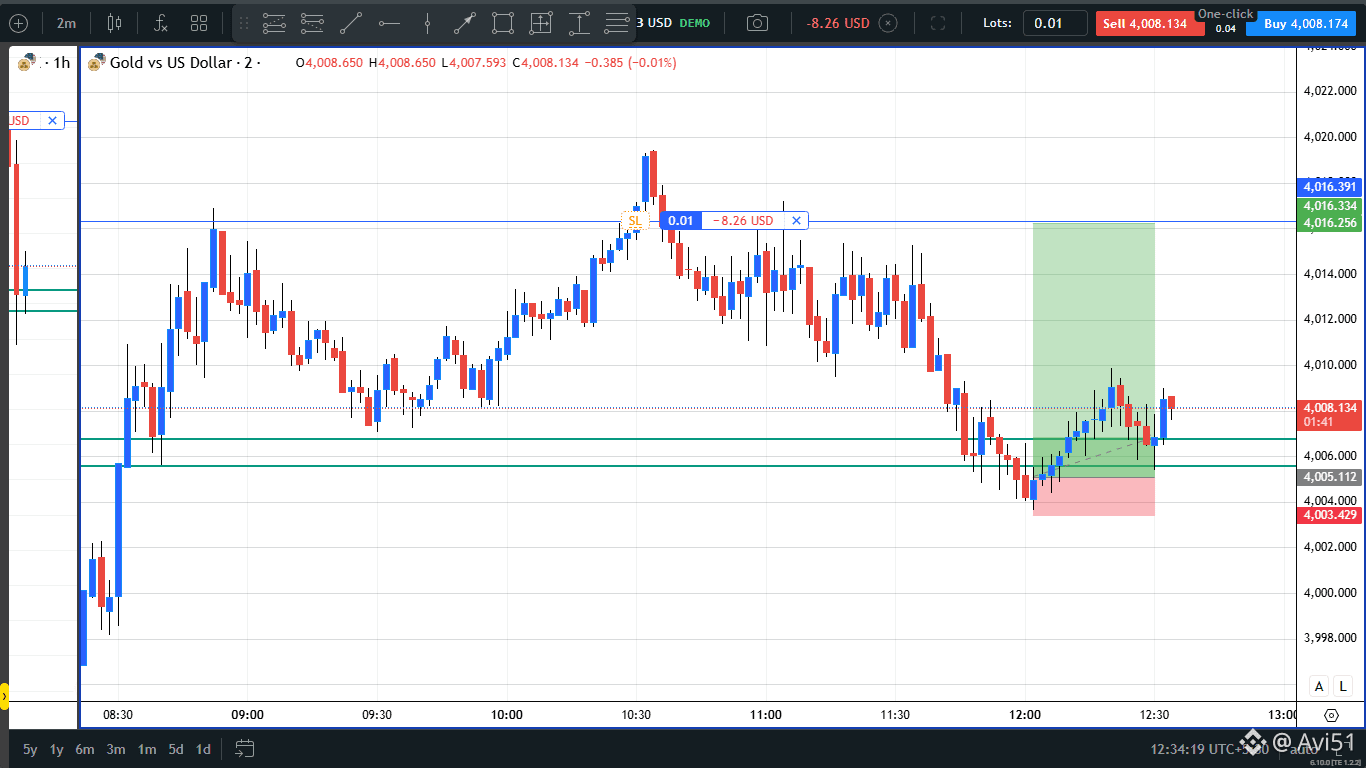
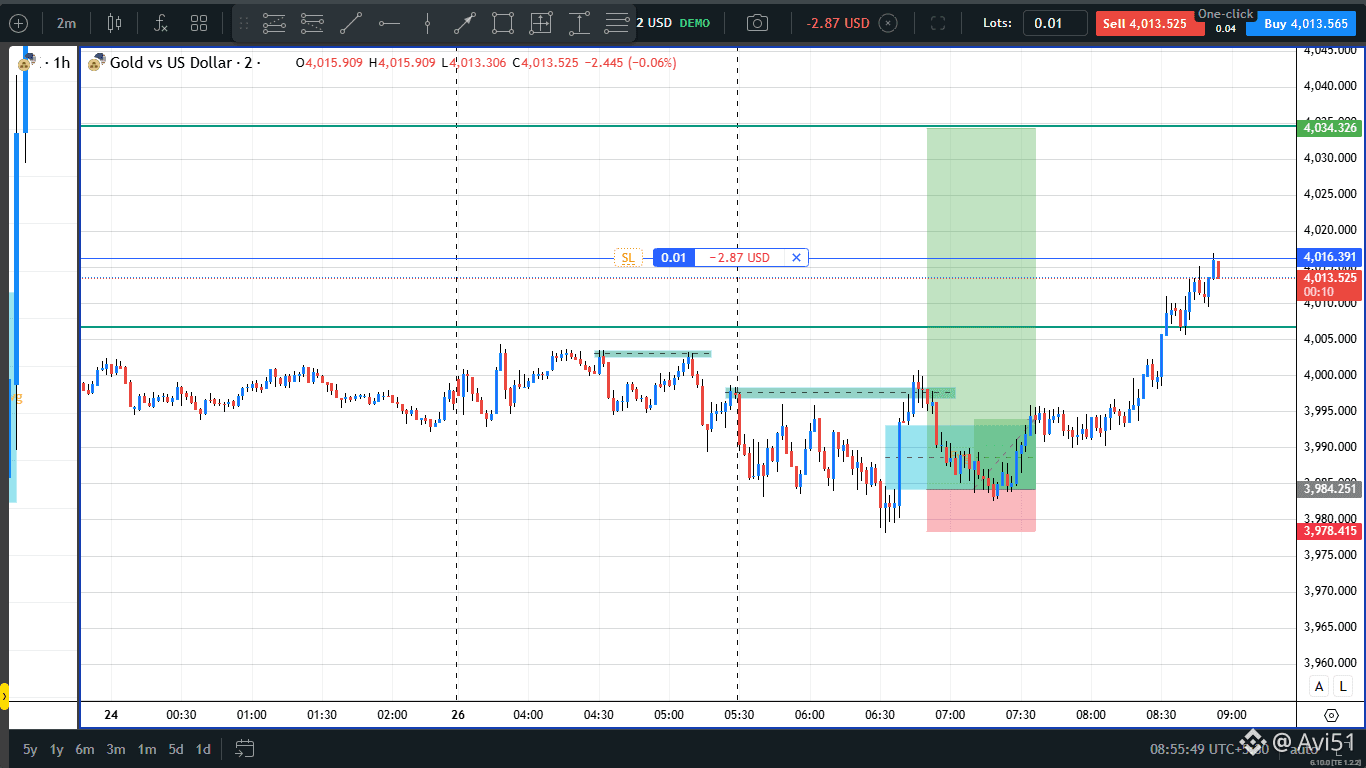
$XAU short 🚀🚀🚀
Entry 4009.6
stop Losses 4010.5
target 4003, 3988.8
$XAU short 🚀🚀🚀
Entry 4009.6
stop Losses 4010.5
target 4003, 3988.8
Entry 4009.6
stop Losses 4010.5
target 4003, 3988.8
74
·
--
Рост
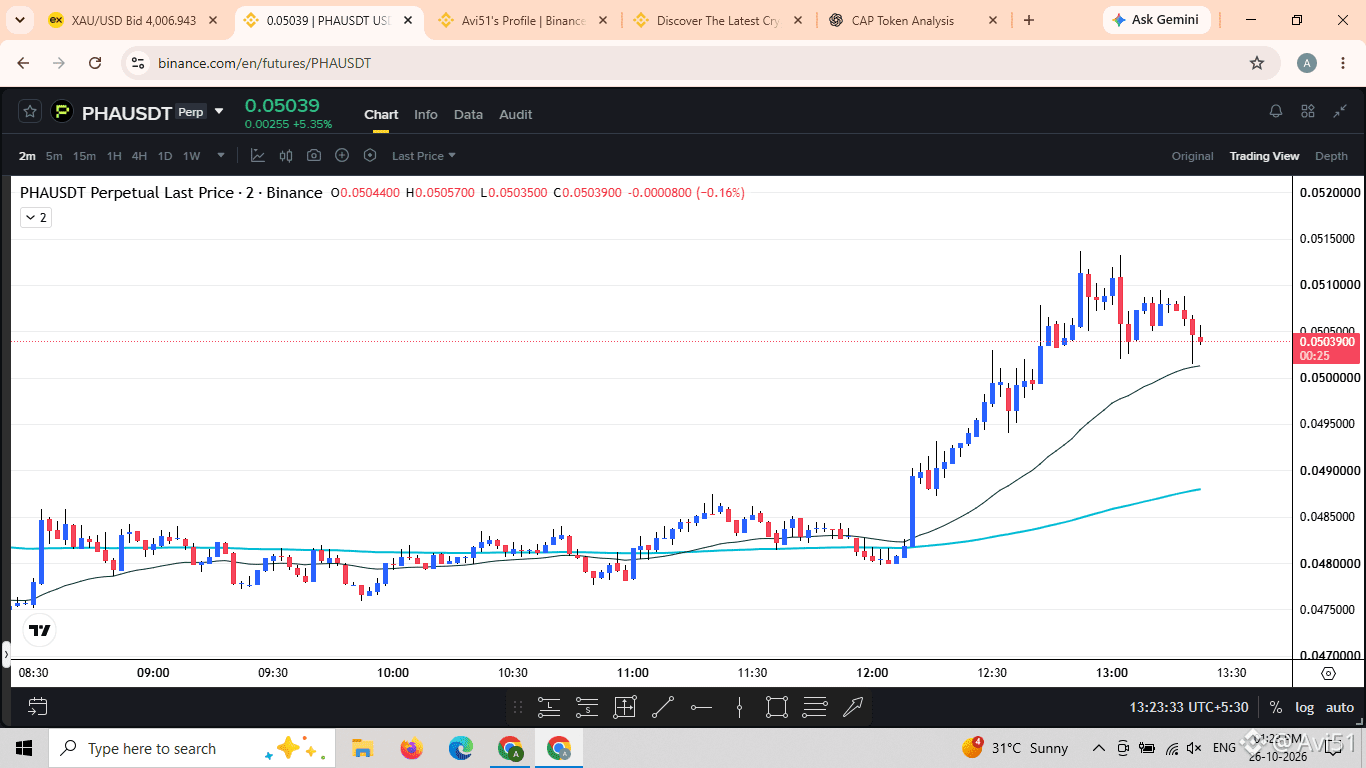
$PHA USDT UPDATE — Can Buyers Make a Comeback?
{future}(PHAUSDT)
$PHA is showing signs of a possible short-term recovery after recent selling pressure, but the overall trend still needs confirmation.
🔹 Resistance: $0.0500–$0.0505
🔹 Next resistance: $0.0530–$0.0540
🔹 Support: $0.0465–$0.0470
🟢 A sustained move above resistance could signal improving momentum.
🔴 A breakdown below support could bring renewed selling pressure.
For now, the key is to watch how the price reacts around these levels. A recovery is possible, but confirmation matters more than speculation.
#PHA #PHAUSDT #CryptoAnalysis #TechnicalAnalysis
$PHA USDT UPDATE — Can Buyers Make a Comeback?
$PHA is showing signs of a possible short-term recovery after recent selling pressure, but the overall trend still needs confirmation.
🔹 Resistance: $0.0500–$0.0505
🔹 Next resistance: $0.0530–$0.0540
🔹 Support: $0.0465–$0.0470
🟢 A sustained move above resistance could signal improving momentum.
🔴 A breakdown below support could bring renewed selling pressure.
For now, the key is to watch how the price reacts around these levels. A recovery is possible, but confirmation matters more than speculation.
#PHA #PHAUSDT #CryptoAnalysis #TechnicalAnalysis
1
4
·
--
Рост
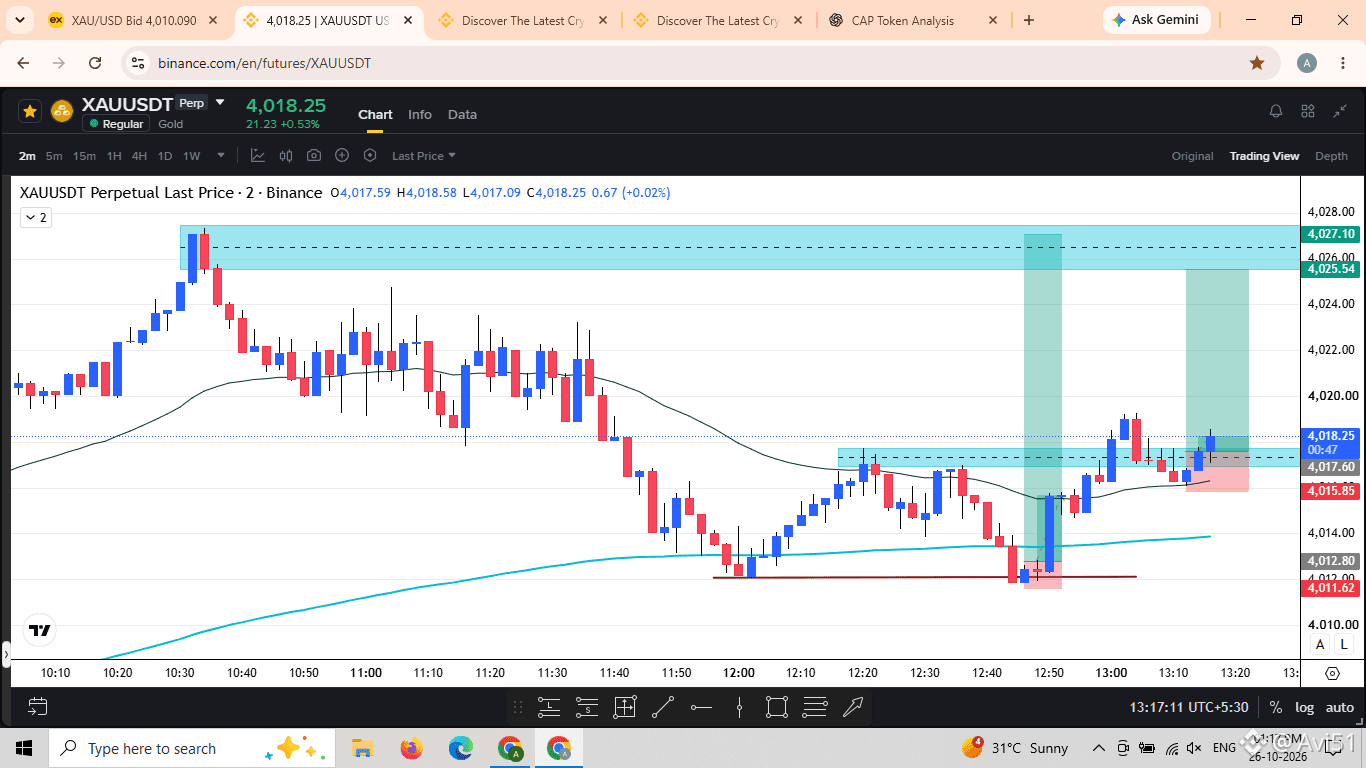
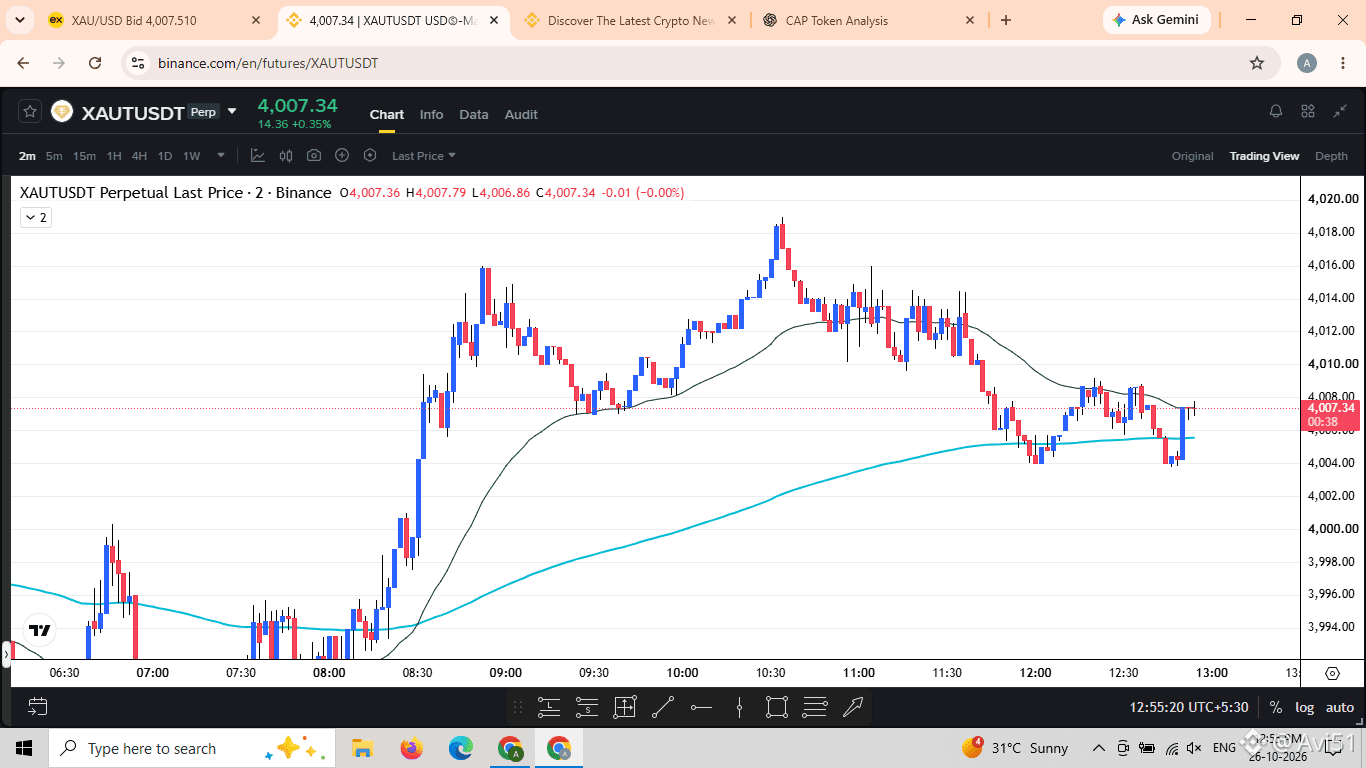
🥇 $XAUT USDT UPDATE
{future}(XAUTUSDT)
Tether Gold is attempting to stabilize after recent selling pressure. The next move depends on whether buyers can maintain momentum or sellers regain control.
📊 Resistance: $4,015–$4,020
🟢 Support: Around $3,998
🔻 Lower reference zone: Around $3,980
A sustained move above resistance could signal recovery, while a break below support may indicate renewed weakness.
Short-term price movements can be noisy, so avoid drawing conclusions from a single candle.
#XAUTUSDT #TetherGold #GoldMarke t #MarketAnalysis
🥇 $XAUT USDT UPDATE
Tether Gold is attempting to stabilize after recent selling pressure. The next move depends on whether buyers can maintain momentum or sellers regain control.
📊 Resistance: $4,015–$4,020
🟢 Support: Around $3,998
🔻 Lower reference zone: Around $3,980
A sustained move above resistance could signal recovery, while a break below support may indicate renewed weakness.
Short-term price movements can be noisy, so avoid drawing conclusions from a single candle.
#XAUTUSDT #TetherGold #GoldMarke t #MarketAnalysis
1
4
·
--
Рост
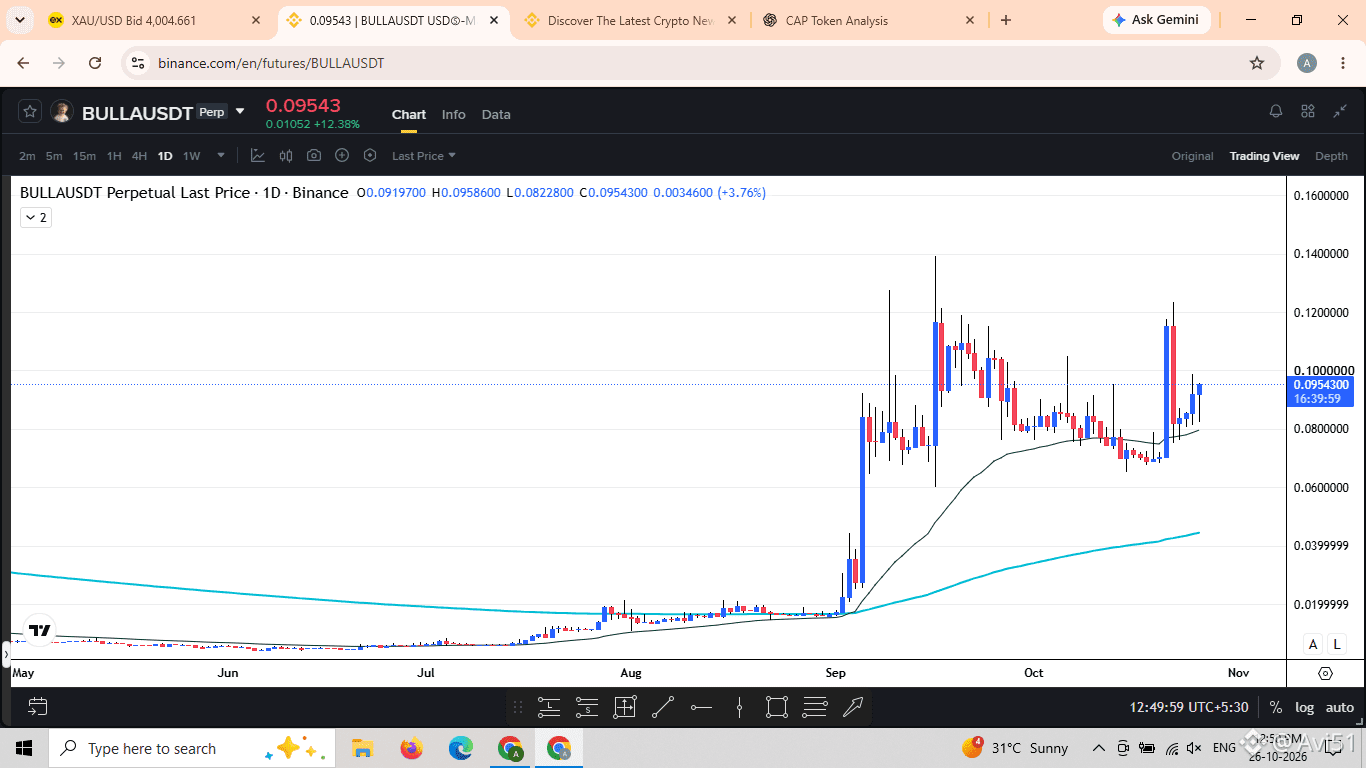
Recent market data for $BULLA shows positive momentum. One market snapshot reported a price near $0.0903, with the price up approximately 6.56% over 24 hours
Bullish Scenario
A sustained move above the latest hourly resistance could indicate further upside.Strong trading volume would help confirm the move.A failed breakout could lead to a pullback.
🔴 Bearish Scenario
Losing the latest hourly support could weaken momentum.A lower high followed by a lower low would suggest increasing selling pressure.
$BULLA is showing positive short-term momentum, but the next move depends on whether buyers can maintain their strength.
🟢 Bullish signal: A confirmed breakout above hourly resistance with strong volume.
🔴 Bearish signal: A breakdown below hourly support could weaken the current structure.
👀 Keep an eye on volume and hourly candle closes before drawing conclusions. In a volatile market, protecting capital is just as important as spotting opportunities.
#BULLA #BULLAUSDT #CryptoAnalysis #TechnicalAnalysis
{future}(BULLAUSDT)
Recent market data for $BULLA shows positive momentum. One market snapshot reported a price near $0.0903, with the price up approximately 6.56% over 24 hours
Bullish Scenario
A sustained move above the latest hourly resistance could indicate further upside.Strong trading volume would help confirm the move.A failed breakout could lead to a pullback.
🔴 Bearish Scenario
Losing the latest hourly support could weaken momentum.A lower high followed by a lower low would suggest increasing selling pressure.
$BULLA is showing positive short-term momentum, but the next move depends on whether buyers can maintain their strength.
🟢 Bullish signal: A confirmed breakout above hourly resistance with strong volume.
🔴 Bearish signal: A breakdown below hourly support could weaken the current structure.
👀 Keep an eye on volume and hourly candle closes before drawing conclusions. In a volatile market, protecting capital is just as important as spotting opportunities.
#BULLA #BULLAUSDT #CryptoAnalysis #TechnicalAnalysis
1
1
·
--
Рост
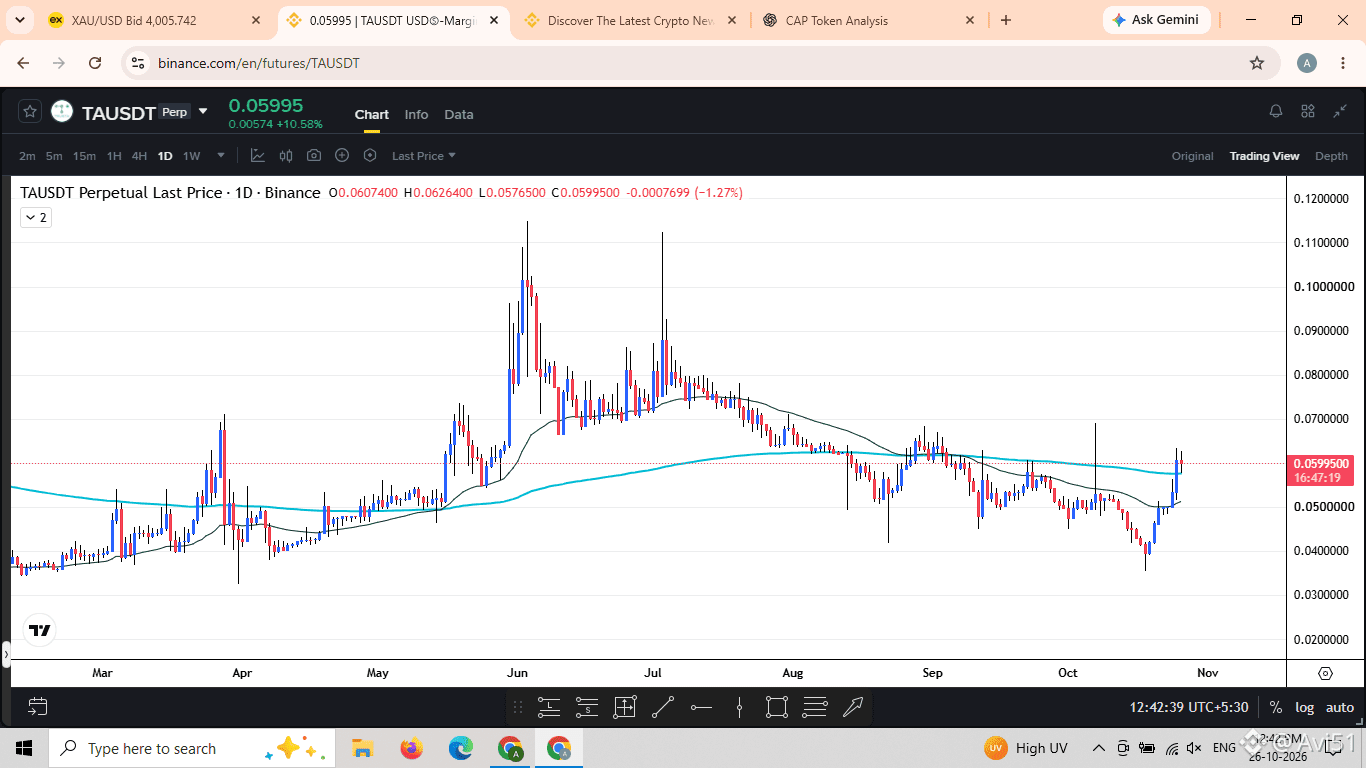
$TA USDT — DAILY CHART WATCH
The daily timeframe is important for understanding the broader market trend. Traders should watch key support and resistance levels and wait for confirmation before drawing conclusions.
🟢 A confirmed breakout above resistance may indicate improving momentum.
🔴 A breakdown below support may signal further weakness.
⚠️ Always consider trading volume and market volatility. No breakout or price target is guaranteed.
#TAUSDT #CryptoAnalysis #TechnicalAnalysis
1
2
·
--
Рост
$PLAY is showing signs of weakness, and buyers still need to prove they can regain control.
{future}(PLAYUSDT)
📈 Bullish Scenario
A sustained move above $0.000598 could indicate improving momentum.Stronger buying activity would help confirm a potential recovery.A breakout without meaningful volume may fail.
📉 Bearish Scenario
A break below $0.000572 could indicate continued weakness.The $0.000530 area is another level to watch.Low liquidity can increase price volatility.
🔹 Resistance: $0.000598
🔹 Support: $0.000572
🔹 Next support zone: $0.000530
A breakout above resistance with stronger volume could signal a potential recovery. However, losing support may put additional pressure on the price.
For now, confirmation matters more than excitement. Keep an eye on trading volume and remember that low-liquidity tokens can move sharply in either direction.
#PLAY #Solana #CryptoAnalysis #GamingTokens
$PLAY is showing signs of weakness, and buyers still need to prove they can regain control.
📈 Bullish Scenario
A sustained move above $0.000598 could indicate improving momentum.Stronger buying activity would help confirm a potential recovery.A breakout without meaningful volume may fail.
📉 Bearish Scenario
A break below $0.000572 could indicate continued weakness.The $0.000530 area is another level to watch.Low liquidity can increase price volatility.
🔹 Resistance: $0.000598
🔹 Support: $0.000572
🔹 Next support zone: $0.000530
A breakout above resistance with stronger volume could signal a potential recovery. However, losing support may put additional pressure on the price.
For now, confirmation matters more than excitement. Keep an eye on trading volume and remember that low-liquidity tokens can move sharply in either direction.
#PLAY #Solana #CryptoAnalysis #GamingTokens
1
1
·
--
Падение
1
3
·
--
Рост
1
2
·
--
Рост
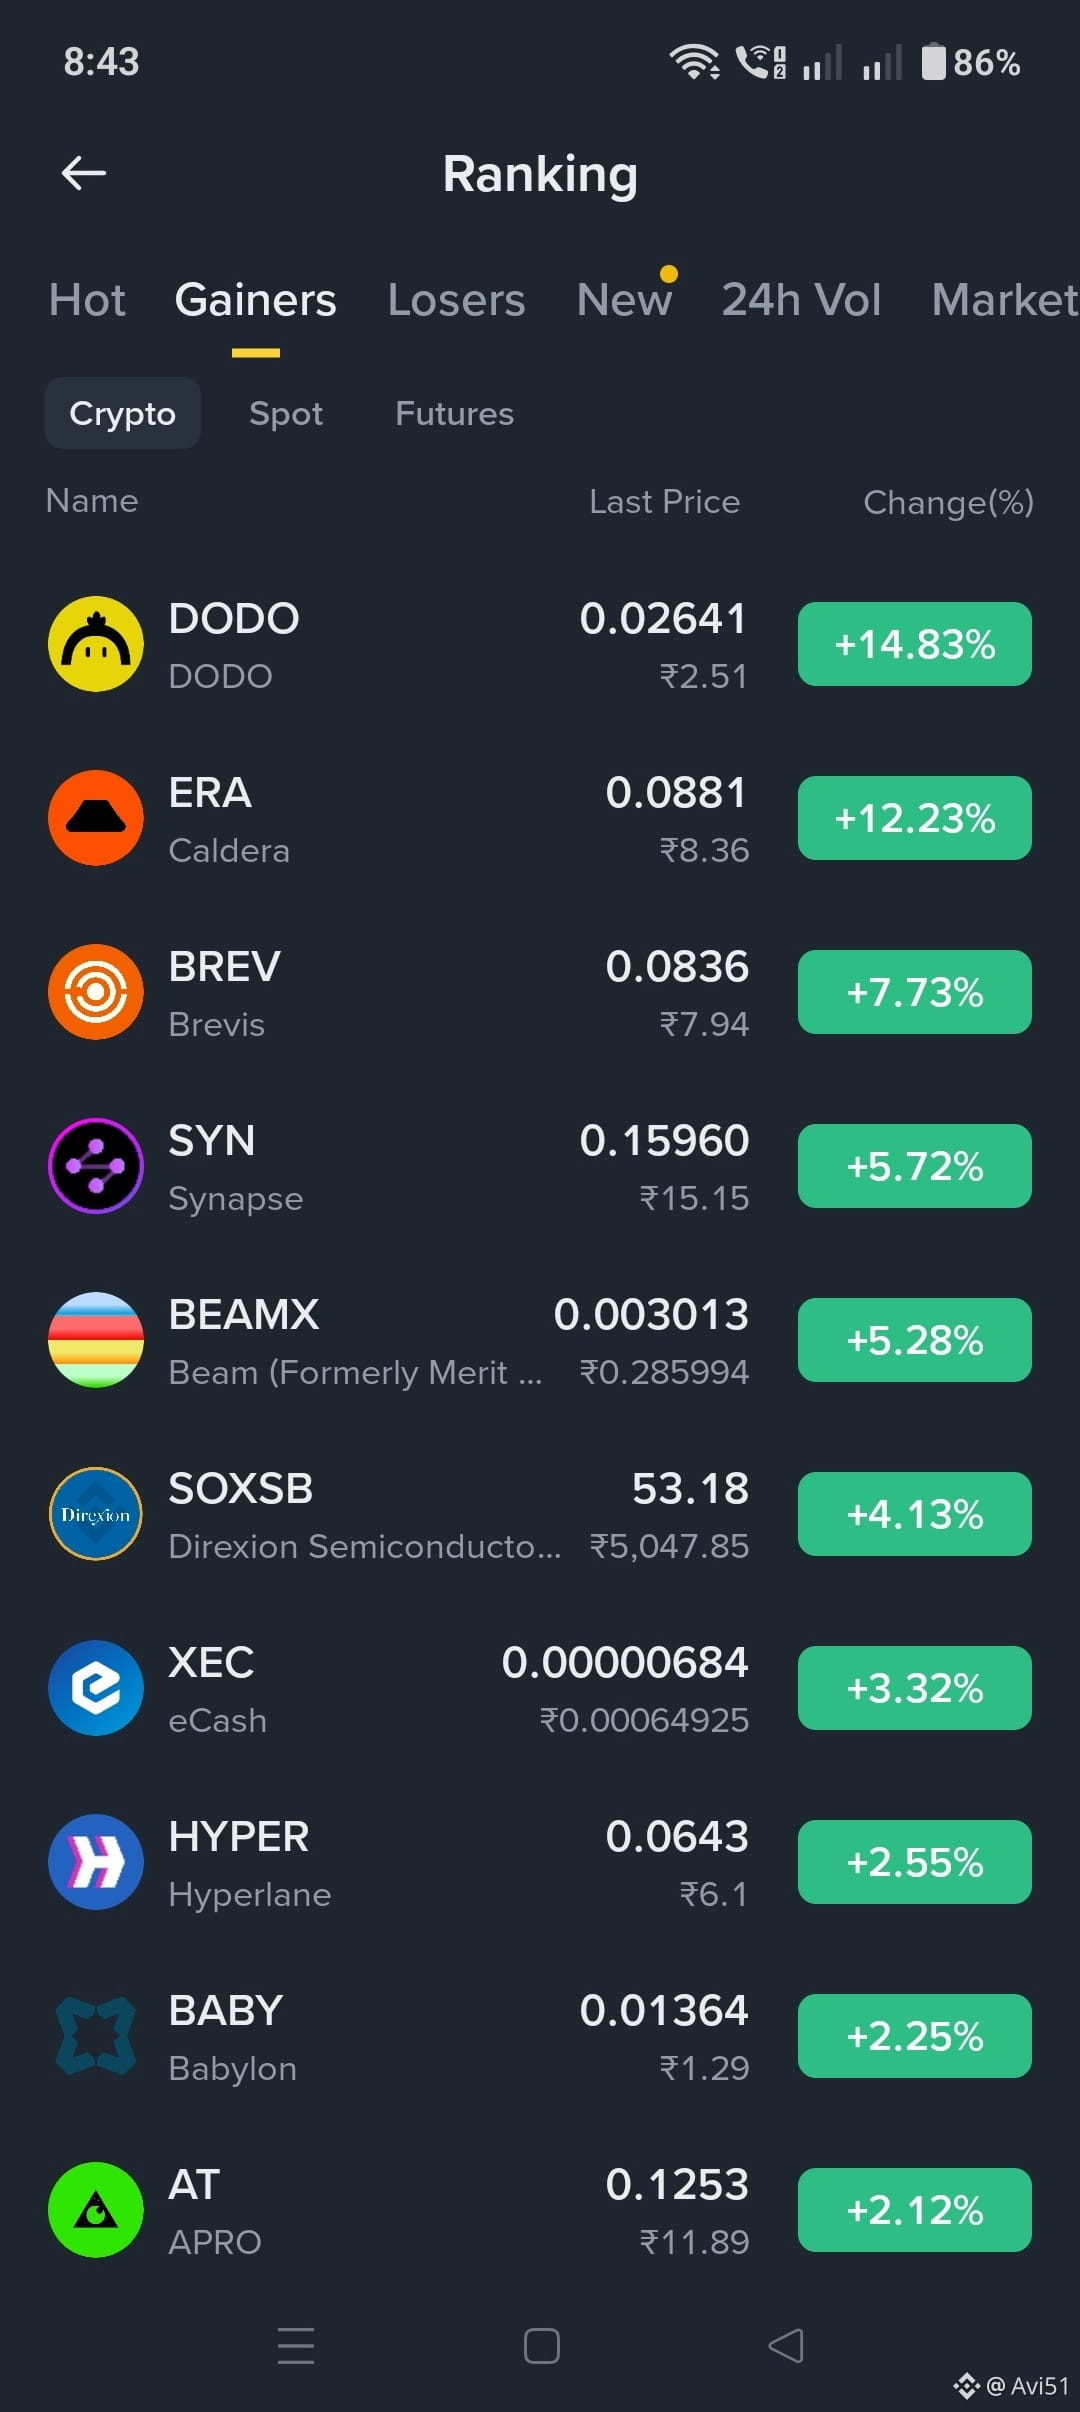
Today Top Ganer 🚀
$DODO
{spot}(DODOUSDT)
$ERA
{future}(ERAUSDT)
$BREV
{future}(BREVUSDT)
Today Top Ganer 🚀
$DODO
$ERA
$BREV
$DODO
$ERA
$BREV
1
16
·
--
Рост
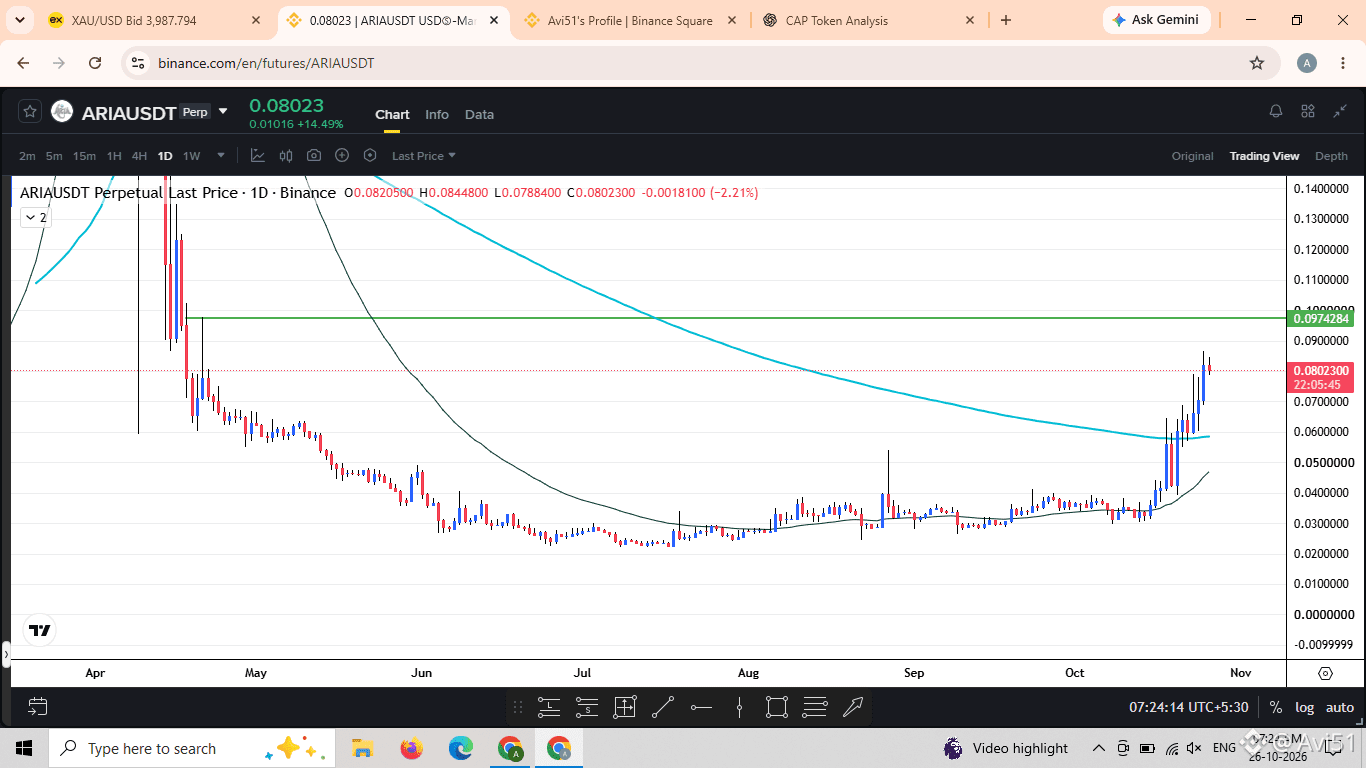
$ARIA has recently shown strong upward momentum. Market data reported a price around $0.084
{future}(ARIAUSDT)
Bullish Scenario
A sustained move above $0.087 could indicate continued buying pressure.A confirmed breakout above $0.090 may open the way toward the next resistance zone.Trading volume can help assess whether the move has strength.
📉 Bearish Scenario
Failure to break resistance could lead to profit-taking.A decline below $0.078 may weaken the short-term structure.The $0.068–$0.072 area is another zone to monitor.
Overall outlook: Short-term bullish momentum, but caution is warranted after the recent rally.
$ARIA has been showing impressive upward momentum, bringing fresh attention to the token. The big question now is whether buyers can maintain this strength or if the market will see a short-term pullback.
📊 Resistance: $0.085–$0.087
🟢 Support: $0.078–$0.080
🎯 Next resistance zone: $0.090–$0.095
A strong breakout with sustained volume could support further upside, while losing key support may lead to a correction.
Remember, strong rallies don't always continue in a straight line. Stay patient and avoid treating any price target as guaranteed.
#ARİA #AriaAI #CryptoAnalysis #Altcoins
$ARIA has recently shown strong upward momentum. Market data reported a price around $0.084
Bullish Scenario
A sustained move above $0.087 could indicate continued buying pressure.A confirmed breakout above $0.090 may open the way toward the next resistance zone.Trading volume can help assess whether the move has strength.
📉 Bearish Scenario
Failure to break resistance could lead to profit-taking.A decline below $0.078 may weaken the short-term structure.The $0.068–$0.072 area is another zone to monitor.
Overall outlook: Short-term bullish momentum, but caution is warranted after the recent rally.
$ARIA has been showing impressive upward momentum, bringing fresh attention to the token. The big question now is whether buyers can maintain this strength or if the market will see a short-term pullback.
📊 Resistance: $0.085–$0.087
🟢 Support: $0.078–$0.080
🎯 Next resistance zone: $0.090–$0.095
A strong breakout with sustained volume could support further upside, while losing key support may lead to a correction.
Remember, strong rallies don't always continue in a straight line. Stay patient and avoid treating any price target as guaranteed.
#ARİA #AriaAI #CryptoAnalysis #Altcoins
1
68
·
--
Рост
$ERA has been showing significant volatility, with buyers attempting to recover after a sharp price drop.
{future}(ERAUSDT)
Market Overview
Recent price: Approximately $0.085624-hour
range: $0.0715–$0.0978
Short-term trend: Volatile;
recovery attemptResistance: $0.0900–$0.0980
Support: $0.0800,
followed by $0.0715
📊 Key resistance: $0.0900–$0.0980
🟢 Support zone: $0.0800
🔻 Critical support: $0.0715
If buyers reclaim the $0.0900 level with strong volume, a retest of the recent highs could be possible. However, losing the $0.0800 support area may invite further selling pressure.
The next move depends on volume and whether buyers can sustain the recovery. Avoid making decisions based on price movement alone.
#ERA #Caldera #CryptoAnalysis #Altcoins
$ERA has been showing significant volatility, with buyers attempting to recover after a sharp price drop.
Market Overview
Recent price: Approximately $0.085624-hour
range: $0.0715–$0.0978
Short-term trend: Volatile;
recovery attemptResistance: $0.0900–$0.0980
Support: $0.0800,
followed by $0.0715
📊 Key resistance: $0.0900–$0.0980
🟢 Support zone: $0.0800
🔻 Critical support: $0.0715
If buyers reclaim the $0.0900 level with strong volume, a retest of the recent highs could be possible. However, losing the $0.0800 support area may invite further selling pressure.
The next move depends on volume and whether buyers can sustain the recovery. Avoid making decisions based on price movement alone.
#ERA #Caldera #CryptoAnalysis #Altcoins
1
5
·
--
Падение
1
6
Войдите, чтобы посмотреть больше материала
Присоединяйтесь к пользователям криптовалют по всему миру на Binance Square
⚡️ Получайте новейшую и полезную информацию о криптоактивах.
💬 Нам доверяет крупнейшая в мире криптобиржа.
👍 Получите достоверные аналитические данные от верифицированных создателей контента.
Эл. почта/номер телефона
В тренде
CanMicrosoftDeliverOnAI
Просмотров: 621,671
4,059 обсуждают
Earnings Season Session 3: Will Google & Microsoft Beat Earnings Expectations?
Binance Square Official
·Лайков: 164
·Просмотров: 91.9k
CanGoogleDefindItsCore
Просмотров: 382,110
2,856 обсуждают
FedWatch
Просмотров: 16.1M
37,201 обсуждают