

#tia
tia
Просмотров: 114.7M
232,102 обсуждают
Популярные
Новые

Торговля за 30 дней $TIA 10.5K USDT
🚨🔥 $TIA JUST EXPLODED 8.87% — IS THIS THE COMEBACK NOBODY EXPECTED?
Tia jumped from $0.5233 to $0.5697 after the news hit!
📈 Now trading around $0.5600 — bulls are fighting back, but the real battle is still ahead!
🎯 KEY LEVELS TO WATCH
🚀 $0.5700 — Breakout zone 🔥 $0.5800–$0.6000 — Potential upside targets ⚠️ $0.5500 — Short-term level to watch 🔻 $0.5233 — Rally's starting point
⚡ THE BIG QUESTION: Is TIA preparing for another explosive move, or was this just a news-driven pump before another dump?
One thing is clear: TIA is moving again! 👀
👇 TIA HOLDERS: $0.60 NEXT, OR ANOTHER TRAP?
#tia #Celestia #Binance $NEAR $ONDO
1
579


$TIA: TIA Volume Spike: How Much Does the Close Matter?
The clue and its limits
The chart shows an hourly direction up while volume sits above baseline. That combination often feels like a green light, suggesting buying pressure is supporting the move. One useful metric is 2.31794, which quantifies how current trading compares to the recent average. If the relative volume is significantly high, it may confirm that the up move is driven by broader participation rather than a few large trades.
Competing readings of the same move
A different interpretation is that the volume surge reflects a short‑covering squeeze. Traders who were previously betting against the asset might be forced to buy back, inflating volume without indicating sustainable demand. In that scenario, the price could stall once the squeeze eases. Another view sees the volume as a temporary reaction to news on $TIA that may fade, leaving the price to revert to its prior range.
What would change the interpretation
A weakening clue would be a rapid drop in 2.31794 back to baseline while the price remains up; that would suggest the momentum is losing steam. Conversely, if the price closes above the hourly high and volume stays elevated, the uptrend gains credibility. Monitoring the close relative to the high and watching the volume trend provides a concrete way to reassess the signal. 📊
Probabilistic market research, not a recommendation or guaranteed return.
Which observation would make you change your reading?
#TIA #MarketAnalysis
$TIA : TIA Volume Spike: How Much Does the Close Matter?
The clue and its limits
The chart shows an hourly direction up while volume sits above baseline. That combination often feels like a green light, suggesting buying pressure is supporting the move. One useful metric is 2.31794, which quantifies how current trading compares to the recent average. If the relative volume is significantly high, it may confirm that the up move is driven by broader participation rather than a few large trades.
Competing readings of the same move
A different interpretation is that the volume surge reflects a short‑covering squeeze. Traders who were previously betting against the asset might be forced to buy back, inflating volume without indicating sustainable demand. In that scenario, the price could stall once the squeeze eases. Another view sees the volume as a temporary reaction to news on $TIA that may fade, leaving the price to revert to its prior range.
What would change the interpretation
A weakening clue would be a rapid drop in 2.31794 back to baseline while the price remains up; that would suggest the momentum is losing steam. Conversely, if the price closes above the hourly high and volume stays elevated, the uptrend gains credibility. Monitoring the close relative to the high and watching the volume trend provides a concrete way to reassess the signal. 📊
Probabilistic market research, not a recommendation or guaranteed return.
Which observation would make you change your reading?
#TIA #MarketAnalysis
240

21 million TPS benchmark for $TIA’s new Voyager AI payment layer? That single-node lab number isn’t live network throughput, a gap most hype chasers are ignoring right now.
$TIA is down 3.78% to $0.5325 even as the market sits at a neutral 51 sentiment score. The AI narrative boost hasn’t translated to buying pressure yet, no surprise when the benchmark isn’t even from a running network.
Don’t chase this move. Wait for either a clear spike in Celestia’s daily active addresses, or a solid volume-backed hold above $0.53. No confirmation? Stay on the sidelines, no FOMO needed here.
#Write2Earn #BinanceSquare #TIA #AICrypto #HalloweenPumpkinFrenzy
21 million TPS benchmark for $TIA ’s new Voyager AI payment layer? That single-node lab number isn’t live network throughput, a gap most hype chasers are ignoring right now.
$TIA is down 3.78% to $0.5325 even as the market sits at a neutral 51 sentiment score. The AI narrative boost hasn’t translated to buying pressure yet, no surprise when the benchmark isn’t even from a running network.
Don’t chase this move. Wait for either a clear spike in Celestia’s daily active addresses, or a solid volume-backed hold above $0.53. No confirmation? Stay on the sidelines, no FOMO needed here.
#Write2Earn #BinanceSquare #TIA #AICrypto #HalloweenPumpkinFrenzy
4

·
--
$TIA #TIA
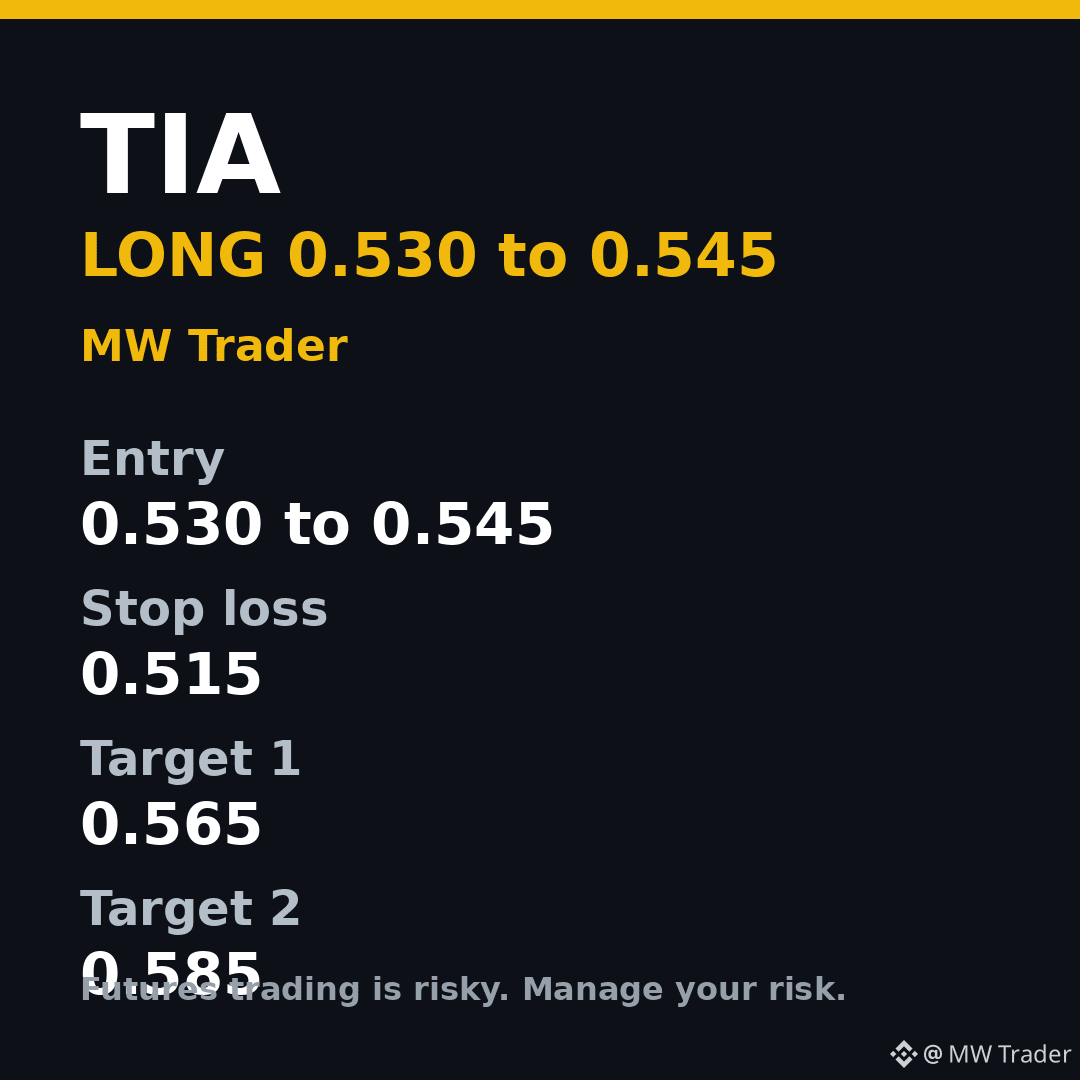
LONG idea, fresh setup for 29 October evening
Entry: 0.530 to 0.545
Stop loss: 0.515
Target 1: 0.565
Target 2: 0.585
Celestia is near 0.540, up about 2.89 percent over 24 hours on about 84 million dollars of volume, one of the few mid caps actually gaining while Bitcoin stalls. It is holding its gains instead of giving them back, which is the strength to follow. A long on a pullback toward 0.530 to 0.545 favours a move toward 0.565. Below 0.515, exit.
Futures trading is risky, trade small, manage your risk, and do your own research.
#Celestia #Crypto #FuturesTrading #TradingSignals
Follow for more trades.
7

·
--
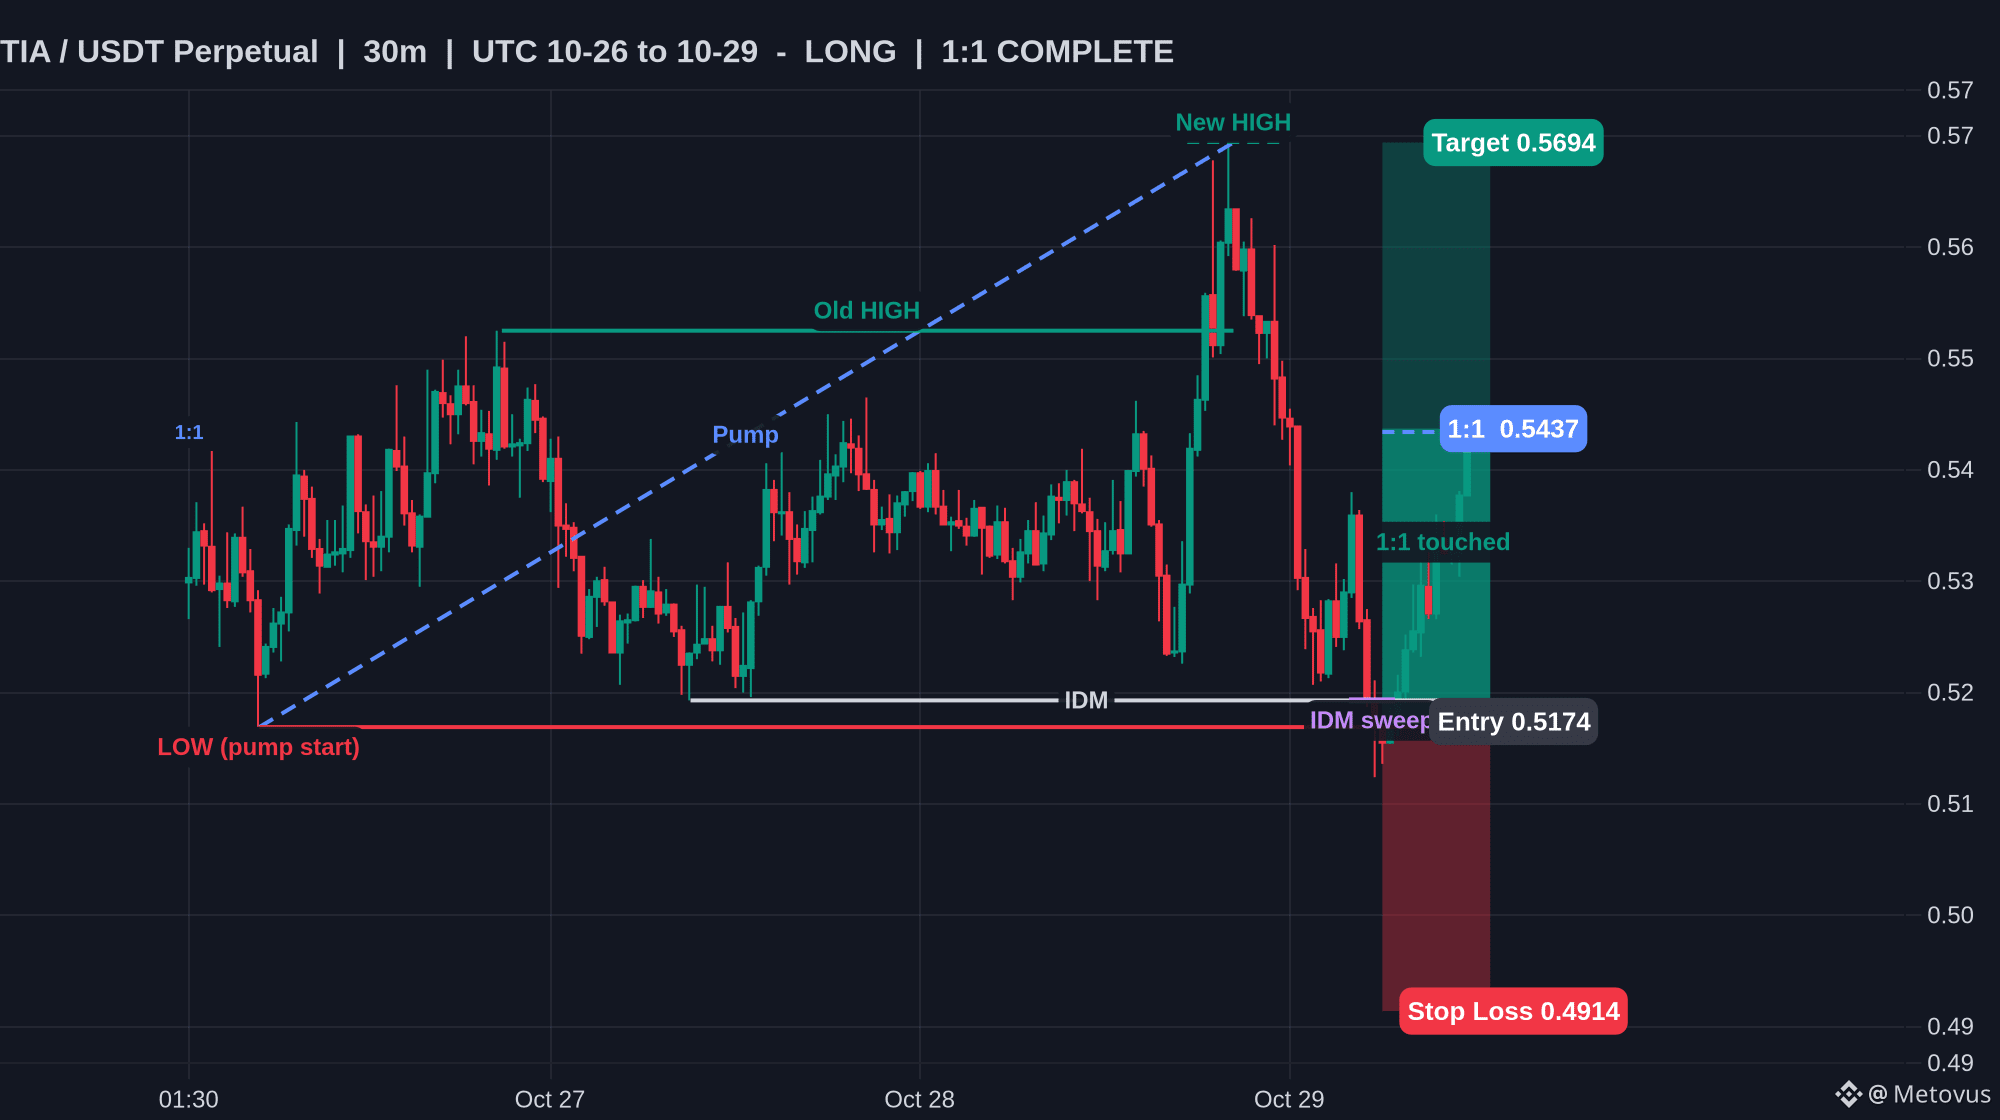
$TIA is already in profit: +5.1% 🟢
The long from 0.5174 just hit 1:1. Best price so far 0.5437, trading at 0.5426 now.
If you're still in the trade, moving your stop to 0.5174 means this trade can't lose you money anymore. If you'd rather take the win, that's totally fine too.
Target's still 0.5694.
Follow for daily chart breakdowns 🔔
#TIA #Crypto #Trade
16

·
--
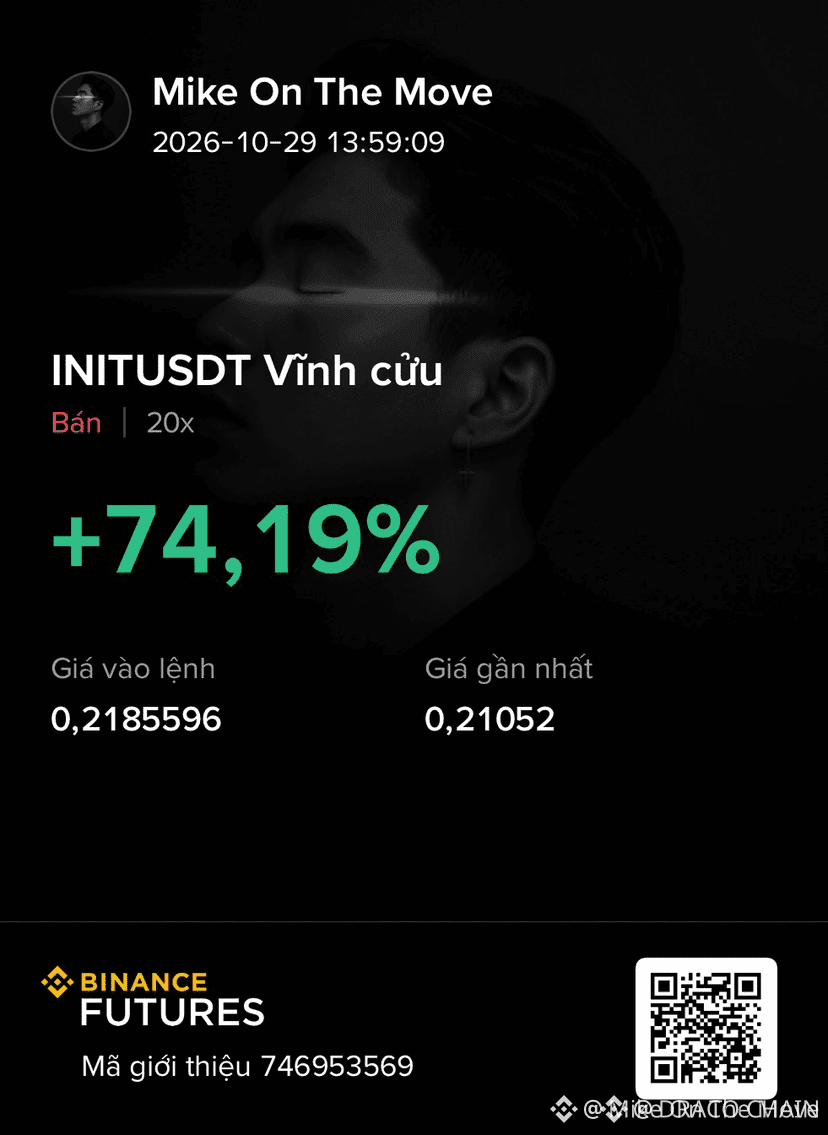
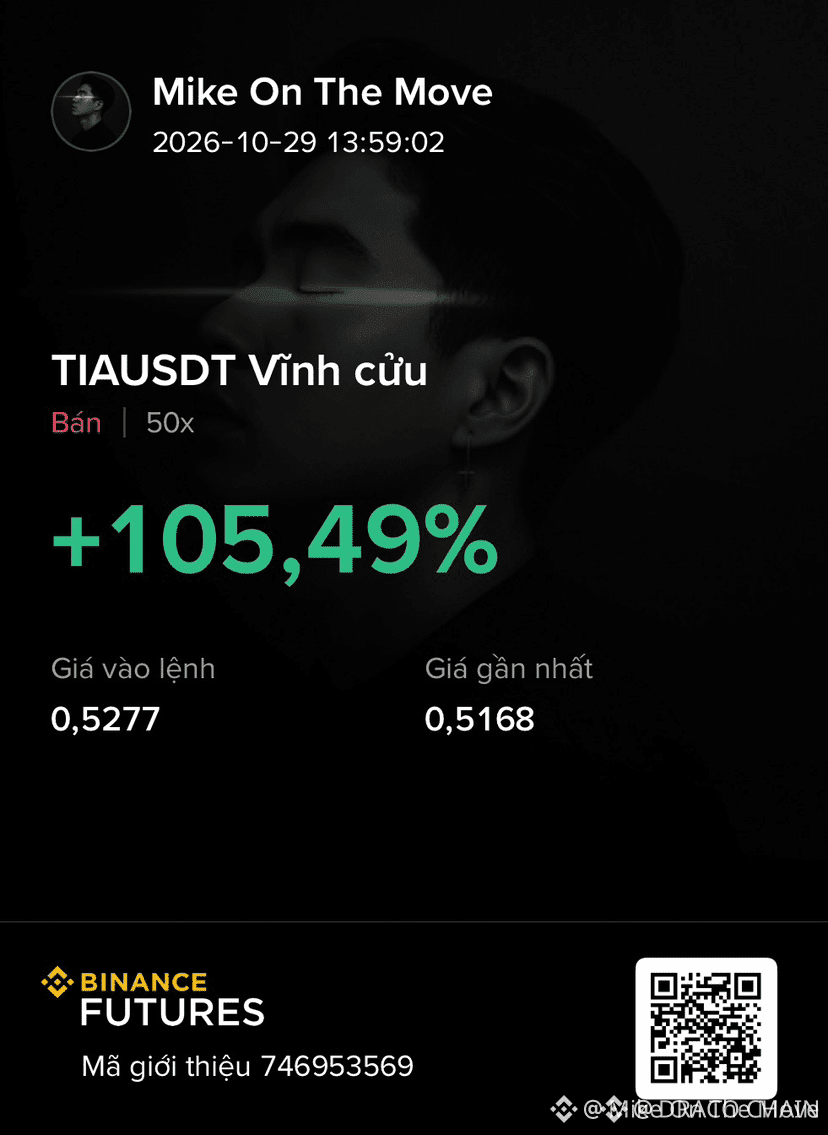
🚨 $TIA & $INIT SHORTS RIDE LIQUIDITY SWEEP! 💥
🦈 Smart money has been aggressively harvesting sell‑side liquidity around the recent demand void. 📊 Both $TIA and $INIT are now entrenched below the prior swing low, confirming the bearish order block is intact. 🔍 Volume spikes on the 1H chart underline institutional short pressure, and the RSI is firmly in oversold territory, signaling the downside bias remains robust.
💡 Take partial profits now to lock in the current gains, then let the remaining contracts chase the next liquidity pool. 💬 Are you scaling out or holding for the deeper pullback? 👇
⚠️ Not financial advice. Always manage your risk. 🛡️
🏷️ #TIA #INIT #ShortSetup #LiquiditySweep #Crypto
🦈 🔥
21

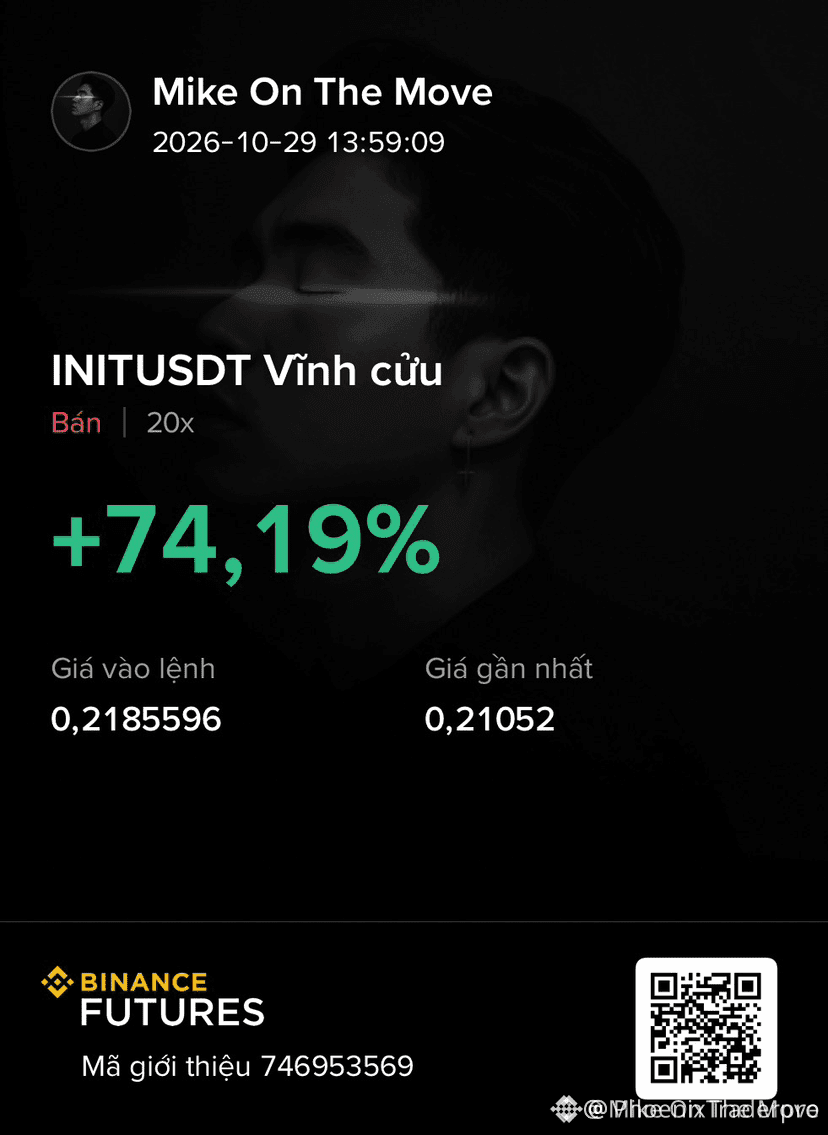
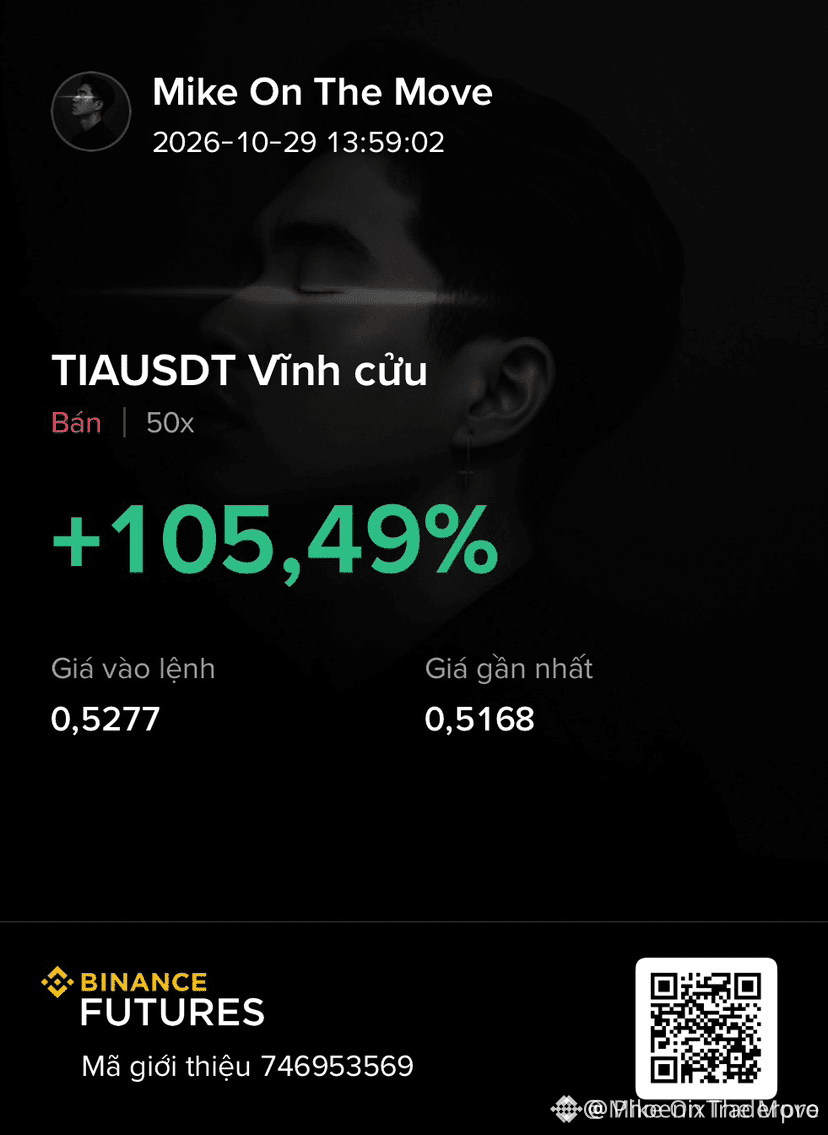
🚨 $TIA $INIT SHORTS RACING TOWARD PROFIT ZONE! 🟢
📊 Both short legs are carving through resistance with aggressive volume, a clear sign smart money is flushing liquidity. ⚡ The price action is slicing the downside channel, giving us a clean window to lock in gains before the next wave of buying pressure attempts a reversal. 🦈 Let the remaining contracts breathe and chase the deeper target as the market re‑balances.
💬 Who’s already scaling out and who’s riding the swing to the next low? 👇
⚠️ Not financial advice. Always manage your risk. 🛡️
🏷️ #TIA #INIT #ShortSetup #Crypto #Momentum
🔥 🐻
8

·
--
Рост
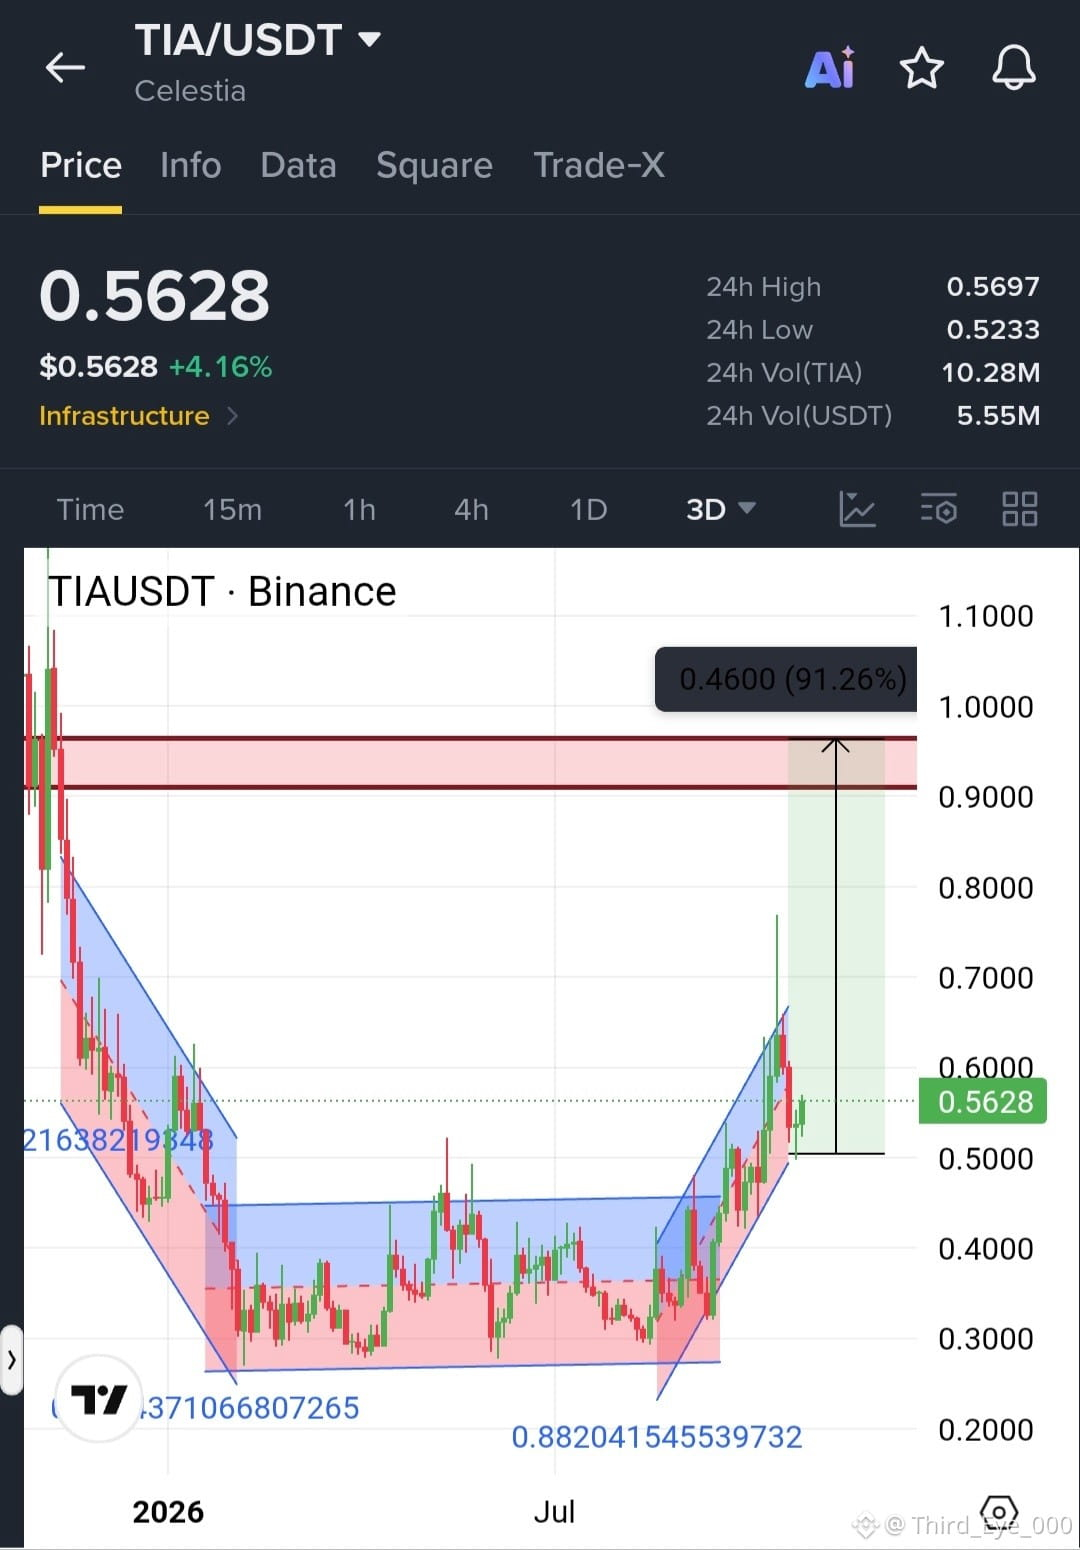
$TIA IS FINALLY WAKING UP AFTER AGES 😭🚀
Bro really went missing and now he's showing signs of life again 👀
The upward momentum is building… and if the bulls keep pushing, $1 might be closer than people think. 🔥
Are we about to witness a #tia comeback, fam, or am I getting too bullish? 😂
Drop your thoughts 👇
{spot}(TIAUSDT)
$TIA IS FINALLY WAKING UP AFTER AGES 😭🚀
Bro really went missing and now he's showing signs of life again 👀
The upward momentum is building… and if the bulls keep pushing, $1 might be closer than people think. 🔥
Are we about to witness a #tia comeback, fam, or am I getting too bullish? 😂
Drop your thoughts 👇
Bro really went missing and now he's showing signs of life again 👀
The upward momentum is building… and if the bulls keep pushing, $1 might be closer than people think. 🔥
Are we about to witness a #tia comeback, fam, or am I getting too bullish? 😂
Drop your thoughts 👇
1
360

·
--
🚨 INSTITUTIONAL TRAP DETECTED: $TIA
The charts are screaming retail euphoria, but the order flow tells a DIFFERENT story. While you see a bounce, the WHALES are stealthily absorbing buy orders to build a massive SHORT position. We are seeing a classic LIQUIDITY GRAB; they are pushing price just high enough to lure in the bulls before the rug is pulled. The divergence is OBVIOUS to those who know where to look.
EXECUTION:
ENTRY: 0.561 $TIA
SL: 0.5711
TP1: 0.5363
RR: 1:3.5
Are we seeing a genuine trend reversal or is this just a fake-out to clear the books?
#TIA #BinanceSquare #SlowSclap #TradingAnalysis
17

·
--
I am passing on $TIA at 0.55840 today
Volume is running at just 0.8x average
That is why this move has no weight behind it
I need to see an hourly close and hold above 0.56970 before entering
Or a proper pullback that holds 0.52330 and bounces
It could keep running without me
A bad entry costs more than a missed move
Chasing $TIA here or waiting for 0.52330
#TIA #RiskManagement
7

·
--
$TIA is trading at $0.5517 within a 24h range of $0.5233 - $0.5670, showing modest 1.68% movement on $5M volume. Low volume relative to range expansion often signals thin liquidity and fakeouts. Beware of FOMO traps chasing sudden momentum.
Defense floor: $0.5200. Breakout resistance: $0.5700.
Risk Tip: Wait for a confirmed retest of support before entering, using a 3-tranche DCA strategy to protect capital from sudden reversals. Not financial advice.
$TIA #BinanceSquare #CryptoTrading #RiskManagement #TIA
Defense floor: $0.5200. Breakout resistance: $0.5700.
Risk Tip: Wait for a confirmed retest of support before entering, using a 3-tranche DCA strategy to protect capital from sudden reversals. Not financial advice.
$TIA #BinanceSquare #CryptoTrading #RiskManagement #TIA
6

·
--
Падение
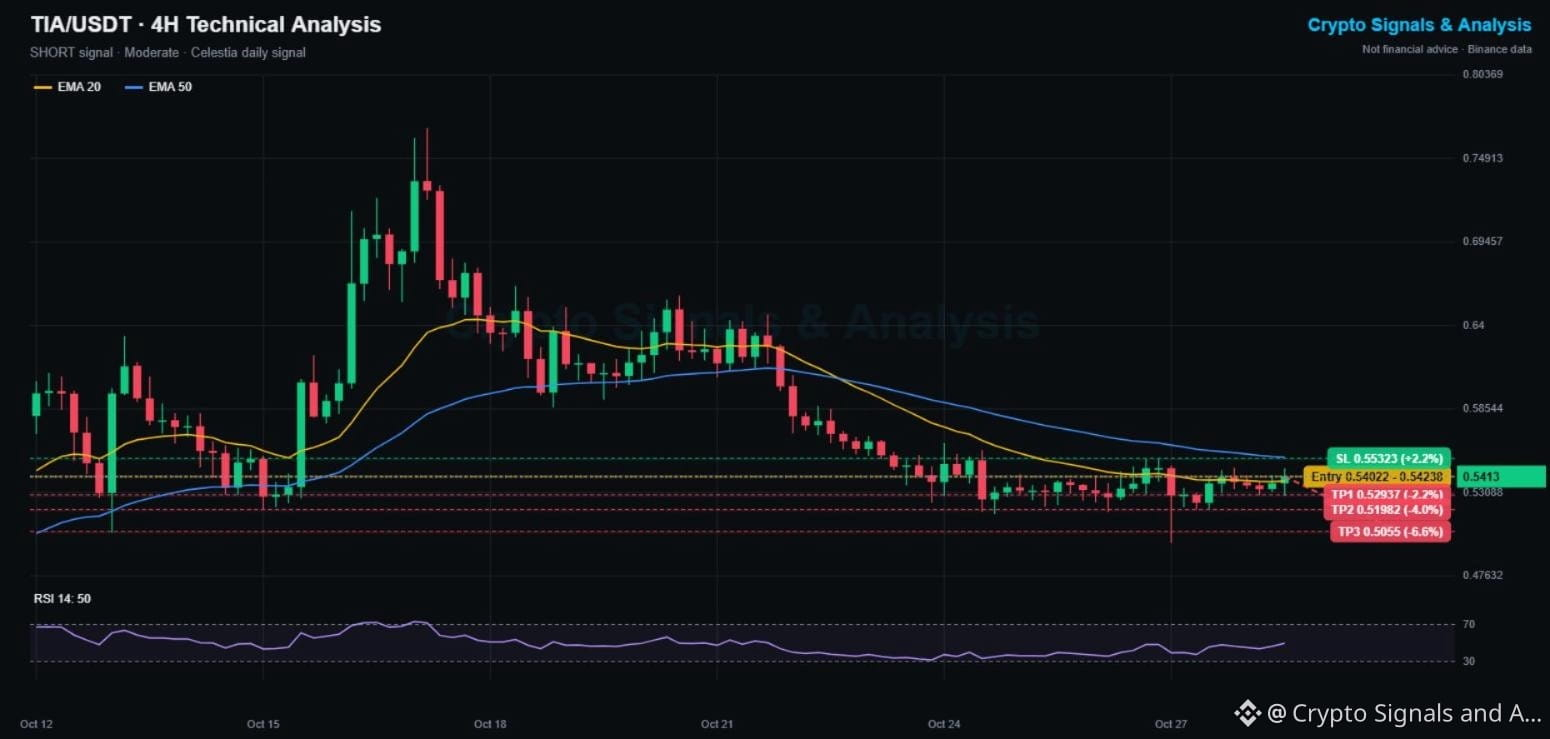
$TIA Price Prediction Today: Celestia Crypto Signal & Technical Analysis 📊
🔴 SHORT | Entry 0.5402 - 0.5424 | TP1 0.5294 | SL 0.5532
👉 Tap $TIA to place your trade fast
Celestia pumped to 0.769 on Oct 17 and has given back 30% since. It is down 14.5% this week, and every bounce now runs into the falling 4H EMA50 at 0.554.
📌 CELESTIA TRADING SIGNAL (Moderate, 3/5 signals agree)
Entry: 0.5402 - 0.5424
Take profit 1: 0.5294 (-2.2%)
Take profit 2: 0.5198 (-4.0%)
Take profit 3: 0.5055 (-6.6%)
Stop loss: 0.5532 (+2.2%)
📊 TIA TECHNICAL ANALYSIS (4H CHART)
TIA has been grinding sideways at 0.52 to 0.55 for 4 days, right under the EMA50 (0.5539). The EMA20 (0.5383) is still sloping down, and RSI sits at a neutral 50. The long wick down to 0.498 on Oct 27 shows there are buyers lower, so TP3 is set just above that zone.
🔑 KEY LEVELS
Support: 0.5300, then 0.4980
Resistance: 0.5539 (EMA50), then 0.5800
📈 Bullish scenario: a 4H close above 0.5532 and the EMA50 breaks the range upward and cancels the short.
📉 Bearish scenario: losing 0.53 sends TIA back to the 0.50 to 0.52 zone.
💡 Bottom line: a range trade under resistance. Tight stop, quick targets.
👉 Tap $TIA
to open the live chart. NFA
🔥 TRADE WITH LOWER FEES
✅ Get a 20% kickback on your Binance trading fees, for life
👇👇👇
{spot}(TIAUSDT)
[Claim your 20% Binance fee kickback here](https://www.binance.com/register?ref=X0NQWZ4N)
━━━━━━━━━━
Celestia: breakdown to 0.50 or a squeeze back to 0.60? 👇
Follow Crypto Signals and Analysis for daily signals.
#cryptosignals #TIA #EarningsSeason
⚠️ Crypto is volatile: risk only what you can afford to lose.
$TIA Price Prediction Today: Celestia Crypto Signal & Technical Analysis 📊
🔴 SHORT | Entry 0.5402 - 0.5424 | TP1 0.5294 | SL 0.5532
👉 Tap $TIA to place your trade fast
Celestia pumped to 0.769 on Oct 17 and has given back 30% since. It is down 14.5% this week, and every bounce now runs into the falling 4H EMA50 at 0.554.
📌 CELESTIA TRADING SIGNAL (Moderate, 3/5 signals agree)
Entry: 0.5402 - 0.5424
Take profit 1: 0.5294 (-2.2%)
Take profit 2: 0.5198 (-4.0%)
Take profit 3: 0.5055 (-6.6%)
Stop loss: 0.5532 (+2.2%)
📊 TIA TECHNICAL ANALYSIS (4H CHART)
TIA has been grinding sideways at 0.52 to 0.55 for 4 days, right under the EMA50 (0.5539). The EMA20 (0.5383) is still sloping down, and RSI sits at a neutral 50. The long wick down to 0.498 on Oct 27 shows there are buyers lower, so TP3 is set just above that zone.
🔑 KEY LEVELS
Support: 0.5300, then 0.4980
Resistance: 0.5539 (EMA50), then 0.5800
📈 Bullish scenario: a 4H close above 0.5532 and the EMA50 breaks the range upward and cancels the short.
📉 Bearish scenario: losing 0.53 sends TIA back to the 0.50 to 0.52 zone.
💡 Bottom line: a range trade under resistance. Tight stop, quick targets.
👉 Tap $TIA
to open the live chart. NFA
🔥 TRADE WITH LOWER FEES
✅ Get a 20% kickback on your Binance trading fees, for life
👇👇👇
Claim your 20% Binance fee kickback here
━━━━━━━━━━
Celestia: breakdown to 0.50 or a squeeze back to 0.60? 👇
Follow Crypto Signals and Analysis for daily signals.
#cryptosignals #TIA #EarningsSeason
⚠️ Crypto is volatile: risk only what you can afford to lose.
249

·
--
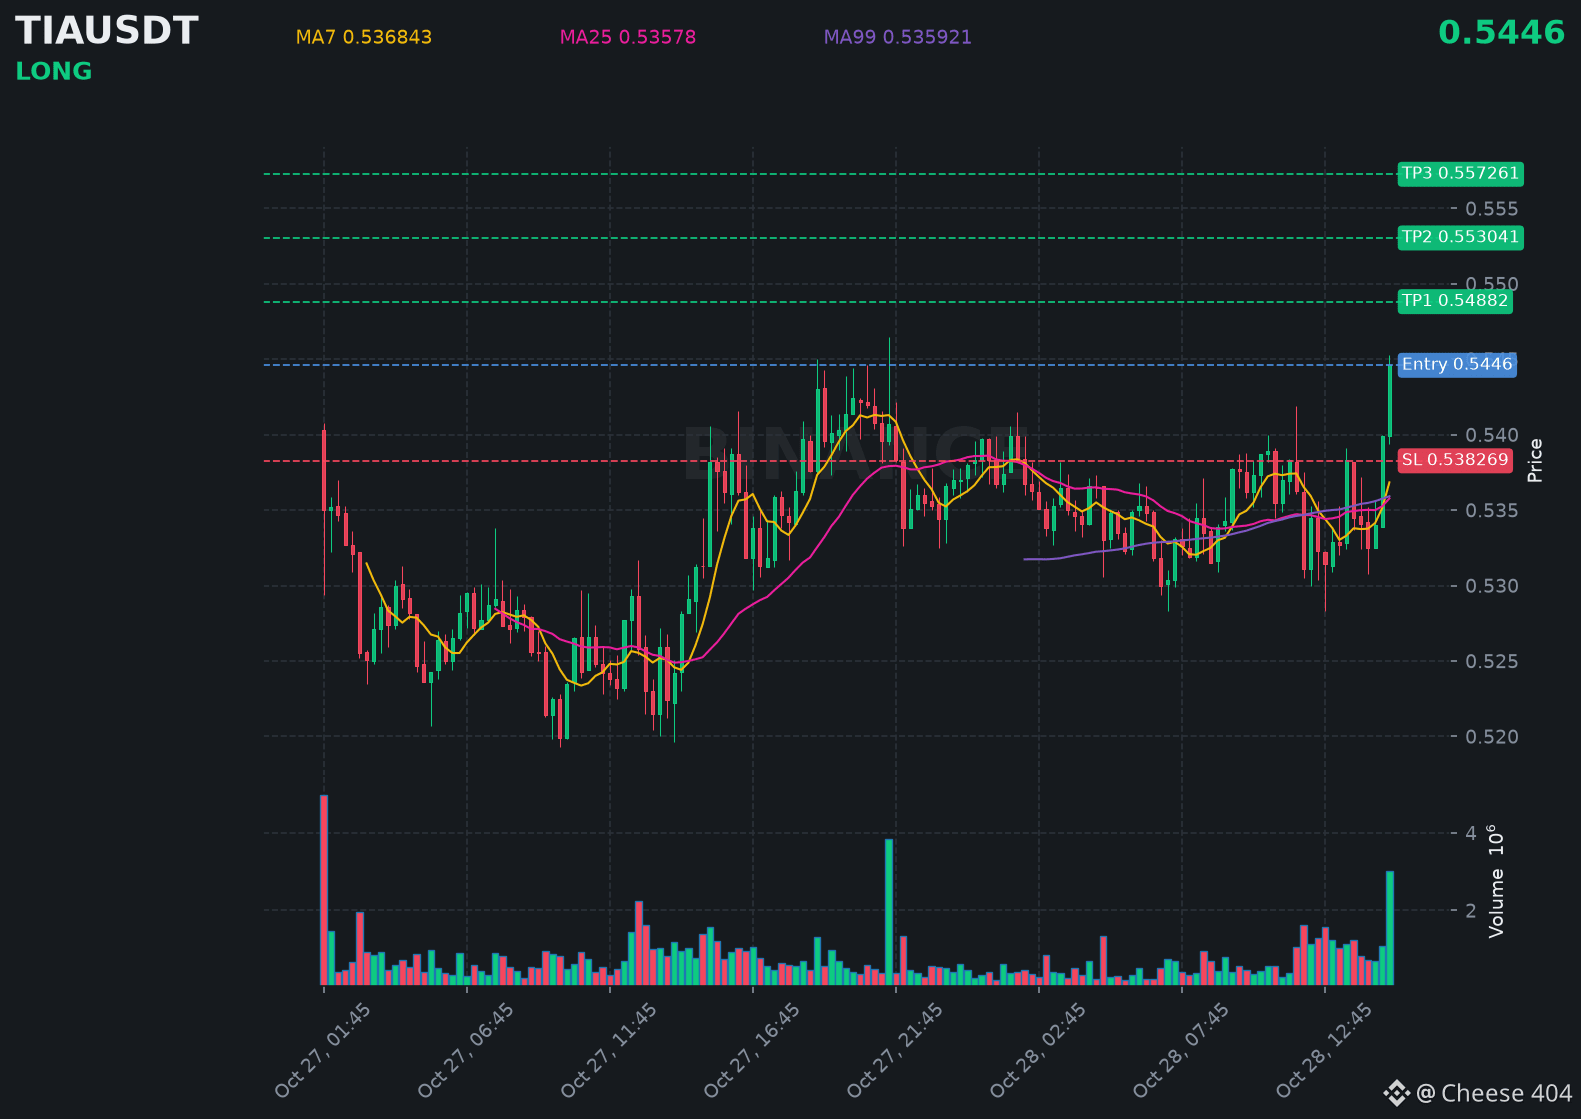
$TIA is gaining strong bullish momentum as volume rises and price breaks key resistance.
📍 @ 0.5446 | Volume: 1.64M USD
RSI 64 | EMA20: 0.535865 USD
📈 Trade Plan:
📈 Entry: 0.543334 – 0.545866
🛑 Stop Loss: 0.538269
🎯 TP1: 0.54882
🎯 TP2: 0.553041
🎯 TP3: 0.557261
Waiting for a retest, then riding the uptrend.
👉 $TIA 👈 Catch it
#TIA
📍 @ 0.5446 | Volume: 1.64M USD
RSI 64 | EMA20: 0.535865 USD
📈 Trade Plan:
📈 Entry: 0.543334 – 0.545866
🛑 Stop Loss: 0.538269
🎯 TP1: 0.54882
🎯 TP2: 0.553041
🎯 TP3: 0.557261
Waiting for a retest, then riding the uptrend.
👉 $TIA 👈 Catch it
#TIA
106

·
--
Падение
$TIA BEARISH WARNING: LIQUIDITY SWEEP ABOVE $0.5388 COULD TRIGGER ANOTHER LEG DOWN
Celestia ($TIA) is showing signs of weakness despite a 2.5% gain over the past 24 hours. The recent move above $0.5388 followed by a quick rejection raises a critical question: is this a genuine breakout or a liquidity grab before bearish continuation?
Market Structure: Bearish
The 1-hour structure remains bearish, with lower highs and lower lows dominating price action. The sweep above $0.5388 appears to have failed, while resistance between $0.5429 and $0.5465 remains unreclaimed.
As long as sellers defend this zone, the bearish setup remains in focus. However, a liquidity sweep alone does not guarantee further downside; confirmation is essential.
Key Resistance and Entry Zone
The $0.5345–$0.5388 area is the potential short-entry zone to monitor. I would wait for a 5-minute or 15-minute bearish engulfing candle, a market structure break, or a clear lower high after a retest.
Avoid entering blindly while price is moving without confirmation.
Downside Targets
- TP1: $0.5275 — Local demand and FVG zone
- TP2: $0.5193 — Previous swing-low liquidity
- TP3: $0.5135 — Major downside support
Invalidation and Risk Management
A decisive 1-hour close above $0.5465 would invalidate this bearish setup and shift attention toward a potential bullish reversal. Until then, failed resistance reclaim attempts may offer opportunities for confirmed short setups.
Derivatives and Whale Flow
- Open Interest: $25.6M
- 24-hour OI change: -1.2%
- Funding Rate: +0.0025%
- Taker Ratio: 1.13x
- Reported whale activity: approximately $108K sell over 22 minutes
Declining open interest may reflect position reduction, while the reported sell adds context to the bearish thesis. Neither metric independently confirms direction.
My Take: $TIA remains bearish below $0.5465. Watch for rejection around $0.5345–$0.5388, with $0.5275 as the first downside target. Patience and confirmation matter more than chasing the move.$TIA
{future}(TIAUSDT)
Not financial advice.
#TIA #Celestia #CryptoTrading
$TIA BEARISH WARNING: LIQUIDITY SWEEP ABOVE $0.5388 COULD TRIGGER ANOTHER LEG DOWN
Celestia ($TIA ) is showing signs of weakness despite a 2.5% gain over the past 24 hours. The recent move above $0.5388 followed by a quick rejection raises a critical question: is this a genuine breakout or a liquidity grab before bearish continuation?
Market Structure: Bearish
The 1-hour structure remains bearish, with lower highs and lower lows dominating price action. The sweep above $0.5388 appears to have failed, while resistance between $0.5429 and $0.5465 remains unreclaimed.
As long as sellers defend this zone, the bearish setup remains in focus. However, a liquidity sweep alone does not guarantee further downside; confirmation is essential.
Key Resistance and Entry Zone
The $0.5345–$0.5388 area is the potential short-entry zone to monitor. I would wait for a 5-minute or 15-minute bearish engulfing candle, a market structure break, or a clear lower high after a retest.
Avoid entering blindly while price is moving without confirmation.
Downside Targets
- TP1: $0.5275 — Local demand and FVG zone
- TP2: $0.5193 — Previous swing-low liquidity
- TP3: $0.5135 — Major downside support
Invalidation and Risk Management
A decisive 1-hour close above $0.5465 would invalidate this bearish setup and shift attention toward a potential bullish reversal. Until then, failed resistance reclaim attempts may offer opportunities for confirmed short setups.
Derivatives and Whale Flow
- Open Interest: $25.6M
- 24-hour OI change: -1.2%
- Funding Rate: +0.0025%
- Taker Ratio: 1.13x
- Reported whale activity: approximately $108K sell over 22 minutes
Declining open interest may reflect position reduction, while the reported sell adds context to the bearish thesis. Neither metric independently confirms direction.
My Take: $TIA remains bearish below $0.5465. Watch for rejection around $0.5345–$0.5388, with $0.5275 as the first downside target. Patience and confirmation matter more than chasing the move.$TIA
Not financial advice.
#TIA #Celestia #CryptoTrading
54
·
--
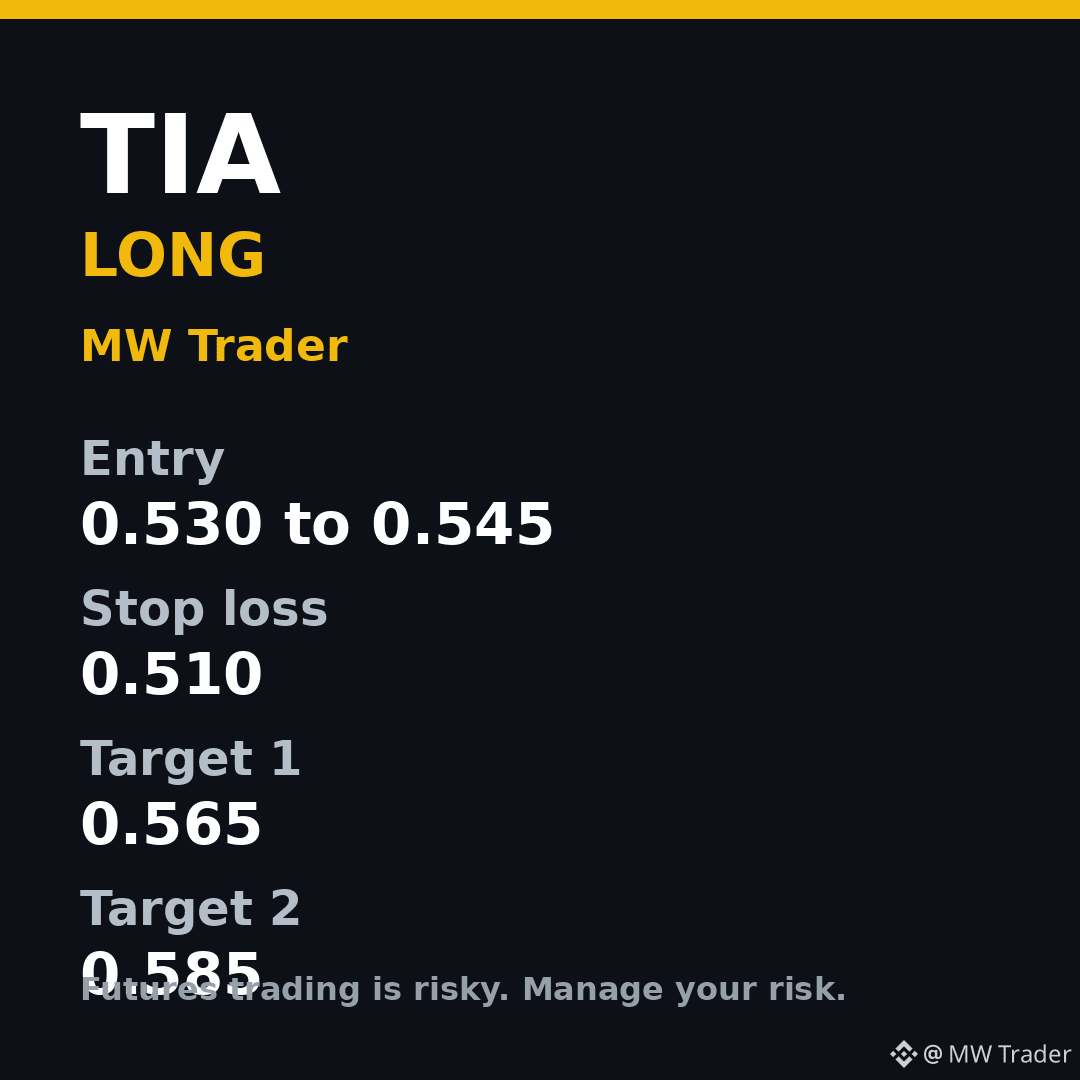
$TIA #TIA
LONG idea, fresh setup for 28 October
Entry: 0.530 to 0.545
Stop loss: 0.510
Target 1: 0.565
Target 2: 0.585
Celestia is near 0.5388, up about 2.8 percent, with a range of 0.5206 to 0.5458. Holding above 0.530 keeps the path open to 0.565. Under 0.510, exit and wait for a fresh setup.
Futures trading is risky. Trade small, manage your risk, and do your own research.
#Celestia #Crypto #FuturesTrading #TradingSignals
Follow for more trades.
13

·
--
⚡ $TIA DEMAND ZONE RECLAIMED AS BUYERS EYE NEXT LIQUIDITY EXPANSION! 🚀
Entry: 0.3449 – 0.3461 ⚡
Target: 0.3490 / 0.3520 / 0.3549 🚀
Stop Loss: 0.3391 ⚠️
Bulls are mounting a sharp defense right at the 0.3449 demand block, absorbing sell-side pressure and building momentum off key structural support. 📊 Order flow indicates smart money quietly front-running the shift as volume begins to swell on lower timeframes. 💡
With volatility compressing tightly near entry, upside liquidity clusters up to 0.3549 are primed for a high-velocity sweep. 💬 Are you placing your bids inside this demand pocket or waiting for explicit breakout volume? 👇
⚠️ Not financial advice. Always manage your risk. 🛡️
🏷️ #TIA #LongSetup #Crypto #Breakout #Trading
🔥 💎
20
·
--
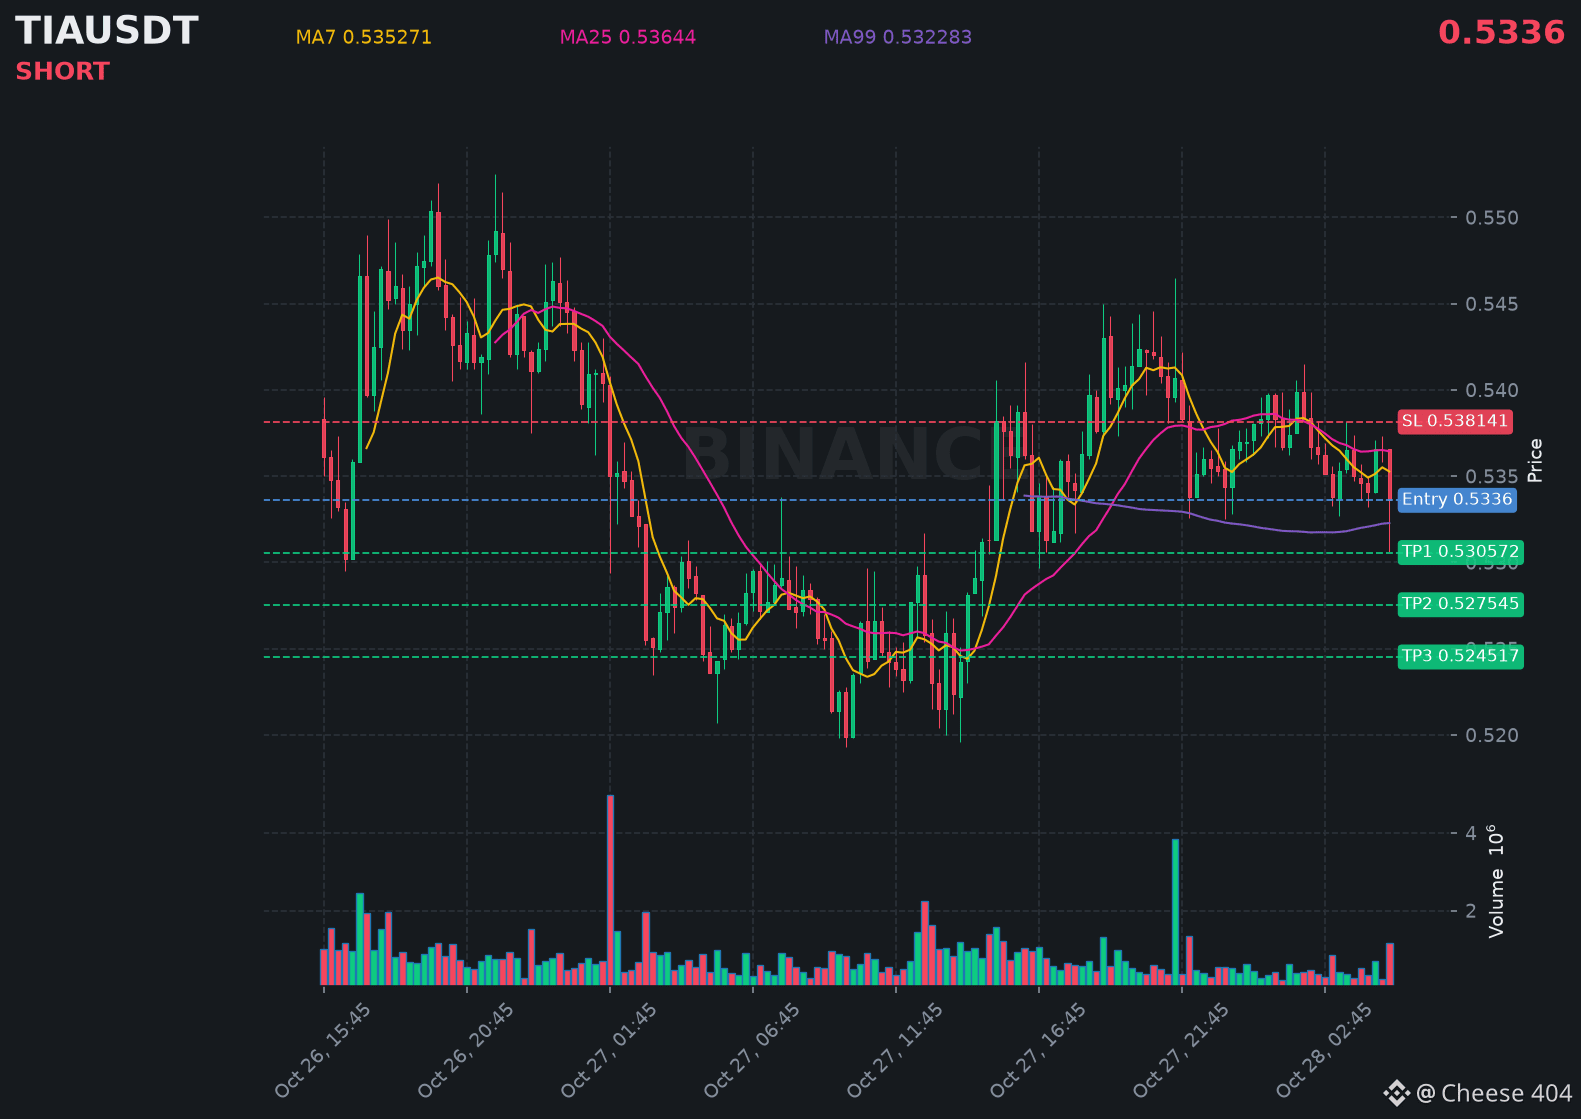
$TIA is trending down with real conviction, sellers capping every bounce along the way.
📍 @ 0.5336 | Volume: 0.62M USD
RSI 43 | EMA20: 0.535993 USD
📈 Trade Plan:
📈 Entry: 0.532692 – 0.534508
🛑 Stop Loss: 0.538141
🎯 TP1: 0.530572
🎯 TP2: 0.527545
🎯 TP3: 0.524517
Waiting for confirmation, then riding the downtrend.
👉 $TIA 👈 Catch it
#TIA
📍 @ 0.5336 | Volume: 0.62M USD
RSI 43 | EMA20: 0.535993 USD
📈 Trade Plan:
📈 Entry: 0.532692 – 0.534508
🛑 Stop Loss: 0.538141
🎯 TP1: 0.530572
🎯 TP2: 0.527545
🎯 TP3: 0.524517
Waiting for confirmation, then riding the downtrend.
👉 $TIA 👈 Catch it
#TIA
66

·
--
⚡ $TIA PREPARES FOR 1H MOMENTUM EXPANSION AS BUYERS DEFEND DEMAND 🐂
Entry: 0.3525–0.3538 ⚡
Target 1: 0.3652 🚀
Target 2: 0.3702 🎯
Target 3: 0.3753 💥
Stop Loss: 0.3433 ⚠️
📌 $TIA is flashing clear signs of structural continuation on the 1H timeframe, consolidating right above a high-value demand zone. Buyers are stepping in to absorb sell pressure, signaling sharp market positioning before the next leg higher.
📊 Wait for clear price confirmation inside the 0.3525–0.3538 entry block to validate execution. Structuring take-profits dynamically at 50%, 30%, and 20% locks in profit smoothly as order flow accelerates into upper liquidity targets.
💡 Are you riding this 1H momentum push or waiting for a deeper liquidity sweep before opening bids? 👇
⚠️ Not financial advice. Always manage your risk. 🛡️
🏷️ #TIA #LongSetup #Crypto #TradingSignal #Altcoins
🔥 💎
26

·
--
Рост
🟢 $TIA BUY 🟢
{future}(TIAUSDT)
📍 ENTRY: 0.5367-0.5409
🎯 TARGETS:
💰 0.5501
💰 0.5875
💰 0.6617
🛑 STOP: 0.5247
🚀 KEY SUPPORT BOUNCE — TIA BULLS ARE LOOKING FOR A REVERSAL
$TIA is reacting from key support, putting the upside levels in focus. 👀
⚡ Support defense → bullish continuation on watch.
📈 Confirmation remains key.
#TIA #TIAUSDT #CryptoSignals #TradingSignals #FuturesSignals #LongSignal
🟢 $TIA BUY 🟢
📍 ENTRY: 0.5367-0.5409
🎯 TARGETS:
💰 0.5501
💰 0.5875
💰 0.6617
🛑 STOP: 0.5247
🚀 KEY SUPPORT BOUNCE — TIA BULLS ARE LOOKING FOR A REVERSAL
$TIA is reacting from key support, putting the upside levels in focus. 👀
⚡ Support defense → bullish continuation on watch.
📈 Confirmation remains key.
#TIA #TIAUSDT #CryptoSignals #TradingSignals #FuturesSignals #LongSignal
14

·
--
🚀 $TIA Momentum Alert: Multi-Timeframe Alignment
Setup: 🟢 LONG $TIA (FUTURES)
🎯 Entry: 0.53120
🛑 Stop-Loss: 0.51928 (-2.24%)
✅ Take-Profit: 0.55505 (+4.49%)
⚖️ Risk/Reward: 1:2.0
🔍 Technical Reasoning:
The 4-hour market structure remains firmly bullish above the 200 EMA. Following a healthy retracement into the 50 EMA on the 1-hour chart, buyers printed a strong rejection candle with increasing volume, confirming defense of support.
💡 Key Confluences:
• Spot+Futures ✓
• 📊 ATR 1.4% — healthy volatility
• 🚀 Volume ×3.2 above average
🚫 Invalidation Rule: If a 1-hour candle closes below $0.51928 (-2.24%), this bullish thesis is invalidated. Exit trade without holding into drawdowns.
💡 Trade Management: Secure 50% profit at Take-Profit target ($0.55505 +4.49%) and move Stop-Loss to Breakeven to eliminate downside risk.
📊 Market Metrics:
• Funding: -0.0017% (Neutral) • Next: 0h 57m
• Open Interest (OI): $25.98M
• 24h Volume: $46.87M
• 24h Range: 0.5193 — 0.5525 (-1.3%)
📈 Strategy Track Record: WR 60% over 833 trades
#TIA #CryptoTrading #TechnicalAnalysis #BinanceSquare
⚠️ Not financial advice. Always manage your risk.
55
Войдите, чтобы посмотреть больше материала
Присоединяйтесь к пользователям криптовалют по всему миру на Binance Square
⚡️ Получайте новейшую и полезную информацию о криптоактивах.
💬 Нам доверяет крупнейшая в мире криптобиржа.
👍 Получите достоверные аналитические данные от верифицированных создателей контента.
Эл. почта/номер телефона
В тренде
1
#FedWatch
Просмотров: 16.3M
39,289 обсуждают
2
#EarningsSeason
Просмотров: 6.4M
31,993 обсуждают
3
#USMidtermElections
Просмотров: 33,592
563 обсуждают
4
#BitcoinDropsBelow$80K
Просмотров: 22,240
99 обсуждают
5
#BoEOpensConsultationOnTokenizedCollateralForClearing
Просмотров: 370
20 обсуждают
6
#BrazilCryptoExchangesMustApplyForLicensesByFriday
Просмотров: 25,905
468 обсуждают
7
#ICEPartnersWithTradeXYZToBringPerpetualContractsToUS
Просмотров: 669
15 обсуждают
8
#SolidusLabsReportsSuspected$170MSpoofingOnHyperliquidOilContracts
Просмотров: 1,499
25 обсуждают
9
#StanDruckenmillerBecomesInvestorInTradeXYZ
Просмотров: 20,433
422 обсуждают
10
#RussiaProposedNonCustodialWalletLimitsExcludeIntlSettlements
Просмотров: 1,887
39 обсуждают