

#priceaction
priceaction
Просмотров: 8.4M
60,238 обсуждают
Популярные
Новые

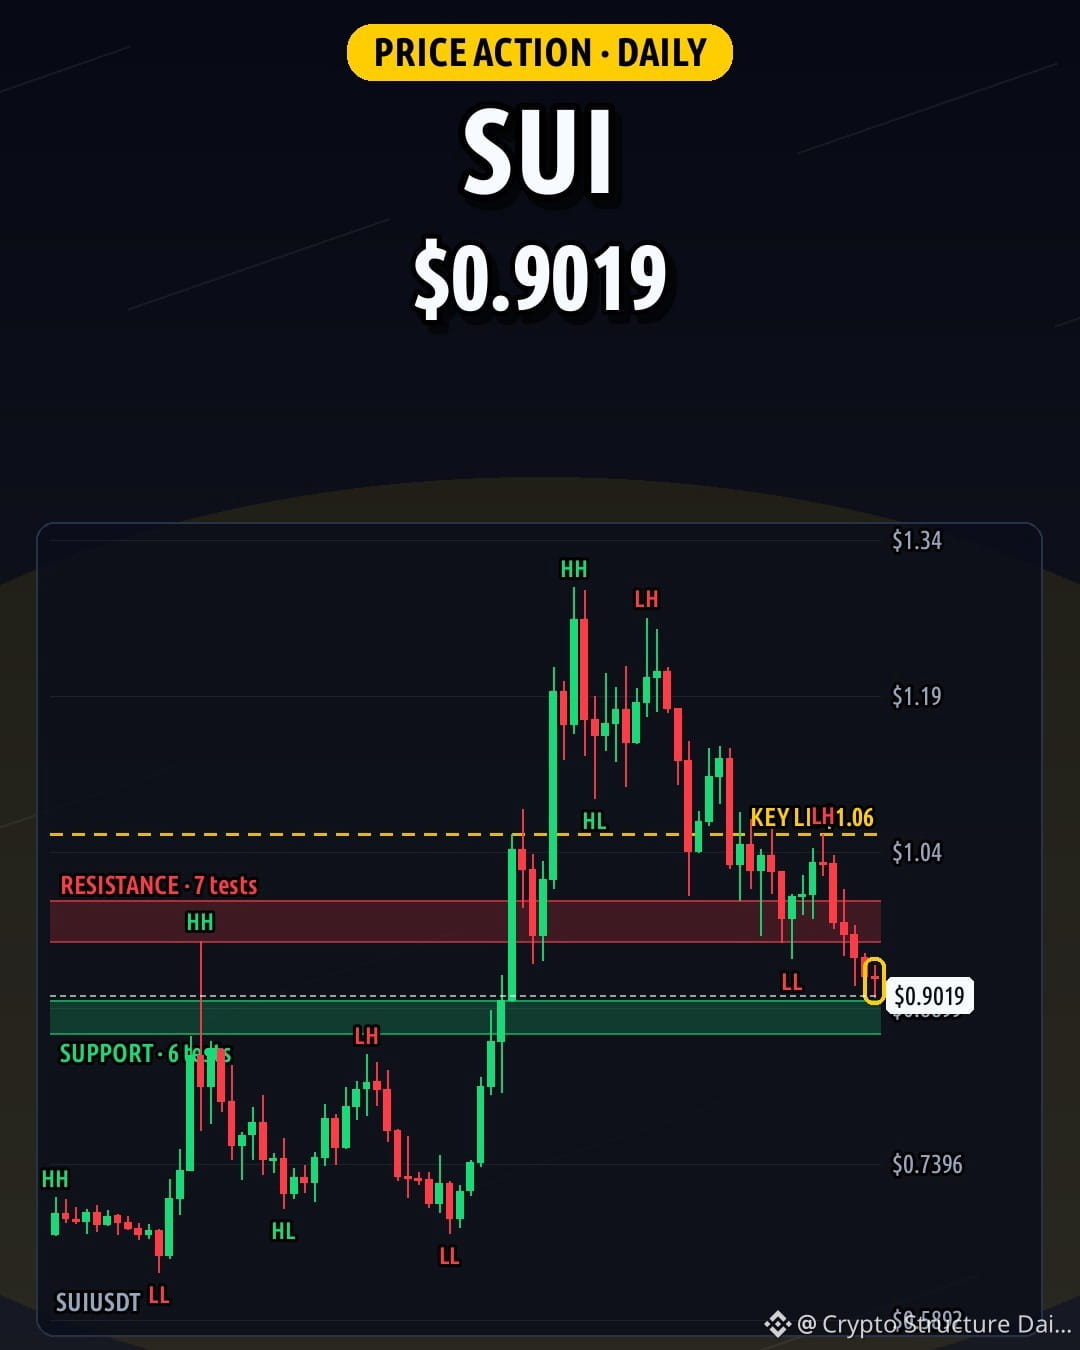
Daily hammer just printed for $SUI at 0.9019. 4H closed a doji right under resistance at 0.9342 (4 tests).
Daily shows lower highs/lows with support at 0.8811 (6 tests) and resistance at 0.9735 (7 tests). Weekly holds higher highs/lows with support at 0.7838 (3 tests).
If the daily closes above 0.9931, the next zone is 1.02. Lose 0.8654 and 0.8322 is in play.
Reversal here or just a pause? 📊
NFA #SUI #PriceAction #CryptoAnalysis
303

·
--
Рост
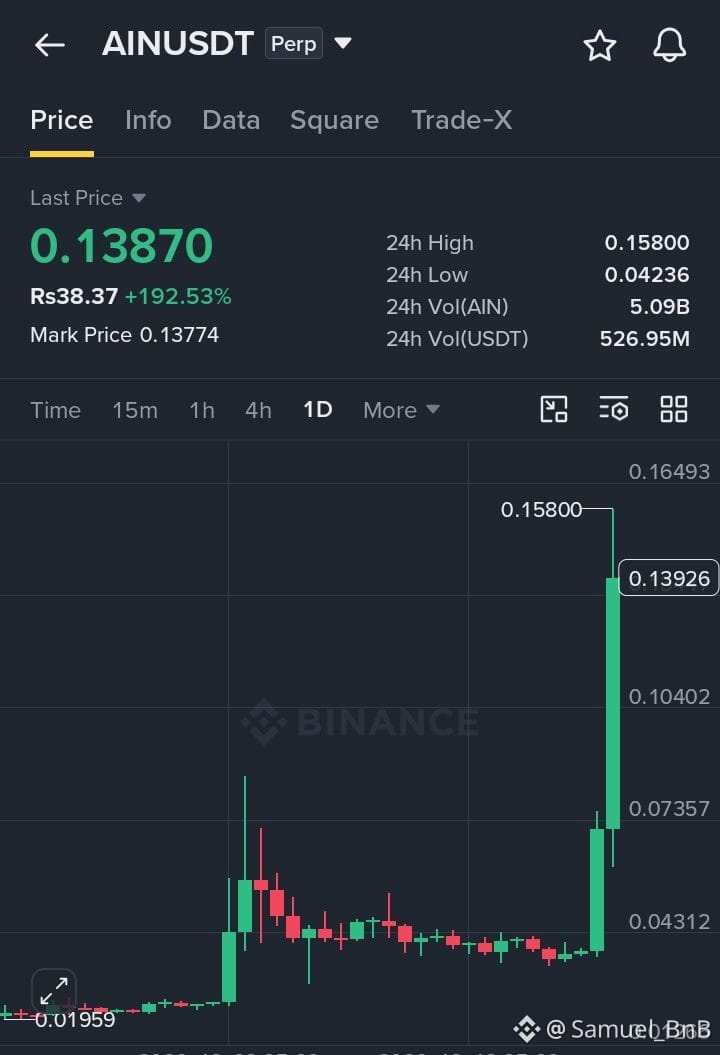
🚀 $AIN USDT PARABOLIC BREAKOUT! WILL THE BULLS PUSH HIGHER? 🔥
AIN is exploding with a massive +192.53% 24-hour surge, trading around 0.13870 USDT after breaking out of a prolonged consolidation zone. The daily chart shows powerful bullish momentum and a sharp expansion in volume, but the long upper wick near 0.15800 signals potential selling pressure at higher levels. 👀
🟢 Support Zones: 0.12000–0.12500 | 0.10400 | 0.07350
🔴 Resistance Zones: 0.14500–0.15000 | 0.15800 | 0.16500
🎯 Upside Targets: TP1: 0.14500 | TP2: 0.15800 | TP3: 0.16500–0.17500
📉 Bearish Scenario: If AIN loses 0.12000, a deeper pullback toward 0.10400 could follow. A break below 0.10400 may expose the 0.07350 breakout zone.
🔮 Next Move: If buyers defend 0.12000–0.12500 and price reclaims 0.14500, another attempt at 0.15800 becomes possible. However, rejection near resistance could trigger sharp profit-taking after this explosive rally.
💎 PRO TIP: Don't FOMO into a vertical candle! Wait for a pullback and bullish confirmation, or a convincing breakout and retest. Keep position size small, use a predefined stop-loss, and remember that leveraged perpetual contracts can liquidate positions rapidly.
⚡ AIN is at a critical decision zone continuation or correction? Let price confirm the next move!
#cryptotrading #altcoins #BinanceFutures #Breakout #priceaction
Jaxon Crypto:
Upside Targets: TP1: 0.14500 | TP2: 0.15800 | TP3: 0.16500–0.17500
2
2
360

·
--
$ZEC is sitting 0.6 percent under $1318.31 right now
An hourly close above that resistance opens up the path back to the 7 day high
Rejection here sends us looking right down at $1210.49 support
Tap $ZEC and check the hourly chart yourself
Break or reject 👀
#ZEC #PriceAction
$ZEC is sitting 0.6 percent under $1318.31 right now
An hourly close above that resistance opens up the path back to the 7 day high
Rejection here sends us looking right down at $1210.49 support
Tap $ZEC and check the hourly chart yourself
Break or reject 👀
#ZEC #PriceAction
An hourly close above that resistance opens up the path back to the 7 day high
Rejection here sends us looking right down at $1210.49 support
Tap $ZEC and check the hourly chart yourself
Break or reject 👀
#ZEC #PriceAction
10

🎯 $LAB SHORT SMASHES TP1 WHILE THE FADE BRIGADE GOES COMPLETELY SILENT! 📉
The crowd begged everyone to fade the play, but the order book told a completely different story. 📊 $LAB just slammed straight into TP1 as seller velocity took full control, leaving the skeptics watching from the sidelines.
When liquidations stack and momentum aligns with structural breakdown, execution is everything. 🌊 Big congratulations to everyone who trusted the technical blueprint and locked in gains cleanly.
💡 If you are only seeing this now, resist the urge to chase an extended move—patience is what funds the next high-conviction setup. 💬 Did you lock in profits on this breakdown, or were you stuck fading the trend? 👇
⚠️ Not financial advice. Always manage your risk. 🛡️
🏷️ #LAB #ShortSetup #PriceAction #Crypto
🎯 📉
16

·
--
Падение
$BULLA
{future}(BULLAUSDT)
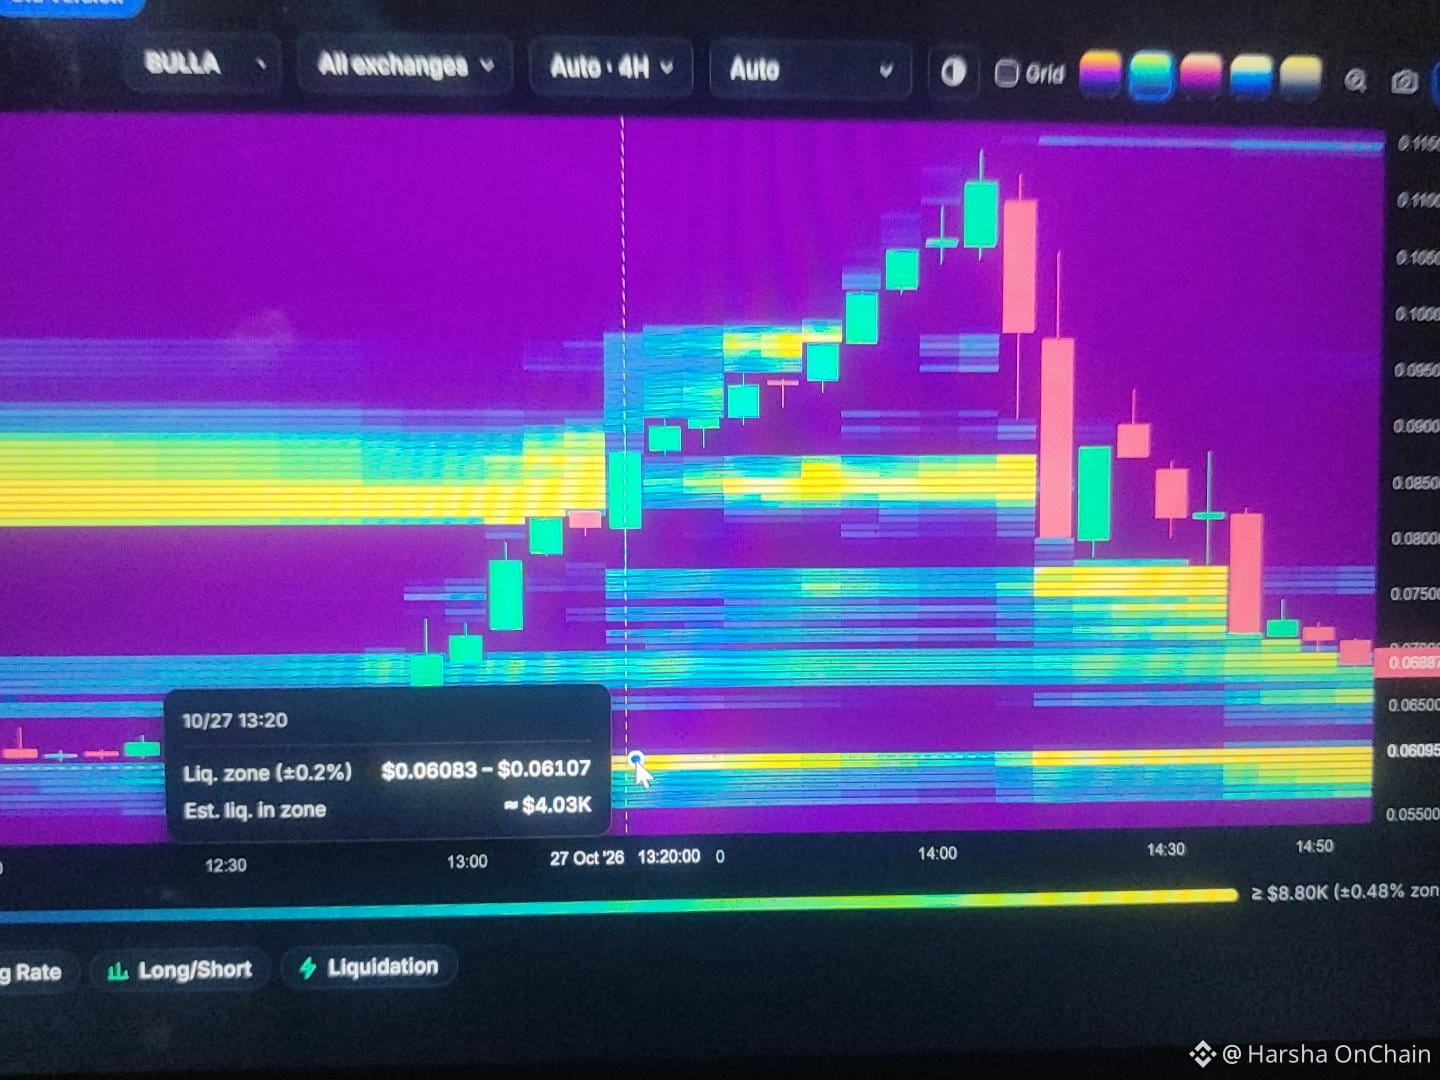
🔥 LIQUIDATION HEATMAP: WHERE COULD PRICE GO NEXT?
The pump is over for now, and sellers have stepped in. 👀
📉 Scenario 1 — 60%: Price sweeps $0.066–$0.067, with $0.060–$0.061 as the next area to watch.
📈 Scenario 2 — 40%: Buyers defend support and reclaim resistance, opening a possible bounce toward $0.075–$0.077.
🧠 My strategy: No blind entries. I’ll wait for a liquidity sweep, price reaction, and confirmation before choosing a side.
⚠️ Heatmap liquidity is not a guaranteed target. These probabilities are estimates, not proven odds.
Which comes first — another flush or a relief bounce? 👇
#CryptoTrading #LiquidationHeatmap #PriceAction #BinanceSquare
$BULLA
🔥 LIQUIDATION HEATMAP: WHERE COULD PRICE GO NEXT?
The pump is over for now, and sellers have stepped in. 👀
📉 Scenario 1 — 60%: Price sweeps $0.066–$0.067, with $0.060–$0.061 as the next area to watch.
📈 Scenario 2 — 40%: Buyers defend support and reclaim resistance, opening a possible bounce toward $0.075–$0.077.
🧠 My strategy: No blind entries. I’ll wait for a liquidity sweep, price reaction, and confirmation before choosing a side.
⚠️ Heatmap liquidity is not a guaranteed target. These probabilities are estimates, not proven odds.
Which comes first — another flush or a relief bounce? 👇
#CryptoTrading #LiquidationHeatmap #PriceAction #BinanceSquare
449
·
--
$LTC sits right under $57.0000 today
A clean hourly close above $57.0000 opens up some room
If it gets rejected here expect a slide down toward $55.7200 support
Tap $LTC and check the hourly chart yourself
Break or reject? 👀
#LTC #PriceAction
$LTC sits right under $57.0000 today
A clean hourly close above $57.0000 opens up some room
If it gets rejected here expect a slide down toward $55.7200 support
Tap $LTC and check the hourly chart yourself
Break or reject? 👀
#LTC #PriceAction
A clean hourly close above $57.0000 opens up some room
If it gets rejected here expect a slide down toward $55.7200 support
Tap $LTC and check the hourly chart yourself
Break or reject? 👀
#LTC #PriceAction
3
·
--
Watch $HAEDAL right below $0.03395 for the real test
A clean hourly close through that high unlocks more room
Rejection sends it back toward $0.02108 fast
Break or reject 🧐
Open $HAEDAL and set an alert at that level
#HAEDAL #PriceAction
Watch $HAEDAL right below $0.03395 for the real test
A clean hourly close through that high unlocks more room
Rejection sends it back toward $0.02108 fast
Break or reject 🧐
Open $HAEDAL and set an alert at that level
#HAEDAL #PriceAction
A clean hourly close through that high unlocks more room
Rejection sends it back toward $0.02108 fast
Break or reject 🧐
Open $HAEDAL and set an alert at that level
#HAEDAL #PriceAction
4

·
--
⚠️ Short Setup: $BTC (FUTURES) Distribution Pattern
Rating: 78/100 [A] • Strategy: EMATrend
📊 Trade Thesis:
Price encountered strong overhead rejection at the 50 EMA on the 1-hour chart, fully aligning with the broader 4-hour downtrend. The inability to reclaim higher levels signals persistent distribution by sellers.
🎯 Entry: 80468.70
🛑 Stop-Loss: 81066.44 (-0.74%)
✅ Take-Profit: 79273.22 (+1.49%)
⚖️ Risk/Reward: 1:2.0
🚫 Invalidation Rule: If a 1-hour candle closes above $81066.44 (+0.74%), this bearish thesis is invalidated. Cut position immediately.
💡 Trade Management: Secure 50% profit at Take-Profit target ($79273.22 +1.49%) and move Stop-Loss to Breakeven to eliminate downside risk.
⚖️ Risk Note: Moderate leverage recommended (3x–5x on Futures). Never risk more than 1–2% of total portfolio capital on a single setup.
📈 Binance Market Data:
• Funding: 0.0100% (Neutral) • Next: 5h 58m
• Open Interest (OI): $7.78B
• 24h Volume: $7.12B
• 24h Range: 79468.3 — 80807.2 (+0.1%)
📈 Strategy Track Record: WR 59% over 847 trades
#BTC #PriceAction #TechnicalAnalysis #BinanceSquare
⚠️ Not financial advice. Always manage your risk.
5
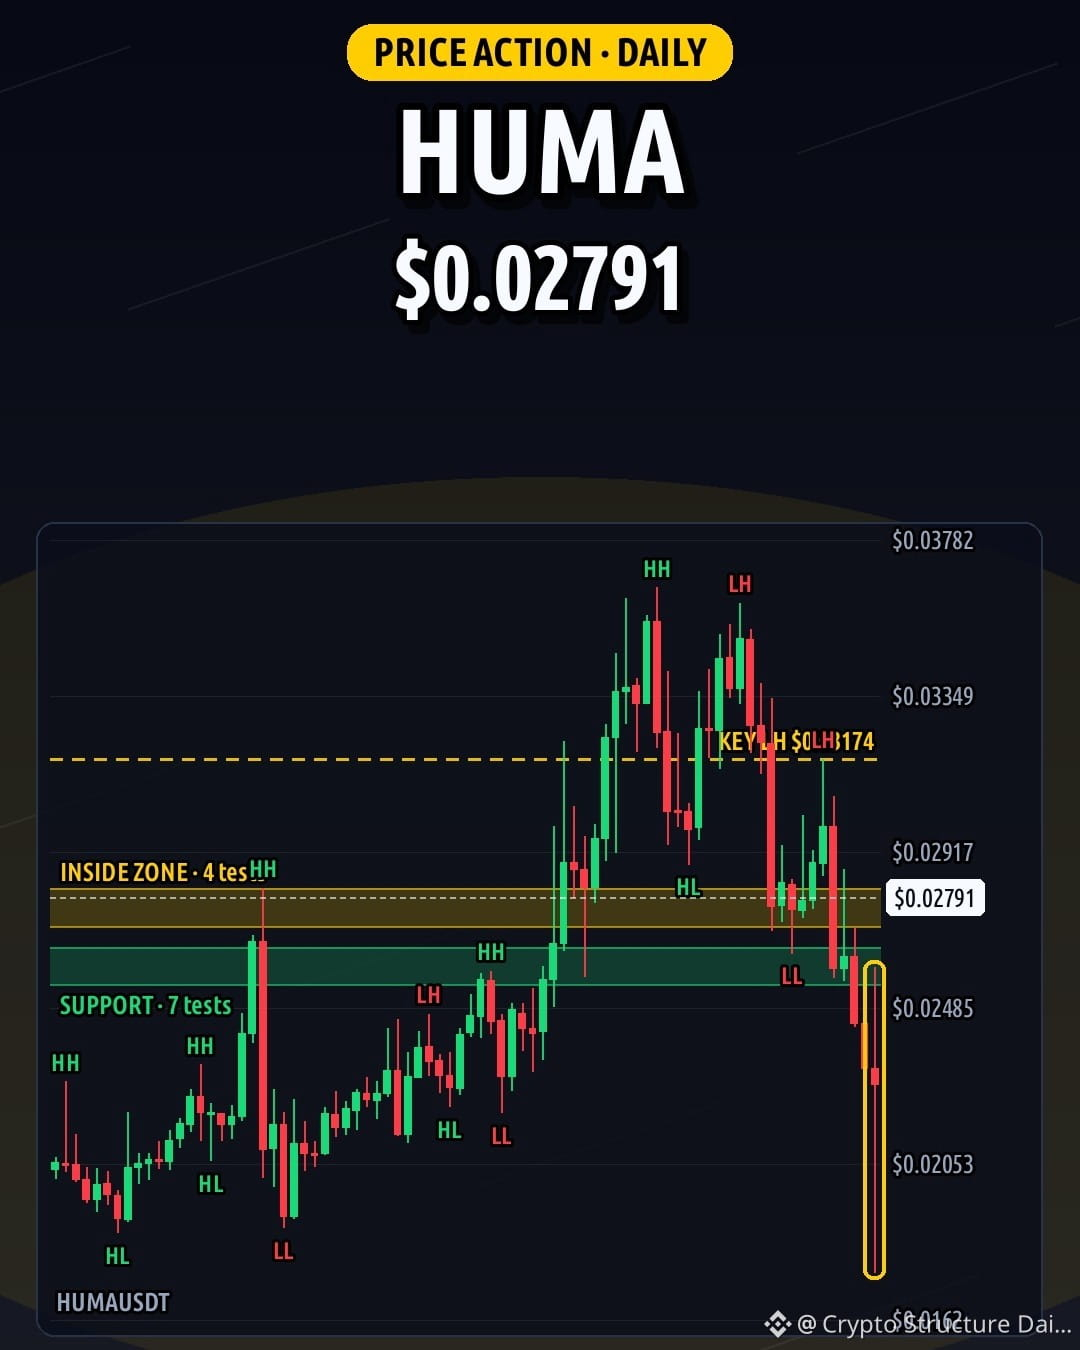
$HUMA printed a daily hammer at 0.02791 with a 9.7x volume spike. 📊
Weekly is a range (support 0.02275, resistance 0.02935). Daily and 4H show lower highs/lows. Daily key swing is 0.03174 with support at 0.026 (7 tests). 4H has resistance at 0.0293 (10 tests) and support at 0.02556 (6 tests).
If the daily closes above 0.02816, structure strengthens. Lose 0.02549 and 0.02316 is in play.
Can this volume trigger a reversal? NFA #HUMA #PriceAction #CryptoAnalysis
78

·
--
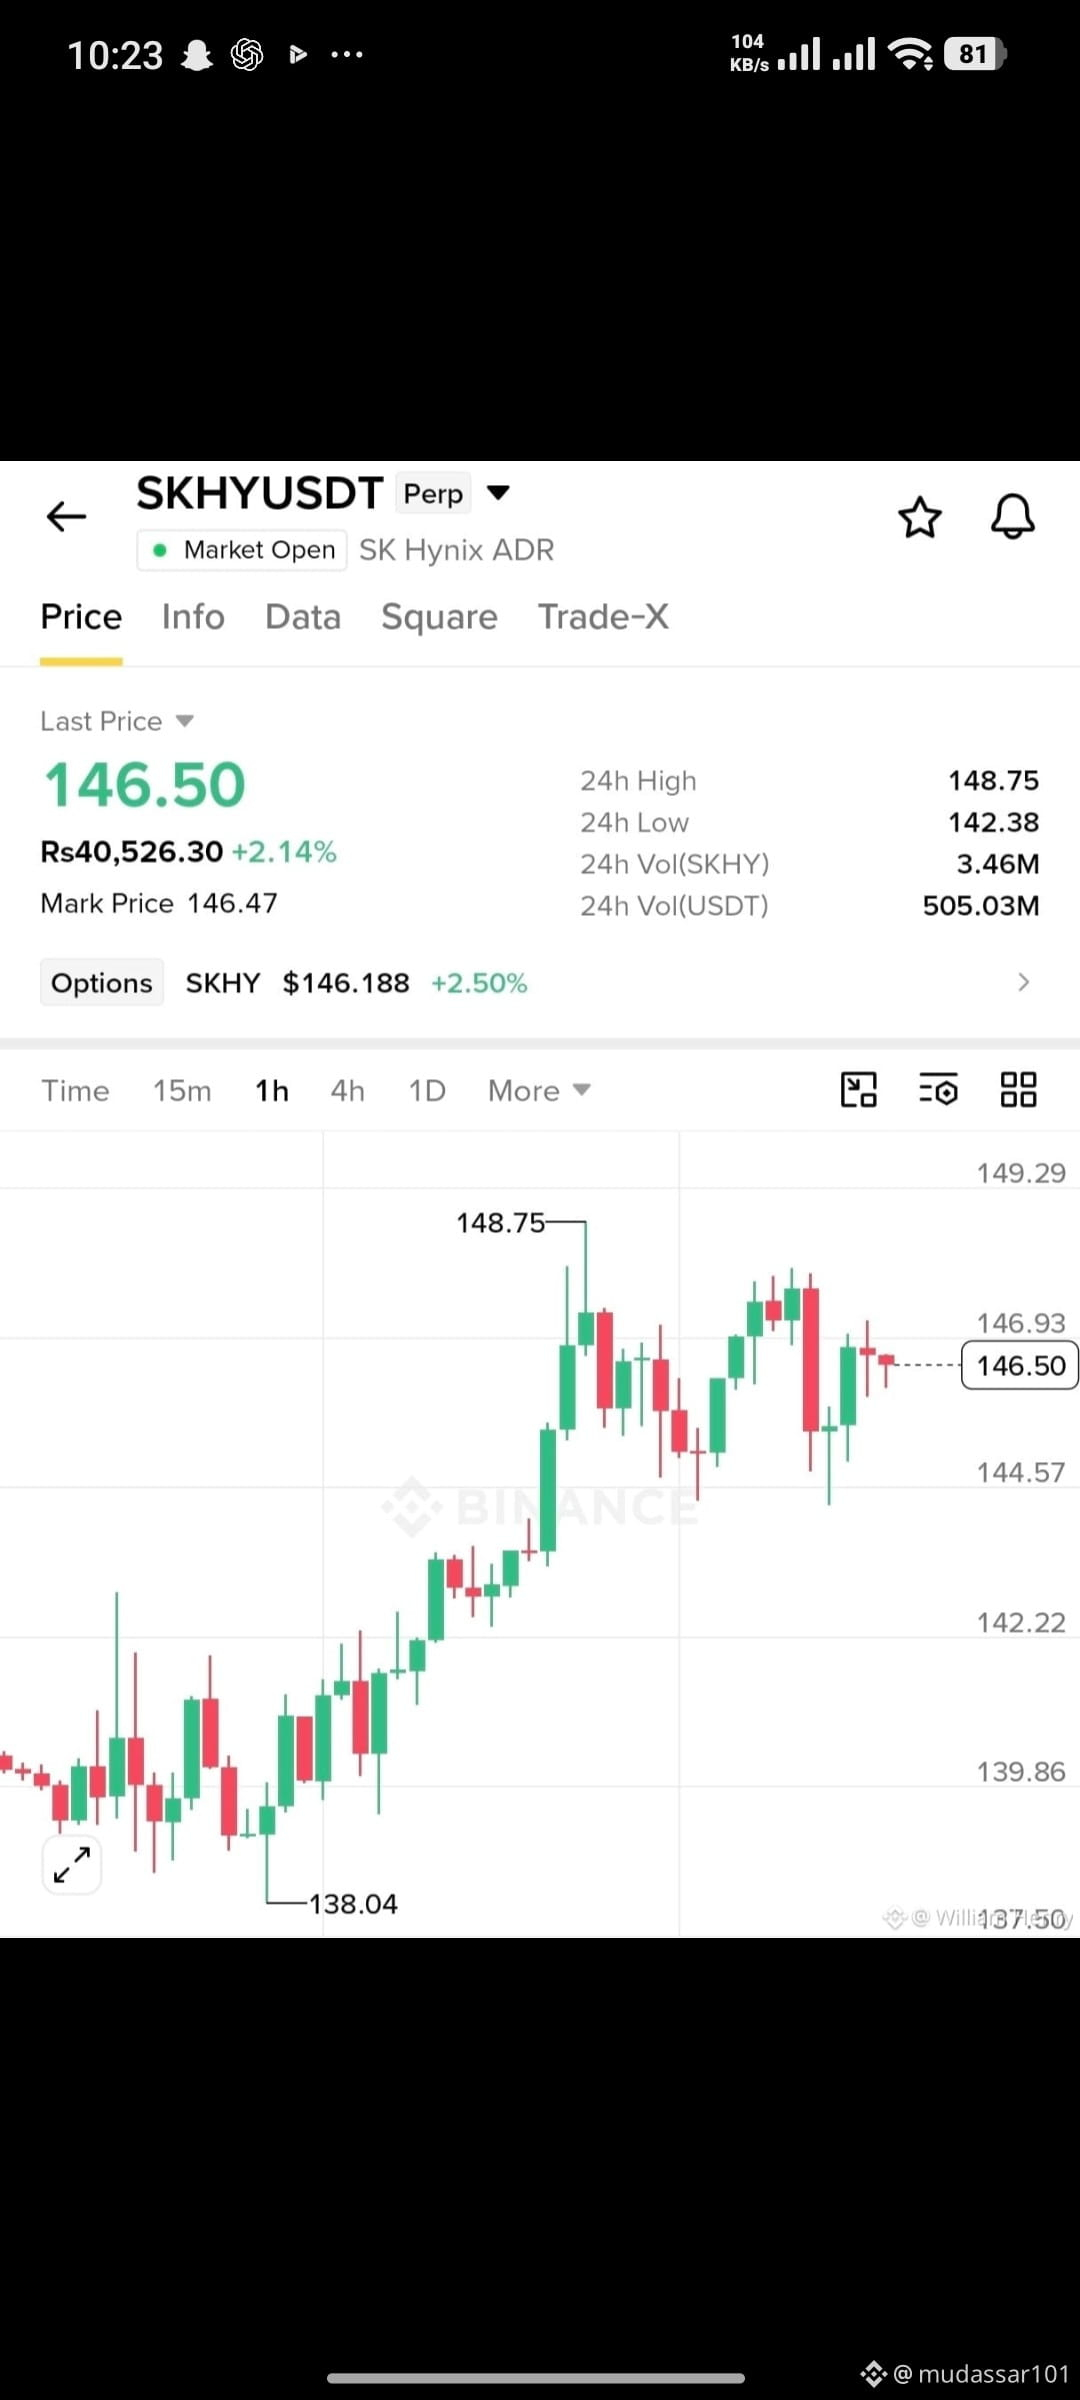
📈 $SKHY — BULLISH SETUP
Entry: $146.20–$146.60
🎯 TP1: $147.00 | TP2: $147.80
🎯 TP3: $148.75 | TP4: $150.00
🛑 SL: $144.30
Buyers are defending momentum after a strong rally. A breakout above $147 could open the path toward $148.75–$150. ⚡
⚠️ Watch support at $145–$144.50 and wait for confirmation.
#SKHy #Trading #priceaction
206

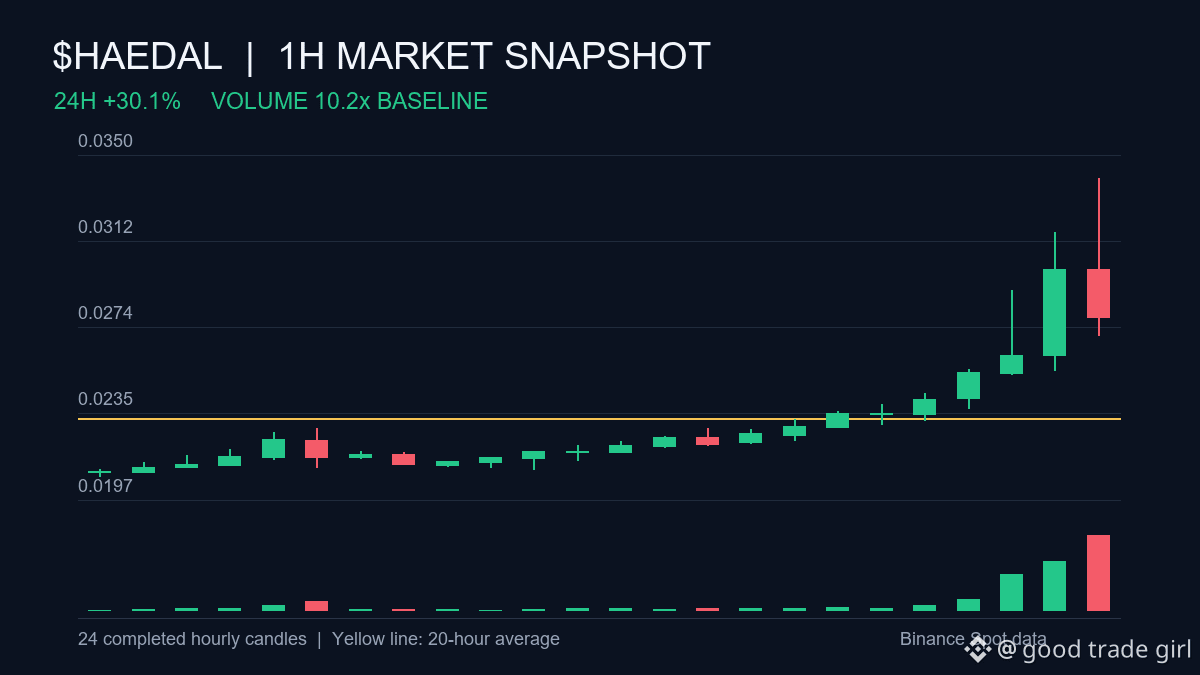
One-chart check for $HAEDAL: Price is above the 20-hour average (0.0233). The last hour moved -6.9% on 10.2x normal 1h volume. The 24h range: 0.0209–0.0340.
What would you watch next: the 20-hour average or the edge of the 24-hour range?
#PriceAction #HAEDAL
One-chart check for $HAEDAL : Price is above the 20-hour average (0.0233). The last hour moved -6.9% on 10.2x normal 1h volume. The 24h range: 0.0209–0.0340.
What would you watch next: the 20-hour average or the edge of the 24-hour range?
#PriceAction #HAEDAL
What would you watch next: the 20-hour average or the edge of the 24-hour range?
#PriceAction #HAEDAL
50
·
--
$BEB sits 0.8 percent away from $223.5300
An hourly close above that resistance opens up upside room
Rejection sends it back toward $202.1700 support
Break or reject 👀
Do not take my word for it, tap $BEB and look at the candles
#BEB #PriceAction
$BEB sits 0.8 percent away from $223.5300
An hourly close above that resistance opens up upside room
Rejection sends it back toward $202.1700 support
Break or reject 👀
Do not take my word for it, tap $BEB and look at the candles
#BEB #PriceAction
An hourly close above that resistance opens up upside room
Rejection sends it back toward $202.1700 support
Break or reject 👀
Do not take my word for it, tap $BEB and look at the candles
#BEB #PriceAction
2

·
--
⚡ UNI UNDER THE SPOTLIGHT: $100K SHORT LIQUIDATION! 🟢🔥
Uniswap traders are facing a critical moment! A $100,000 short liquidation at $7.094 has put #UNI on the radar as the market looks for its next directional move.
📊 TRADE DESK SNAPSHOT
🪙 Asset: Uniswap ($UNI)
🟢 Liquidation Side: Short
💰 Liquidation Value: $100,000
🎯 Liquidation Price: $7.094
🐂 BULLISH PLAY: If buyers maintain control around $7.094 and trading volume expands, UNI could test higher resistance levels. A confirmed breakout may attract additional buying pressure.
🐻 BEARISH COUNTERPLAY: If the price fails to hold its ground and drops below nearby support, a retracement could follow as sellers regain momentum.
🎯 PRO SIGNAL VIEW: Watch the $7.094 area for a clear breakout or rejection. Volume confirmation and a successful retest would provide stronger evidence before entering a trade.
🔥 My take: UNI has a level worth monitoring, but a short liquidation alone doesn't guarantee further gains. Let the price action confirm the next move.
⚠️ Manage leverage, define your stop-loss, and never risk more than you can afford to lose.
#UNI #Uniswap #CryptoMarket #LiquidationAlert #TradingStrategy #PriceAction
#CanGoogleDefindItsCore #SouthKoreaConsidersEducationTaxOnCryptoExchanges #OCCUrgesCommunityBanksToEnterStablecoinPayments #ThailandLaunchesWORPTStablecoinToQRPaymentApp
{spot}(UNIUSDT)
⚡ UNI UNDER THE SPOTLIGHT: $100K SHORT LIQUIDATION! 🟢🔥
Uniswap traders are facing a critical moment! A $100,000 short liquidation at $7.094 has put #UNI on the radar as the market looks for its next directional move.
📊 TRADE DESK SNAPSHOT
🪙 Asset: Uniswap ($UNI)
🟢 Liquidation Side: Short
💰 Liquidation Value: $100,000
🎯 Liquidation Price: $7.094
🐂 BULLISH PLAY: If buyers maintain control around $7.094 and trading volume expands, UNI could test higher resistance levels. A confirmed breakout may attract additional buying pressure.
🐻 BEARISH COUNTERPLAY: If the price fails to hold its ground and drops below nearby support, a retracement could follow as sellers regain momentum.
🎯 PRO SIGNAL VIEW: Watch the $7.094 area for a clear breakout or rejection. Volume confirmation and a successful retest would provide stronger evidence before entering a trade.
🔥 My take: UNI has a level worth monitoring, but a short liquidation alone doesn't guarantee further gains. Let the price action confirm the next move.
⚠️ Manage leverage, define your stop-loss, and never risk more than you can afford to lose.
#UNI #Uniswap #CryptoMarket #LiquidationAlert #TradingStrategy #PriceAction
#CanGoogleDefindItsCore #SouthKoreaConsidersEducationTaxOnCryptoExchanges #OCCUrgesCommunityBanksToEnterStablecoinPayments #ThailandLaunchesWORPTStablecoinToQRPaymentApp
9
·
--
🚨 ZEC ALERT: $153K SHORT LIQUIDATION — BEARS FEEL THE HEAT! 🟢🔥
Zcash is back in the spotlight! A $153,000 short liquidation at $1,273.35 signals that bearish traders faced forced closures, raising the stakes for the next move in #ZEC.
📊 LIQUIDATION REPORT
🪙 Asset: Zcash ($ZEC)
🟢 Liquidated Position: Short
💰 Liquidation Value: $153,000
🎯 Liquidation Price: $1,273.35
🐂 BULLISH CASE: If buyers defend the $1,273 zone and trading volume expands, ZEC could attempt another advance toward higher resistance. A confirmed breakout may attract further buying and short covering.
🐻 BEARISH COUNTERSCENARIO: If momentum cools and price loses nearby support, a retracement could follow. Short liquidations do not guarantee continued upside.
🎯 PRO SIGNAL PROVIDER'S TAKE: Keep $1,273.35 on the radar. Watch for a strong candle close, increasing volume, and a successful retest before considering a long setup. If price rejects resistance, stay cautious.
⚡ Next move: Bullish continuation is possible, but confirmation must come from price action—not liquidation data alone.
⚠️ Volatility creates opportunity and risk. Use disciplined position sizing and protect your capital.
#ZEC #Zcash #CryptoTrading #LiquidationAlert #MarketSignals #PriceAction
#CanGoogleDefindItsCore #OCCUrgesCommunityBanksToEnterStablecoinPayments #SouthKoreaConsidersEducationTaxOnCryptoExchanges #ThailandLaunchesWORPTStablecoinToQRPaymentApp
{spot}(ZECUSDT)
🚨 ZEC ALERT: $153K SHORT LIQUIDATION — BEARS FEEL THE HEAT! 🟢🔥
Zcash is back in the spotlight! A $153,000 short liquidation at $1,273.35 signals that bearish traders faced forced closures, raising the stakes for the next move in #ZEC.
📊 LIQUIDATION REPORT
🪙 Asset: Zcash ($ZEC)
🟢 Liquidated Position: Short
💰 Liquidation Value: $153,000
🎯 Liquidation Price: $1,273.35
🐂 BULLISH CASE: If buyers defend the $1,273 zone and trading volume expands, ZEC could attempt another advance toward higher resistance. A confirmed breakout may attract further buying and short covering.
🐻 BEARISH COUNTERSCENARIO: If momentum cools and price loses nearby support, a retracement could follow. Short liquidations do not guarantee continued upside.
🎯 PRO SIGNAL PROVIDER'S TAKE: Keep $1,273.35 on the radar. Watch for a strong candle close, increasing volume, and a successful retest before considering a long setup. If price rejects resistance, stay cautious.
⚡ Next move: Bullish continuation is possible, but confirmation must come from price action—not liquidation data alone.
⚠️ Volatility creates opportunity and risk. Use disciplined position sizing and protect your capital.
#ZEC #Zcash #CryptoTrading #LiquidationAlert #MarketSignals #PriceAction
#CanGoogleDefindItsCore #OCCUrgesCommunityBanksToEnterStablecoinPayments #SouthKoreaConsidersEducationTaxOnCryptoExchanges #ThailandLaunchesWORPTStablecoinToQRPaymentApp
8
·
--
₿⚡ BITCOIN MOMENTUM WATCH: $93.4K IN SHORTS LIQUIDATED!
The battle around $80K is heating up! 🟢 Bitcoin recorded a $93,400 short liquidation at $80,336.70, forcing bearish traders out of their positions and putting the market’s next move under the microscope.
📊 BTC LIQUIDATION BREAKDOWN
🪙 Asset: Bitcoin (#BTC)
🟢 Position: Short Liquidated
💰 Liquidation Value: $93,400
🎯 Liquidation Price: $80,336.70
🚀 BULLISH OUTLOOK: If BTC holds above the $80,336 zone and buying volume strengthens, a push toward higher resistance could follow. Continued short covering may add fuel to the move.
🔻 DOWNSIDE SCENARIO: If Bitcoin fails to sustain momentum and slips below nearby support, sellers could regain control and trigger another pullback.
🎯 SIGNAL DESK VERDICT: Watch how BTC behaves around $80,336.70. A strong breakout with volume would favor bullish continuation, while rejection could signal weakening momentum. Wait for confirmation before entering.
🔥 The key question: Can Bitcoin turn short liquidations into a sustained rally, or will sellers step back in?
⚠️ Liquidation data alone cannot confirm market direction. Control leverage, define your stop-loss, and protect your capital.
#BTC #Bitcoin #CryptoMarket #LiquidationAlert #TradingSignals #PriceAction
#CanGoogleDefindItsCore #OCCUrgesCommunityBanksToEnterStablecoinPayments #SouthKoreaConsidersEducationTaxOnCryptoExchanges #ThailandLaunchesWORPTStablecoinToQRPaymentApp
{spot}(BTCUSDT)
₿⚡ BITCOIN MOMENTUM WATCH: $93.4K IN SHORTS LIQUIDATED!
The battle around $80K is heating up! 🟢 Bitcoin recorded a $93,400 short liquidation at $80,336.70, forcing bearish traders out of their positions and putting the market’s next move under the microscope.
📊 BTC LIQUIDATION BREAKDOWN
🪙 Asset: Bitcoin (#BTC)
🟢 Position: Short Liquidated
💰 Liquidation Value: $93,400
🎯 Liquidation Price: $80,336.70
🚀 BULLISH OUTLOOK: If BTC holds above the $80,336 zone and buying volume strengthens, a push toward higher resistance could follow. Continued short covering may add fuel to the move.
🔻 DOWNSIDE SCENARIO: If Bitcoin fails to sustain momentum and slips below nearby support, sellers could regain control and trigger another pullback.
🎯 SIGNAL DESK VERDICT: Watch how BTC behaves around $80,336.70. A strong breakout with volume would favor bullish continuation, while rejection could signal weakening momentum. Wait for confirmation before entering.
🔥 The key question: Can Bitcoin turn short liquidations into a sustained rally, or will sellers step back in?
⚠️ Liquidation data alone cannot confirm market direction. Control leverage, define your stop-loss, and protect your capital.
#BTC #Bitcoin #CryptoMarket #LiquidationAlert #TradingSignals #PriceAction
#CanGoogleDefindItsCore #OCCUrgesCommunityBanksToEnterStablecoinPayments #SouthKoreaConsidersEducationTaxOnCryptoExchanges #ThailandLaunchesWORPTStablecoinToQRPaymentApp
8
·
--
🚨 BCH BREAKING ALERT: $99.6K IN SHORTS LIQUIDATED! 🟢⚡
The bears just faced a serious setback! Bitcoin Cash (#BCH) recorded a $99,600 short liquidation at $283.64, putting the spotlight on whether bullish momentum can gain further traction.
📊 LIQUIDATION RADAR
🪙 Asset: Bitcoin Cash ($BCH)
🟢 Event: Short Liquidation
💰 Liquidated Value: $99,600
🎯 Liquidation Price: $283.64
🐂 BULLISH SCENARIO: If BCH holds above the $283.64 zone and buying volume increases, the price could attempt a move toward nearby resistance. A confirmed breakout may trigger additional short covering.
🐻 BEARISH COUNTERATTACK: If momentum fades and BCH loses nearby support, a pullback could follow. Short liquidations alone cannot confirm a lasting uptrend.
🎯 PRO TRADER'S STRATEGY: Watch the reaction around $283.64. Look for sustained buying pressure and a confirmed breakout or successful retest before considering a long entry.
🔥 My market take: The setup deserves attention, but bullish continuation needs confirmation from price action and volume.
⚠️ Avoid chasing sudden spikes. Manage leverage, define your stop-loss, and protect your capital.
#BCH #BitcoinCash #CryptoTrading #LiquidationAlert #MarketSignals #PriceAction
#CanGoogleDefindItsCore #SouthKoreaConsidersEducationTaxOnCryptoExchanges #SouthKoreaConsidersEducationTaxOnCryptoExchanges #ThailandLaunchesWORPTStablecoinToQRPaymentApp
{spot}(BCHUSDT)
🚨 BCH BREAKING ALERT: $99.6K IN SHORTS LIQUIDATED! 🟢⚡
The bears just faced a serious setback! Bitcoin Cash (#BCH) recorded a $99,600 short liquidation at $283.64, putting the spotlight on whether bullish momentum can gain further traction.
📊 LIQUIDATION RADAR
🪙 Asset: Bitcoin Cash ($BCH)
🟢 Event: Short Liquidation
💰 Liquidated Value: $99,600
🎯 Liquidation Price: $283.64
🐂 BULLISH SCENARIO: If BCH holds above the $283.64 zone and buying volume increases, the price could attempt a move toward nearby resistance. A confirmed breakout may trigger additional short covering.
🐻 BEARISH COUNTERATTACK: If momentum fades and BCH loses nearby support, a pullback could follow. Short liquidations alone cannot confirm a lasting uptrend.
🎯 PRO TRADER'S STRATEGY: Watch the reaction around $283.64. Look for sustained buying pressure and a confirmed breakout or successful retest before considering a long entry.
🔥 My market take: The setup deserves attention, but bullish continuation needs confirmation from price action and volume.
⚠️ Avoid chasing sudden spikes. Manage leverage, define your stop-loss, and protect your capital.
#BCH #BitcoinCash #CryptoTrading #LiquidationAlert #MarketSignals #PriceAction
#CanGoogleDefindItsCore #SouthKoreaConsidersEducationTaxOnCryptoExchanges #SouthKoreaConsidersEducationTaxOnCryptoExchanges #ThailandLaunchesWORPTStablecoinToQRPaymentApp
9

Статья
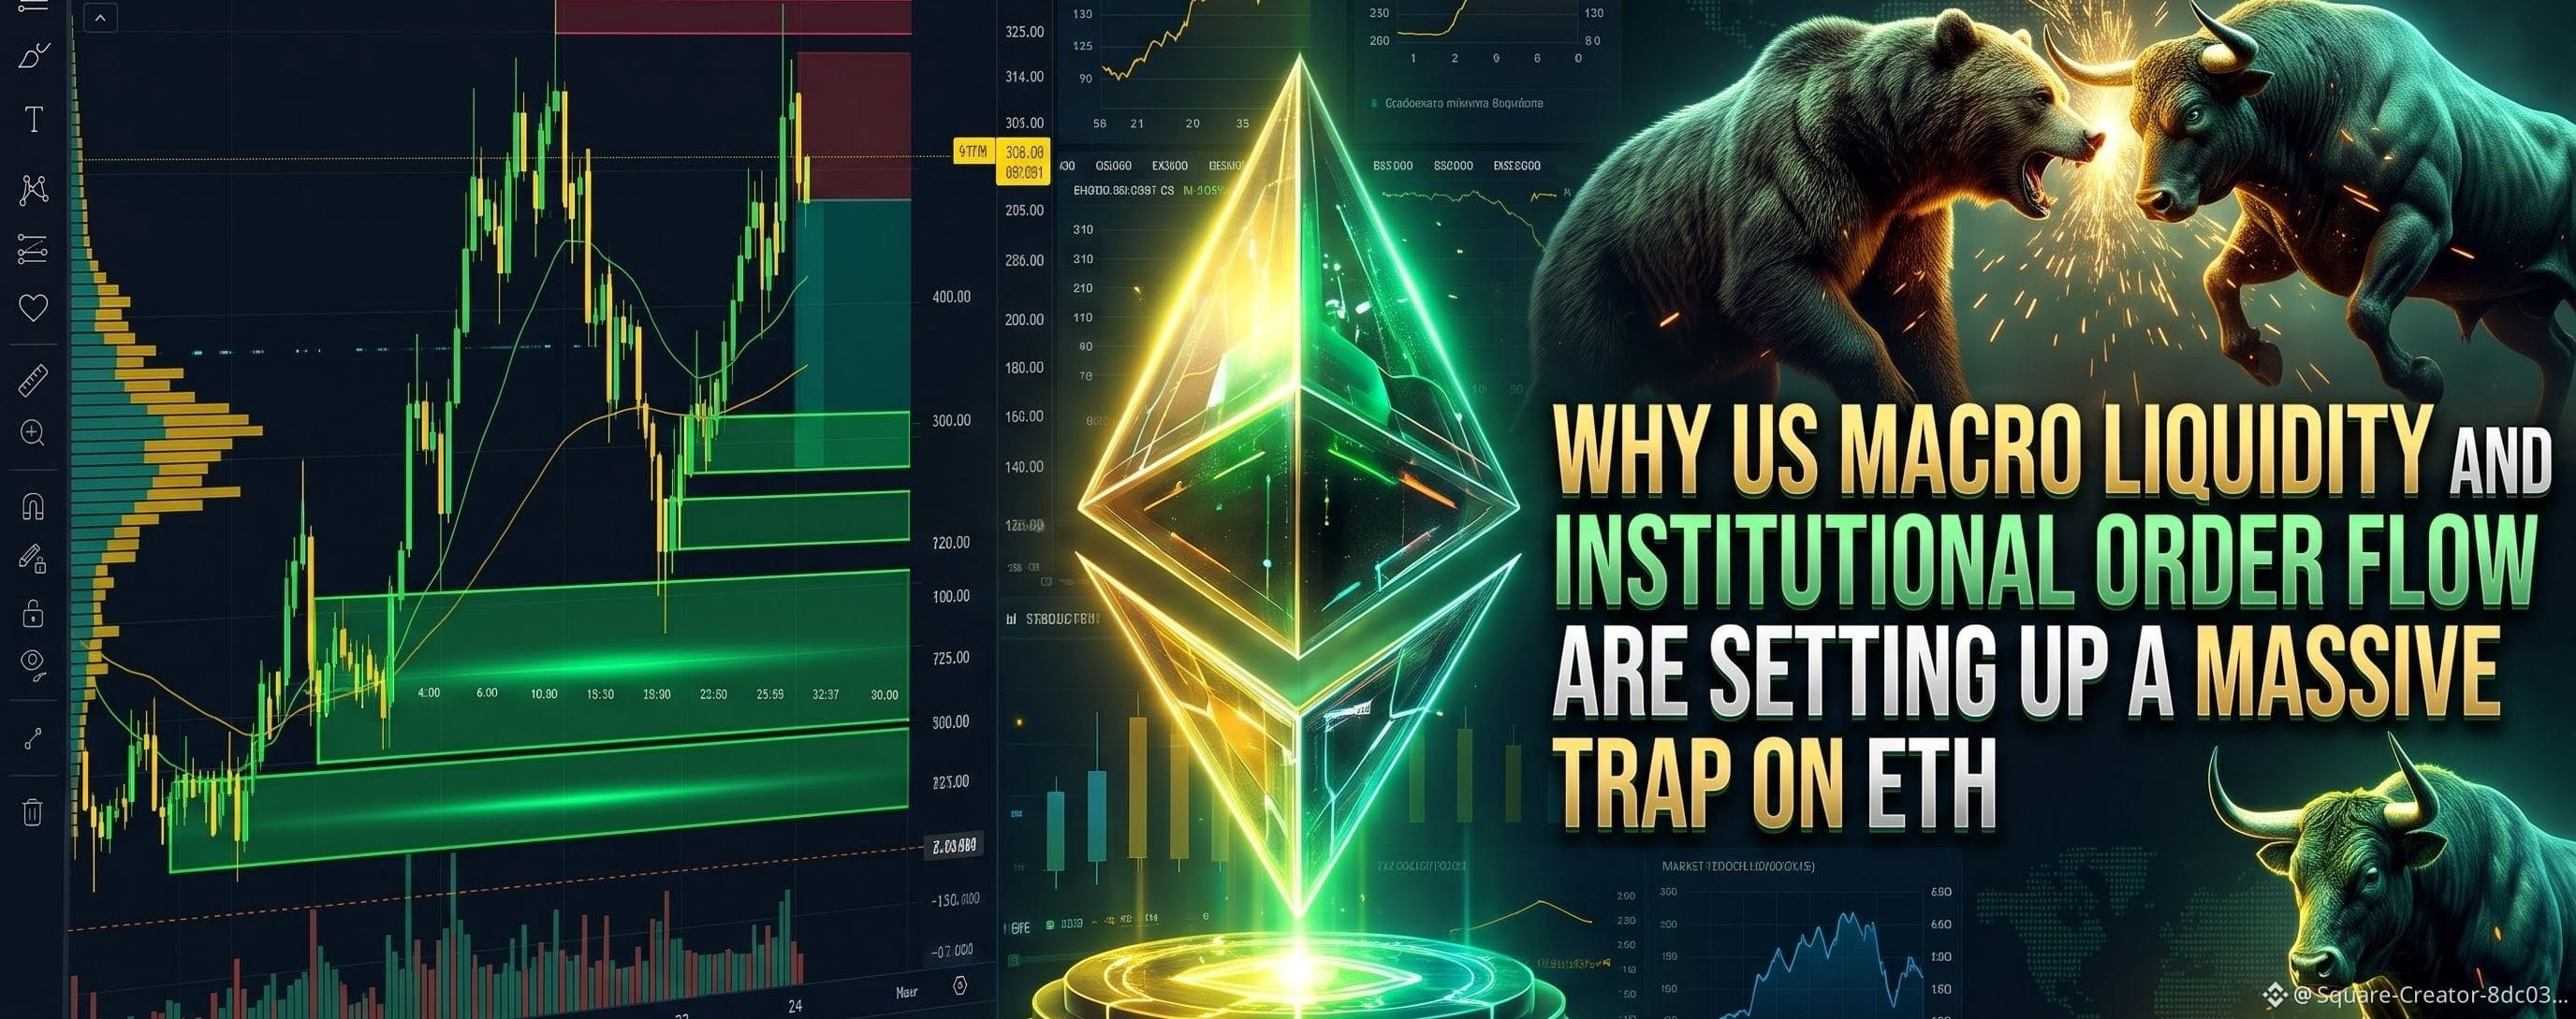
Why US Macro Liquidity and Institutional Order Flow Are Setting Up a Massive Trap on ETHWith the latest US economic data reinforcing sticky Treasury yields and Federal Reserve officials maintaining a patient policy stance, institutional desks used the macro fog to engineer an aggressive liquidity sweep on $ETH. While retail participants hesitated amid the headline uncertainty, the underlying tape on the 4-hour chart reveals a textbook liquidity trap where sell-side stops were flushed directly into resting institutional bids. Smart money operators used that manufactured volatility window to absorb inventory quietly without allowing spot prices to drift away from fair value.
When you inspect the tape following the impulse displacement, the telltale footprint appears right at the 50 percent base candle. Instead of aggressive follow-through selling, volume abruptly dried up as market sell orders were absorbed by passive resting bids. We are seeing a parallel absorption signature unfolding across $SOL, confirming that institutional liquidity is quietly rotating through key market leaders rather than fleeing the asset class.
For traders mapping their execution on $ETH, I am closely watching the primary demand base between $2,330 and $2,340. A clean 4-hour close below $2,310 completely invalidates this premise, signaling that institutional absorption has failed. If the recovery thesis holds, initial de-risking for $ETH sits at $2,780, leaving an extended runner for the broader macro liquidity pool at $3,400.
#EthereumDropsBelow$2300
In institutional trading, longevity comes down to keeping risk strictly capped at one to two percent per idea and letting the tape confirm the thesis before sizing up. You can track this setup and execute your limits directly via the interactive $ETH trade widget on this chart. Do you believe this absorption is genuine spot accumulation ahead of the next FOMC cycle, or are we witnessing a temporary hedge?
$ETH #BinanceSquare #CryptoTrading #PriceAction #CanMicrosoftDeliverOnAI
Why US Macro Liquidity and Institutional Order Flow Are Setting Up a Massive Trap on ETH
With the latest US economic data reinforcing sticky Treasury yields and Federal Reserve officials maintaining a patient policy stance, institutional desks used the macro fog to engineer an aggressive liquidity sweep on $ETH. While retail participants hesitated amid the headline uncertainty, the underlying tape on the 4-hour chart reveals a textbook liquidity trap where sell-side stops were flushed directly into resting institutional bids. Smart money operators used that manufactured volatility window to absorb inventory quietly without allowing spot prices to drift away from fair value.
When you inspect the tape following the impulse displacement, the telltale footprint appears right at the 50 percent base candle. Instead of aggressive follow-through selling, volume abruptly dried up as market sell orders were absorbed by passive resting bids. We are seeing a parallel absorption signature unfolding across $SOL, confirming that institutional liquidity is quietly rotating through key market leaders rather than fleeing the asset class.
For traders mapping their execution on $ETH, I am closely watching the primary demand base between $2,330 and $2,340. A clean 4-hour close below $2,310 completely invalidates this premise, signaling that institutional absorption has failed. If the recovery thesis holds, initial de-risking for $ETH sits at $2,780, leaving an extended runner for the broader macro liquidity pool at $3,400.
#EthereumDropsBelow$2300
In institutional trading, longevity comes down to keeping risk strictly capped at one to two percent per idea and letting the tape confirm the thesis before sizing up. You can track this setup and execute your limits directly via the interactive $ETH trade widget on this chart. Do you believe this absorption is genuine spot accumulation ahead of the next FOMC cycle, or are we witnessing a temporary hedge?
$ETH #BinanceSquare #CryptoTrading #PriceAction #CanMicrosoftDeliverOnAI
100
·
--
🚨 BTW WHALE ALERT: $667K SHORT LIQUIDATION! THE PRESSURE IS BUILDING! 🔥
💥 A major $667,000 short liquidation at $1.522 has put #BTW in the spotlight! This is a significant liquidation event, and traders will be watching closely to see whether bullish momentum can take control.
📊 LIQUIDATION BREAKDOWN 🟢 Asset: #BTW 💰 Liquidated Shorts: $667,000 🎯 Liquidation Price: $1.522
🐂 BULLISH CASE — MOMENTUM WATCH If buyers defend the $1.522 area and volume increases, BTW could attempt a recovery toward nearby resistance. A confirmed breakout may create further upside opportunities.
🐻 BEARISH CASE — STAY ALERT If price loses support and buying pressure weakens, the market could reverse lower. A short liquidation does not automatically mean a sustained rally is coming.
🎯 PRO TRADER STRATEGY Watch the reaction around $1.522, confirm the trend with price action and volume, and avoid entering without a clear invalidation level.
⚡ The next move depends on buyer strength—not liquidation numbers alone.
⚠️ High volatility can create opportunities and sharp losses. Manage leverage and protect your capital.
#BTW #CryptoTrading #LiquidationAlert #MarketSignals #PriceAction
#CanGoogleDefindItsCore #SouthKoreaConsidersEducationTaxOnCryptoExchanges #OCCUrgesCommunityBanksToEnterStablecoinPayments #ThailandLaunchesWORPTStablecoinToQRPaymentApp
{alpha}(560x444045b0ee1ee319a660a5e3d604ca0ffa35acaa)
🚨 BTW WHALE ALERT: $667K SHORT LIQUIDATION! THE PRESSURE IS BUILDING! 🔥
💥 A major $667,000 short liquidation at $1.522 has put #BTW in the spotlight! This is a significant liquidation event, and traders will be watching closely to see whether bullish momentum can take control.
📊 LIQUIDATION BREAKDOWN 🟢 Asset: #BTW 💰 Liquidated Shorts: $667,000 🎯 Liquidation Price: $1.522
🐂 BULLISH CASE — MOMENTUM WATCH If buyers defend the $1.522 area and volume increases, BTW could attempt a recovery toward nearby resistance. A confirmed breakout may create further upside opportunities.
🐻 BEARISH CASE — STAY ALERT If price loses support and buying pressure weakens, the market could reverse lower. A short liquidation does not automatically mean a sustained rally is coming.
🎯 PRO TRADER STRATEGY Watch the reaction around $1.522, confirm the trend with price action and volume, and avoid entering without a clear invalidation level.
⚡ The next move depends on buyer strength—not liquidation numbers alone.
⚠️ High volatility can create opportunities and sharp losses. Manage leverage and protect your capital.
#BTW #CryptoTrading #LiquidationAlert #MarketSignals #PriceAction
#CanGoogleDefindItsCore #SouthKoreaConsidersEducationTaxOnCryptoExchanges #OCCUrgesCommunityBanksToEnterStablecoinPayments #ThailandLaunchesWORPTStablecoinToQRPaymentApp
8

·
--
Traders are watching whether $ANIME can turn this retest into continuation.
$ANIME – Momentum remains strong, and price is holding above the local range with buyers still active.
Trading Plan LONG $ANIME (max 10x)
🎯 Entry: 0.003002 - 0.003026
🛑 SL: 0.002719
✅ TP1: 0.003056
✅ TP2: 0.003095
✅ TP3: 0.003141
• Fresh 24h volatility is creating a cleaner setup
• Relative volume is keeping this chart active on watchlists
Would you long the retest on $ANIME, or wait for a reclaim first?
Trade $ANIME here 👇
#ANIME #Crypto #PriceAction
Traders are watching whether $ANIME can turn this retest into continuation.
$ANIME – Momentum remains strong, and price is holding above the local range with buyers still active.
Trading Plan LONG $ANIME (max 10x)
🎯 Entry: 0.003002 - 0.003026
🛑 SL: 0.002719
✅ TP1: 0.003056
✅ TP2: 0.003095
✅ TP3: 0.003141
• Fresh 24h volatility is creating a cleaner setup
• Relative volume is keeping this chart active on watchlists
Would you long the retest on $ANIME , or wait for a reclaim first?
Trade $ANIME here 👇
#ANIME #Crypto #PriceAction
26
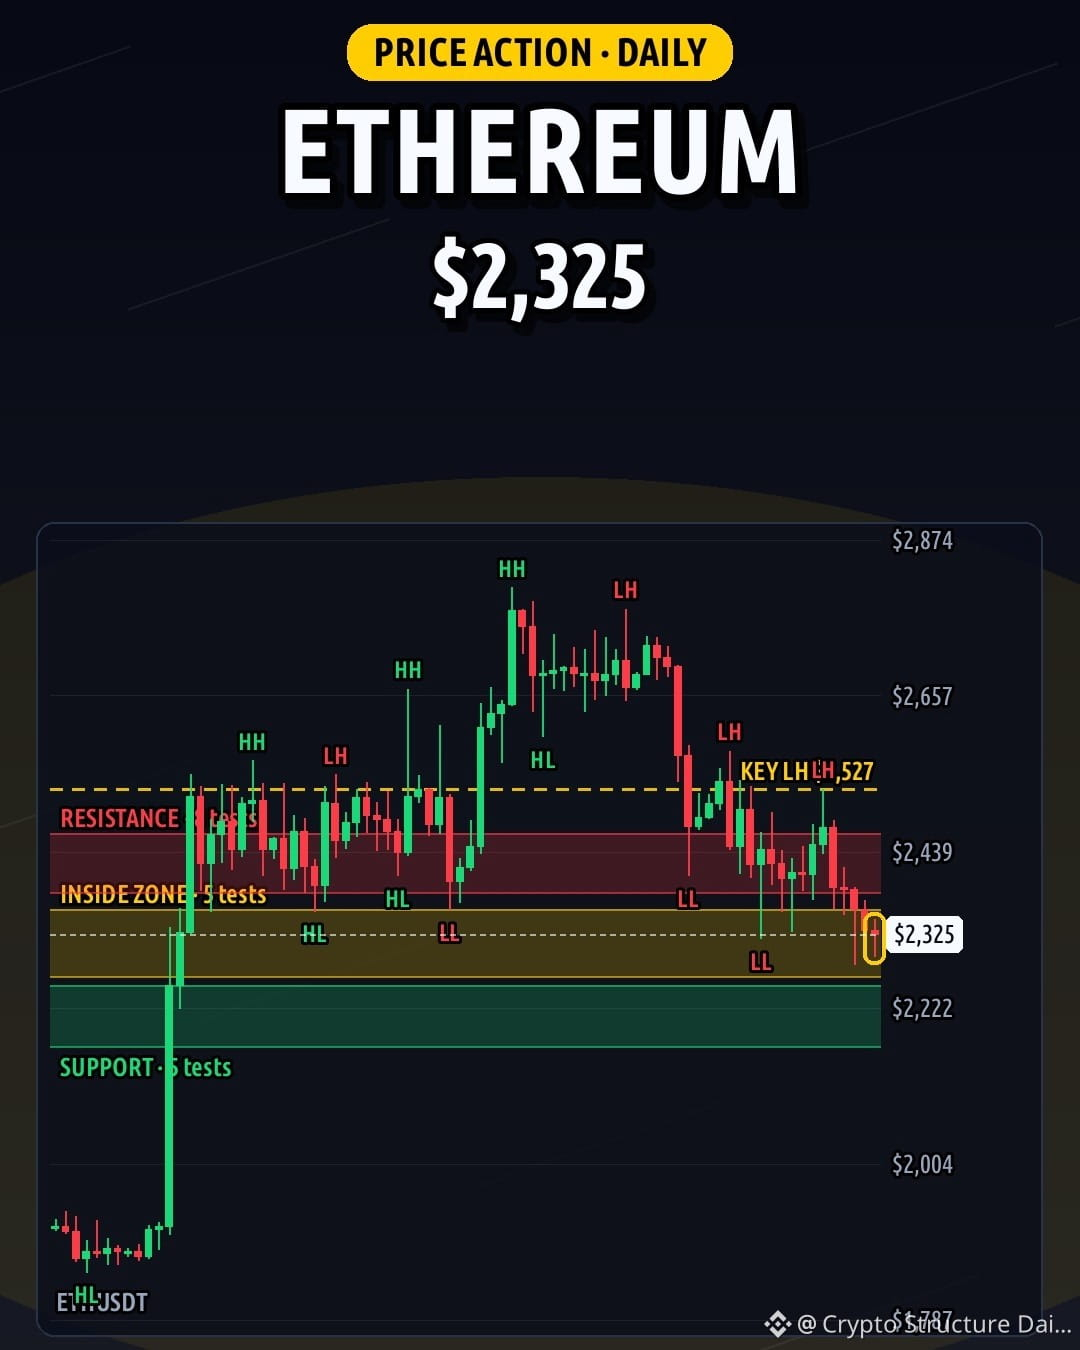
$ETH at 2,325 with a 4H hammer right under resistance at 2,359 (7 tests). 4H structure shows lower highs/lows with key swing 2,345.
Daily structure prints lower highs/lows with a hammer, key swing 2,527, support 2,210 (5 tests), and resistance 2,424 (8 tests). Weekly is a range, no clear trend: support 2,142 (5 tests), resistance 2,843 (6 tests).
Daily close above 2,465 → next zone 2,563. Daily close below 2,266 → next zone 2,210.
Which side breaks first? NFA 📊 #ETH #PriceAction
45
Войдите, чтобы посмотреть больше материала
Присоединяйтесь к пользователям криптовалют по всему миру на Binance Square
⚡️ Получайте новейшую и полезную информацию о криптоактивах.
💬 Нам доверяет крупнейшая в мире криптобиржа.
👍 Получите достоверные аналитические данные от верифицированных создателей контента.
Эл. почта/номер телефона
В тренде
1
#CanMicrosoftDeliverOnAI
Просмотров: 122,875
946 обсуждают
2
#CanGoogleDefindItsCore
Просмотров: 59,731
672 обсуждают
3
#FOMCWatch
Просмотров: 9.1M
28,199 обсуждают
4
#OSMOPlansToBurn100MTokensFromCommunityPool
Просмотров: 325
26 обсуждают
5
#EthereumDropsBelow$2300
Просмотров: 12,152
163 обсуждают
6
#BitcoinSlipsBelow$80KAgain
Просмотров: 34,102
131 обсуждают
7
#ThailandLaunchesWORPTStablecoinToQRPaymentApp
Просмотров: 72,249
869 обсуждают
8
#StrategySkipsBitcoinPurchasesSpends$205MOnSTRCBuybacks
Просмотров: 13,392
99 обсуждают
9
#BitmineAdds10452ETH
Просмотров: 122,298
1,287 обсуждают
10
#SouthKoreaConsidersEducationTaxOnCryptoExchanges
Просмотров: 78,121
891 обсуждают