

Crypto Structure Daily
71 Публикации

Crypto Structure Daily
Отправить жалобу
Заблокировать пользователя
Daily crypto price action:
Открытая сделка
Трейдер с частыми сделками
6.2 г
10 подписок(и/а)
125 подписчиков(а)
71 понравилось
Посты
Портфель
Все
Цитирования
PINNED
We're LIVE 24/7 on YouTube 🔴
Crypto Structure Daily runs a nonstop stream: live $BTC and $ETH prices, buyer/seller flow, key levels with touch counts and hourly market bulletins, all measured from Binance data.
No hype, no calls. Just structure.
Watch: https://www.youtube.com/watch?v=1mj61vaek2I
NFA #BTC #ETH #CryptoLive #PriceAction
89
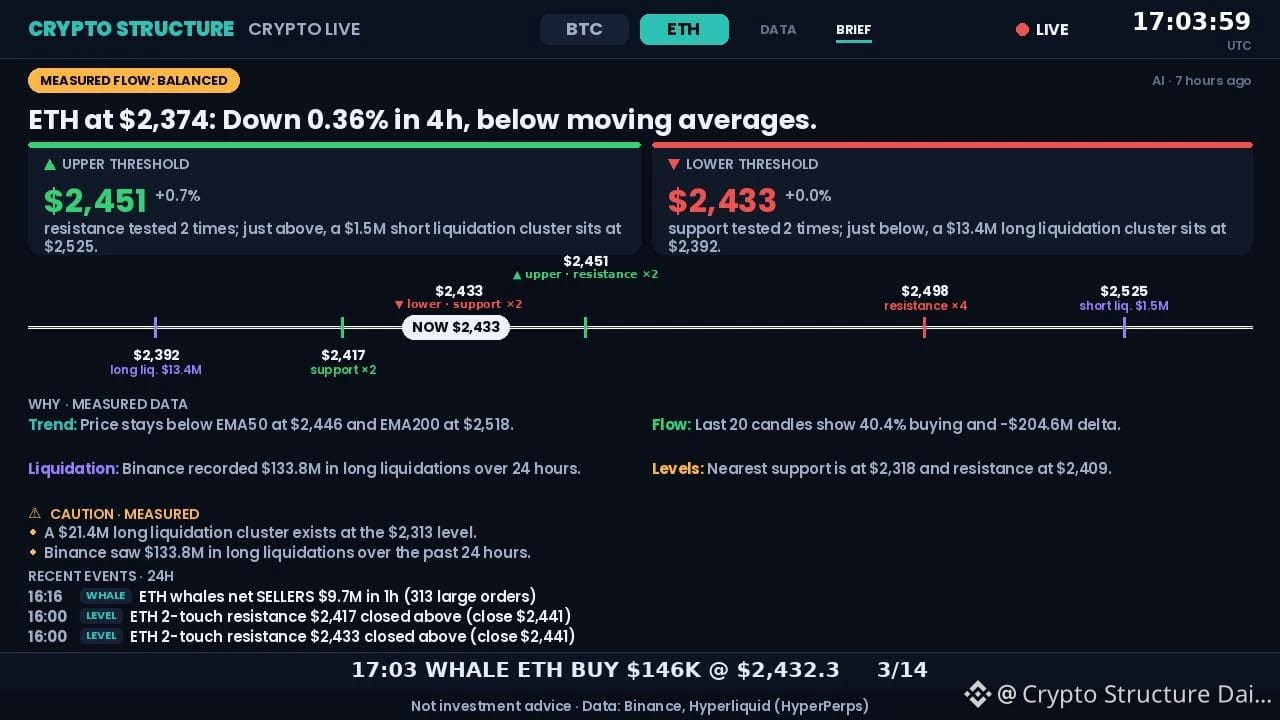
$HUMA printed a daily hammer at 0.02791 with a 9.7x volume spike. 📊
Weekly is a range (support 0.02275, resistance 0.02935). Daily and 4H show lower highs/lows. Daily key swing is 0.03174 with support at 0.026 (7 tests). 4H has resistance at 0.0293 (10 tests) and support at 0.02556 (6 tests).
If the daily closes above 0.02816, structure strengthens. Lose 0.02549 and 0.02316 is in play.
Can this volume trigger a reversal? NFA #HUMA #PriceAction #CryptoAnalysis
78
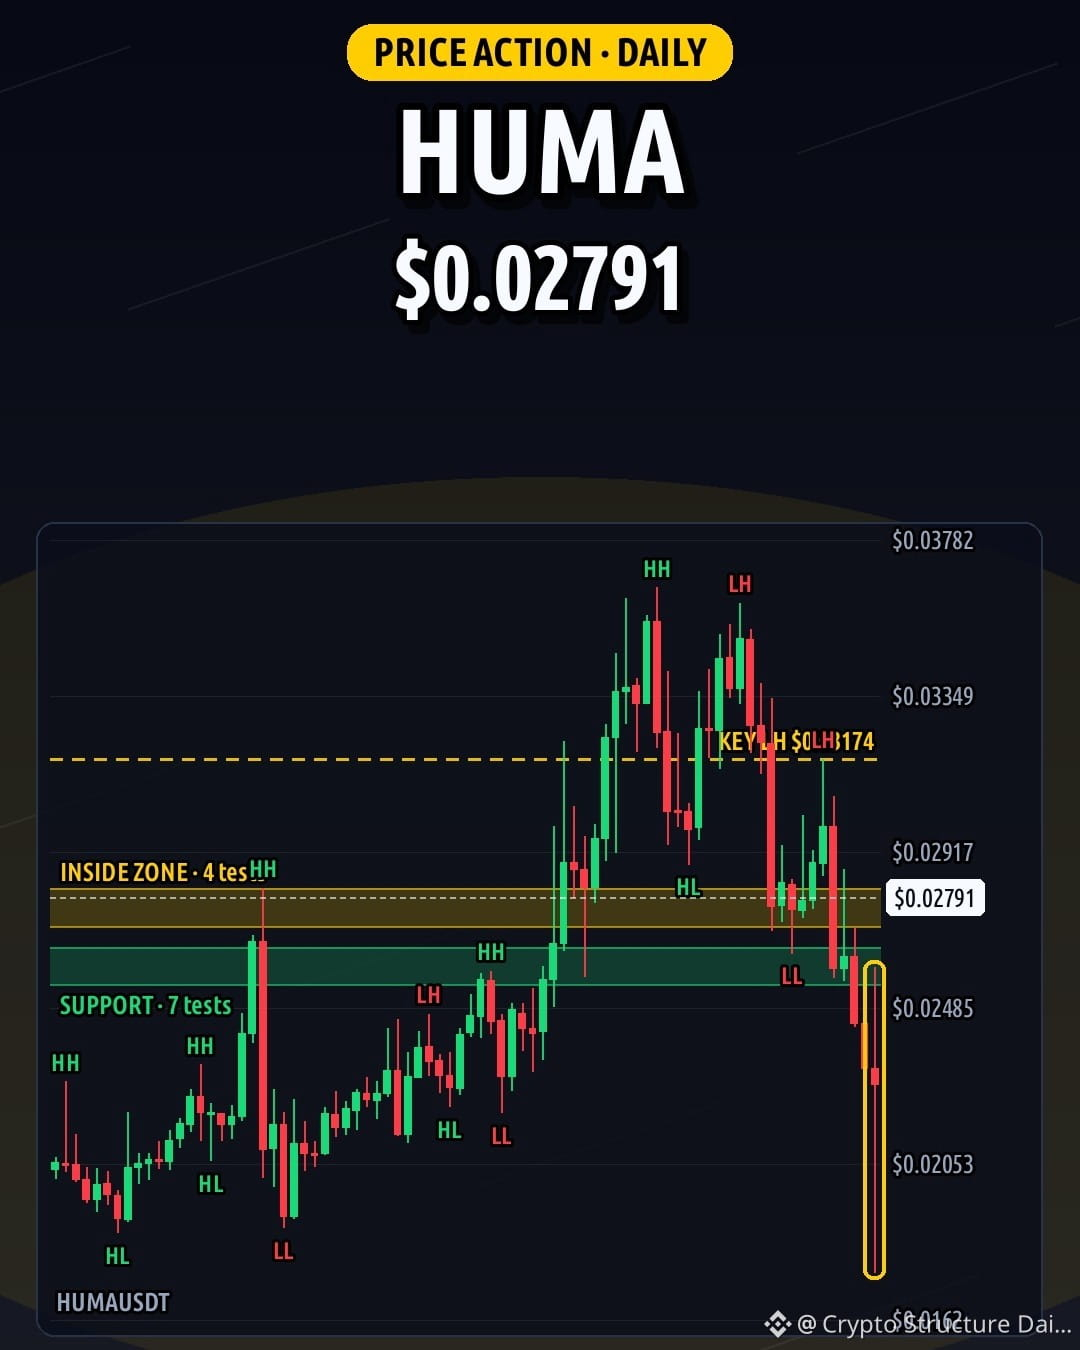
$ETH at 2,325 with a 4H hammer right under resistance at 2,359 (7 tests). 4H structure shows lower highs/lows with key swing 2,345.
Daily structure prints lower highs/lows with a hammer, key swing 2,527, support 2,210 (5 tests), and resistance 2,424 (8 tests). Weekly is a range, no clear trend: support 2,142 (5 tests), resistance 2,843 (6 tests).
Daily close above 2,465 → next zone 2,563. Daily close below 2,266 → next zone 2,210.
Which side breaks first? NFA 📊 #ETH #PriceAction
45
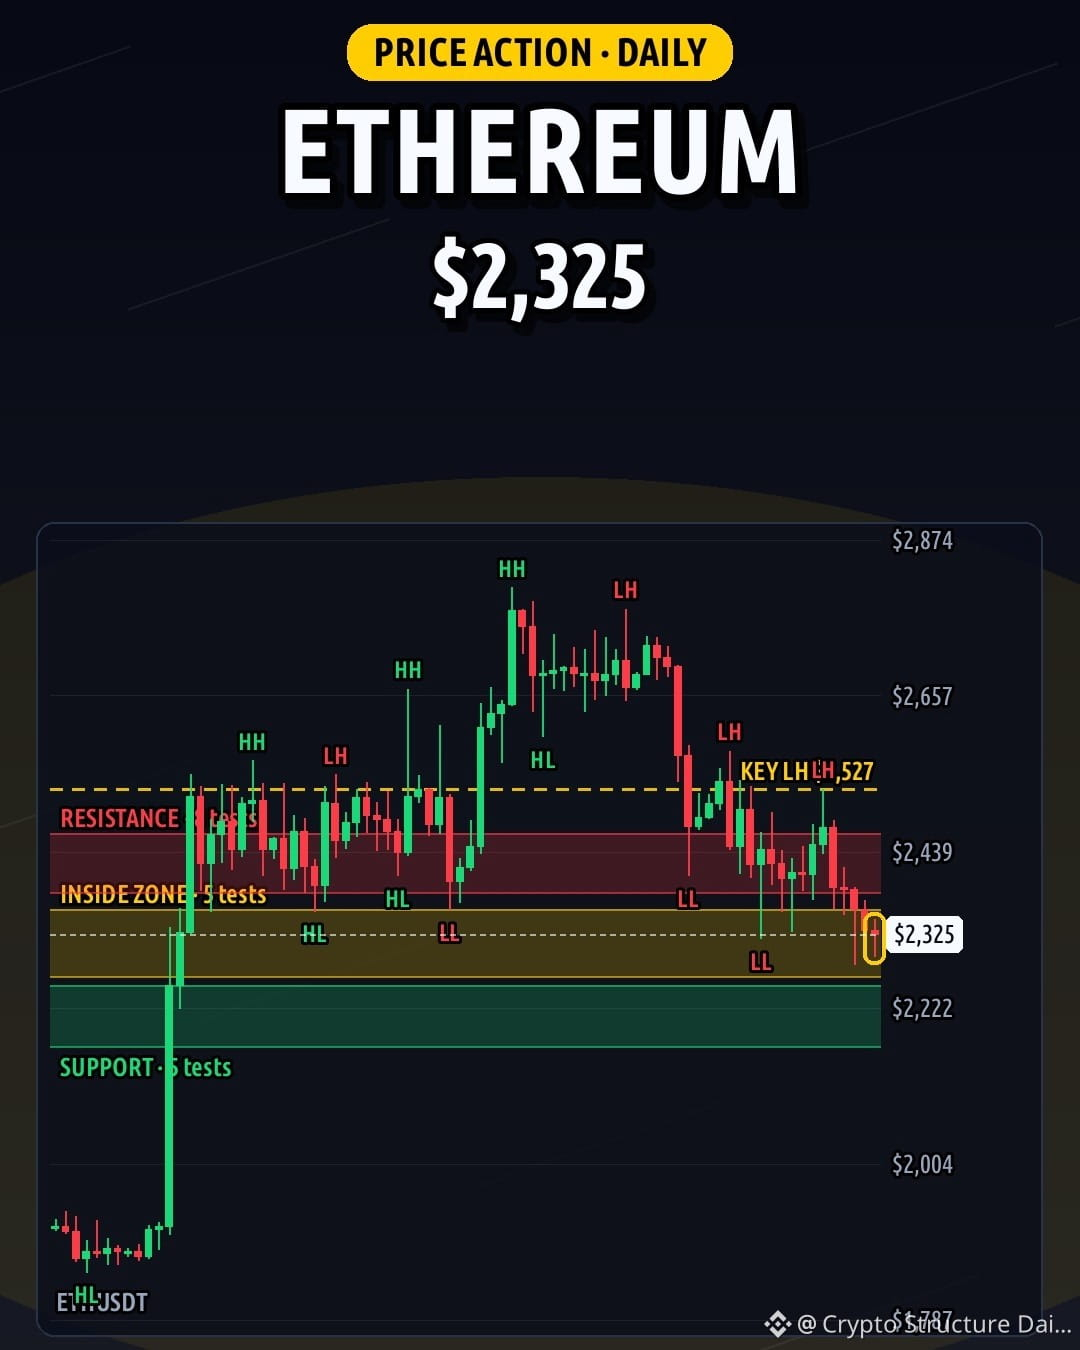
Daily hammer just printed for $SUI at 0.9019. 4H closed a doji right under resistance at 0.9342 (4 tests).
Daily shows lower highs/lows with support at 0.8811 (6 tests) and resistance at 0.9735 (7 tests). Weekly holds higher highs/lows with support at 0.7838 (3 tests).
If the daily closes above 0.9931, the next zone is 1.02. Lose 0.8654 and 0.8322 is in play.
Reversal here or just a pause? 📊
NFA #SUI #PriceAction #CryptoAnalysis
304
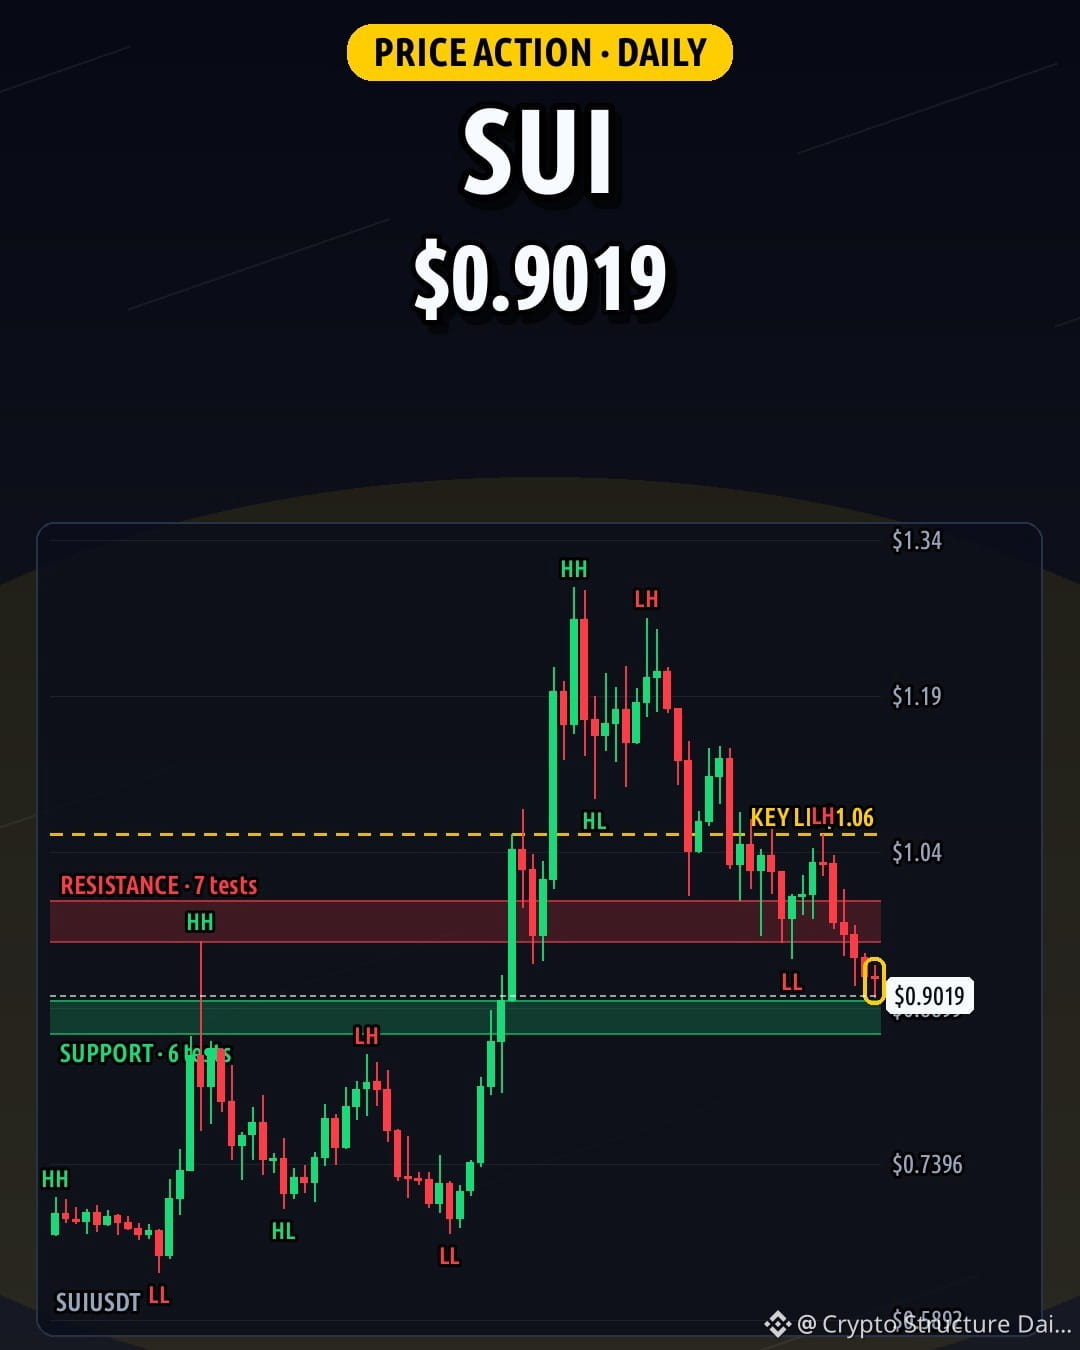
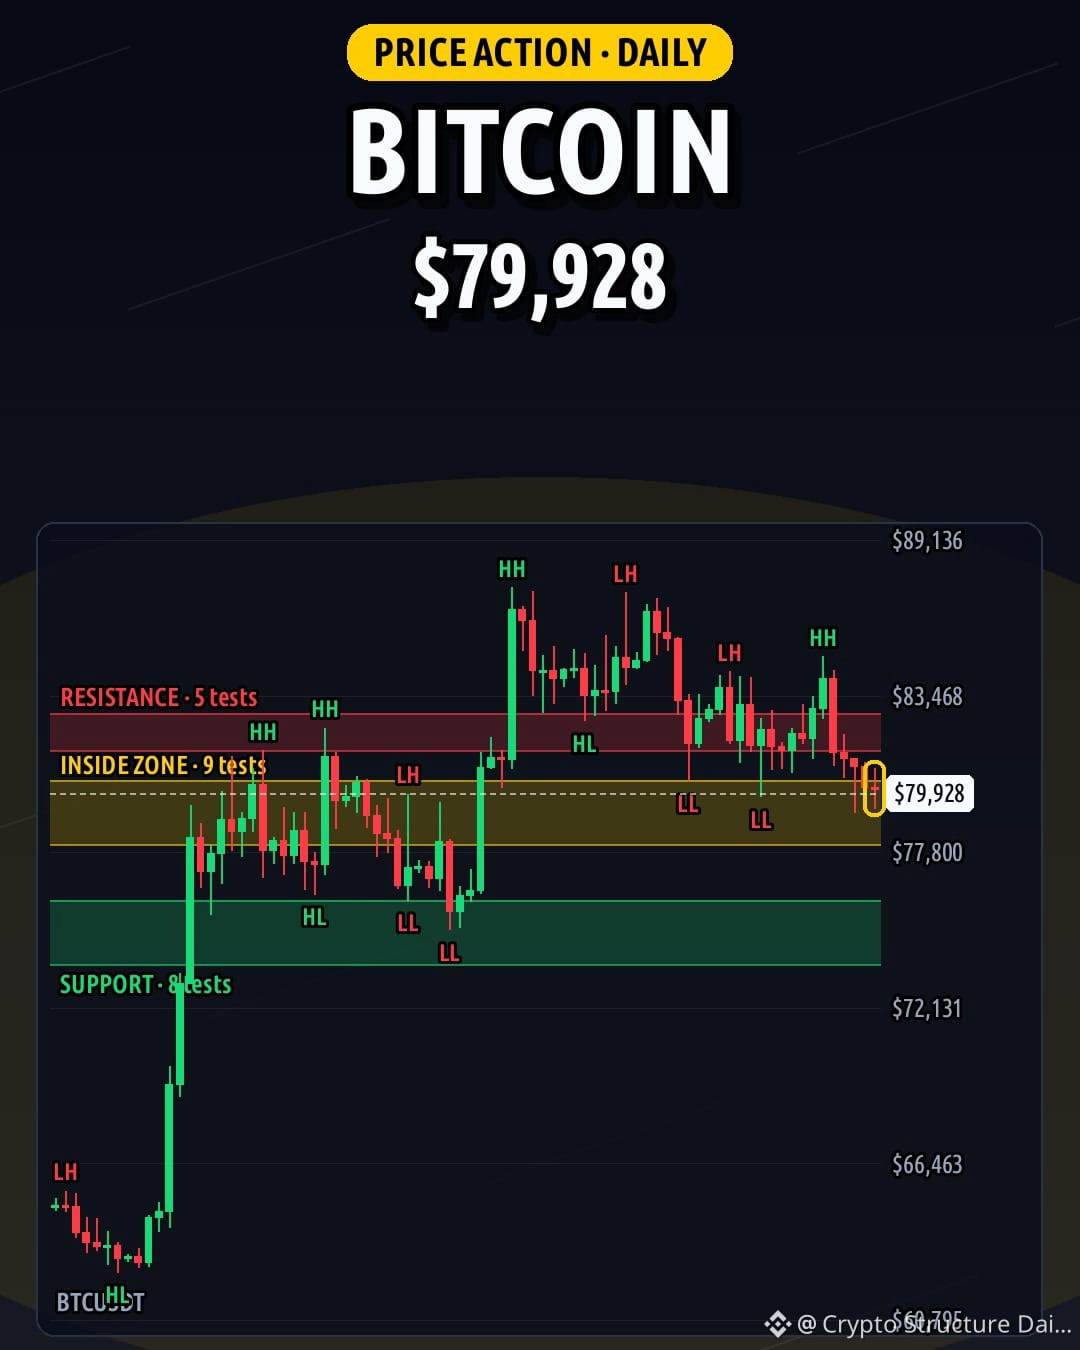
4H printed a bearish engulfing right under 80,533 resistance (7 tests), keeping $BTC at 79,928.
Weekly shows higher highs/lows with key swing 74,968, support 73,482 (5 tests) and resistance 88,326 (3 tests). Daily is a range with a doji, support 74,888 (8 tests) and resistance 82,164 (5 tests). 4H is a range with support 79,555 (6 tests).
If the daily closes above 82,850, structure strengthens. Lose 78,080 and 74,888 is in play.
Patience until we break the range. 📊
NFA
#BTC #PriceAction #CryptoAnalysis
67
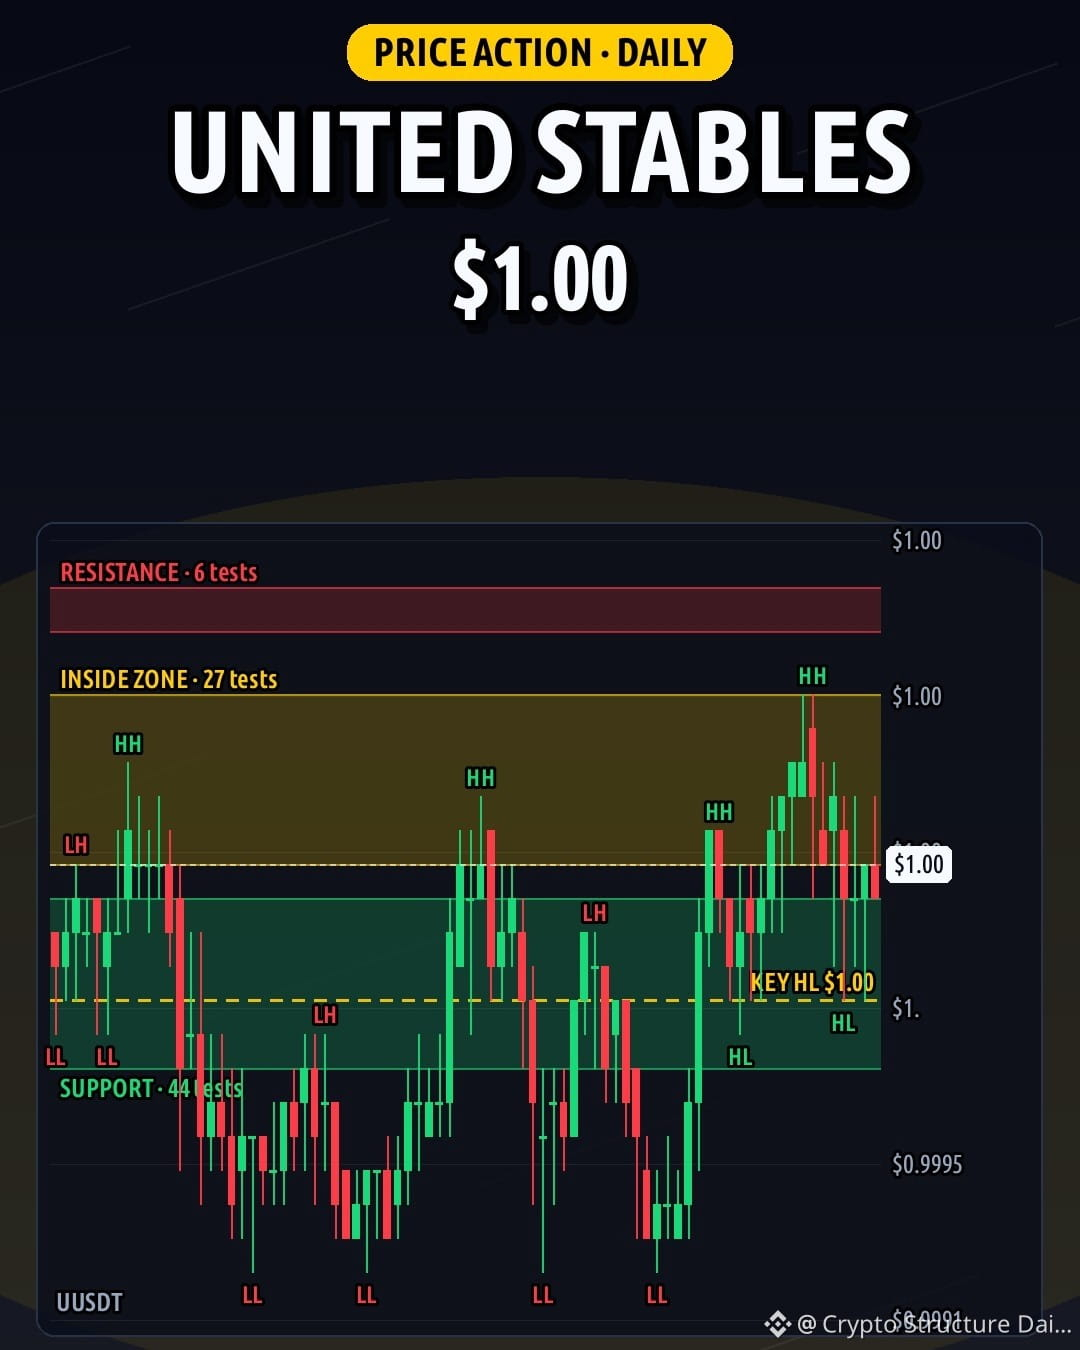
Volume spikes 2.5x average on $U as the 4H ranges with support 1.00 (19 tests) and resistance 1.00 (18 tests). 📊
Weekly structure prints lower highs/lows with key swing 1.00, support 0.9992 (6 tests), and resistance 1.00 (3 tests). Daily structure shows higher highs/lows with key swing 1.00, support 1.00 (44 tests), and resistance 1.00 (6 tests).
If the daily closes above 1.00, next zone is 1.00; lose 0.9992 and lower is in play.
Fading the edges or waiting?
NFA
#U #PriceAction #CryptoAnalysis
66
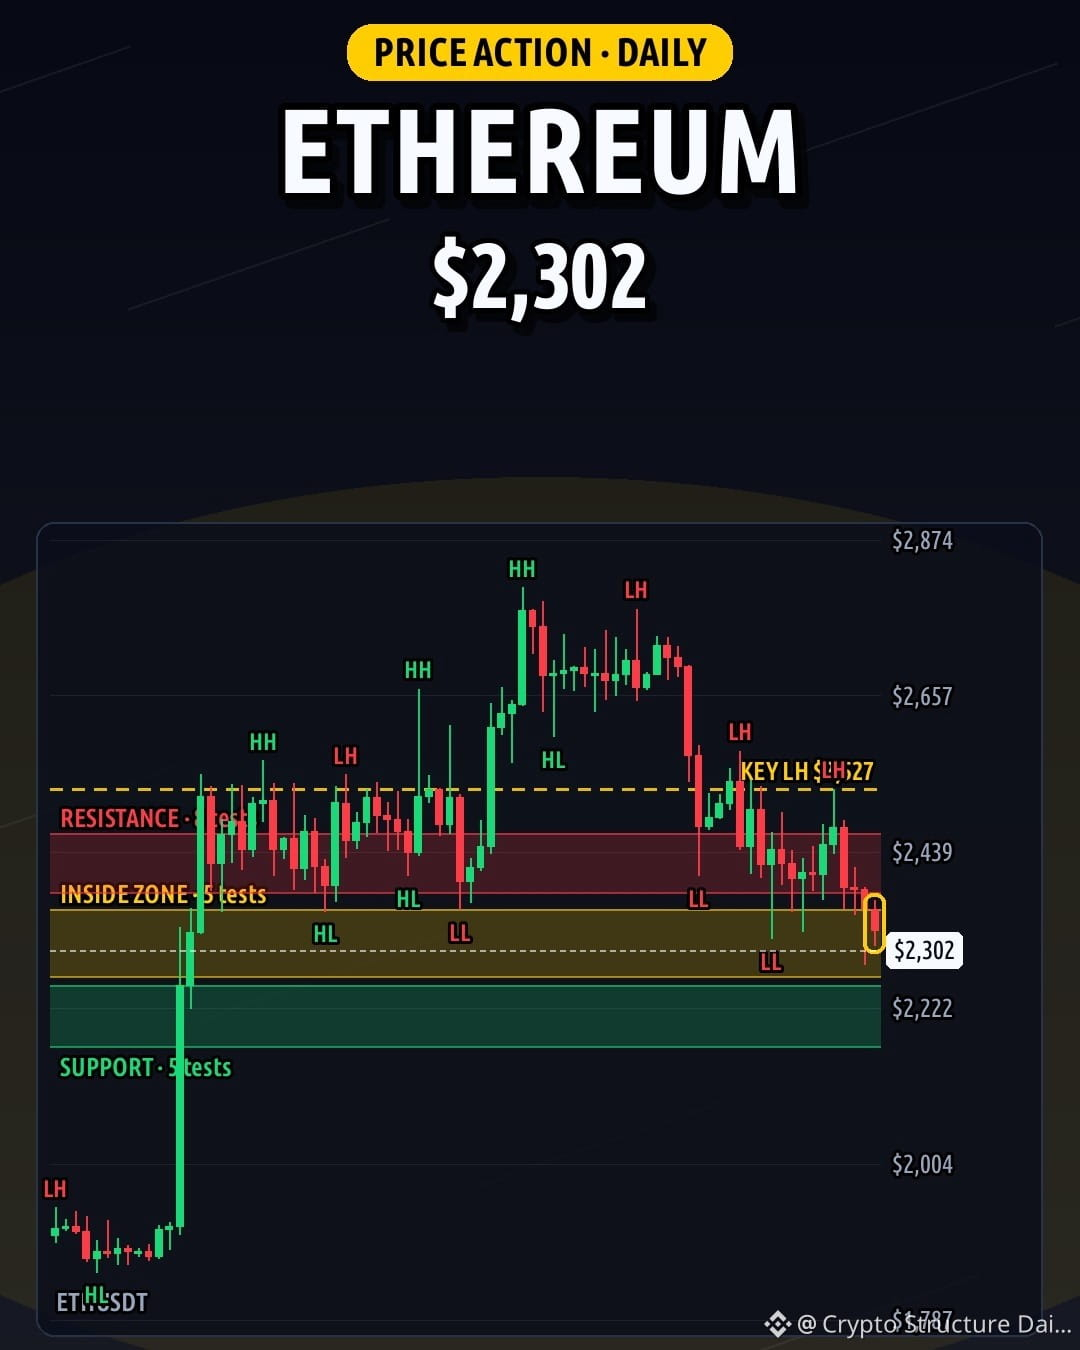
$ETH printing an inside bar on the daily at 2,302 while 4H prints lower highs and lows under resistance at 2,362 (6 tests).
Weekly shows a range with support at 2,142 (5 tests) and resistance at 2,843 (6 tests). Daily structure has lower highs/lows with key swing at 2,527 and resistance at 2,424 (8 tests).
If the daily closes above 2,465, next zone is 2,563. Lose 2,266 and 2,210 is in play.
Which side are you watching? NFA #ETH #PriceAction #CryptoAnalysis 📊
72
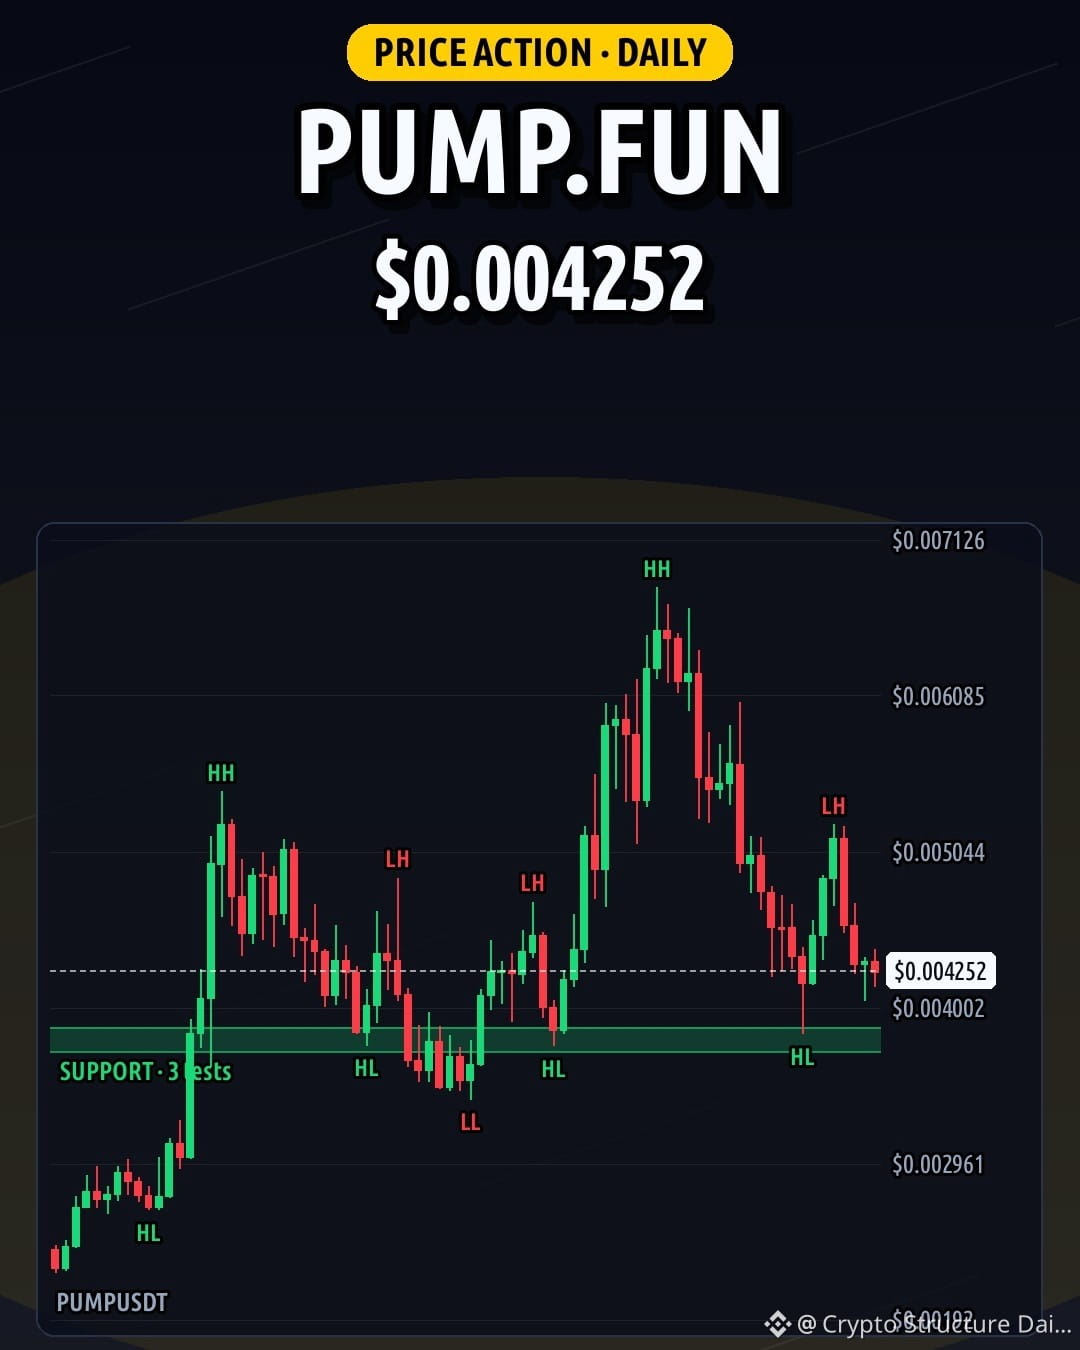
$PUMP trading at 0.004252 with an inverted hammer closing the 4H right under resistance at 0.004334 (5 tests). 📊
Daily and 4H show ranges with no clear trend, while daily support holds at 0.003791 (3 tests). Weekly shows higher highs/lows with a key swing at 0.003394 and support at 0.003377 (2 tests). Resistance is at 0.005466 (2 tests).
If the daily closes below 0.003713, the next zone is 0.002068.
Are sellers in control here? NFA
#PUMP #PriceAction #CryptoAnalysis
297
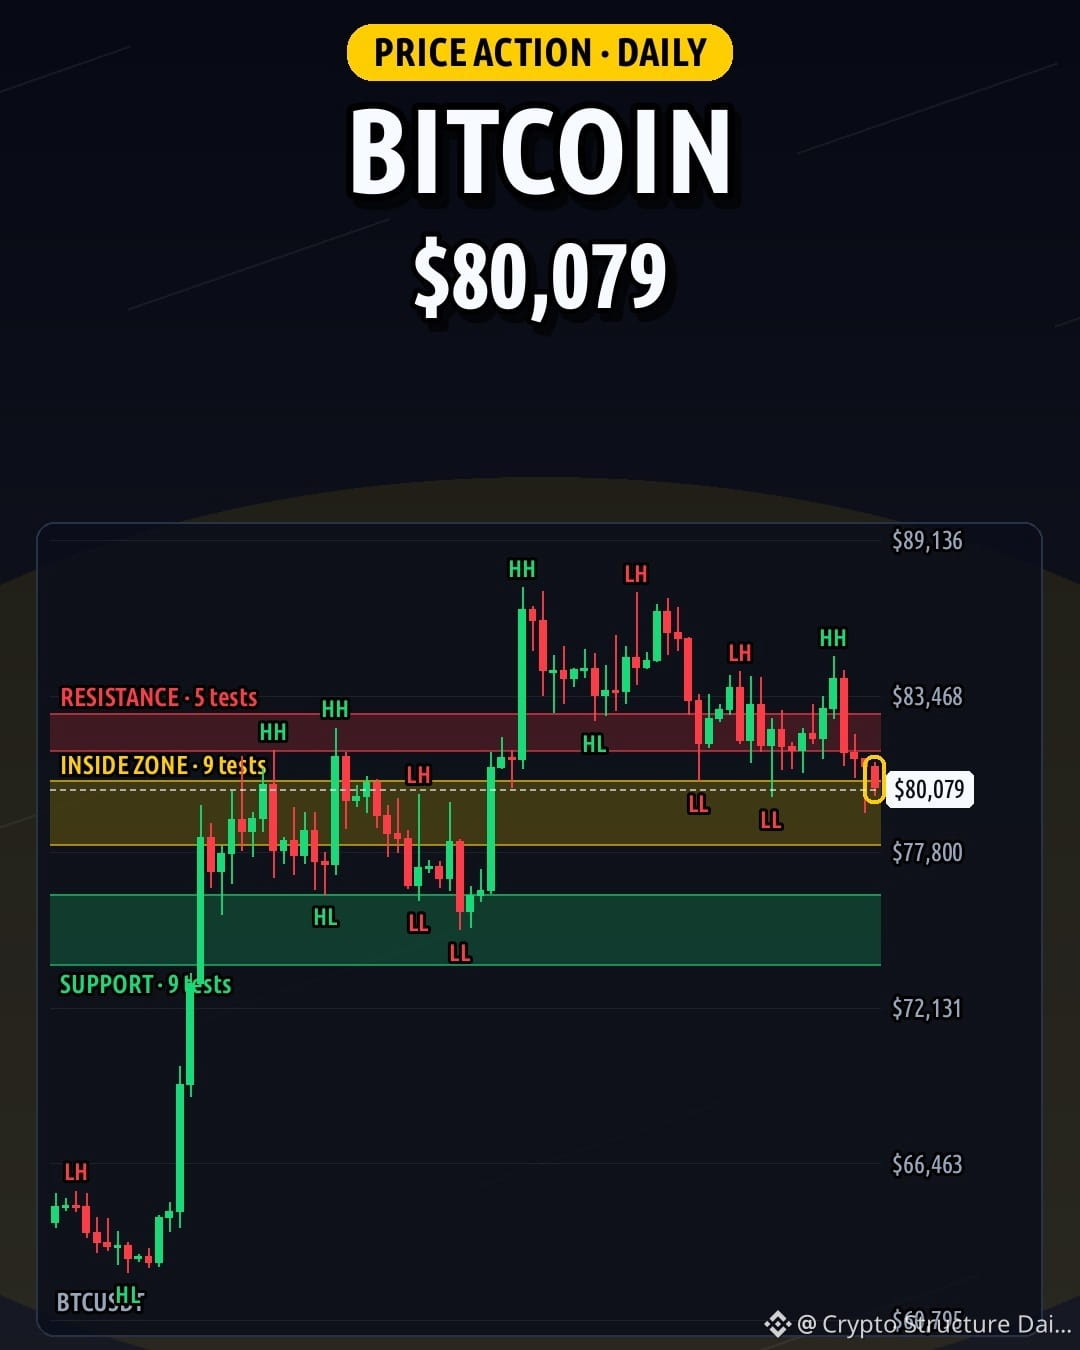
$BTC trading at 80,079 with an inside bar daily candle. 4H shows lower highs/lows and 1.5x average volume pressing resistance at 80,880 (8 tests).
Weekly has higher highs/lows (swing 74,968, support 73,482 [5 tests], resistance 88,326 [3 tests]). Daily sits in a range with support at 74,994 (9 tests) and resistance at 82,164 (5 tests).
If the daily closes above 82,850, structure strengthens. Lose 78,080 and 74,994 is in play.
Range bound or ready to break? 📊
NFA #BTC #PriceAction
80
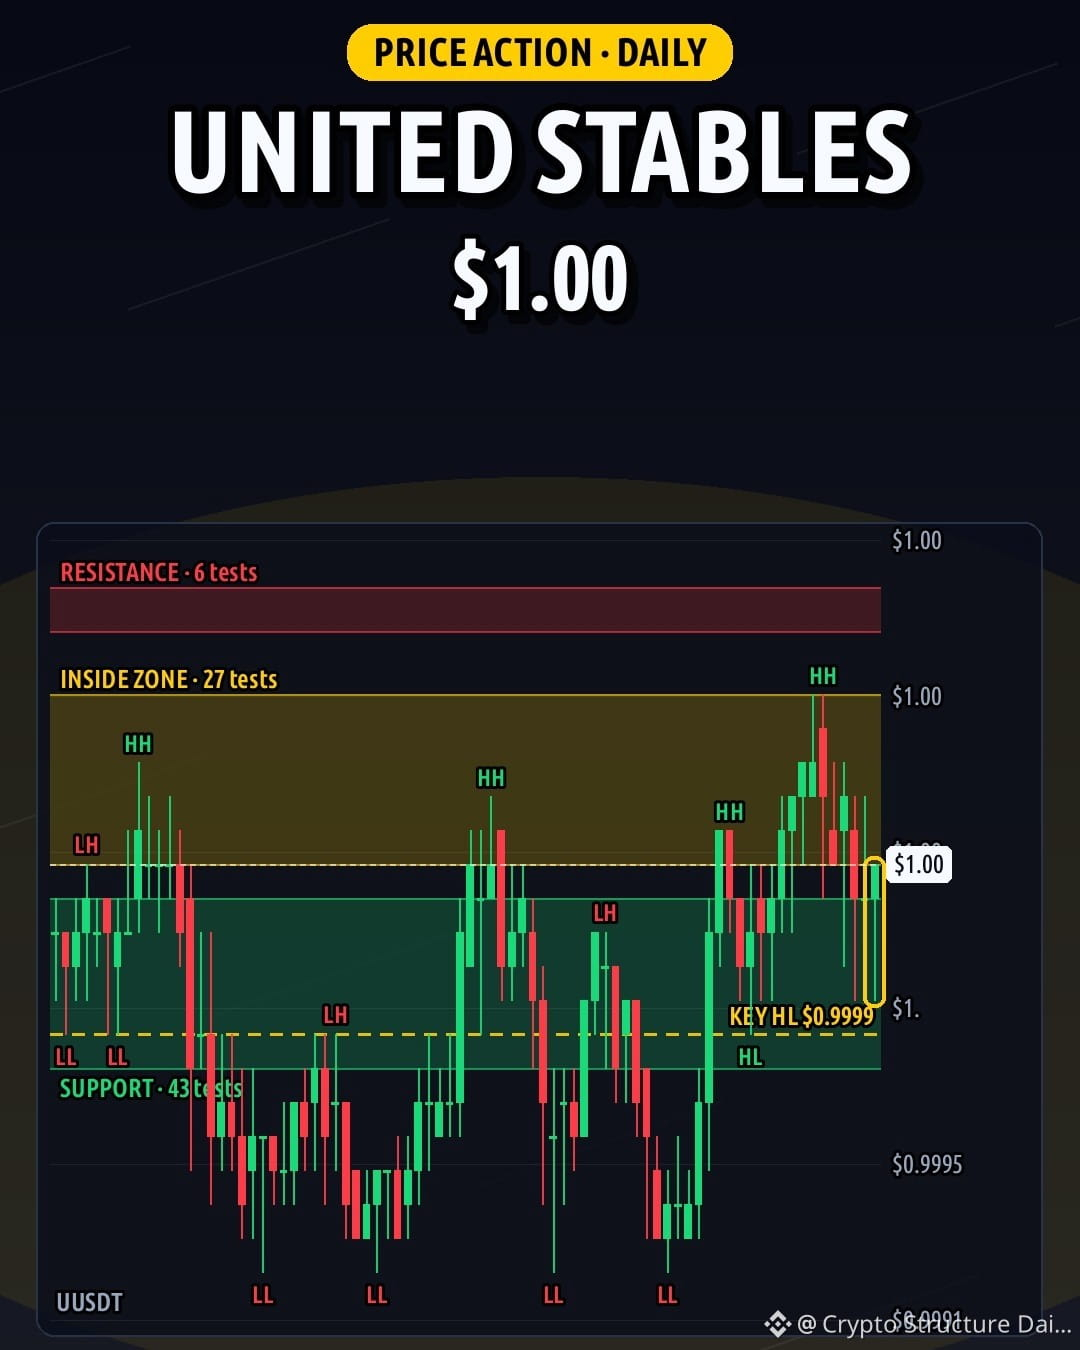
Trading at 1.00, $U prints a daily hammer while weekly structure just broke up. 📊
Daily shows higher highs/lows (key swing 0.9999, support 1.00 [43 tests], resistance 1.00 [6 tests]). 4H shows lower highs/lows (support 1.00 [20 tests], resistance 1.00 [6 tests]). Weekly shows a range with no clear trend (support 0.9992 [6 tests], resistance 1.00 [3 tests], swing 1.00).
If the daily closes above 1.00, next zone is 1.00; lose 0.9992 and lower range is in play.
Breakout or fakeout? NFA #U #PriceAction #CryptoAnalysis
79
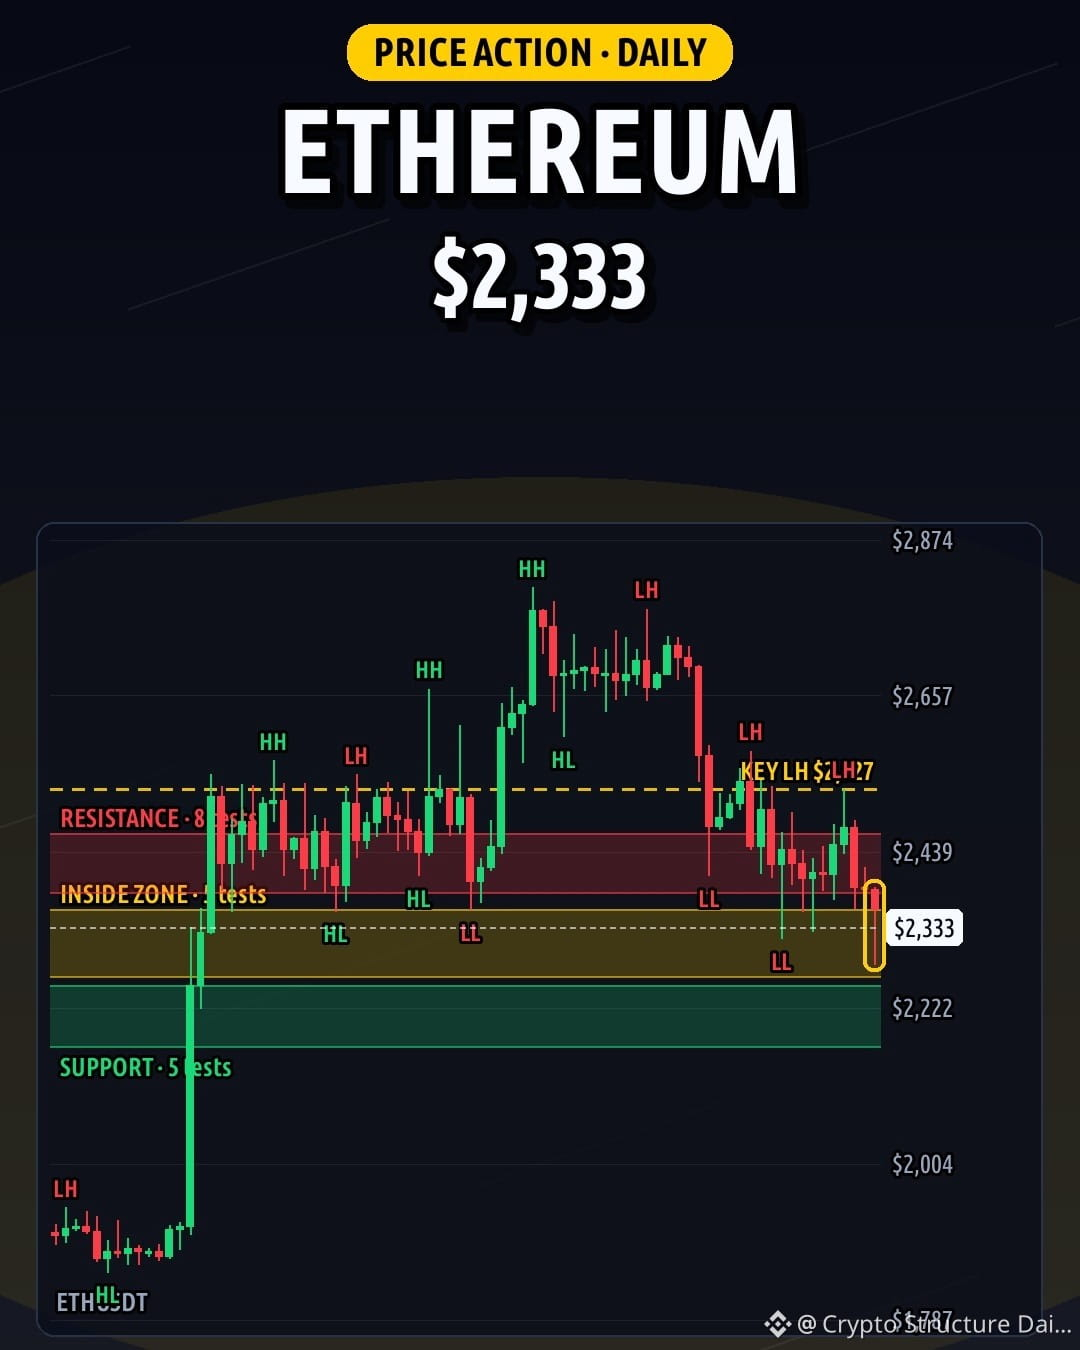
Double hammers printed on the daily and 4H as $ETH trades at 2,333. 📊
Weekly is a range with no clear trend (support 2,142 [5 tests], resistance 2,843 [6 tests]). Daily and 4H show lower highs/lows (daily key swing 2,527, resistance 2,424 [8 tests]; 4H key swing 2,418, resistance 2,362 [6 tests]).
Daily close above 2,465 → next zone 2,563 | daily close below 2,266 → next zone 2,210.
Which side holds? NFA #ETH #PriceAction #CryptoAnalysis
114
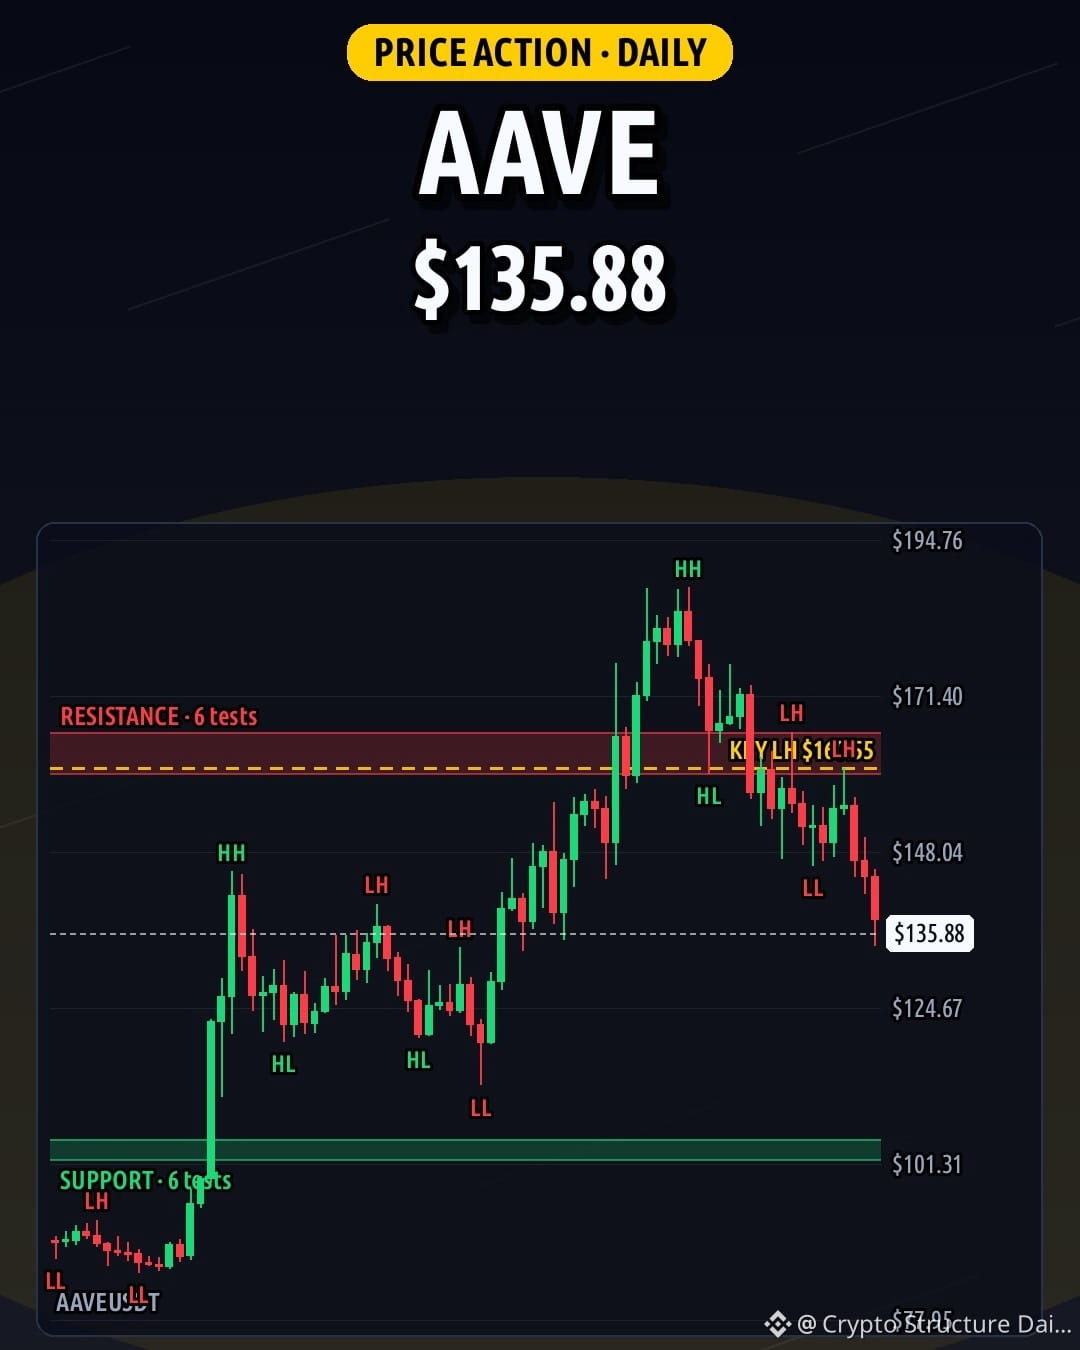
Bearish engulfing on the 4H leaves $AAVE trading at 135.88 right above support at 133.06 (6 tests). 📊
Weekly structure is higher highs/lows (swing 113.19, support 116.80 [4 tests], resistance 146.20 [4 tests]). Daily and 4H show lower highs/lows (daily swing 160.55, support 103.46 [6 tests], resistance 162.91 [6 tests]; 4H swing 150.17, resistance 146.69 [5 tests]).
If the daily closes above 165.98, structure strengthens. Lose 101.94 and next zone 99.29 is in play.
Holding or folding here? NFA
#AAVE #PriceAction #CryptoAnalysis
139
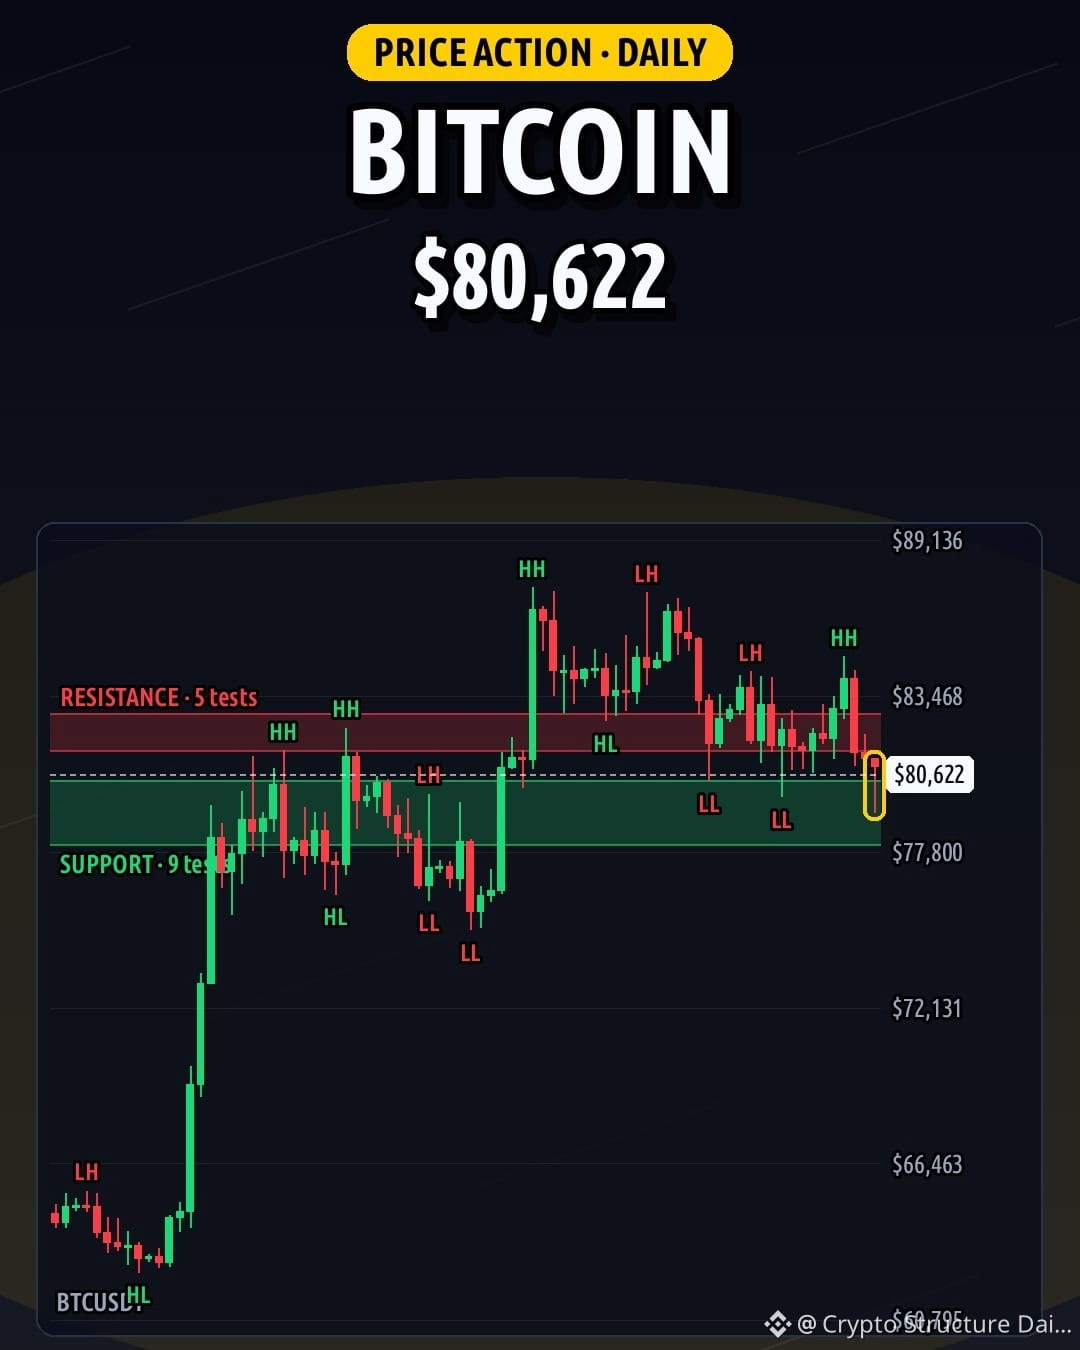
Hammer printed on the daily as $BTC trades at 80,622. 📊
4H shows lower highs/lows with an inverted hammer below resistance at 82,293 (5 tests). Weekly shows higher highs/lows (swing 74,968, support 73,482 [5 tests], resistance 88,326 [3 tests]), and daily is ranging (support 79,237 [9 tests], resistance 82,164 [5 tests]).
Daily close above 82,850 → structure strengthens. Daily close below 78,080 → next zone 74,994.
Waiting for direction. NFA
#BTC #PriceAction #CryptoAnalysis
84
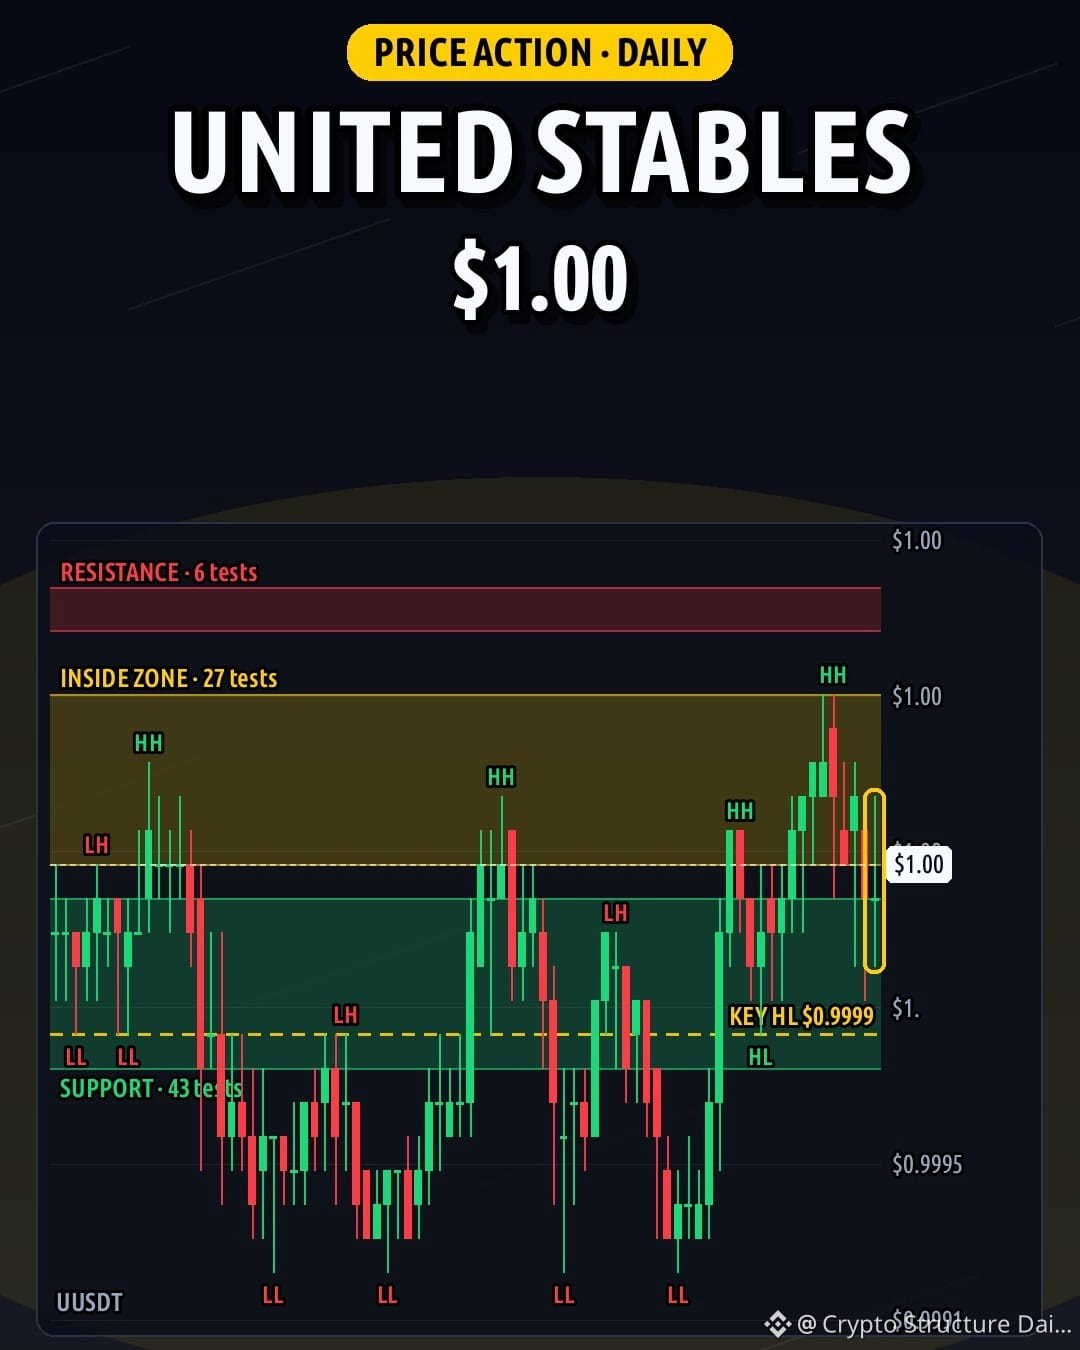
Printing an inverted hammer on 2.1x average volume, $U tests resistance at 1.00 (6 tests) as weekly structure just broke up. 📊
Weekly is a range with key swing 1.00 and support 0.9992 (6 tests). Daily shows higher highs/lows with support 1.00 (43 tests) and swing 0.9999. 4H is a range with support 1.00 (34 tests).
If the daily closes above 1.00, next zone is 1.00. Lose 0.9992 and lower tests are in play.
Can bulls clear this wall?
NFA #U #PriceAction #CryptoAnalysis
94
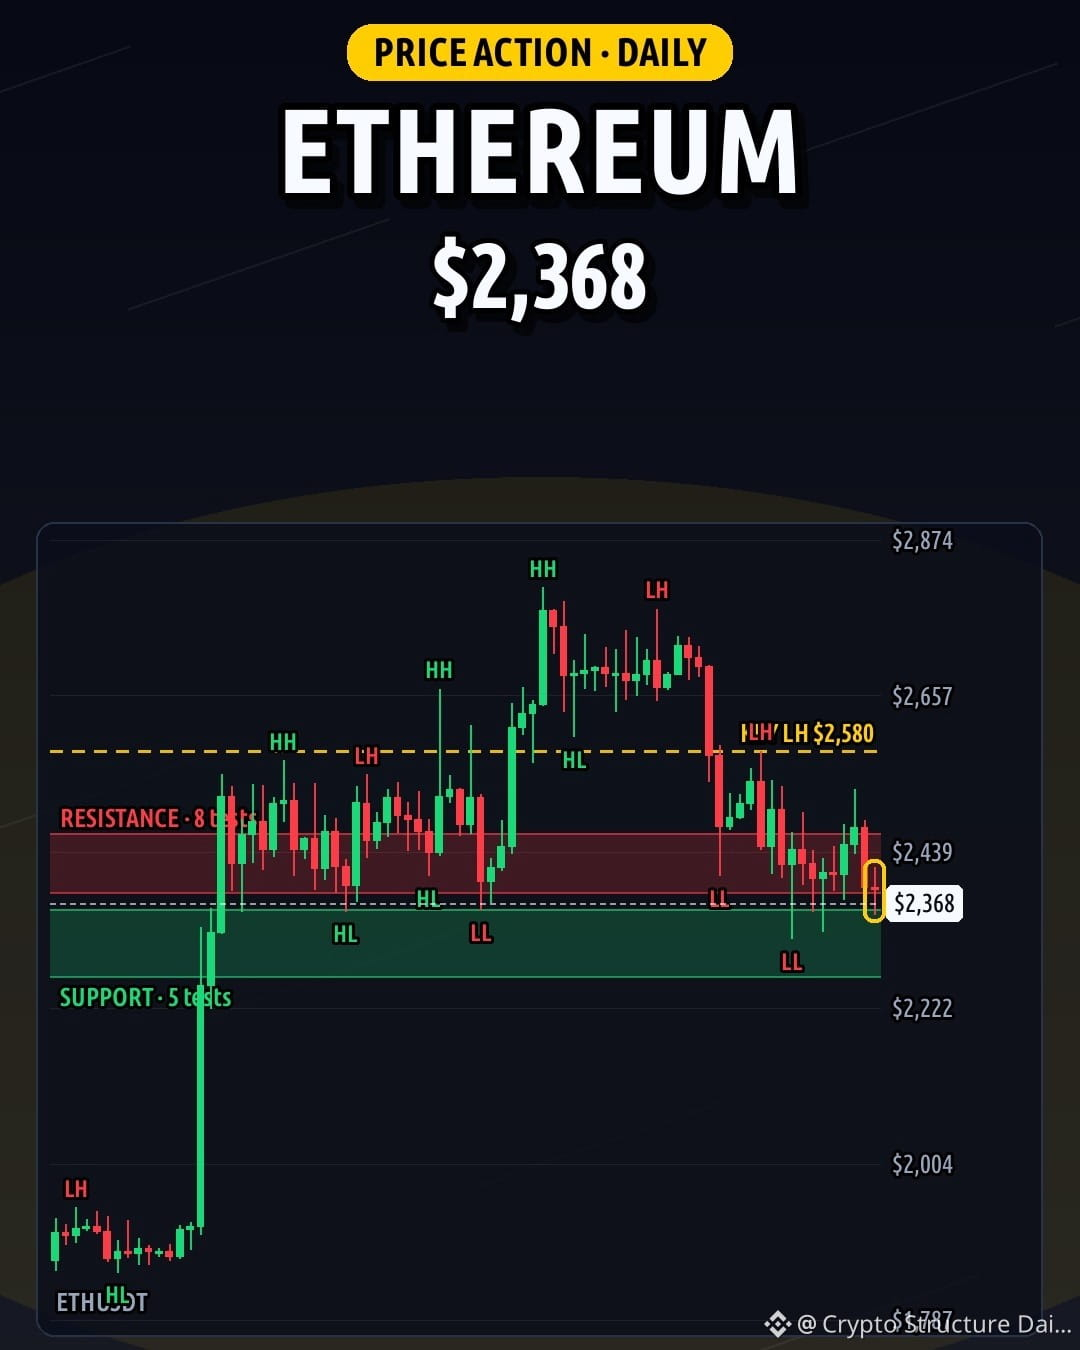
Hovering at 2,368, $ETH prints a daily doji below 4H resistance at 2,406 (5 tests). 📊
Daily and 4H show lower highs/lows (daily resistance 2,424 [8 tests], support 2,312 [5 tests]; key swing level 2,580). Weekly is a range with no clear trend (support 2,142 [5 tests], resistance 2,843 [6 tests]).
If the daily closes above 2,465 → next zone 2,599. Daily close below 2,266 → next zone 2,210.
Watching this range closely. NFA #ETH #PriceAction #CryptoAnalysis
50
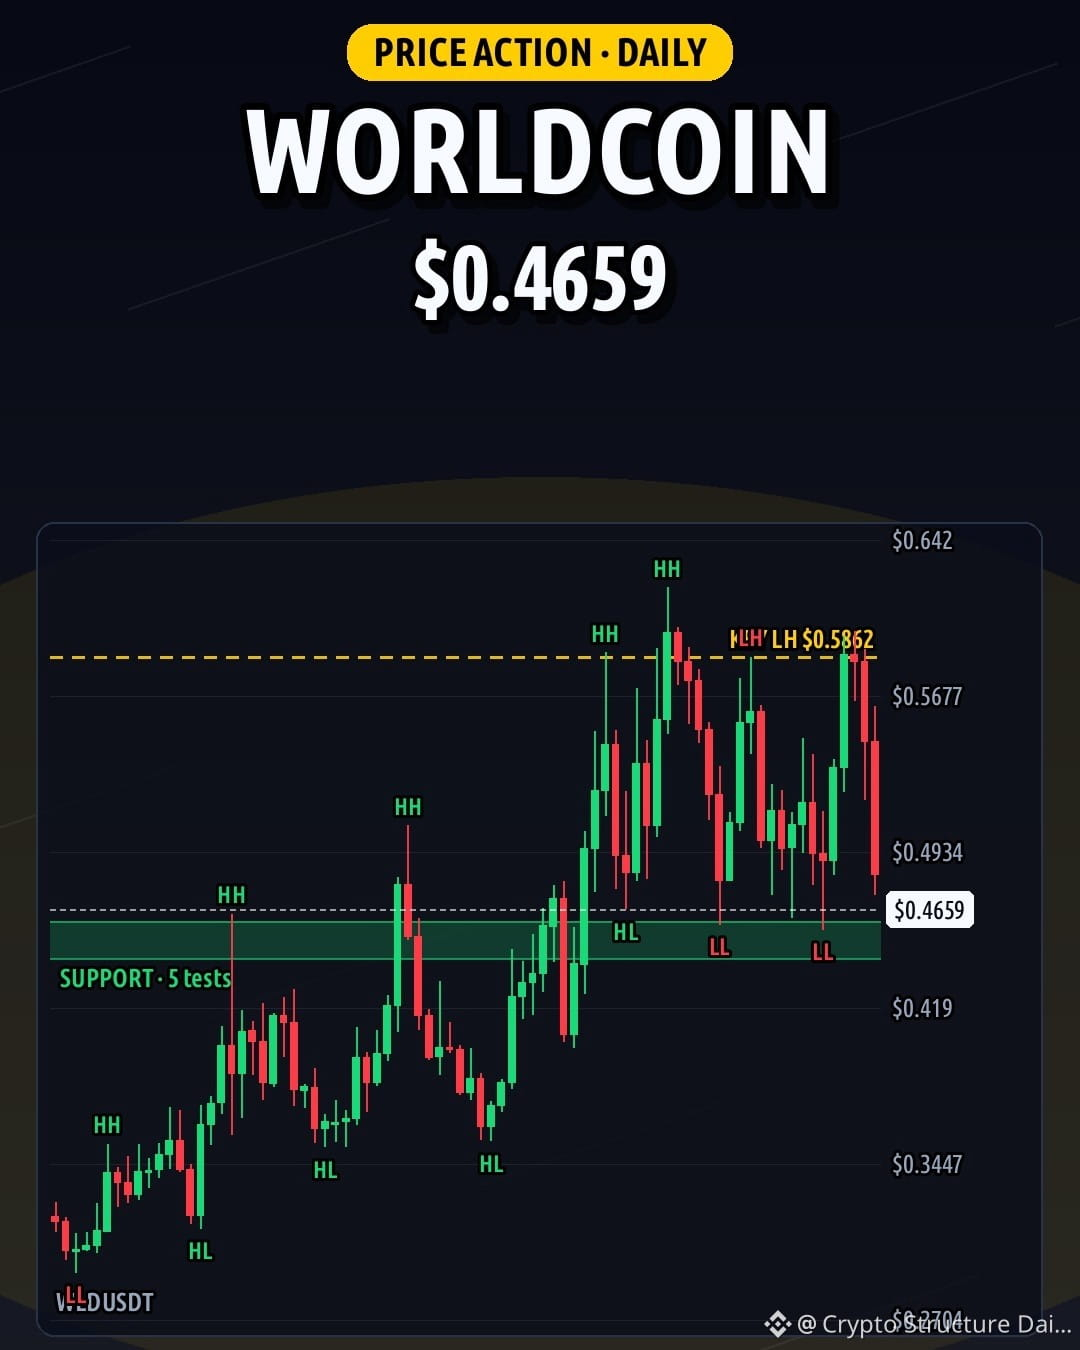
Drifting at 0.4659, $WLD 4H structure just broke down below resistance at 0.4735 (7 tests). 📊
Weekly is a range with no clear trend and resistance at 0.6582 (2 tests). Daily shows lower highs and lower lows with support at 0.4515 (5 tests). 4H is a range with support at 0.4545 (5 tests).
If the daily closes below 0.4427, the next zone at 0.4324 is in play.
What's your plan for this breakdown? NFA #WLD #PriceAction #CryptoAnalysis
234
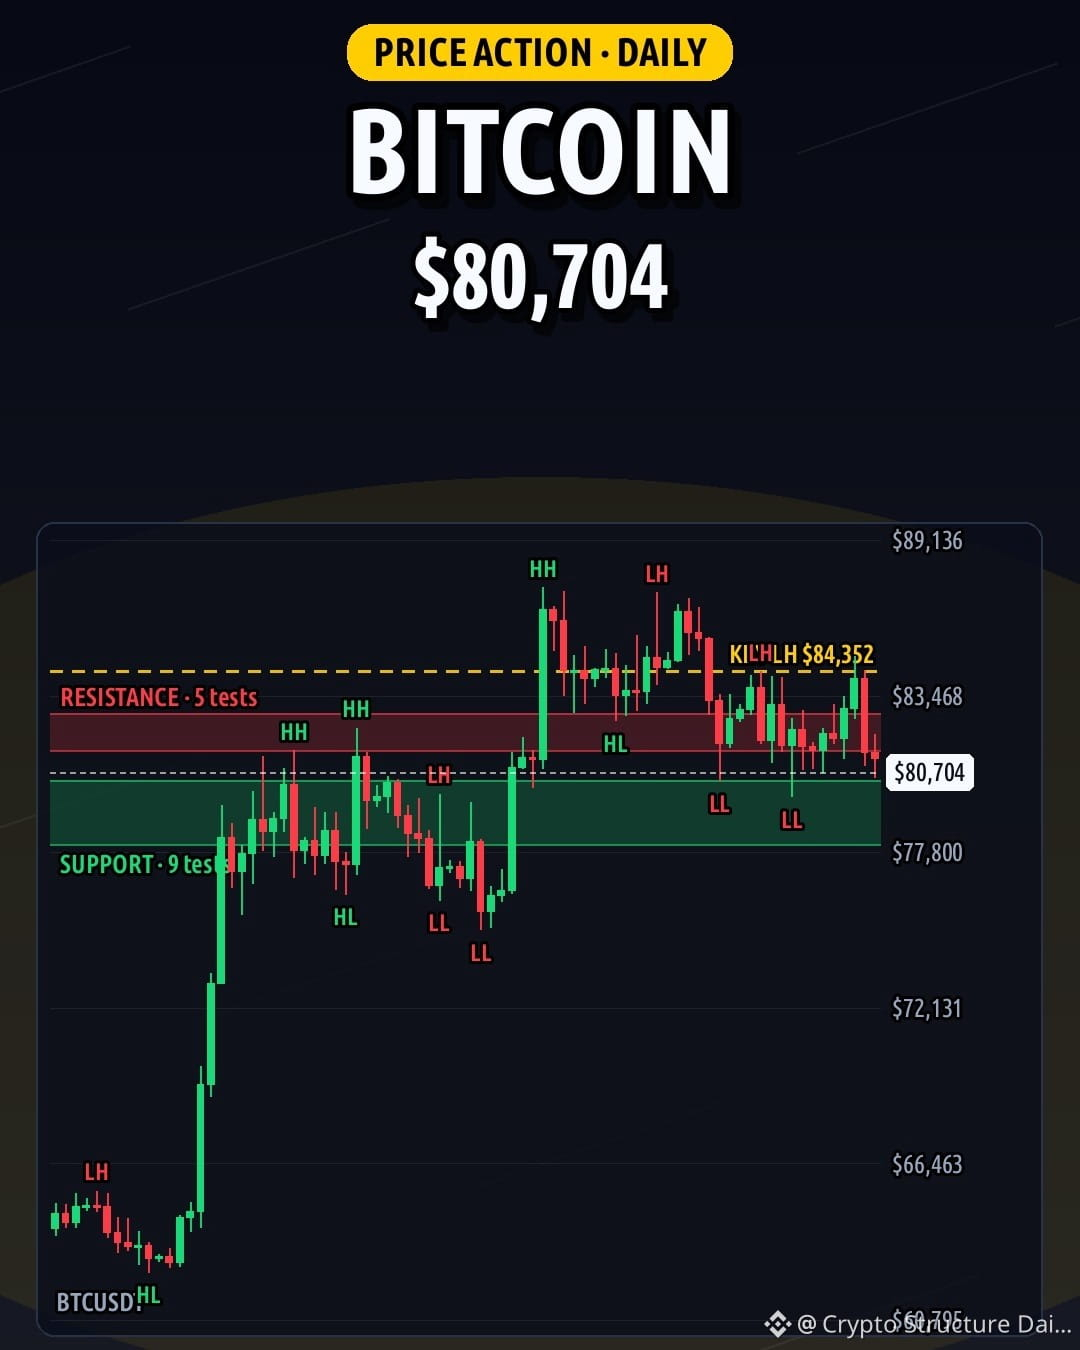
Squeezing at 80,704, $BTC prints a 4H inside bar below resistance at 82,413 (7 tests). 📊
Weekly shows higher highs/lows (swing 74,968, support 73,482 [5 tests], resistance 88,326 [3 tests]). Daily is lower highs/lows (swing 84,352, support 79,237 [9 tests], resistance 82,164 [5 tests]). 4H has lower highs/lows (swing 82,061, support 79,680 [6 tests]).
Daily close above 82,850 → structure strengthens. Daily close below 78,080 → next zone 76,444.
Which side breaks first?
NFA
#BTC #PriceAction #CryptoAnalysis
91
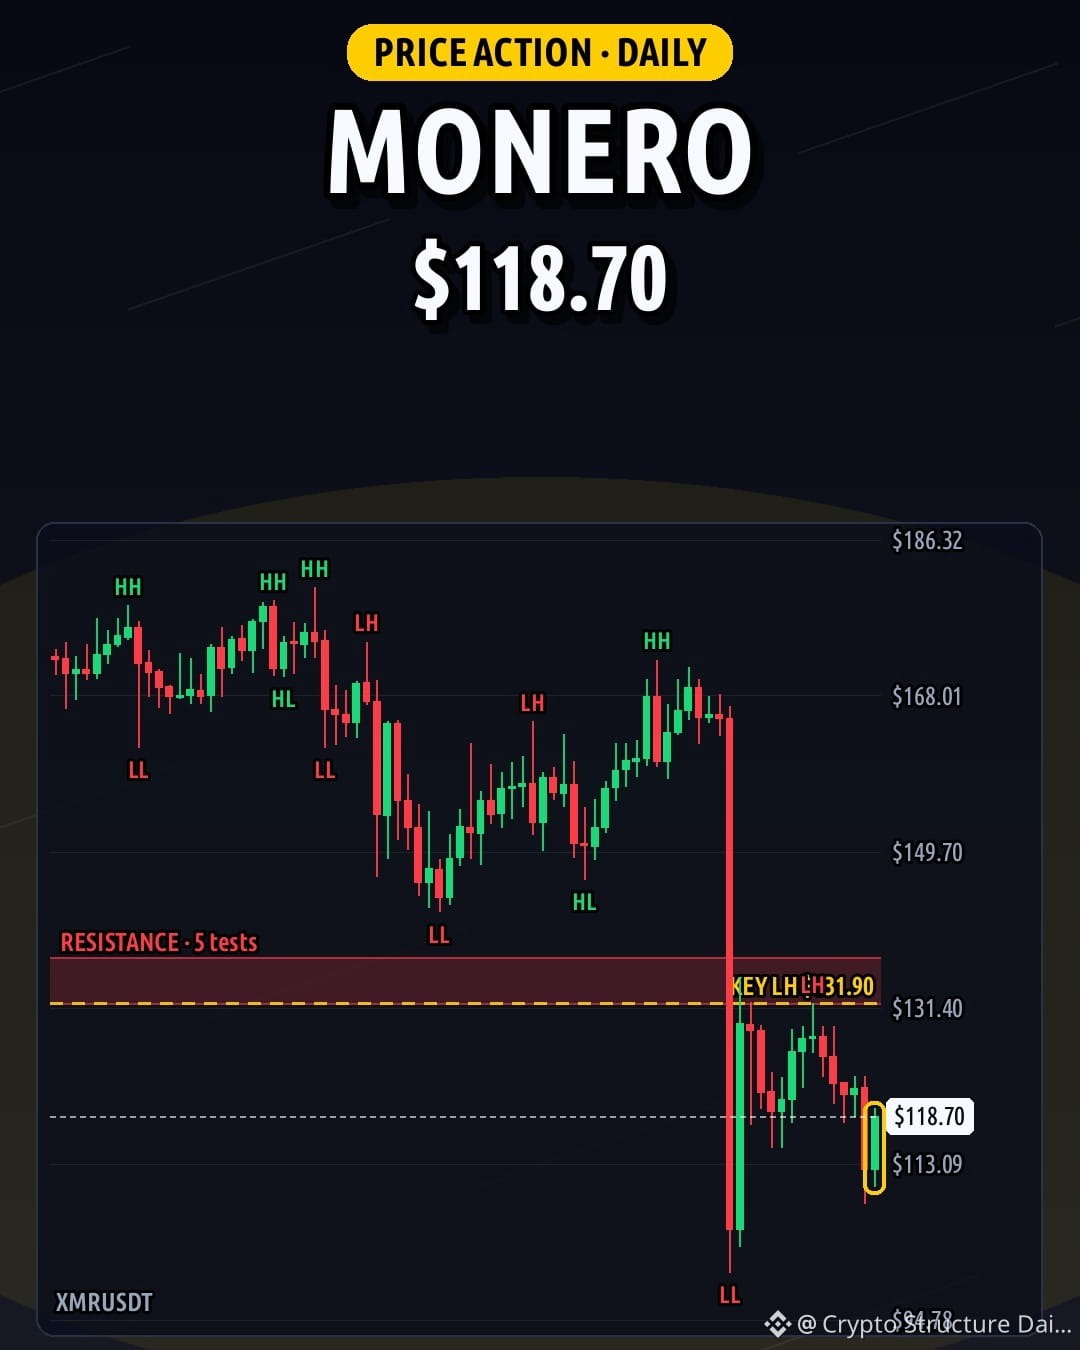
Compression at 118.70 as $XMR prints a daily inside bar. 📉
Weekly & daily structures show lower highs/lows (weekly support 98.55 [5 tests], resistance 134.80 [4 tests]; daily resistance 134.60 [5 tests]). 4H holds lower highs/lows under the 123.40 key swing.
If the daily closes above 137.30, next zone is 147.25. Lose weekly support at 98.55 and deeper downside is in play.
Patient waiting here. NFA #XMR #PriceAction #CryptoAnalysis
90
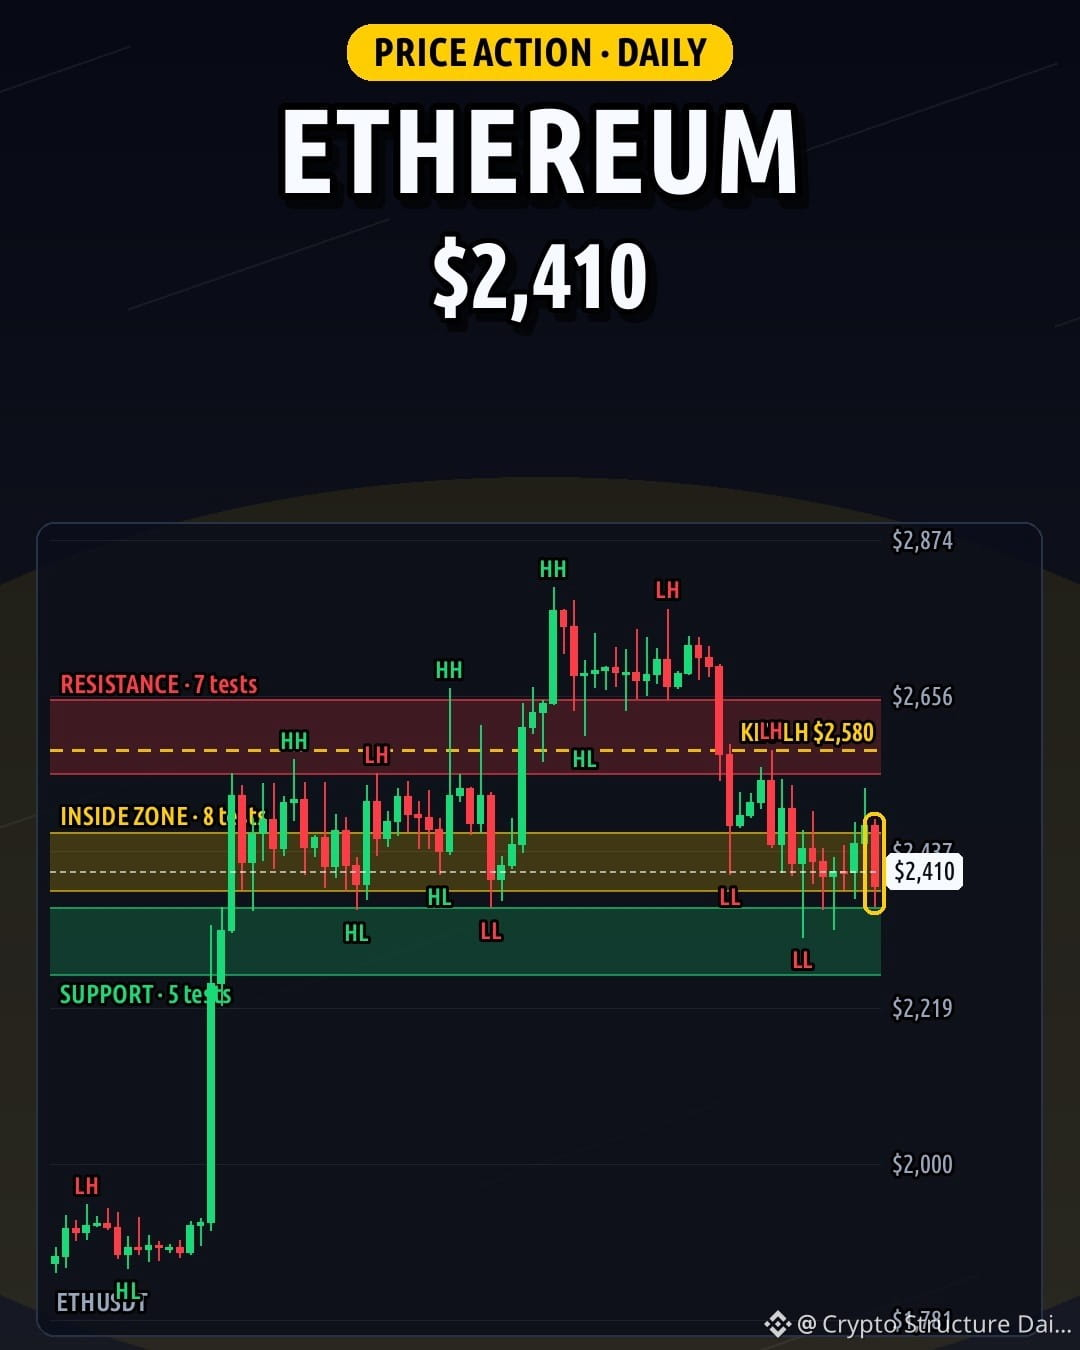
Chopping at 2,410, $ETH prints a 4H doji below resistance at 2,449 (9 tests). 📊
Weekly is a range, support 2,142 (5 tests), resistance 2,843 (6 tests). Daily shows lower highs/lows, swing 2,580, support 2,312 (5 tests), resistance 2,599 (7 tests), bearish engulfing. 4H is a range, support 2,365 (5 tests).
Daily close above 2,651 means structure strengthens; close below 2,383 puts next zone 2,312 in play.
Range bound for now. NFA
#ETH #PriceAction #CryptoAnalysis
42
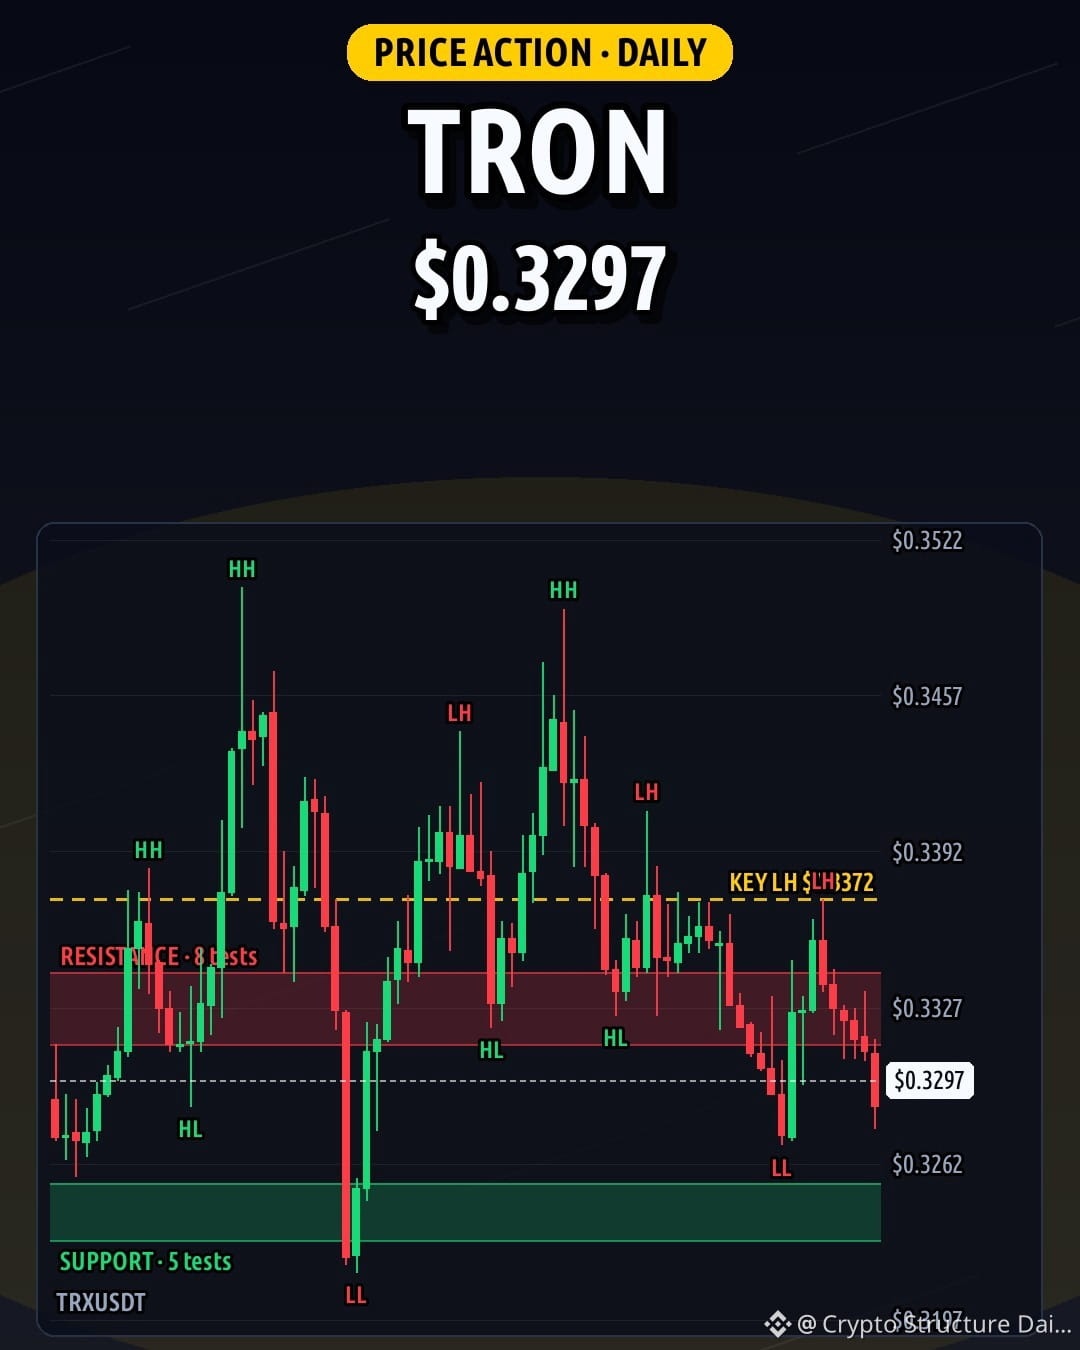
Right at 0.3297, $TRX is testing 4H resistance at 0.3304 (9 tests). 📊
Weekly is a range, support 0.3228 (3 tests), resistance 0.3488 (3 tests). Daily shows lower highs/lows, key swing level 0.3372, support 0.3242 (5 tests), resistance 0.3327 (8 tests).
Daily close above 0.3342 -> next zone 0.3382 | daily close below 0.323 -> next zone 0.32.
Patience here. NFA
#TRX #PriceAction
59
Войдите, чтобы посмотреть больше материала
Присоединяйтесь к пользователям криптовалют по всему миру на Binance Square
⚡️ Получайте новейшую и полезную информацию о криптоактивах.
💬 Нам доверяет крупнейшая в мире криптобиржа.
👍 Получите достоверные аналитические данные от верифицированных создателей контента.
Эл. почта/номер телефона