

#candlestick
candlestick
Просмотров: 932,409
764 обсуждают
Популярные
Новые
Статья
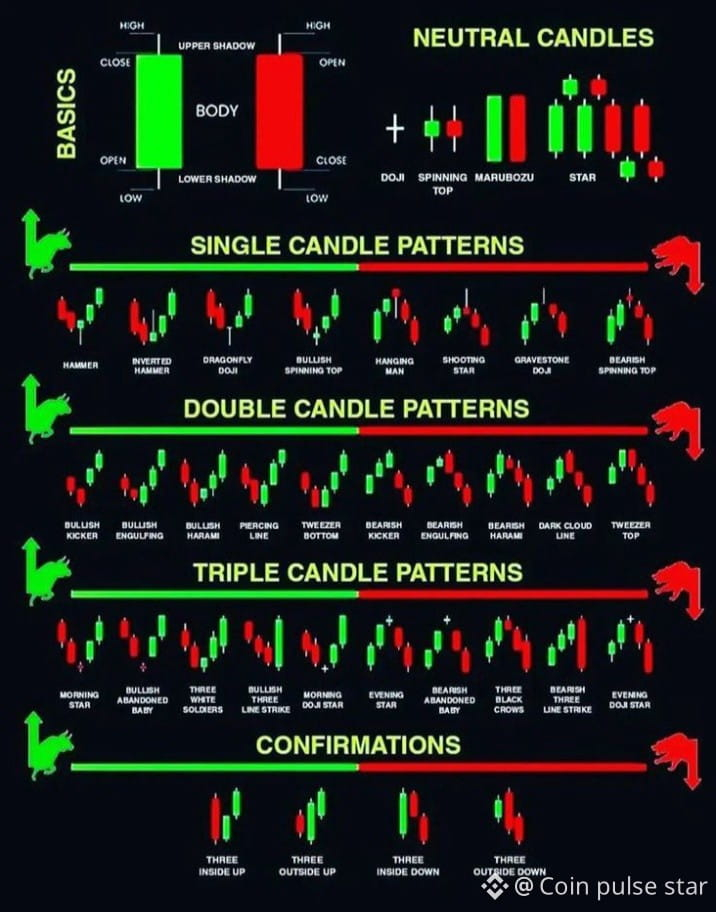
📊 The Ultimate Candlestick Patterns Guide: 35+ Patterns Every Crypto Trader Must Know🫵💯By DOCTOR_SIGNaLs | Crypto Education • Technical Analysis • Trading Psychology
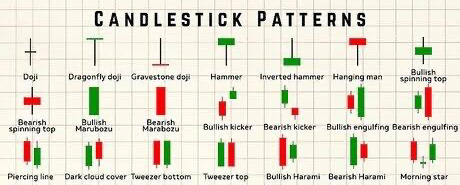
Want to understand what candlesticks are telling you about the market? This guide explains all 37 patterns shown in the reference chart, what they can indicate, where they are most useful, and how crypto traders can confirm potential setups.
Remember: A pattern is a trading clue, not a guaranteed prediction. Context matters more than the shape alone.
🟢 PART 1: SINGLE-CANDLE PATTERNS
1. Doji
A Doji forms when the opening and closing prices are nearly equal. It reflects indecision between buyers and sellers.
Possible signal: A pause or potential reversal, especially after a strong move.
Trading tip: Wait for the next candle to confirm direction. A Doji alone is not automatically bullish or bearish.
2. Dragonfly Doji
This candle has a long lower shadow, with the open, close, and high near the same level.
Possible signal: Buyers rejected lower prices, potentially indicating bullish pressure after a decline.
Confirmation: Look for a bullish follow-through candle or a break above nearby resistance.
3. Gravestone Doji
This candle has a long upper shadow, with the open, close, and low near the same level.
Possible signal: Buyers pushed prices higher, but sellers forced the price back down. It may warn of bearish pressure after an uptrend.
Confirmation: Watch for a bearish candle or a break below nearby support.
4. Hammer
A Hammer has a small real body near the top and a long lower shadow. It commonly appears after a decline.
Possible signal: Sellers pushed the price lower, but buyers recovered much of the move.
Confirmation: A bullish candle following the Hammer can strengthen the reversal idea.
5. Inverted Hammer
An Inverted Hammer has a small body near the bottom and a long upper shadow. It may appear after a downtrend.
Possible signal: Buyers attempted to push the price higher. This may be an early sign of a potential bullish reversal.
Confirmation: Look for a strong bullish candle afterward. The upper shadow alone does not prove that buyers are in control.
6. Hanging Man
The Hanging Man resembles a Hammer but appears after an uptrend.
Possible signal: Selling pressure emerged during the session, potentially warning that the uptrend is weakening.
Confirmation: A bearish follow-through candle or a break below support makes the warning more meaningful.
7. Bullish Spinning Top
A Spinning Top has a small real body and shadows on both sides. When it appears after a decline, it may indicate that selling momentum is weakening.
Possible signal: Market indecision and a possible change in momentum.
Confirmation: Wait for a bullish breakout or follow-through candle.
8. Bearish Spinning Top
This candle also has a small body and shadows on both sides, but it appears after an advance.
Possible signal: Buyers may be losing momentum, although the candle itself is neutral.
Confirmation: Look for bearish follow-through or a break below support.
🔴 PART 2: STRONG CANDLE & TWO-CANDLE PATTERNS
9. Bullish Marubozu
A bullish Marubozu is a large bullish candle with little or no shadow.
Possible signal: Buyers controlled most or all of the candle’s trading range.
Trading tip: A breakout above resistance with strong volume can add confirmation. Avoid chasing a candle that has already moved too far.
10. Bearish Marubozu
A bearish Marubozu is a large bearish candle with little or no shadow.
Possible signal: Sellers controlled the session and may be driving downward momentum.
Trading tip: Check whether support has broken and whether the move is supported by volume.
11. Bullish Kicker
A Bullish Kicker is a sharp shift from bearish to bullish price action, traditionally involving a gap between candles.
Possible signal: A sudden change in sentiment in favor of buyers.
Confirmation: Look for strong bullish follow-through. Classic gaps are less common in continuously traded crypto markets, so not every sharp reversal qualifies as a textbook Kicker.
12. Bearish Kicker
A Bearish Kicker is a sharp shift from bullish to bearish price action, traditionally accompanied by a gap.
Possible signal: A sudden change in sentiment in favor of sellers.
Confirmation: Watch for continued selling and a break below support.
13. Bullish Engulfing
A small bearish candle is followed by a bullish candle whose real body engulfs the previous real body.
Possible signal: Buyers have overcome the previous candle’s selling pressure.
Best context: After a decline or near a meaningful support zone.
Confirmation: A close above nearby resistance can strengthen the setup.
14. Bearish Engulfing
A small bullish candle is followed by a bearish candle whose real body engulfs the previous real body.
Possible signal: Sellers have overwhelmed the previous candle’s buying pressure.
Best context: After an uptrend or near resistance.
Confirmation: Look for a support break or continued bearish price action.
15. Piercing Line
This bullish two-candle pattern occurs after a decline. A bearish candle is followed by a bullish candle that closes above the midpoint of the previous candle’s real body, while generally remaining below its open.
Possible signal: Buyers are recovering ground and a bullish reversal may be developing.
Confirmation: A break above nearby resistance adds strength.
16. Dark Cloud Cover
This bearish pattern appears after an advance. A bullish candle is followed by a bearish candle that closes below the midpoint of the previous candle’s real body, while generally opening above the previous close.
Possible signal: Sellers are gaining control after an upward move.
Confirmation: Look for bearish follow-through or a support break.
17. Tweezer Bottom
Two candles form lows around approximately the same price level following a decline.
Possible signal: The market may be rejecting a support zone.
Confirmation: A bullish candle or breakout above the pattern’s short-term high can help confirm the idea.
18. Tweezer Top
Two candles form highs around approximately the same price level after an advance.
Possible signal: Resistance may be holding, and a bearish reversal could develop.
Confirmation: Look for a bearish follow-through candle or a break below short-term support.
19. Bullish Harami
A large bearish candle is followed by a smaller candle whose real body fits inside the previous bearish real body.
Possible signal: Selling momentum may be slowing.
Confirmation: A bullish breakout above the smaller candle’s high can improve confidence.
20. Bearish Harami
A large bullish candle is followed by a smaller candle whose real body fits inside the previous bullish real body.
Possible signal: Buying momentum may be weakening.
Confirmation: A bearish break below the smaller candle’s low can strengthen the bearish interpretation.
21. Morning Star
This three-candle bullish reversal pattern usually consists of a large bearish candle, a small-bodied candle showing indecision, and a strong bullish candle that closes well into the first candle’s body.
Possible signal: Selling pressure may be giving way to buying pressure.
Best context: After a sustained decline, especially near support.
Confirmation: Look for follow-through above the third candle’s high.
🟢 PART 3: MULTI-CANDLE REVERSAL & CONTINUATION PATTERNS
22. Bullish Abandoned Baby
This rare three-candle bullish reversal pattern consists of a bearish candle, a Doji separated by a gap, and a bullish candle separated from the Doji by another gap.
Possible signal: A sharp shift from selling to buying pressure.
Important: True gaps are essential to the traditional pattern and are relatively uncommon in 24/7 crypto markets.
23. Bearish Abandoned Baby
This rare bearish reversal pattern consists of a bullish candle, a separated Doji, and a bearish candle separated from the Doji by another gap.
Possible signal: A potential shift from buying pressure to selling pressure.
Confirmation: Look for bearish follow-through and a break below support.
24. Three White Soldiers
Three consecutive strong bullish candles typically appear after a decline. Each candle generally closes higher than the previous one, with openings inside or near the preceding real body.
Possible signal: Buyers are building sustained momentum.
Caution: If the pattern appears after an already extended rally, the market may be overbought or due for a pullback.
25. Three Black Crows
Three consecutive strong bearish candles typically appear after an advance. Each generally closes lower than the previous one.
Possible signal: Sellers are building sustained momentum.
Confirmation: A break below support may support the bearish continuation or reversal idea.
26. Three Line Strike
In a common bullish interpretation, three bearish candles are followed by a large bullish candle that reverses the preceding three-candle move. The bearish version is the opposite: three bullish candles followed by a large bearish candle.
Possible signal: A sharp counter-move that may indicate continuation of the earlier trend in some traditional interpretations.
Important: Three Line Strike has different interpretations across trading references. Check the direction of the preceding trend and wait for confirmation rather than treating the pattern as an automatic reversal.
27. Three Inside Up
This bullish three-candle pattern begins with a large bearish candle, followed by a smaller bullish candle contained within its real body, and then a bullish candle that closes above the first candle’s open.
Possible signal: Selling momentum may be turning into buying momentum.
Confirmation: A break above the first candle’s high offers additional evidence.
28. Three Inside Down
This bearish pattern begins with a large bullish candle, followed by a smaller bearish candle contained within its real body, and then a bearish candle that closes below the first candle’s open.
Possible signal: Buying momentum may be turning into selling momentum.
Confirmation: Watch for a break below the first candle’s low.
29. Three Outside Up
This bullish pattern starts with a bearish candle, followed by a bullish Engulfing candle, and then another bullish candle that confirms the reversal.
Possible signal: Buyers may be taking control after a decline.
Confirmation: A sustained move above nearby resistance can support the setup.
30. Three Outside Down
This bearish pattern starts with a bullish candle, followed by a bearish Engulfing candle, and then another bearish candle confirming the move.
Possible signal: Sellers may be taking control after an advance.
Confirmation: Look for continued weakness and a break below support.
📈 PART 4: CHART PATTERNS
These formations use multiple candles and price swings rather than a single candle shape.
31. Cup and Handle
The Cup and Handle is a bullish continuation pattern in many technical-analysis approaches. Price forms a rounded, cup-like recovery, then consolidates in a smaller handle before potentially breaking above resistance.
Possible signal: A bullish breakout if price clears the cup’s resistance area.
Trading approach: Wait for a confirmed breakout; some traders also look for a successful retest of resistance.
Risk: Failed breakouts can reverse quickly.
32. Double Top
A Double Top forms when price tests a similar resistance level twice and fails to break through.
Possible signal: Potential bearish reversal, particularly after an uptrend.
Confirmation: The traditional confirmation is a break below the neckline—the support level between the two peaks.
Risk management: Resistance alone is not confirmation; price may still break upward.
33. Double Bottom
A Double Bottom forms when price tests a similar support level twice and rebounds
Possible signal: Potential bullish reversal after a decline.
Confirmation: Traders commonly watch for a break above the neckline, the resistance between the two lows.
Risk management: If support breaks decisively, the bullish setup may fail.
34. Wedge
A Wedge forms when price swings converge between two sloping trendlines.
Rising wedge: Often considered bearish, especially if it develops after an advance.Falling wedge: Often considered bullish, especially after a decline.
Confirmation: Wait for a breakout from the wedge and assess whether volume and subsequent candles support the move. Wedges do not always break in the expected direction.
35. Flag
A Flag forms when a strong price move is followed by a short consolidation, often inside a small channel.
Bullish flag: A strong upward move followed by a pause or pullback.Bearish flag: A strong downward move followed by a pause or rebound.Possible signal: Continuation in the direction of the initial move.
Confirmation: Watch for a breakout from the flag in the direction of the preceding trend.
36. Rising Window
A Rising Window is a bullish gap between one candle’s high and the next candle’s low.
Possible signal: Strong upward momentum, sometimes acting as a support zone.
Crypto note: Since crypto trades continuously, textbook gaps are less common than in markets with fixed opening hours. Low-liquidity periods or exchange-specific charts can still show gaps.
37. Falling Window
A Falling Window is a bearish gap between one candle’s low and the next candle’s high.
Possible signal: Strong downward momentum, sometimes acting as resistance.
Confirmation: Watch whether price continues lower or retraces into the gap. A gap is not a guarantee of further decline.
🧠 HOW TO USE THESE PATTERNS IN CRYPTO TRADING
1. Identify the trend first.
A Hammer after a decline has a different meaning from a similar candle in the middle of a sideways market.
2. Mark support and resistance.
Patterns near important levels are often more informative than patterns appearing randomly on a chart.
3. Wait for confirmation.
A candle close, breakout, retest, or follow-through move may help distinguish a real setup from market noise.
4. Use volume and timeframe context.
Volume can help assess participation, while higher-timeframe levels may matter more than small patterns on very short charts.
5. Plan your invalidation level.
Decide in advance where the trade idea would no longer make sense. A stop-loss can help manage risk, although slippage and fast markets can affect execution.
6. Protect your capital.
Avoid risking money you cannot afford to lose. High leverage magnifies both gains and losses, and liquidation can occur quickly.
🔍 FINAL TAKEAWAY
Candlestick and chart patterns help traders organize price information and develop trading hypotheses. They are most useful when combined with trend analysis, support and resistance, confirmation, and disciplined risk management.
No pattern guarantees a profit. Test your strategy on historical data and a demo account before risking real capital.
DOCTOR_SIGNaLs — Learn the Pattern. Confirm the Setup. Manage the Risk.
Educational content only. This article is not financial advice or a guarantee of trading results. Cryptocurrency trading, especially leveraged futures, carries substantial risk.
#DOCTOR_SIGNaLs #CanMicrosoftDeliverOnAI #FOMCWatch #EarningsSeason #Candlestick
📊 The Ultimate Candlestick Patterns Guide: 35+ Patterns Every Crypto Trader Must Know🫵💯
By DOCTOR_SIGNaLs | Crypto Education • Technical Analysis • Trading Psychology
Want to understand what candlesticks are telling you about the market? This guide explains all 37 patterns shown in the reference chart, what they can indicate, where they are most useful, and how crypto traders can confirm potential setups.
Remember: A pattern is a trading clue, not a guaranteed prediction. Context matters more than the shape alone.
🟢 PART 1: SINGLE-CANDLE PATTERNS
1. Doji
A Doji forms when the opening and closing prices are nearly equal. It reflects indecision between buyers and sellers.
Possible signal: A pause or potential reversal, especially after a strong move.
Trading tip: Wait for the next candle to confirm direction. A Doji alone is not automatically bullish or bearish.
2. Dragonfly Doji
This candle has a long lower shadow, with the open, close, and high near the same level.
Possible signal: Buyers rejected lower prices, potentially indicating bullish pressure after a decline.
Confirmation: Look for a bullish follow-through candle or a break above nearby resistance.
3. Gravestone Doji
This candle has a long upper shadow, with the open, close, and low near the same level.
Possible signal: Buyers pushed prices higher, but sellers forced the price back down. It may warn of bearish pressure after an uptrend.
Confirmation: Watch for a bearish candle or a break below nearby support.
4. Hammer
A Hammer has a small real body near the top and a long lower shadow. It commonly appears after a decline.
Possible signal: Sellers pushed the price lower, but buyers recovered much of the move.
Confirmation: A bullish candle following the Hammer can strengthen the reversal idea.
5. Inverted Hammer
An Inverted Hammer has a small body near the bottom and a long upper shadow. It may appear after a downtrend.
Possible signal: Buyers attempted to push the price higher. This may be an early sign of a potential bullish reversal.
Confirmation: Look for a strong bullish candle afterward. The upper shadow alone does not prove that buyers are in control.
6. Hanging Man
The Hanging Man resembles a Hammer but appears after an uptrend.
Possible signal: Selling pressure emerged during the session, potentially warning that the uptrend is weakening.
Confirmation: A bearish follow-through candle or a break below support makes the warning more meaningful.
7. Bullish Spinning Top
A Spinning Top has a small real body and shadows on both sides. When it appears after a decline, it may indicate that selling momentum is weakening.
Possible signal: Market indecision and a possible change in momentum.
Confirmation: Wait for a bullish breakout or follow-through candle.
8. Bearish Spinning Top
This candle also has a small body and shadows on both sides, but it appears after an advance.
Possible signal: Buyers may be losing momentum, although the candle itself is neutral.
Confirmation: Look for bearish follow-through or a break below support.
🔴 PART 2: STRONG CANDLE & TWO-CANDLE PATTERNS
9. Bullish Marubozu
A bullish Marubozu is a large bullish candle with little or no shadow.
Possible signal: Buyers controlled most or all of the candle’s trading range.
Trading tip: A breakout above resistance with strong volume can add confirmation. Avoid chasing a candle that has already moved too far.
10. Bearish Marubozu
A bearish Marubozu is a large bearish candle with little or no shadow.
Possible signal: Sellers controlled the session and may be driving downward momentum.
Trading tip: Check whether support has broken and whether the move is supported by volume.
11. Bullish Kicker
A Bullish Kicker is a sharp shift from bearish to bullish price action, traditionally involving a gap between candles.
Possible signal: A sudden change in sentiment in favor of buyers.
Confirmation: Look for strong bullish follow-through. Classic gaps are less common in continuously traded crypto markets, so not every sharp reversal qualifies as a textbook Kicker.
12. Bearish Kicker
A Bearish Kicker is a sharp shift from bullish to bearish price action, traditionally accompanied by a gap.
Possible signal: A sudden change in sentiment in favor of sellers.
Confirmation: Watch for continued selling and a break below support.
13. Bullish Engulfing
A small bearish candle is followed by a bullish candle whose real body engulfs the previous real body.
Possible signal: Buyers have overcome the previous candle’s selling pressure.
Best context: After a decline or near a meaningful support zone.
Confirmation: A close above nearby resistance can strengthen the setup.
14. Bearish Engulfing
A small bullish candle is followed by a bearish candle whose real body engulfs the previous real body.
Possible signal: Sellers have overwhelmed the previous candle’s buying pressure.
Best context: After an uptrend or near resistance.
Confirmation: Look for a support break or continued bearish price action.
15. Piercing Line
This bullish two-candle pattern occurs after a decline. A bearish candle is followed by a bullish candle that closes above the midpoint of the previous candle’s real body, while generally remaining below its open.
Possible signal: Buyers are recovering ground and a bullish reversal may be developing.
Confirmation: A break above nearby resistance adds strength.
16. Dark Cloud Cover
This bearish pattern appears after an advance. A bullish candle is followed by a bearish candle that closes below the midpoint of the previous candle’s real body, while generally opening above the previous close.
Possible signal: Sellers are gaining control after an upward move.
Confirmation: Look for bearish follow-through or a support break.
17. Tweezer Bottom
Two candles form lows around approximately the same price level following a decline.
Possible signal: The market may be rejecting a support zone.
Confirmation: A bullish candle or breakout above the pattern’s short-term high can help confirm the idea.
18. Tweezer Top
Two candles form highs around approximately the same price level after an advance.
Possible signal: Resistance may be holding, and a bearish reversal could develop.
Confirmation: Look for a bearish follow-through candle or a break below short-term support.
19. Bullish Harami
A large bearish candle is followed by a smaller candle whose real body fits inside the previous bearish real body.
Possible signal: Selling momentum may be slowing.
Confirmation: A bullish breakout above the smaller candle’s high can improve confidence.
20. Bearish Harami
A large bullish candle is followed by a smaller candle whose real body fits inside the previous bullish real body.
Possible signal: Buying momentum may be weakening.
Confirmation: A bearish break below the smaller candle’s low can strengthen the bearish interpretation.
21. Morning Star
This three-candle bullish reversal pattern usually consists of a large bearish candle, a small-bodied candle showing indecision, and a strong bullish candle that closes well into the first candle’s body.
Possible signal: Selling pressure may be giving way to buying pressure.
Best context: After a sustained decline, especially near support.
Confirmation: Look for follow-through above the third candle’s high.
🟢 PART 3: MULTI-CANDLE REVERSAL & CONTINUATION PATTERNS
22. Bullish Abandoned Baby
This rare three-candle bullish reversal pattern consists of a bearish candle, a Doji separated by a gap, and a bullish candle separated from the Doji by another gap.
Possible signal: A sharp shift from selling to buying pressure.
Important: True gaps are essential to the traditional pattern and are relatively uncommon in 24/7 crypto markets.
23. Bearish Abandoned Baby
This rare bearish reversal pattern consists of a bullish candle, a separated Doji, and a bearish candle separated from the Doji by another gap.
Possible signal: A potential shift from buying pressure to selling pressure.
Confirmation: Look for bearish follow-through and a break below support.
24. Three White Soldiers
Three consecutive strong bullish candles typically appear after a decline. Each candle generally closes higher than the previous one, with openings inside or near the preceding real body.
Possible signal: Buyers are building sustained momentum.
Caution: If the pattern appears after an already extended rally, the market may be overbought or due for a pullback.
25. Three Black Crows
Three consecutive strong bearish candles typically appear after an advance. Each generally closes lower than the previous one.
Possible signal: Sellers are building sustained momentum.
Confirmation: A break below support may support the bearish continuation or reversal idea.
26. Three Line Strike
In a common bullish interpretation, three bearish candles are followed by a large bullish candle that reverses the preceding three-candle move. The bearish version is the opposite: three bullish candles followed by a large bearish candle.
Possible signal: A sharp counter-move that may indicate continuation of the earlier trend in some traditional interpretations.
Important: Three Line Strike has different interpretations across trading references. Check the direction of the preceding trend and wait for confirmation rather than treating the pattern as an automatic reversal.
27. Three Inside Up
This bullish three-candle pattern begins with a large bearish candle, followed by a smaller bullish candle contained within its real body, and then a bullish candle that closes above the first candle’s open.
Possible signal: Selling momentum may be turning into buying momentum.
Confirmation: A break above the first candle’s high offers additional evidence.
28. Three Inside Down
This bearish pattern begins with a large bullish candle, followed by a smaller bearish candle contained within its real body, and then a bearish candle that closes below the first candle’s open.
Possible signal: Buying momentum may be turning into selling momentum.
Confirmation: Watch for a break below the first candle’s low.
29. Three Outside Up
This bullish pattern starts with a bearish candle, followed by a bullish Engulfing candle, and then another bullish candle that confirms the reversal.
Possible signal: Buyers may be taking control after a decline.
Confirmation: A sustained move above nearby resistance can support the setup.
30. Three Outside Down
This bearish pattern starts with a bullish candle, followed by a bearish Engulfing candle, and then another bearish candle confirming the move.
Possible signal: Sellers may be taking control after an advance.
Confirmation: Look for continued weakness and a break below support.
📈 PART 4: CHART PATTERNS
These formations use multiple candles and price swings rather than a single candle shape.
31. Cup and Handle
The Cup and Handle is a bullish continuation pattern in many technical-analysis approaches. Price forms a rounded, cup-like recovery, then consolidates in a smaller handle before potentially breaking above resistance.
Possible signal: A bullish breakout if price clears the cup’s resistance area.
Trading approach: Wait for a confirmed breakout; some traders also look for a successful retest of resistance.
Risk: Failed breakouts can reverse quickly.
32. Double Top
A Double Top forms when price tests a similar resistance level twice and fails to break through.
Possible signal: Potential bearish reversal, particularly after an uptrend.
Confirmation: The traditional confirmation is a break below the neckline—the support level between the two peaks.
Risk management: Resistance alone is not confirmation; price may still break upward.
33. Double Bottom
A Double Bottom forms when price tests a similar support level twice and rebounds
Possible signal: Potential bullish reversal after a decline.
Confirmation: Traders commonly watch for a break above the neckline, the resistance between the two lows.
Risk management: If support breaks decisively, the bullish setup may fail.
34. Wedge
A Wedge forms when price swings converge between two sloping trendlines.
Rising wedge: Often considered bearish, especially if it develops after an advance.Falling wedge: Often considered bullish, especially after a decline.
Confirmation: Wait for a breakout from the wedge and assess whether volume and subsequent candles support the move. Wedges do not always break in the expected direction.
35. Flag
A Flag forms when a strong price move is followed by a short consolidation, often inside a small channel.
Bullish flag: A strong upward move followed by a pause or pullback.Bearish flag: A strong downward move followed by a pause or rebound.Possible signal: Continuation in the direction of the initial move.
Confirmation: Watch for a breakout from the flag in the direction of the preceding trend.
36. Rising Window
A Rising Window is a bullish gap between one candle’s high and the next candle’s low.
Possible signal: Strong upward momentum, sometimes acting as a support zone.
Crypto note: Since crypto trades continuously, textbook gaps are less common than in markets with fixed opening hours. Low-liquidity periods or exchange-specific charts can still show gaps.
37. Falling Window
A Falling Window is a bearish gap between one candle’s low and the next candle’s high.
Possible signal: Strong downward momentum, sometimes acting as resistance.
Confirmation: Watch whether price continues lower or retraces into the gap. A gap is not a guarantee of further decline.
🧠 HOW TO USE THESE PATTERNS IN CRYPTO TRADING
1. Identify the trend first.
A Hammer after a decline has a different meaning from a similar candle in the middle of a sideways market.
2. Mark support and resistance.
Patterns near important levels are often more informative than patterns appearing randomly on a chart.
3. Wait for confirmation.
A candle close, breakout, retest, or follow-through move may help distinguish a real setup from market noise.
4. Use volume and timeframe context.
Volume can help assess participation, while higher-timeframe levels may matter more than small patterns on very short charts.
5. Plan your invalidation level.
Decide in advance where the trade idea would no longer make sense. A stop-loss can help manage risk, although slippage and fast markets can affect execution.
6. Protect your capital.
Avoid risking money you cannot afford to lose. High leverage magnifies both gains and losses, and liquidation can occur quickly.
🔍 FINAL TAKEAWAY
Candlestick and chart patterns help traders organize price information and develop trading hypotheses. They are most useful when combined with trend analysis, support and resistance, confirmation, and disciplined risk management.
No pattern guarantees a profit. Test your strategy on historical data and a demo account before risking real capital.
DOCTOR_SIGNaLs — Learn the Pattern. Confirm the Setup. Manage the Risk.
Educational content only. This article is not financial advice or a guarantee of trading results. Cryptocurrency trading, especially leveraged futures, carries substantial risk.
#DOCTOR_SIGNaLs #CanMicrosoftDeliverOnAI #FOMCWatch #EarningsSeason #Candlestick
97

📈 How to Read Crypto Candlestick Charts!
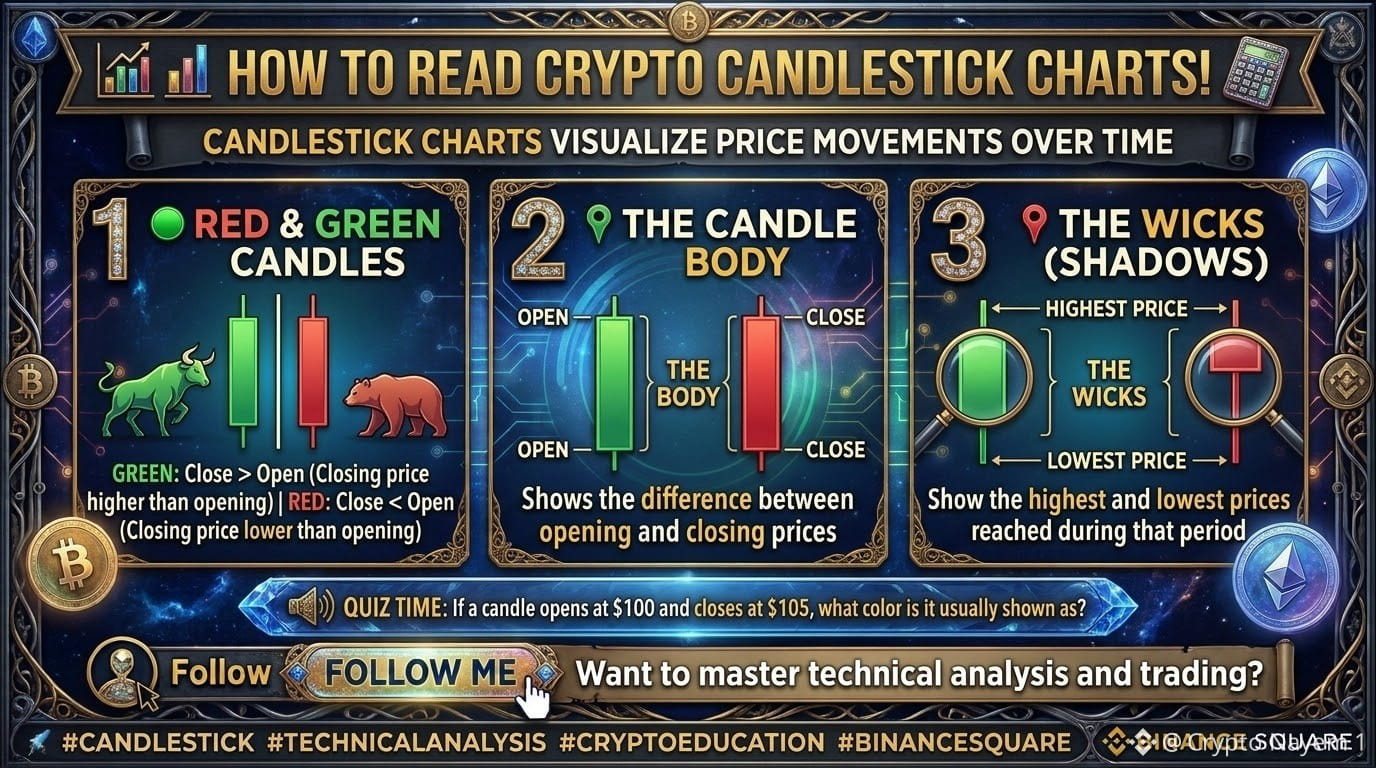
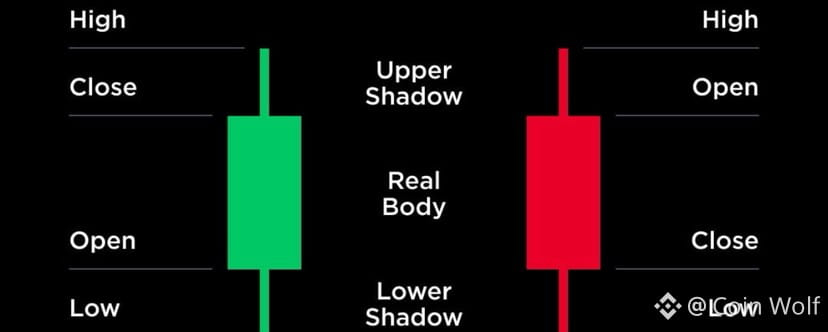
Candlestick charts help traders visualize price movements over a chosen period.
🟢 Green Candle: The closing price is higher than the opening price.
🔴 Red Candle: The closing price is lower than the opening price.
📍 The Body: Shows the difference between opening and closing prices.
📍 The Wicks: Show the highest and lowest prices reached during that period.
⚠️ One candle cannot predict the future. Volume, trend, timeframe, and market conditions also matter.
💬 Quiz Time: If a candle opens at $100 and closes at $105, what color is it usually shown as?
A️⃣ Green B️⃣ Red
Drop your answer below! 👇
#Candlestick #TechnicalAnalysis #cryptoeducation #BinanceSquare
$BTC $ETH $SOL
{spot}(BTCUSDT)
📈 How to Read Crypto Candlestick Charts!
Candlestick charts help traders visualize price movements over a chosen period.
🟢 Green Candle: The closing price is higher than the opening price.
🔴 Red Candle: The closing price is lower than the opening price.
📍 The Body: Shows the difference between opening and closing prices.
📍 The Wicks: Show the highest and lowest prices reached during that period.
⚠️ One candle cannot predict the future. Volume, trend, timeframe, and market conditions also matter.
💬 Quiz Time: If a candle opens at $100 and closes at $105, what color is it usually shown as?
A️⃣ Green B️⃣ Red
Drop your answer below! 👇
#Candlestick #TechnicalAnalysis #cryptoeducation #BinanceSquare
$BTC $ETH $SOL
Shaon 13:
ok
4
4
126

🚀 TOP CRYPTO GAINER: $BIRB 🐦📈
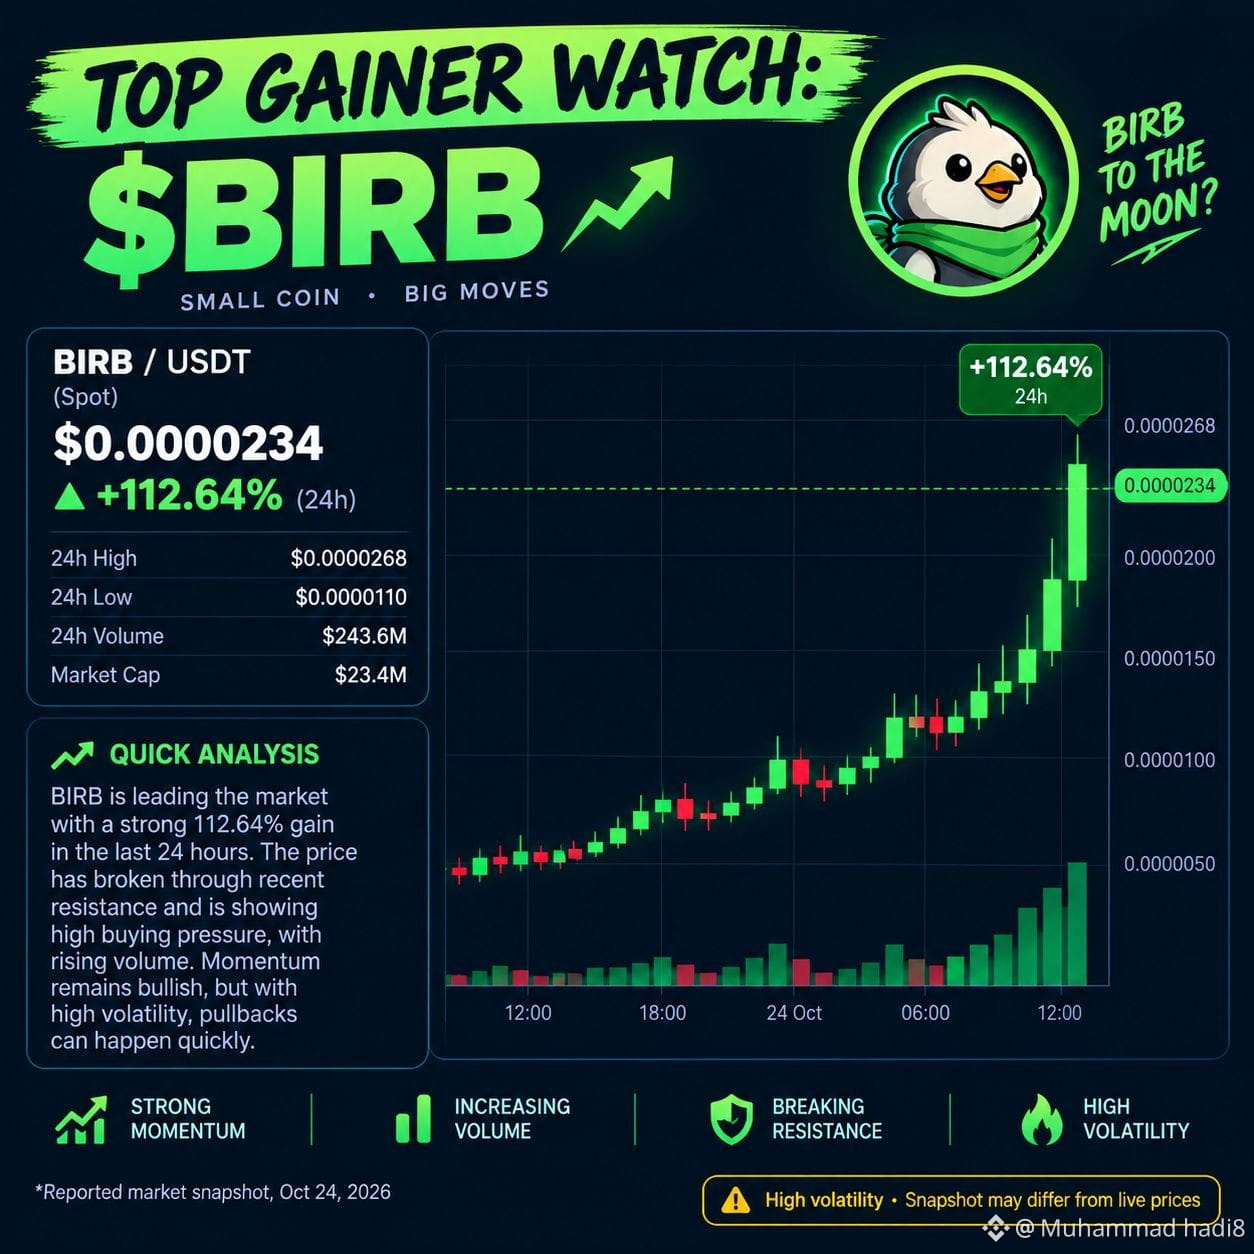
🔥 $BIRB is showing explosive momentum, with a reported 24-hour gain of over 100%!
📊 Candle Analysis: Strong green candles suggest aggressive buying pressure. Rising volume can support the move, but after such a sharp rally, a pullback or profit-taking is possible.
🟢 Bullish signal: Buyers maintain momentum. 🔴 Risk signal: Momentum fades and price falls below support.
💬 Is $BIRB ready for another move up, or will sellers take control?
⚠️ High volatility. Check live Binance Spot prices before making decisions.
#BIRB #CryptoAnalysis #BinanceSquare #CryptoMarket #candlestick
{future}(BIRBUSDT)
🚀 TOP CRYPTO GAINER: $BIRB 🐦📈
🔥 $BIRB is showing explosive momentum, with a reported 24-hour gain of over 100%!
📊 Candle Analysis: Strong green candles suggest aggressive buying pressure. Rising volume can support the move, but after such a sharp rally, a pullback or profit-taking is possible.
🟢 Bullish signal: Buyers maintain momentum. 🔴 Risk signal: Momentum fades and price falls below support.
💬 Is $BIRB ready for another move up, or will sellers take control?
⚠️ High volatility. Check live Binance Spot prices before making decisions.
#BIRB #CryptoAnalysis #BinanceSquare #CryptoMarket #candlestick
221

·
--
Статья
🕯️ Every Candle Has a Story to Tell! 📊Behind every candlestick lies a story of market movement — where the price began, where it ended, how high it climbed, and how low it fell. 📈📉
#BitcoinSurpasses$82K 💡 Read the candles, understand the battle between buyers and sellers, and uncover what the market is really telling you.
#cryptouniverseofficial #candlestick
🕯️ Every Candle Has a Story to Tell! 📊
Behind every candlestick lies a story of market movement — where the price began, where it ended, how high it climbed, and how low it fell. 📈📉
#BitcoinSurpasses$82K 💡 Read the candles, understand the battle between buyers and sellers, and uncover what the market is really telling you.
#cryptouniverseofficial #candlestick
#BitcoinSurpasses$82K 💡 Read the candles, understand the battle between buyers and sellers, and uncover what the market is really telling you.
#cryptouniverseofficial #candlestick
123

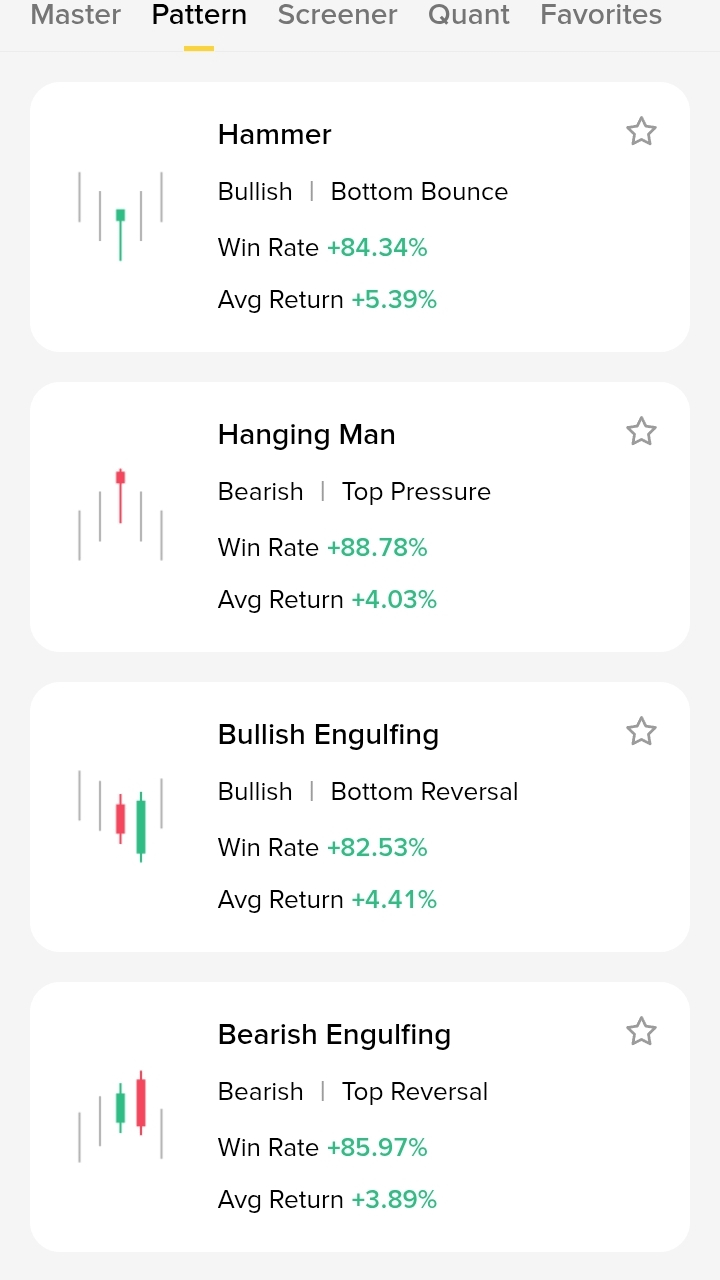
🔥 Most traders ignore these 3 candles… and keep losing
Do you know the difference?
🟢 Hammer
Bullish bottom bounce
Long lower wick = buyers just rejected the lows hard
🔴 Hanging Man
Bearish top pressure
Looks like a Hammer but appears at the top → danger signal
🟢 Bullish Engulfing
Strong reversal
Big green candle completely swallows the previous red one
These 3 patterns have been printing high win rates lately.
Which one do you trust the most?
Drop a 🔥 if you want more pattern breakdowns
#trading #crypto #Candlestick #BinanceSquare
104

·
--
Рост
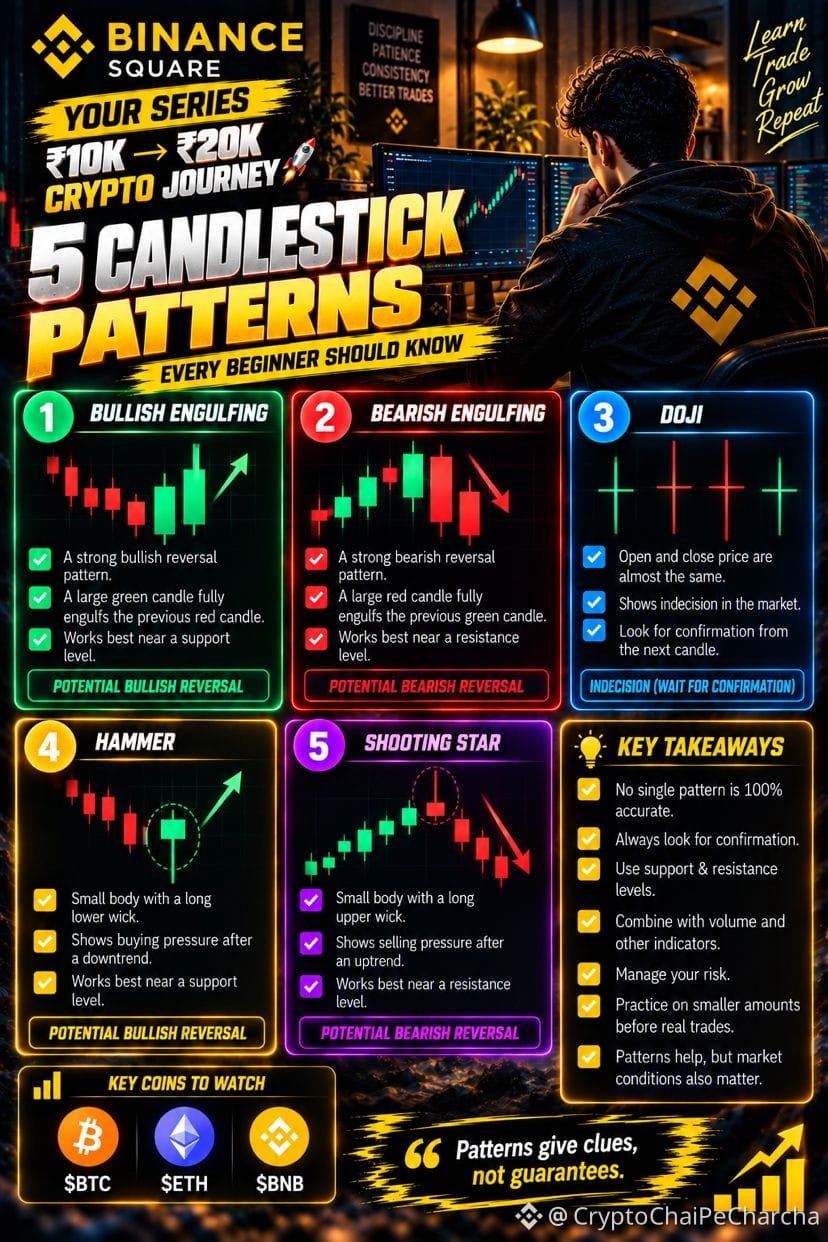
5 Candlestick Patterns Every Beginner Should Know
Cover candles, wicks, body size, bullish/bearish signals and confirmation.
Tags: $BTC $BNB $ETH #btc #ETH #bnb #candlestick #MicronBeatsEarningsLiftsGuidance
{spot}(BTCUSDT)
{spot}(BNBUSDT)
{spot}(ETHUSDT)
5 Candlestick Patterns Every Beginner Should Know
Cover candles, wicks, body size, bullish/bearish signals and confirmation.
Tags: $BTC $BNB $ETH #btc #ETH #bnb #candlestick #MicronBeatsEarningsLiftsGuidance
Cover candles, wicks, body size, bullish/bearish signals and confirmation.
Tags: $BTC $BNB $ETH #btc #ETH #bnb #candlestick #MicronBeatsEarningsLiftsGuidance
94

Статья
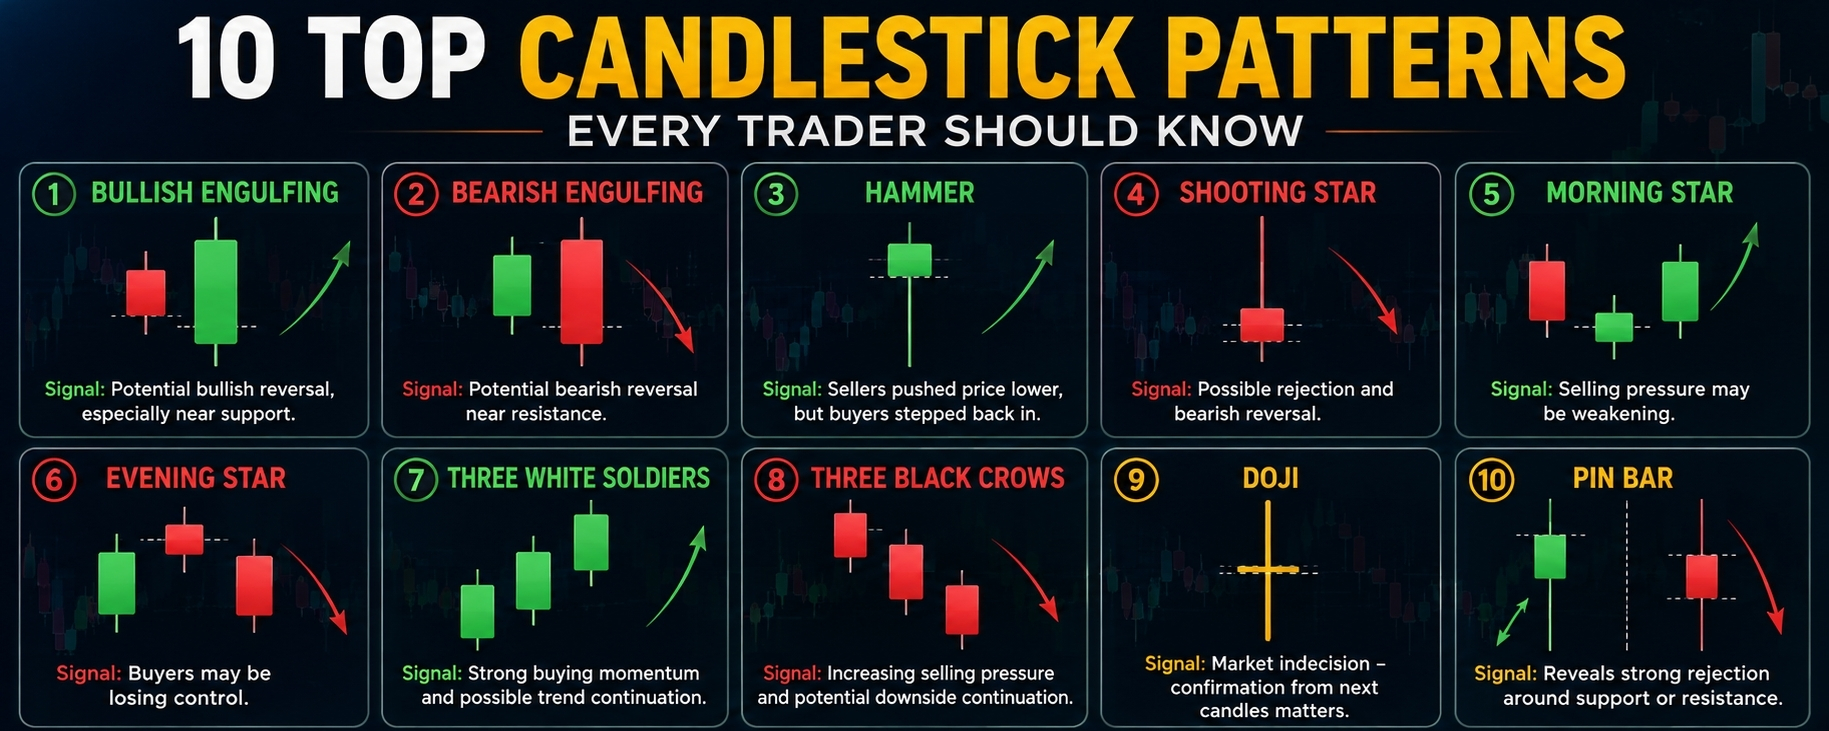
🔥10 Top Candlestick Patterns Every Trader Should KnowCandlesticks are more than just green and red candles — they tell the story of buyers, sellers, momentum, and market psychology.
Here are 10 of the most useful candlestick patterns traders watch for:
1.🟢 Bullish Engulfing
A strong green candle completely engulfs the previous red candle.
Signal: Potential bullish reversal, especially near support.
2.🔴 Bearish Engulfing
A red candle completely covers the previous green candle.
Signal: Potential bearish reversal near resistance.
3. 🔨 Hammer
A small body with a long lower wick after a decline.
Signal: Sellers pushed price lower, but buyers stepped back in.
4. ⭐ Shooting Star
A small body with a long upper wick after an uptrend.
Signal: Possible rejection and bearish reversal.
5. 🌅 Morning Star
A three-candle bullish reversal formation appearing after a downtrend.
Signal: Selling pressure may be weakening.
6. 🌙 Evening Star
A three-candle bearish reversal formation after an uptrend.
Signal: Buyers may be losing control.
7. 🟢 Three White Soldiers
Three strong consecutive bullish candles.
Signal: Strong buying momentum and possible trend continuation.
8. 🔴 Three Black Crows
Three consecutive strong bearish candles.
Signal: Increasing selling pressure and potential downside continuation.
9. ➕ Doji
The opening and closing prices are very close.
Signal: Market indecision — confirmation from the next candles matters.
10. 📌 Pin Bar
A candle with a prominent wick showing rejection of a price level.
Signal: Can reveal strong rejection around support or resistance.
🧠 The real secret
Don't trade a candlestick pattern by itself.
The strongest setups usually come when the candle aligns with support/resistance, volume, trend structure, liquidity, and higher-timeframe confirmation.
Candlestick = clue.
Market structure = context.
Confirmation = execution. 📈
Trade the setup, not the emotion. 🚀
$MAGMA
{future}(MAGMAUSDT)
$TRUMP
{spot}(TRUMPUSDT)
$BEAT
{future}(BEATUSDT)
#USDollarFallsToThreeMonthLow #candlestick #Top_Gainers #Binance
🔥10 Top Candlestick Patterns Every Trader Should Know
Candlesticks are more than just green and red candles — they tell the story of buyers, sellers, momentum, and market psychology.
Here are 10 of the most useful candlestick patterns traders watch for:
1.🟢 Bullish Engulfing
A strong green candle completely engulfs the previous red candle.
Signal: Potential bullish reversal, especially near support.
2.🔴 Bearish Engulfing
A red candle completely covers the previous green candle.
Signal: Potential bearish reversal near resistance.
3. 🔨 Hammer
A small body with a long lower wick after a decline.
Signal: Sellers pushed price lower, but buyers stepped back in.
4. ⭐ Shooting Star
A small body with a long upper wick after an uptrend.
Signal: Possible rejection and bearish reversal.
5. 🌅 Morning Star
A three-candle bullish reversal formation appearing after a downtrend.
Signal: Selling pressure may be weakening.
6. 🌙 Evening Star
A three-candle bearish reversal formation after an uptrend.
Signal: Buyers may be losing control.
7. 🟢 Three White Soldiers
Three strong consecutive bullish candles.
Signal: Strong buying momentum and possible trend continuation.
8. 🔴 Three Black Crows
Three consecutive strong bearish candles.
Signal: Increasing selling pressure and potential downside continuation.
9. ➕ Doji
The opening and closing prices are very close.
Signal: Market indecision — confirmation from the next candles matters.
10. 📌 Pin Bar
A candle with a prominent wick showing rejection of a price level.
Signal: Can reveal strong rejection around support or resistance.
🧠 The real secret
Don't trade a candlestick pattern by itself.
The strongest setups usually come when the candle aligns with support/resistance, volume, trend structure, liquidity, and higher-timeframe confirmation.
Candlestick = clue.
Market structure = context.
Confirmation = execution. 📈
Trade the setup, not the emotion. 🚀
$MAGMA
$TRUMP
$BEAT
#USDollarFallsToThreeMonthLow #candlestick #Top_Gainers #Binance
267

Candlestick Pattern Kya Hota Hai?
Candlestick patterns traders ko market sentiment samajhne mein help karte hain.
Popular patterns:
✅ Bullish Engulfing (price up ja sakti hai)
✅ Bearish Engulfing (price down ja sakti hai)
✅ Doji (market confused hai)
💡 Patterns signal dete hain, guarantee nahi.
$C $S
{future}(SUSDT)
{future}(CUSDT)
#candlestick #PATTERN #bullish #BEARISH📉 #DojiCandlestick
Candlestick Pattern Kya Hota Hai?
Candlestick patterns traders ko market sentiment samajhne mein help karte hain.
Popular patterns:
✅ Bullish Engulfing (price up ja sakti hai)
✅ Bearish Engulfing (price down ja sakti hai)
✅ Doji (market confused hai)
💡 Patterns signal dete hain, guarantee nahi.
$C $S
#candlestick #PATTERN #bullish #BEARISH📉 #DojiCandlestick
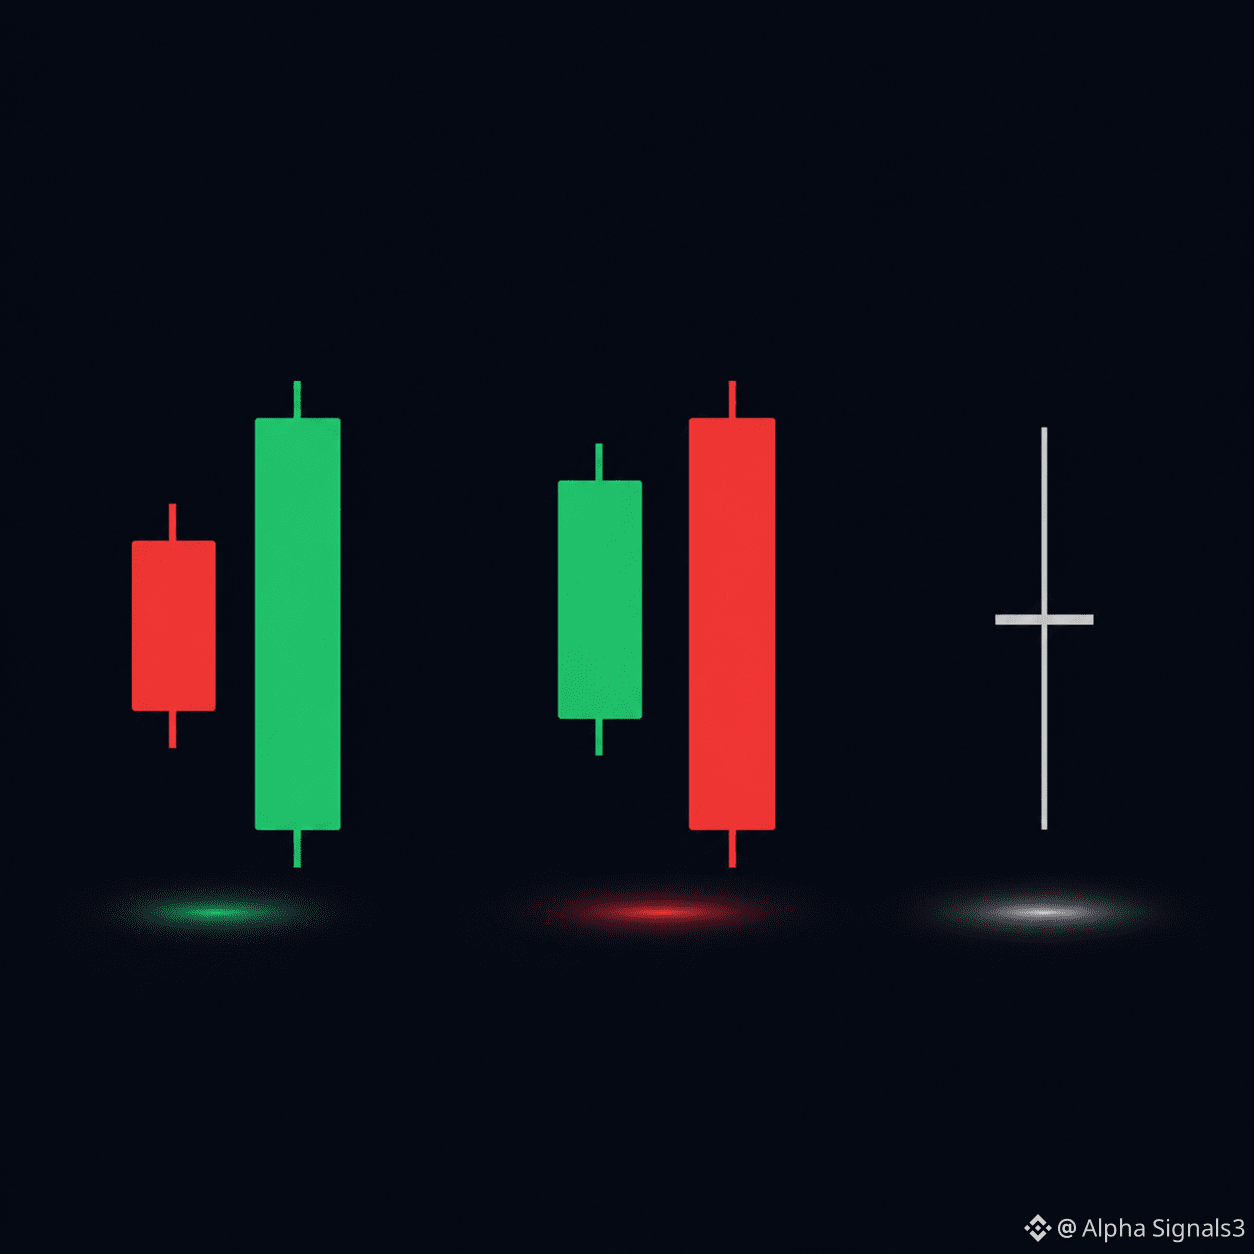
128

·
--
CANDLE ALERT — Momentum Is Explosive!
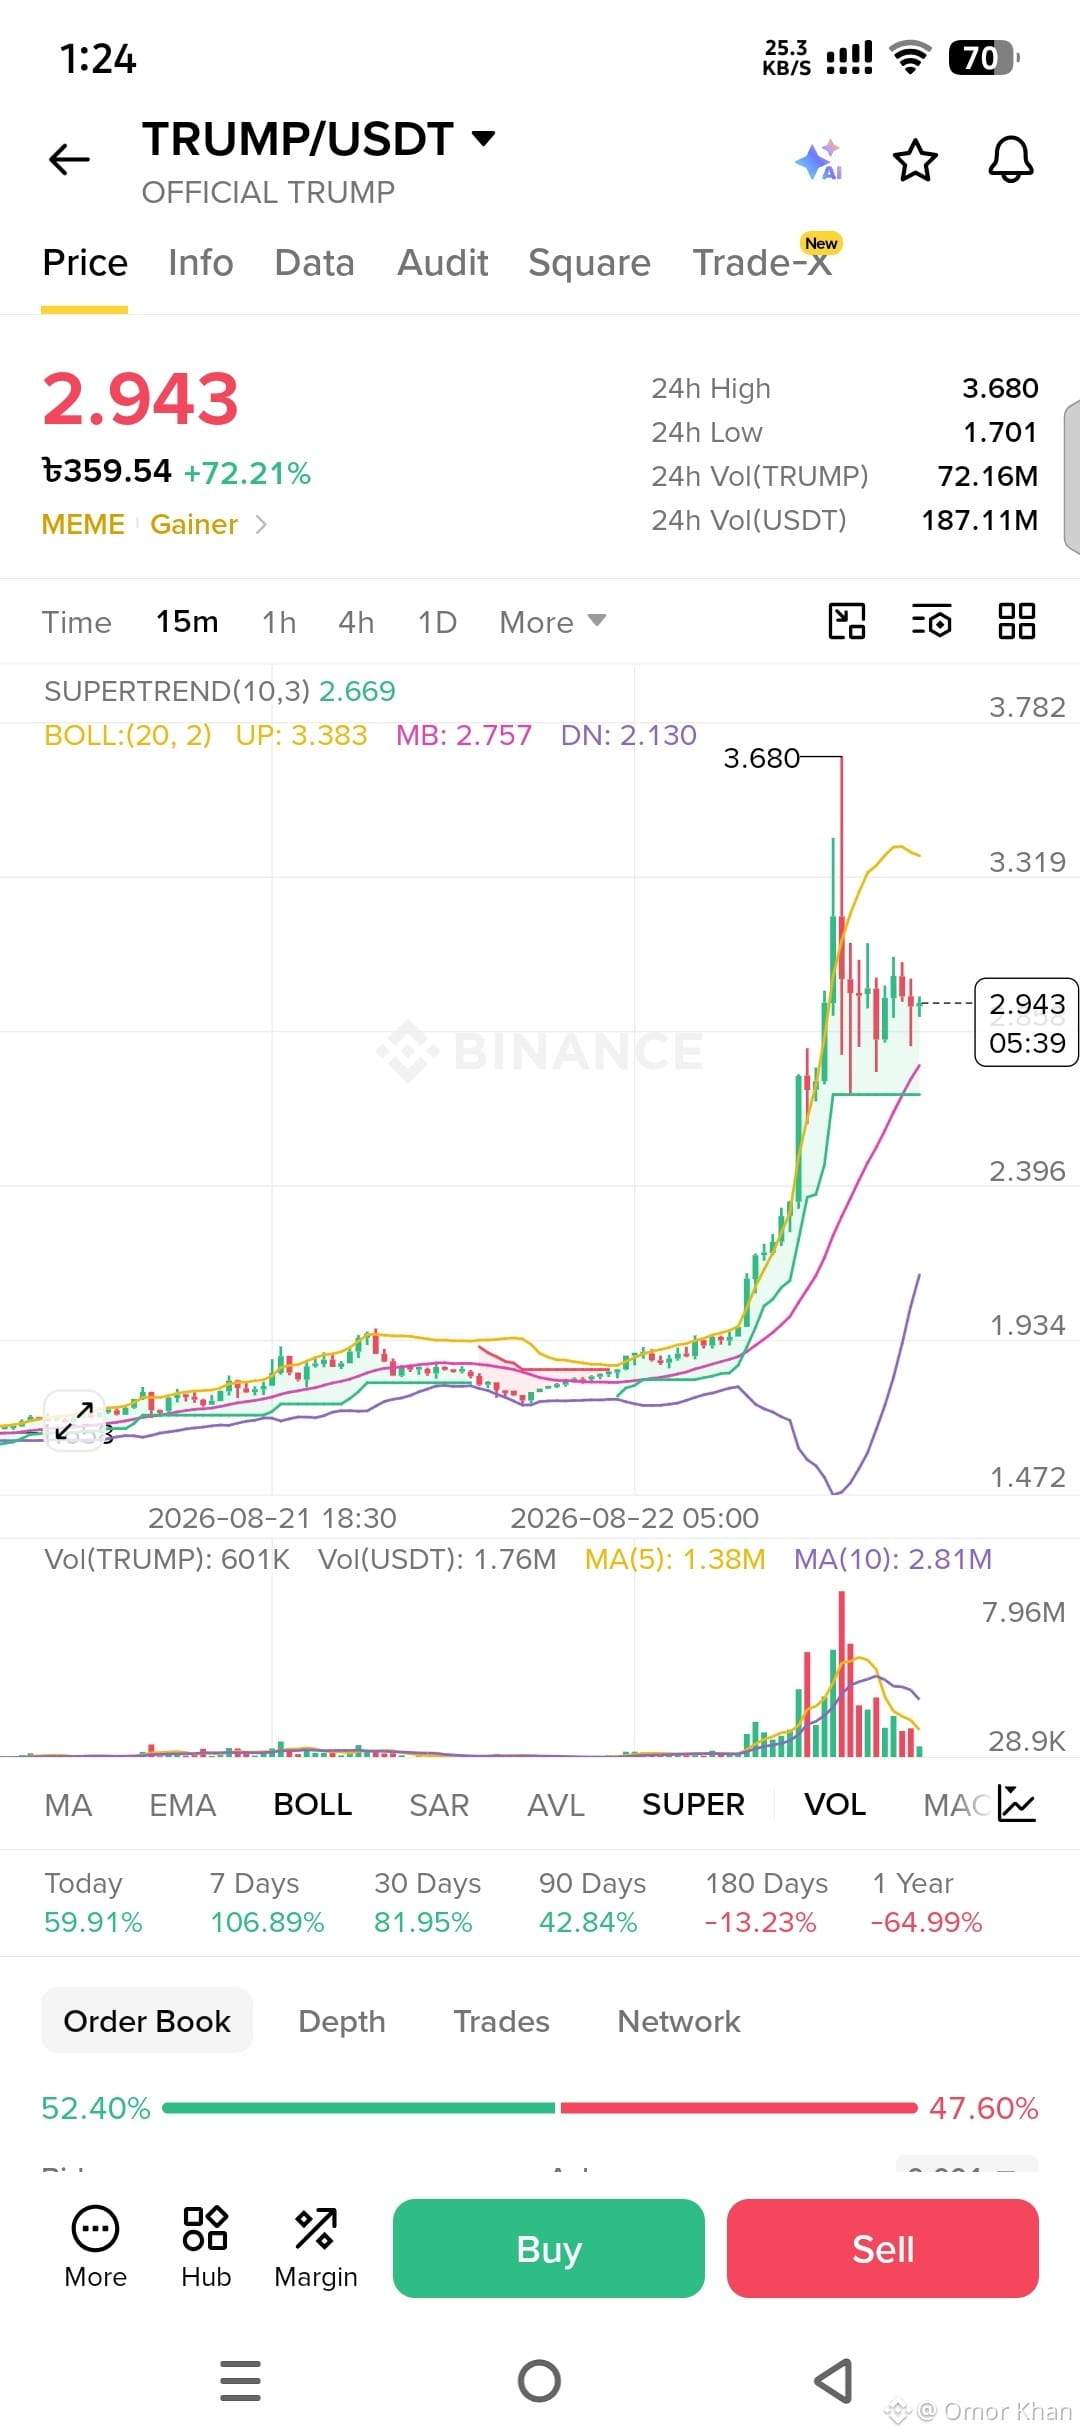
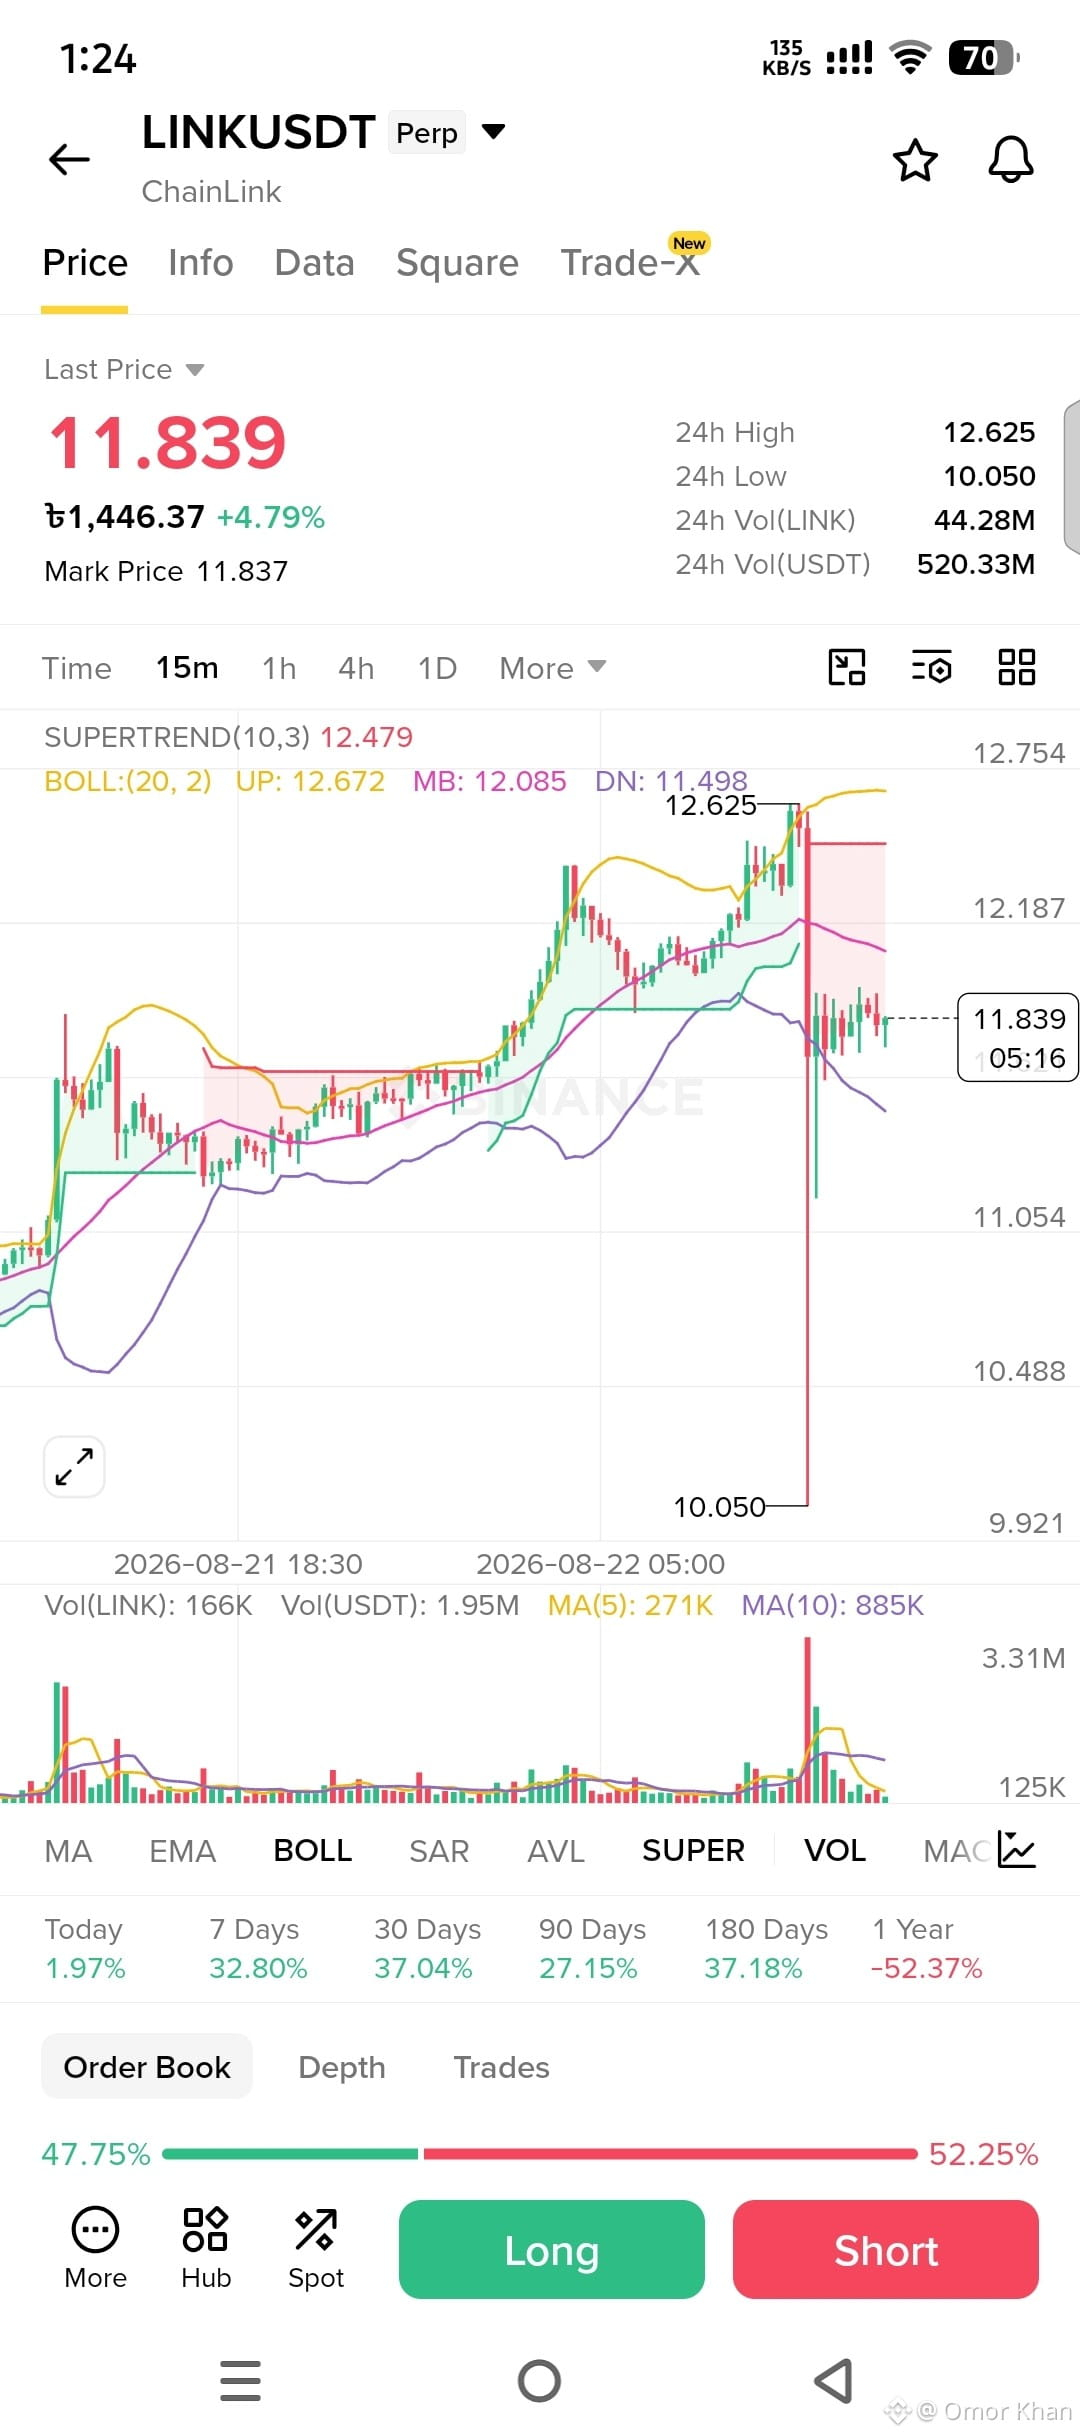
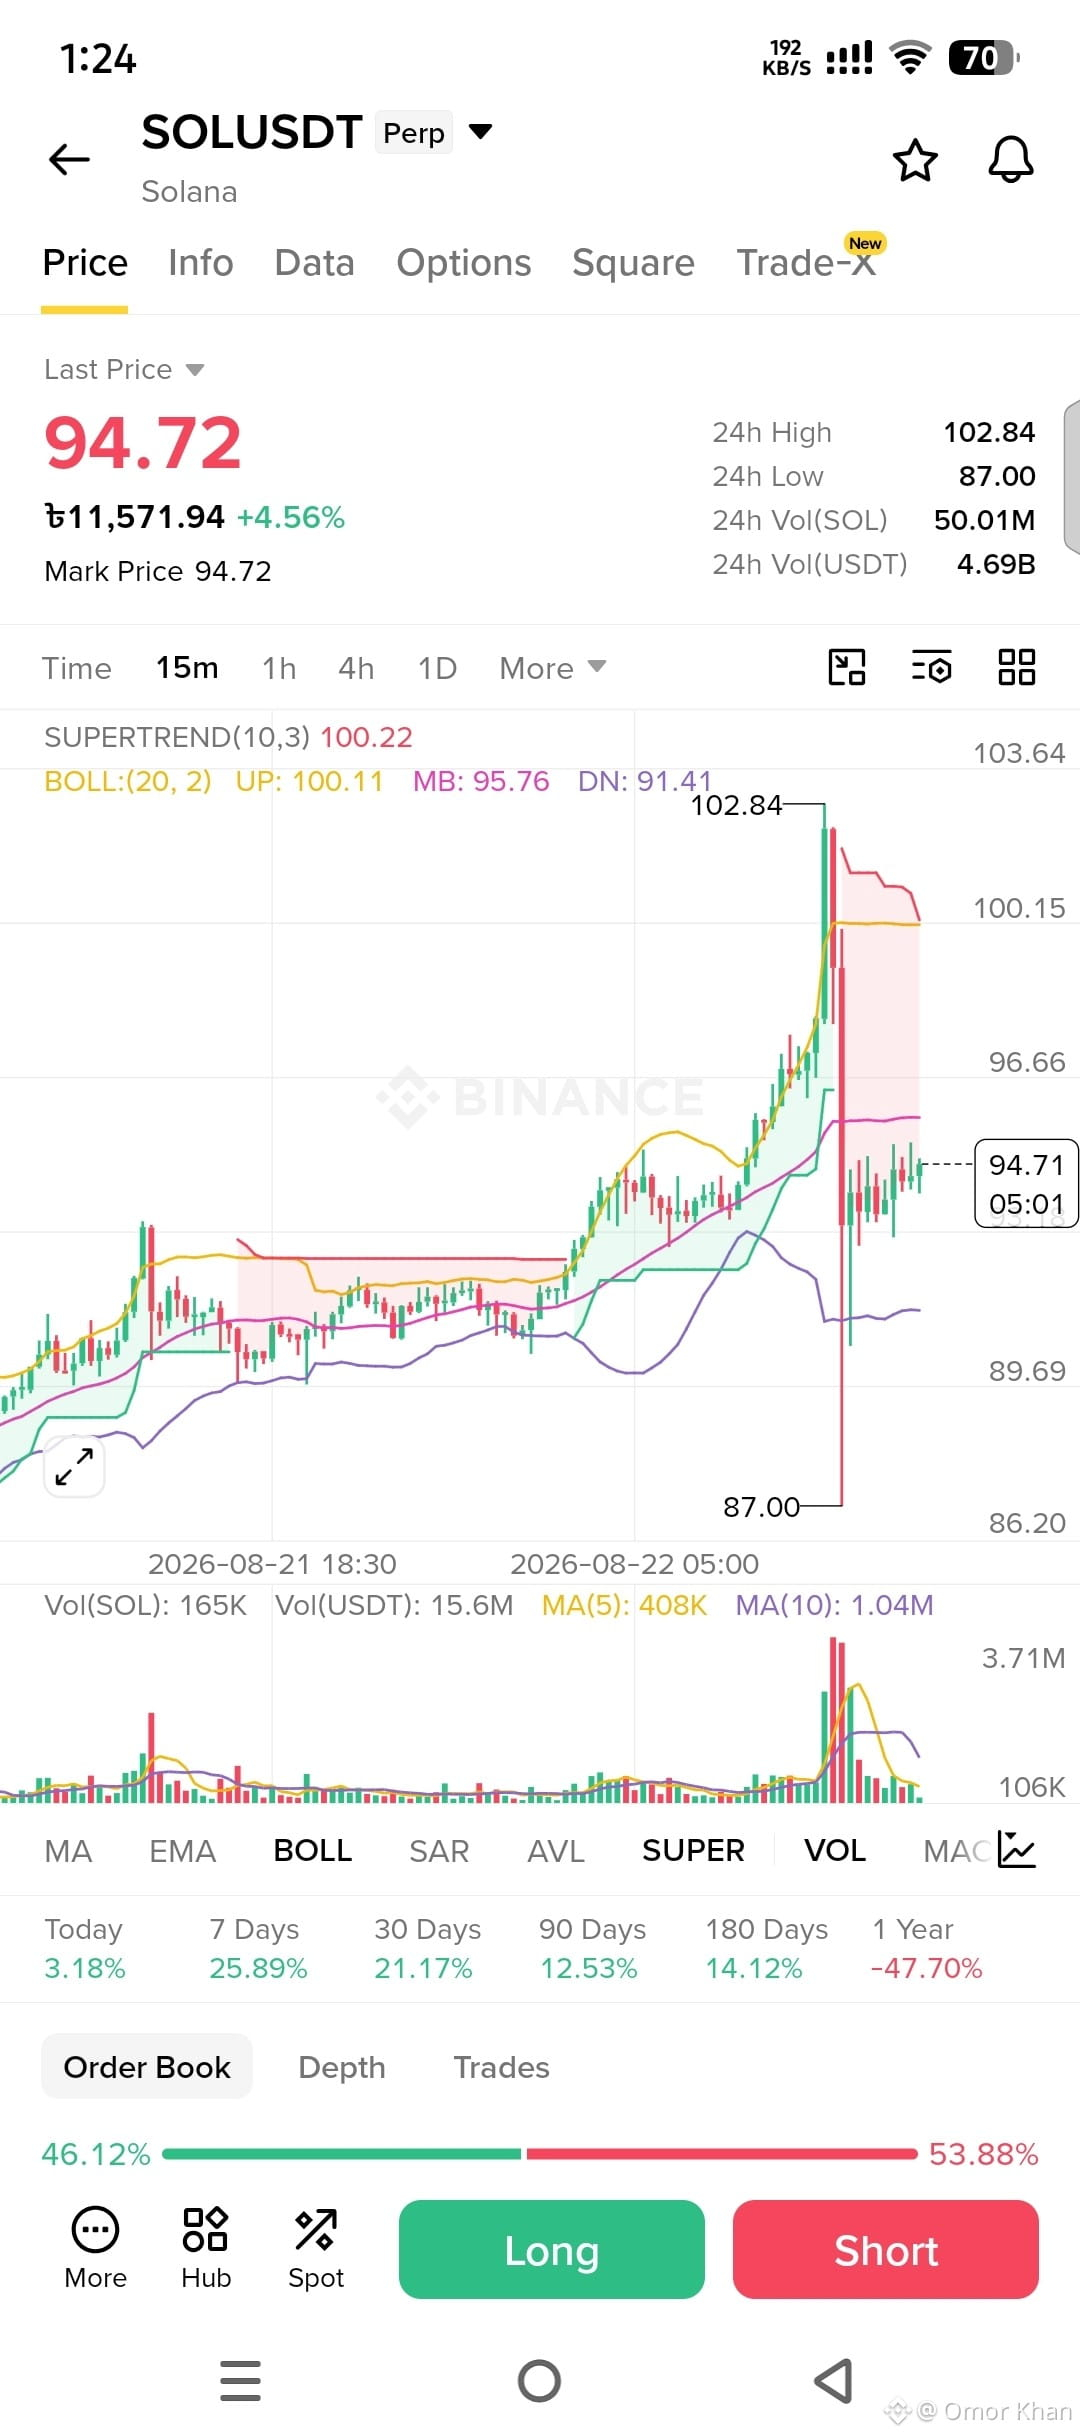
The latest 15M candles are showing huge volatility + strong volume across these three coins
🟢 $SOL— Sharp pump followed by a pullback. Price is consolidating around $94–95. A reclaim of $96–100 could bring buyers back.
🟢 $LINK— Strong breakout, then heavy rejection from $12.62. Now holding around $11.84. Watch $12.08–12.18 for a possible recovery.
🚀 $TRUMP— The biggest move! +72% today with massive volume. After the spike to $3.68, candles are consolidating near $2.94. This one is extremely volatile.
📌 Key lesson:
Big green candles = momentum, but the candles after the pump tell the real story.
Breakout + volume = bullish confirmation.
Long wicks + rejection = caution.
Which candle setup looks strongest to you? 👇
$SOL 🟢 | $LINK 🔗 | $TRUMP 🚀
Not Financial Advice. Always DYOR.
#Candlestick #SOL #LINK #TRUMP
{spot}(TRUMPUSDT)
{spot}(LINKUSDT)
{spot}(SOLUSDT)
CANDLE ALERT — Momentum Is Explosive!
The latest 15M candles are showing huge volatility + strong volume across these three coins
🟢 $SOL — Sharp pump followed by a pullback. Price is consolidating around $94–95. A reclaim of $96–100 could bring buyers back.
🟢 $LINK — Strong breakout, then heavy rejection from $12.62. Now holding around $11.84. Watch $12.08–12.18 for a possible recovery.
🚀 $TRUMP — The biggest move! +72% today with massive volume. After the spike to $3.68, candles are consolidating near $2.94. This one is extremely volatile.
📌 Key lesson:
Big green candles = momentum, but the candles after the pump tell the real story.
Breakout + volume = bullish confirmation.
Long wicks + rejection = caution.
Which candle setup looks strongest to you? 👇
$SOL 🟢 | $LINK 🔗 | $TRUMP 🚀
Not Financial Advice. Always DYOR.
#Candlestick #SOL #LINK #TRUMP
240

Quick Candlestick Check 📊
Most Useful Candle Signal?
🔘 Rejection
🔘 Engulfing
🔘 Doji
What do you find most useful when studying a crypto chart?
💬 Tell us why in the comments.
Remember: A candle pattern should always be viewed in the context of price structure, volume and timeframe.
Follow for simple crypto education without drama
#bitcoin #candlestick #TechnicalAnalysis #cryptoeducation #priceaction

72

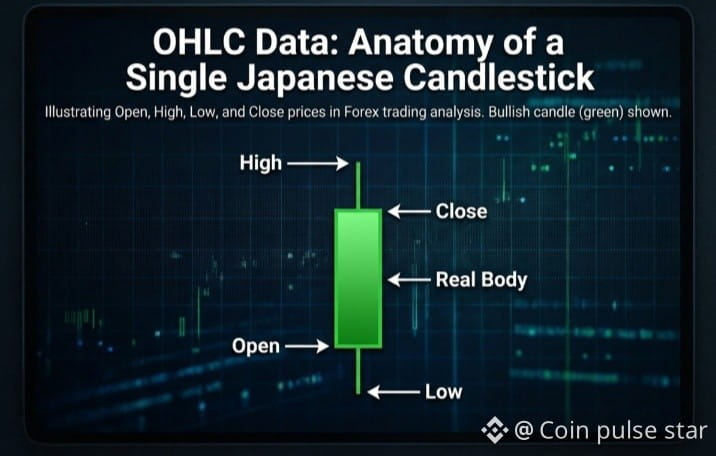
..Doji – open ≈ close (tiny body); signals indecision
Hammer – small body, long lower wick; possible bullish reversal
Engulfing – one candle's body fully covers the previous one; strong reversal signal
Shooting star – small body, long upper wick; possible bearish reversal.
#candlestick
#candlestick_patterns
Hammer – small body, long lower wick; possible bullish reversal
Engulfing – one candle's body fully covers the previous one; strong reversal signal
Shooting star – small body, long upper wick; possible bearish reversal.
#candlestick
#candlestick_patterns
1
102


Learn how to read candlestick patterns.
Unlock key #candlestick insights to spot market trends and opportunities.
Read more 👇
[Here](https://www.binance.com/en/academy/articles/how-to-read-the-most-popular-crypto-candlestick-patterns)
$AAPLB
{spot}(AAPLBUSDT)
Learn how to read candlestick patterns.
Unlock key #candlestick insights to spot market trends and opportunities.
Read more 👇
Here
$AAPLB
Unlock key #candlestick insights to spot market trends and opportunities.
Read more 👇
Here
$AAPLB
5
271

·
--
🕯️ Quick Crypto Quiz! 📊
Which candlestick pattern can signal a possible bullish reversal after a downtrend?
A) Shooting Star ☄️
B) Hammer 🔨
C) Hanging Man 👤
D) Three Black Crows 🐦⬛
🎁 One lucky winner will receive a small gift!
Drop your answer below 👇❤️
#Binance #candlestick #CryptoQuizChallenge #BertaVibe
Which candlestick pattern can signal a possible bullish reversal after a downtrend?
A) Shooting Star ☄️
B) Hammer 🔨
C) Hanging Man 👤
D) Three Black Crows 🐦⬛
🎁 One lucky winner will receive a small gift!
Drop your answer below 👇❤️
#Binance #candlestick #CryptoQuizChallenge #BertaVibe
1.4k
2
45
1.4k

·
--
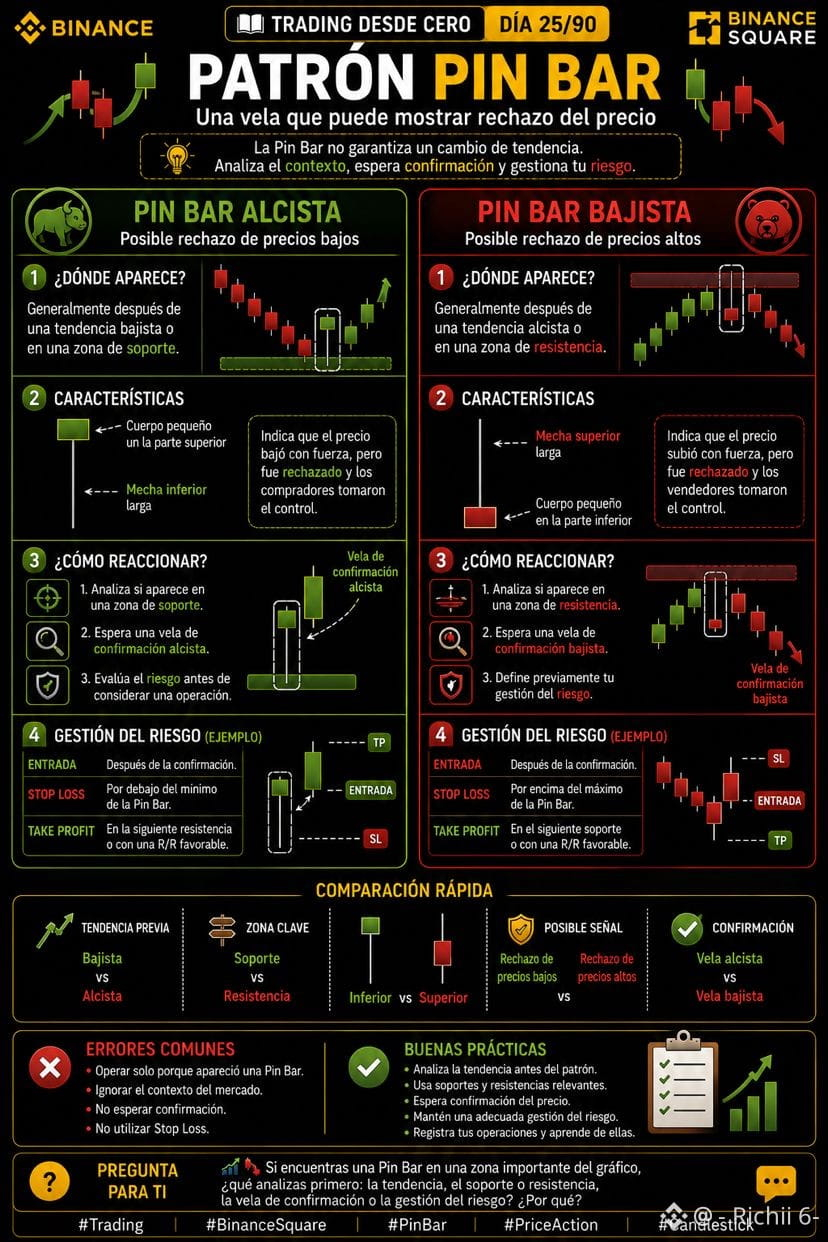
📘 Trading desde Cero – Día 25/90
📍 Patrón Pin Bar: una vela que puede reflejar rechazo del precio
🟢 Pin Bar Alcista
✔ Suele aparecer tras una tendencia bajista.
✔ Presenta una mecha inferior larga.
✔ Puede mostrar rechazo en una zona de soporte.
✔ Espera una confirmación antes de considerar una operación.
🔴 Pin Bar Bajista
✔ Suele aparecer tras una tendencia alcista.
✔ Presenta una mecha superior larga.
✔ Puede mostrar rechazo en una zona de resistencia.
✔ Espera una confirmación antes de actuar.
📌 Una sola vela no determina el futuro del mercado. Analizar el contexto y gestionar el riesgo sigue siendo esencial.
#Trading #BinanceSquare #PinBar #PriceAction #Candlestick
1
1
193

·
--
let's learn with fun.. #quiz1
What does a "Long Upper Wick" on a candle mean?
🔔 Follow for daily crypto quizzes
Learn trading. One question at a time. #tradingeducation #LearnCrypto #candlestick
let's learn with fun.. #quiz1
What does a "Long Upper Wick" on a candle mean?
🔔 Follow for daily crypto quizzes
Learn trading. One question at a time. #tradingeducation #LearnCrypto #candlestick
What does a "Long Upper Wick" on a candle mean?
🔔 Follow for daily crypto quizzes
Learn trading. One question at a time. #tradingeducation #LearnCrypto #candlestick
Bulls are in full control
0%
Price was rejected
100%
Volume is increasing strongly
0%
The coin is ready to pump
0%
1 проголосовали • Голосование закрыто
2
217
·
--
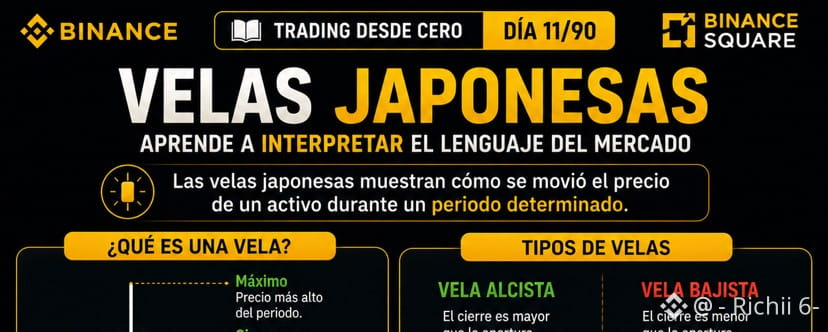
Статья
🕯️ Velas Japonesas: Aprende a interpretar el lenguaje del mercado📘 Trading desde Cero – Día 11/90
🕯️ Velas Japonesas: Aprende a interpretar el lenguaje del mercado
Durante los primeros diez temas aprendimos a proteger el capital, comprender el riesgo y analizar la estructura del mercado. Ahora comenzaremos una de las herramientas más utilizadas por traders de todo el mundo: las velas japonesas.
Cada vela representa la información del precio durante un periodo determinado y permite observar cómo actuaron compradores y vendedores.
Aunque una sola vela no predice el futuro, puede aportar información útil cuando se analiza junto con el contexto del mercado.
¿Qué son las velas japonesas?
Las velas japonesas son una forma de representar gráficamente el movimiento del precio de un activo durante un periodo específico.
Cada vela muestra cuatro datos fundamentales:
Precio de aperturaPrecio de cierrePrecio máximoPrecio mínimo
Estos cuatro valores ayudan a entender cómo evolucionó el precio durante ese intervalo.
Partes de una vela
Una vela está formada por:
🟩 Cuerpo: representa la diferencia entre el precio de apertura y el precio de cierre.
⬆️ Mecha superior: muestra el precio más alto alcanzado.
⬇️ Mecha inferior: muestra el precio más bajo alcanzado.
Generalmente:
Una vela verde indica que el cierre fue superior a la apertura.
Una vela roja indica que el cierre fue inferior a la apertura.
¿Por qué son importantes?
Las velas japonesas ayudan a:
✅ Comprender el comportamiento del precio.
✅ Identificar zonas donde compradores o vendedores mostraron mayor fuerza.
✅ Complementar otros indicadores técnicos.
✅ Analizar el mercado con mayor detalle.
Ejemplo sencillo
Imagina que una vela abre en 100 USDT y cierra en 105 USDT.
Durante ese periodo el precio llegó a 107 USDT y cayó hasta 98 USDT antes de cerrar.
Toda esa información queda representada en una sola vela.
Errores comunes
❌ Creer que una sola vela confirma una tendencia.
❌ Ignorar el contexto del mercado.
❌ Operar únicamente por el color de una vela.
❌ No combinar el análisis con una adecuada gestión del riesgo.
Buenas prácticas
Analiza varias velas, no solo una.
Observa soportes y resistencias.Combina las velas con otros indicadores.Espera confirmaciones antes de abrir una operación.
Conclusión
Las velas japonesas son una herramienta fundamental para interpretar el comportamiento del mercado.
Aprender a leerlas correctamente puede ayudarte a comprender mejor la acción del precio y a tomar decisiones más informadas.
📘 En el Día 12/90 estudiaremos el Patrón Martillo (Hammer) y aprenderemos cómo identificar una posible señal de cambio de tendencia.
💬 Pregunta:
🤔 Cuando observas un gráfico, ¿sueles fijarte primero en las velas o en otros indicadores técnicos? ¿Por qué? 💬
#Trading #BinanceSquare #Candlestick #TradingEducation #TechnicalAnalysis
🕯️ Velas Japonesas: Aprende a interpretar el lenguaje del mercado
📘 Trading desde Cero – Día 11/90
🕯️ Velas Japonesas: Aprende a interpretar el lenguaje del mercado
Durante los primeros diez temas aprendimos a proteger el capital, comprender el riesgo y analizar la estructura del mercado. Ahora comenzaremos una de las herramientas más utilizadas por traders de todo el mundo: las velas japonesas.
Cada vela representa la información del precio durante un periodo determinado y permite observar cómo actuaron compradores y vendedores.
Aunque una sola vela no predice el futuro, puede aportar información útil cuando se analiza junto con el contexto del mercado.
¿Qué son las velas japonesas?
Las velas japonesas son una forma de representar gráficamente el movimiento del precio de un activo durante un periodo específico.
Cada vela muestra cuatro datos fundamentales:
Precio de aperturaPrecio de cierrePrecio máximoPrecio mínimo
Estos cuatro valores ayudan a entender cómo evolucionó el precio durante ese intervalo.
Partes de una vela
Una vela está formada por:
🟩 Cuerpo: representa la diferencia entre el precio de apertura y el precio de cierre.
⬆️ Mecha superior: muestra el precio más alto alcanzado.
⬇️ Mecha inferior: muestra el precio más bajo alcanzado.
Generalmente:
Una vela verde indica que el cierre fue superior a la apertura.
Una vela roja indica que el cierre fue inferior a la apertura.
¿Por qué son importantes?
Las velas japonesas ayudan a:
✅ Comprender el comportamiento del precio.
✅ Identificar zonas donde compradores o vendedores mostraron mayor fuerza.
✅ Complementar otros indicadores técnicos.
✅ Analizar el mercado con mayor detalle.
Ejemplo sencillo
Imagina que una vela abre en 100 USDT y cierra en 105 USDT.
Durante ese periodo el precio llegó a 107 USDT y cayó hasta 98 USDT antes de cerrar.
Toda esa información queda representada en una sola vela.
Errores comunes
❌ Creer que una sola vela confirma una tendencia.
❌ Ignorar el contexto del mercado.
❌ Operar únicamente por el color de una vela.
❌ No combinar el análisis con una adecuada gestión del riesgo.
Buenas prácticas
Analiza varias velas, no solo una.
Observa soportes y resistencias.Combina las velas con otros indicadores.Espera confirmaciones antes de abrir una operación.
Conclusión
Las velas japonesas son una herramienta fundamental para interpretar el comportamiento del mercado.
Aprender a leerlas correctamente puede ayudarte a comprender mejor la acción del precio y a tomar decisiones más informadas.
📘 En el Día 12/90 estudiaremos el Patrón Martillo (Hammer) y aprenderemos cómo identificar una posible señal de cambio de tendencia.
💬 Pregunta:
🤔 Cuando observas un gráfico, ¿sueles fijarte primero en las velas o en otros indicadores técnicos? ¿Por qué? 💬
#Trading #BinanceSquare #Candlestick #TradingEducation #TechnicalAnalysis
🕯️ Velas Japonesas: Aprende a interpretar el lenguaje del mercado
Durante los primeros diez temas aprendimos a proteger el capital, comprender el riesgo y analizar la estructura del mercado. Ahora comenzaremos una de las herramientas más utilizadas por traders de todo el mundo: las velas japonesas.
Cada vela representa la información del precio durante un periodo determinado y permite observar cómo actuaron compradores y vendedores.
Aunque una sola vela no predice el futuro, puede aportar información útil cuando se analiza junto con el contexto del mercado.
¿Qué son las velas japonesas?
Las velas japonesas son una forma de representar gráficamente el movimiento del precio de un activo durante un periodo específico.
Cada vela muestra cuatro datos fundamentales:
Precio de aperturaPrecio de cierrePrecio máximoPrecio mínimo
Estos cuatro valores ayudan a entender cómo evolucionó el precio durante ese intervalo.
Partes de una vela
Una vela está formada por:
🟩 Cuerpo: representa la diferencia entre el precio de apertura y el precio de cierre.
⬆️ Mecha superior: muestra el precio más alto alcanzado.
⬇️ Mecha inferior: muestra el precio más bajo alcanzado.
Generalmente:
Una vela verde indica que el cierre fue superior a la apertura.
Una vela roja indica que el cierre fue inferior a la apertura.
¿Por qué son importantes?
Las velas japonesas ayudan a:
✅ Comprender el comportamiento del precio.
✅ Identificar zonas donde compradores o vendedores mostraron mayor fuerza.
✅ Complementar otros indicadores técnicos.
✅ Analizar el mercado con mayor detalle.
Ejemplo sencillo
Imagina que una vela abre en 100 USDT y cierra en 105 USDT.
Durante ese periodo el precio llegó a 107 USDT y cayó hasta 98 USDT antes de cerrar.
Toda esa información queda representada en una sola vela.
Errores comunes
❌ Creer que una sola vela confirma una tendencia.
❌ Ignorar el contexto del mercado.
❌ Operar únicamente por el color de una vela.
❌ No combinar el análisis con una adecuada gestión del riesgo.
Buenas prácticas
Analiza varias velas, no solo una.
Observa soportes y resistencias.Combina las velas con otros indicadores.Espera confirmaciones antes de abrir una operación.
Conclusión
Las velas japonesas son una herramienta fundamental para interpretar el comportamiento del mercado.
Aprender a leerlas correctamente puede ayudarte a comprender mejor la acción del precio y a tomar decisiones más informadas.
📘 En el Día 12/90 estudiaremos el Patrón Martillo (Hammer) y aprenderemos cómo identificar una posible señal de cambio de tendencia.
💬 Pregunta:
🤔 Cuando observas un gráfico, ¿sueles fijarte primero en las velas o en otros indicadores técnicos? ¿Por qué? 💬
#Trading #BinanceSquare #Candlestick #TradingEducation #TechnicalAnalysis
1
92

Day 58: Understanding Price Action From Scratch
Part 8: Basic #Candlestick Pattern - Spinning Top
#Priceaction
#Crypto
Day 58: Understanding Price Action From Scratch
Part 8: Basic #Candlestick Pattern - Spinning Top
#Priceaction
#Crypto
Part 8: Basic #Candlestick Pattern - Spinning Top
#Priceaction
#Crypto
29

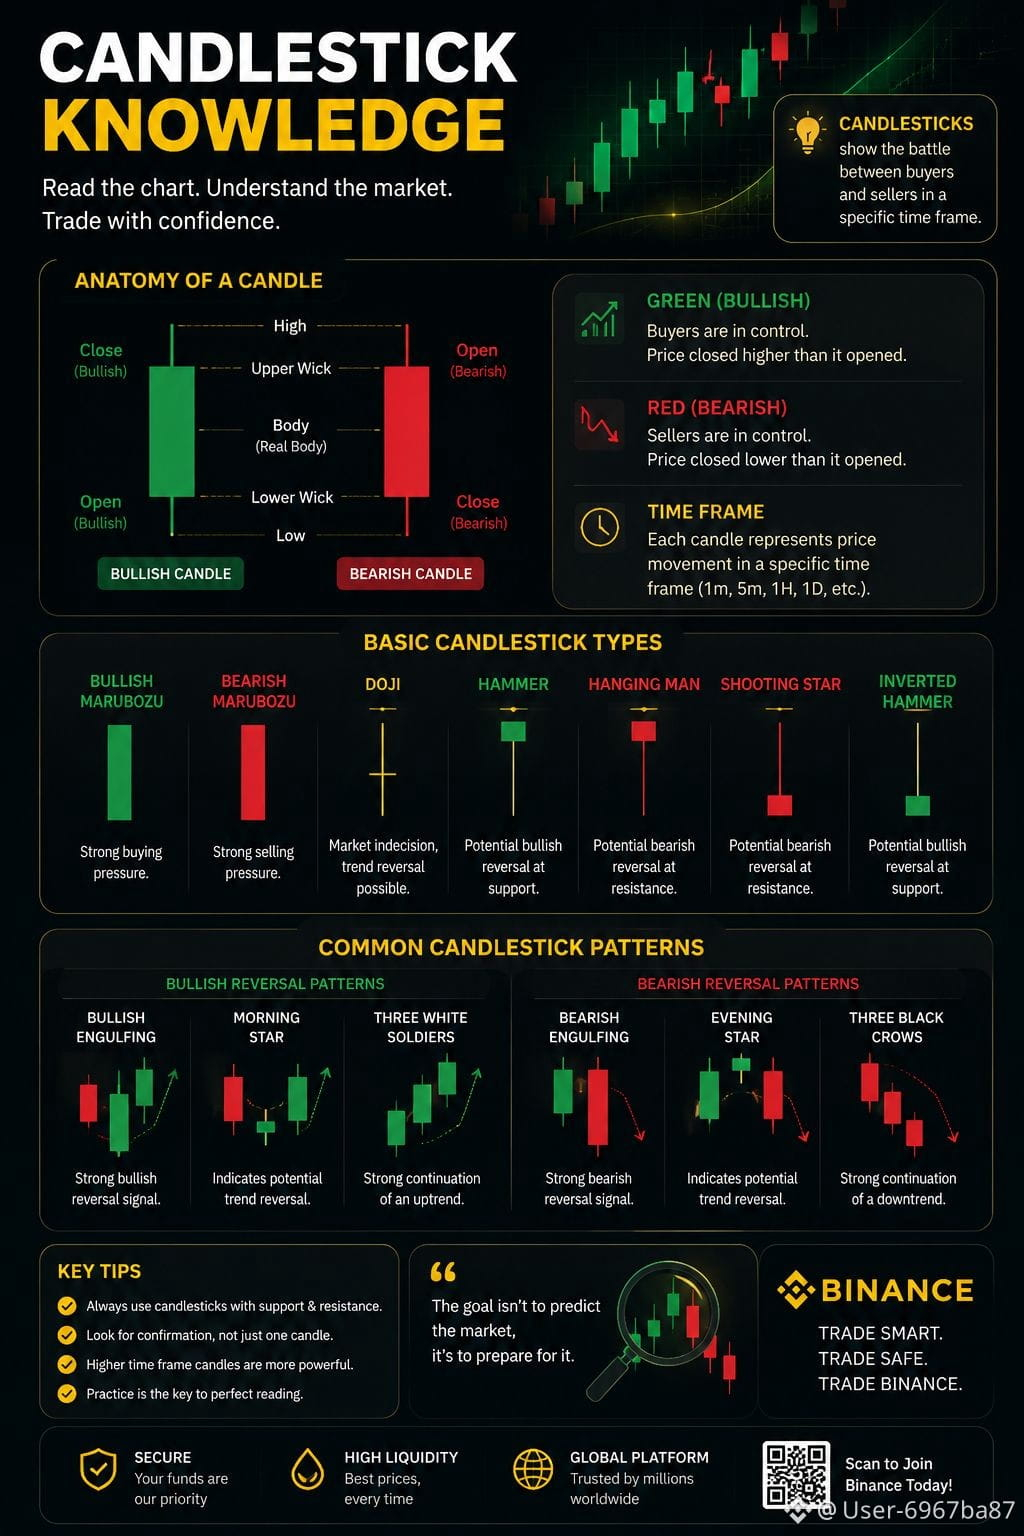
predicting the future with certainty—it is about understanding market behavior, managing risk, and preparing for better trading opportunities
Every candlestick tells a story. 🕯️📈 Understanding candlestick patterns helps traders analyze the battle between buyers and sellers, identify market momentum, spot potential reversals, and make more informed trading decisions.
🔹 Big candles can show strong momentum
🔹 Long wicks may indicate price rejection
🔹 Doji candles often show market indecision
🔹 Multiple candles can provide confirmation
🔹 Always follow the trend and wait for confirmation
#candlestick #candlestick_patterns #candle #CandleStory #CryptoPatience
109

Статья
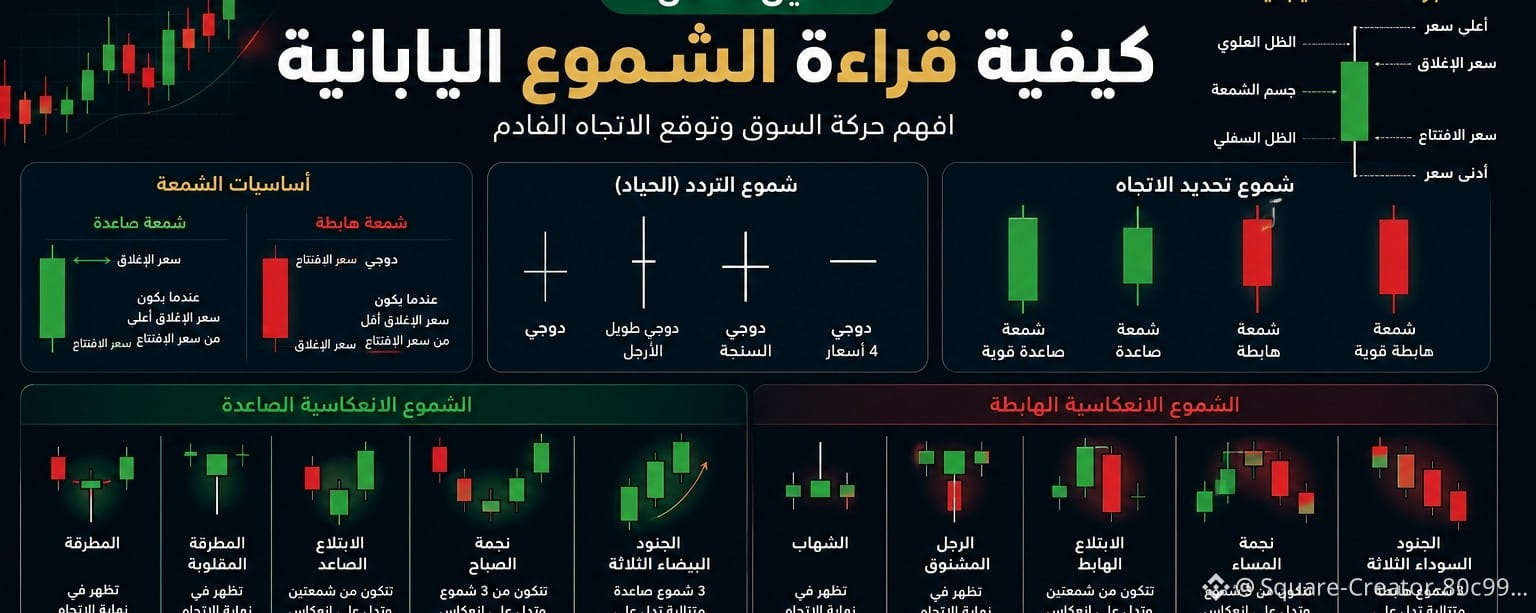
كيف تقرأ الشموع اليابانية؟ الدليل الذي يحتاجه كل متداول؟ هل تبحث عن لغة فهم السوق وإتجاه العملة 💯💯إذا كنت تنظر إلى الرسم البياني وترى عشرات الشموع الحمراء والخضراء دون أن تفهم معناها، فأنت تفوت أهم لغة يتحدث بها السوق.
الشموع اليابانية ليست مجرد أشكال، بل هي تمثيل مباشر للصراع بين المشترين والبائعين خلال فترة زمنية محددة. وكل شمعة تخبرك قصة مختلفة عن قوة السوق أو ضعفه.
مكونات الشمعة اليابانية
كل شمعة تتكون من أربعة عناصر:
🔹 سعر الافتتاح
🔹 سعر الإغلاق
🔹 أعلى سعر
🔹 أدنى سعر
إذا أغلق السعر أعلى من الافتتاح تكون الشمعة صاعدة.
إذا أغلق السعر أقل من الافتتاح تكون الشمعة هابطة.
أهم الشموع الانعكاسية
١- المطرقة (Hammer)
تظهر غالباً بعد هبوط.
مميزاتها:
جسم صغير
ذيل سفلي طويل
ظل علوي قصير أو معدوم
ماذا تعني؟
البائعون دفعوا السعر للأسفل، لكن المشترين عادوا بقوة وأغلقوا السعر بالقرب من القمة.
إشارة محتملة على انتهاء الهبوط.
٢- المطرقة المقلوبة (Inverted Hammer)
تظهر بعد اتجاه هابط.
تشير إلى محاولة المشترين استعادة السيطرة وقد تكون بداية انعكاس صاعد.
٣- الشهاب (Shooting Star)
تظهر بعد صعود.
تدل على رفض الأسعار المرتفعة واحتمال بداية تصحيح أو هبوط.
٤- الرجل المشنوق (Hanging Man)
تظهر قرب قمم السوق.
تشبه المطرقة شكلياً ولكن موقعها مختلف.
قد تكون إشارة تحذيرية على ضعف المشترين.
أهم النماذج الثنائية
الابتلاع الشرائي (Bullish Engulfing)
شمعة صاعدة كبيرة تبتلع بالكامل الشمعة الهابطة السابقة.
تعتبر من أقوى إشارات الصعود.
الابتلاع البيعي (Bearish Engulfing)
شمعة هابطة كبيرة تبتلع بالكامل الشمعة الصاعدة السابقة.
تعتبر من أقوى إشارات الهبوط.
شموع الحيرة
الدوجي (Doji)
سعر الافتتاح قريب جداً من سعر الإغلاق.
تشير إلى توازن بين المشترين والبائعين.
عند ظهورها قرب القمم أو القيعان تستحق الانتباه.
قاعدة مهمة جداً
لا تعتمد على الشمعة وحدها.
يجب دائماً التأكد من:
✔ الدعم والمقاومة
✔ حجم التداول
✔ الاتجاه العام
✔ المؤشرات الفنية
لأن أقوى الإشارات هي التي تتفق فيها عدة عوامل معا.
#Binance
#candlestick
#تعليم_تداول _ $BTC
كيف تقرأ الشموع اليابانية؟ الدليل الذي يحتاجه كل متداول؟ هل تبحث عن لغة فهم السوق وإتجاه العملة 💯💯
إذا كنت تنظر إلى الرسم البياني وترى عشرات الشموع الحمراء والخضراء دون أن تفهم معناها، فأنت تفوت أهم لغة يتحدث بها السوق.
الشموع اليابانية ليست مجرد أشكال، بل هي تمثيل مباشر للصراع بين المشترين والبائعين خلال فترة زمنية محددة. وكل شمعة تخبرك قصة مختلفة عن قوة السوق أو ضعفه.
مكونات الشمعة اليابانية
كل شمعة تتكون من أربعة عناصر:
🔹 سعر الافتتاح
🔹 سعر الإغلاق
🔹 أعلى سعر
🔹 أدنى سعر
إذا أغلق السعر أعلى من الافتتاح تكون الشمعة صاعدة.
إذا أغلق السعر أقل من الافتتاح تكون الشمعة هابطة.
أهم الشموع الانعكاسية
١- المطرقة (Hammer)
تظهر غالباً بعد هبوط.
مميزاتها:
جسم صغير
ذيل سفلي طويل
ظل علوي قصير أو معدوم
ماذا تعني؟
البائعون دفعوا السعر للأسفل، لكن المشترين عادوا بقوة وأغلقوا السعر بالقرب من القمة.
إشارة محتملة على انتهاء الهبوط.
٢- المطرقة المقلوبة (Inverted Hammer)
تظهر بعد اتجاه هابط.
تشير إلى محاولة المشترين استعادة السيطرة وقد تكون بداية انعكاس صاعد.
٣- الشهاب (Shooting Star)
تظهر بعد صعود.
تدل على رفض الأسعار المرتفعة واحتمال بداية تصحيح أو هبوط.
٤- الرجل المشنوق (Hanging Man)
تظهر قرب قمم السوق.
تشبه المطرقة شكلياً ولكن موقعها مختلف.
قد تكون إشارة تحذيرية على ضعف المشترين.
أهم النماذج الثنائية
الابتلاع الشرائي (Bullish Engulfing)
شمعة صاعدة كبيرة تبتلع بالكامل الشمعة الهابطة السابقة.
تعتبر من أقوى إشارات الصعود.
الابتلاع البيعي (Bearish Engulfing)
شمعة هابطة كبيرة تبتلع بالكامل الشمعة الصاعدة السابقة.
تعتبر من أقوى إشارات الهبوط.
شموع الحيرة
الدوجي (Doji)
سعر الافتتاح قريب جداً من سعر الإغلاق.
تشير إلى توازن بين المشترين والبائعين.
عند ظهورها قرب القمم أو القيعان تستحق الانتباه.
قاعدة مهمة جداً
لا تعتمد على الشمعة وحدها.
يجب دائماً التأكد من:
✔ الدعم والمقاومة
✔ حجم التداول
✔ الاتجاه العام
✔ المؤشرات الفنية
لأن أقوى الإشارات هي التي تتفق فيها عدة عوامل معا.
#Binance
#candlestick
#تعليم_تداول _ $BTC
2
196

$SHELL — 0.0255 left a large upper wick on the daily candle
The completed $SHELL daily candle recorded a significant difference between its session high and closing price.
📊 Daily candle: High: 0.0255 Close: 0.0211 Low: 0.0189
The difference between the 0.0255 high and the 0.0211 close is approximately 17.25% when measured from the session high.
Price opened at 0.0191 and still closed higher at 0.0211, but did not retain most of the move reached at the intraday peak.
Session volume reached approximately 170.62M SHELL.
The large upper wick records substantial two-way volatility during the session but does not by itself determine the direction of subsequent candles.
#SHELL #Candlestick #PriceAction #Binance
45
Войдите, чтобы посмотреть больше материала
Присоединяйтесь к пользователям криптовалют по всему миру на Binance Square
⚡️ Получайте новейшую и полезную информацию о криптоактивах.
💬 Нам доверяет крупнейшая в мире криптобиржа.
👍 Получите достоверные аналитические данные от верифицированных создателей контента.
Эл. почта/номер телефона
В тренде
1
#EarningsSeason
Просмотров: 6.6M
33,149 обсуждают
2
#USMidtermElections
Просмотров: 85,870
1,138 обсуждают
3
#StrategySTRCReaches$99.95ForFirstTimeIn165Days
Просмотров: 730
33 обсуждают
4
#BinanceWillListPredictPREDICT
Просмотров: 12,210
379 обсуждают
5
#SwitzerlandFirstSpotBitcoinETFExpectedToTradeInNovember
Просмотров: 832
49 обсуждают
6
#StrategyReports$21BQ3OperatingProfit
Просмотров: 704
32 обсуждают
7
#TwoAddressesHoldingAbout1.28BUSDTFrozen
Просмотров: 4,427
187 обсуждают
8
#FirstDigitalBlacklistsAttackerAddressHoldingAbout3.4MFDUSD
Просмотров: 251
13 обсуждают
9
#BitcoinDropsBelow$80K
Просмотров: 61,433
160 обсуждают
10
#BoEOpensConsultationOnTokenizedCollateralForClearing
Просмотров: 2,169
48 обсуждают