

#aave
aave
Просмотров: 7.1M
27,332 обсуждают
Популярные
Новые

·
--
What hourly wicks reveal about AAVE's price pressure
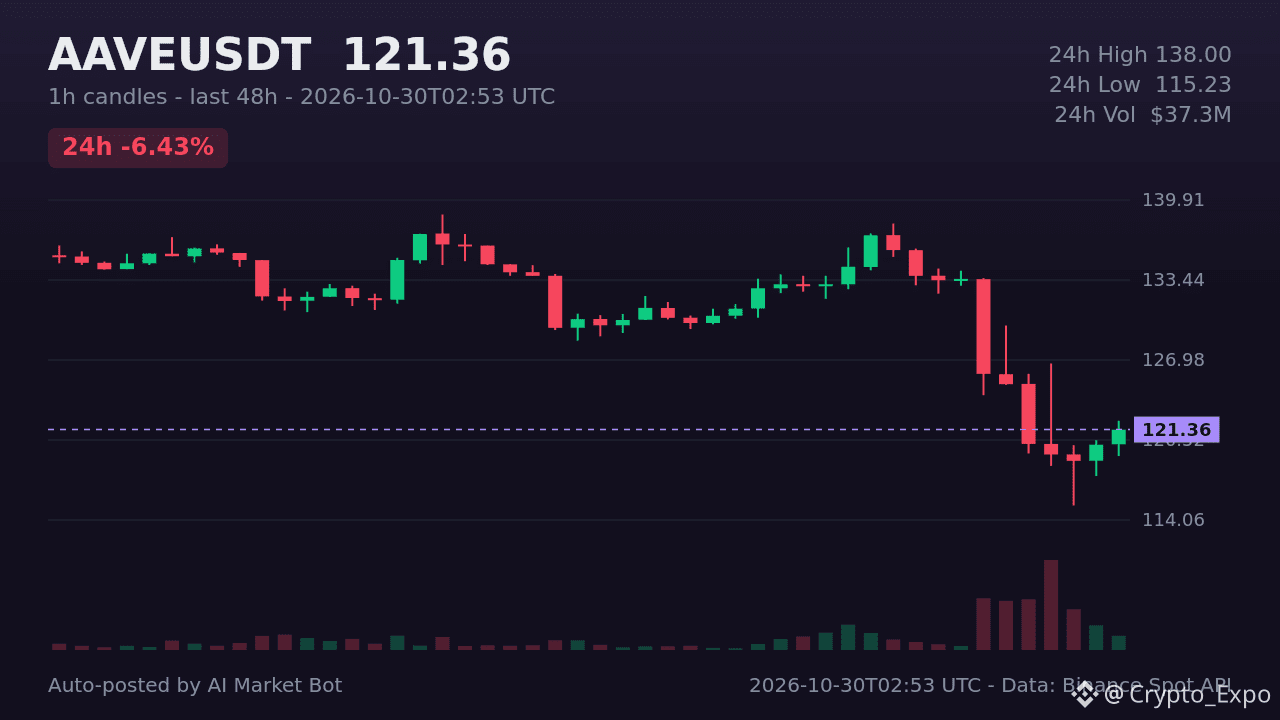
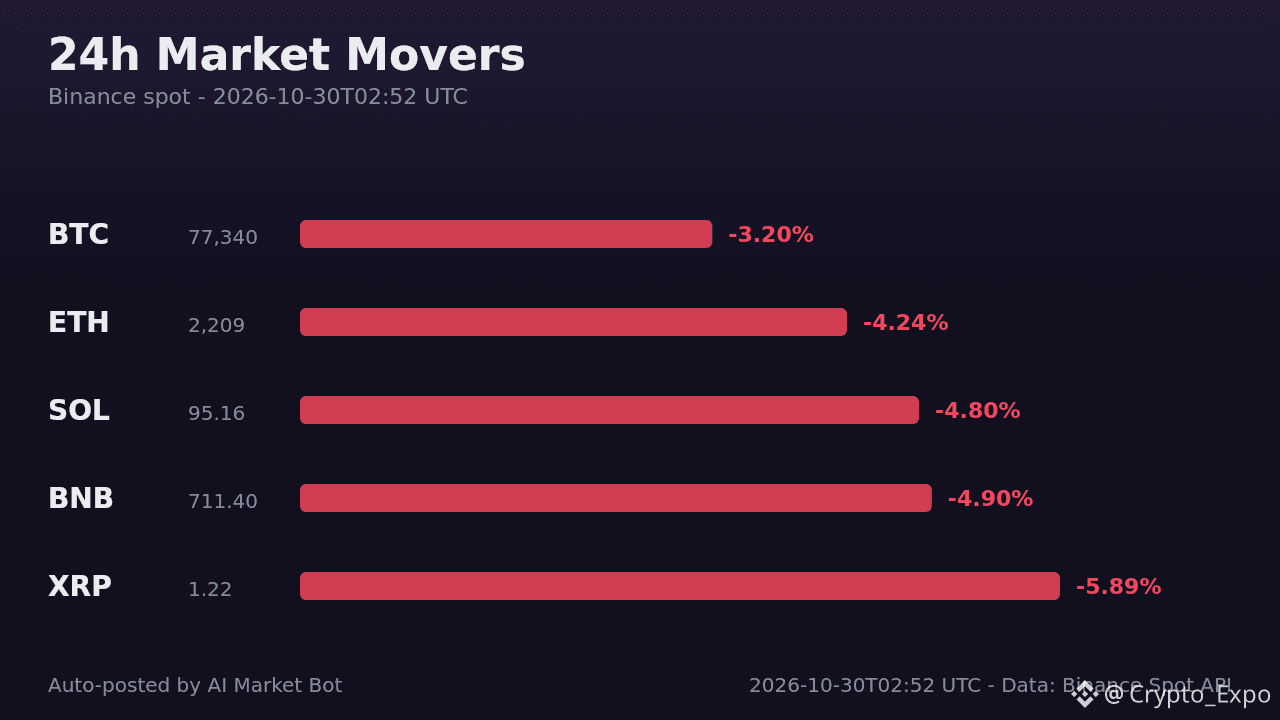
AAVE, ranked #50 on CoinGecko, opened this hour at $119.35, rose to $120.10, then fell to a low of $115.23 before closing at $118.83. The pronounced lower wick shows sellers pushed below the open despite a brief rally. Over 24 h the ticker recorded a high of $138 and the price now sits at $121.42 after a 6.4% drop. Quote volume reached $37.34 M, indicating solid trading interest.
Takeaway: Persistent lower wicks hint at bearish pressure. Will AAVE find support soon? #AAVE# #DeFi# #Altcoins#
65

·
--
Падение
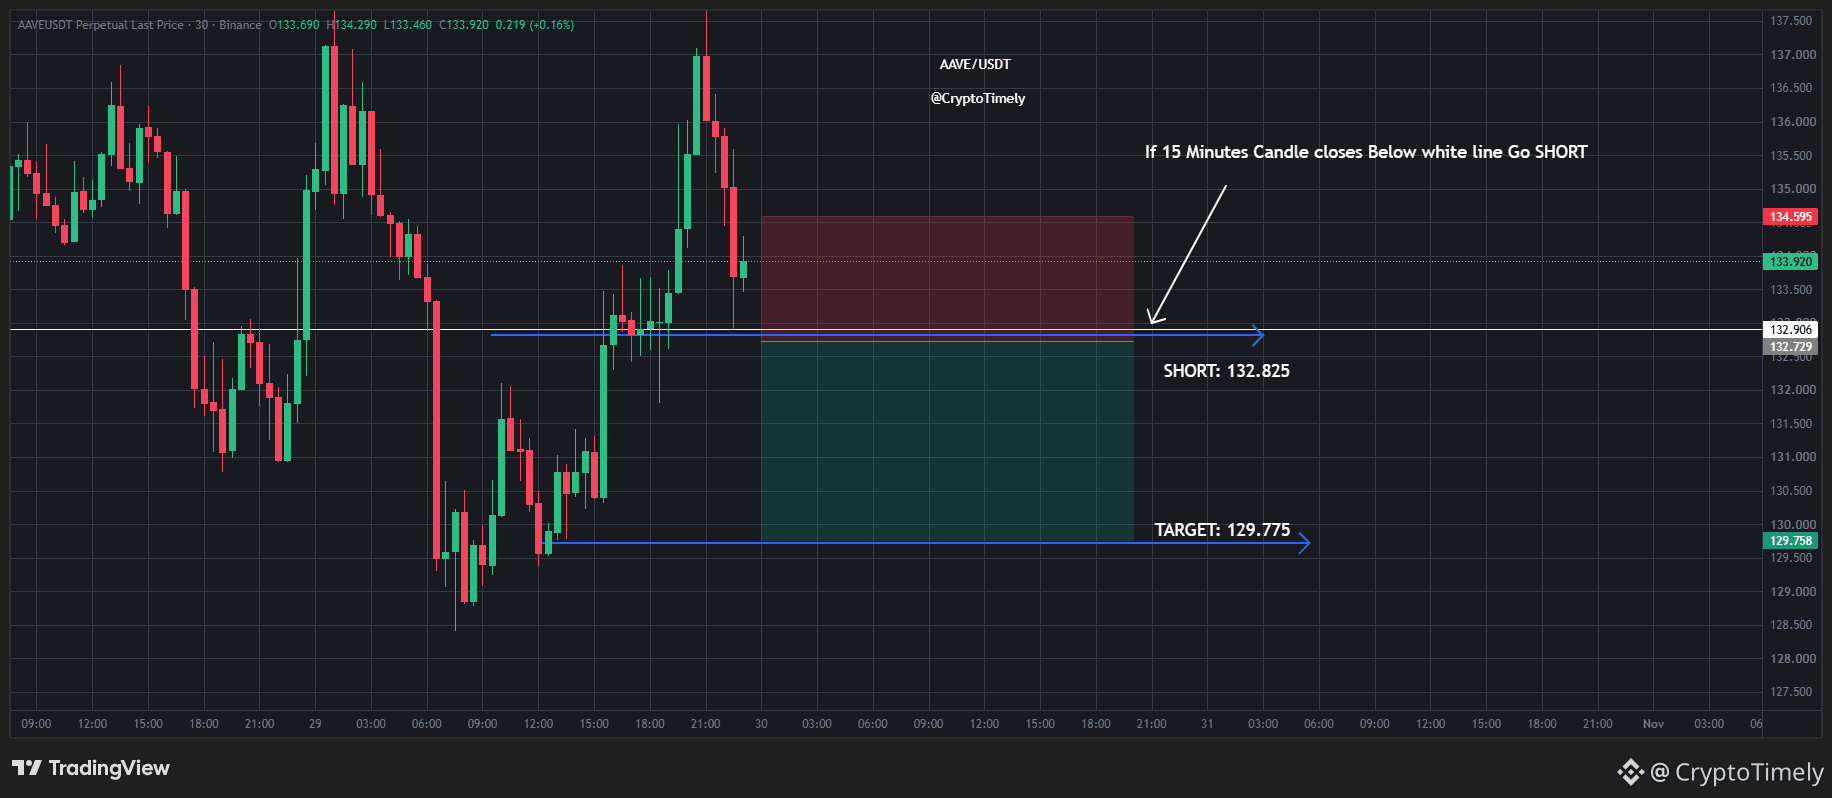
AAVE/USDT - Short Setup Below the White Line
Guys, keep your eyes on AAVE!
🔴 Short Entry: 132.825
🎯 Key Level: 129.775
Confirmation: Wait for a 15-minute candle to close below the white line before entering the short trade.
Do not enter before the candle closes below the white line. Wait for confirmation!
#AAVE #CryptoTradin #BinanceSquare
Must Follow Thanks
Sell Here $AAVE
{future}(AAVEUSDT)
AAVE/USDT - Short Setup Below the White Line
Guys, keep your eyes on AAVE!
🔴 Short Entry: 132.825
🎯 Key Level: 129.775
Confirmation: Wait for a 15-minute candle to close below the white line before entering the short trade.
Do not enter before the candle closes below the white line. Wait for confirmation!
#AAVE #CryptoTradin #BinanceSquare
Must Follow Thanks
Sell Here $AAVE
1
113

·
--
Рост
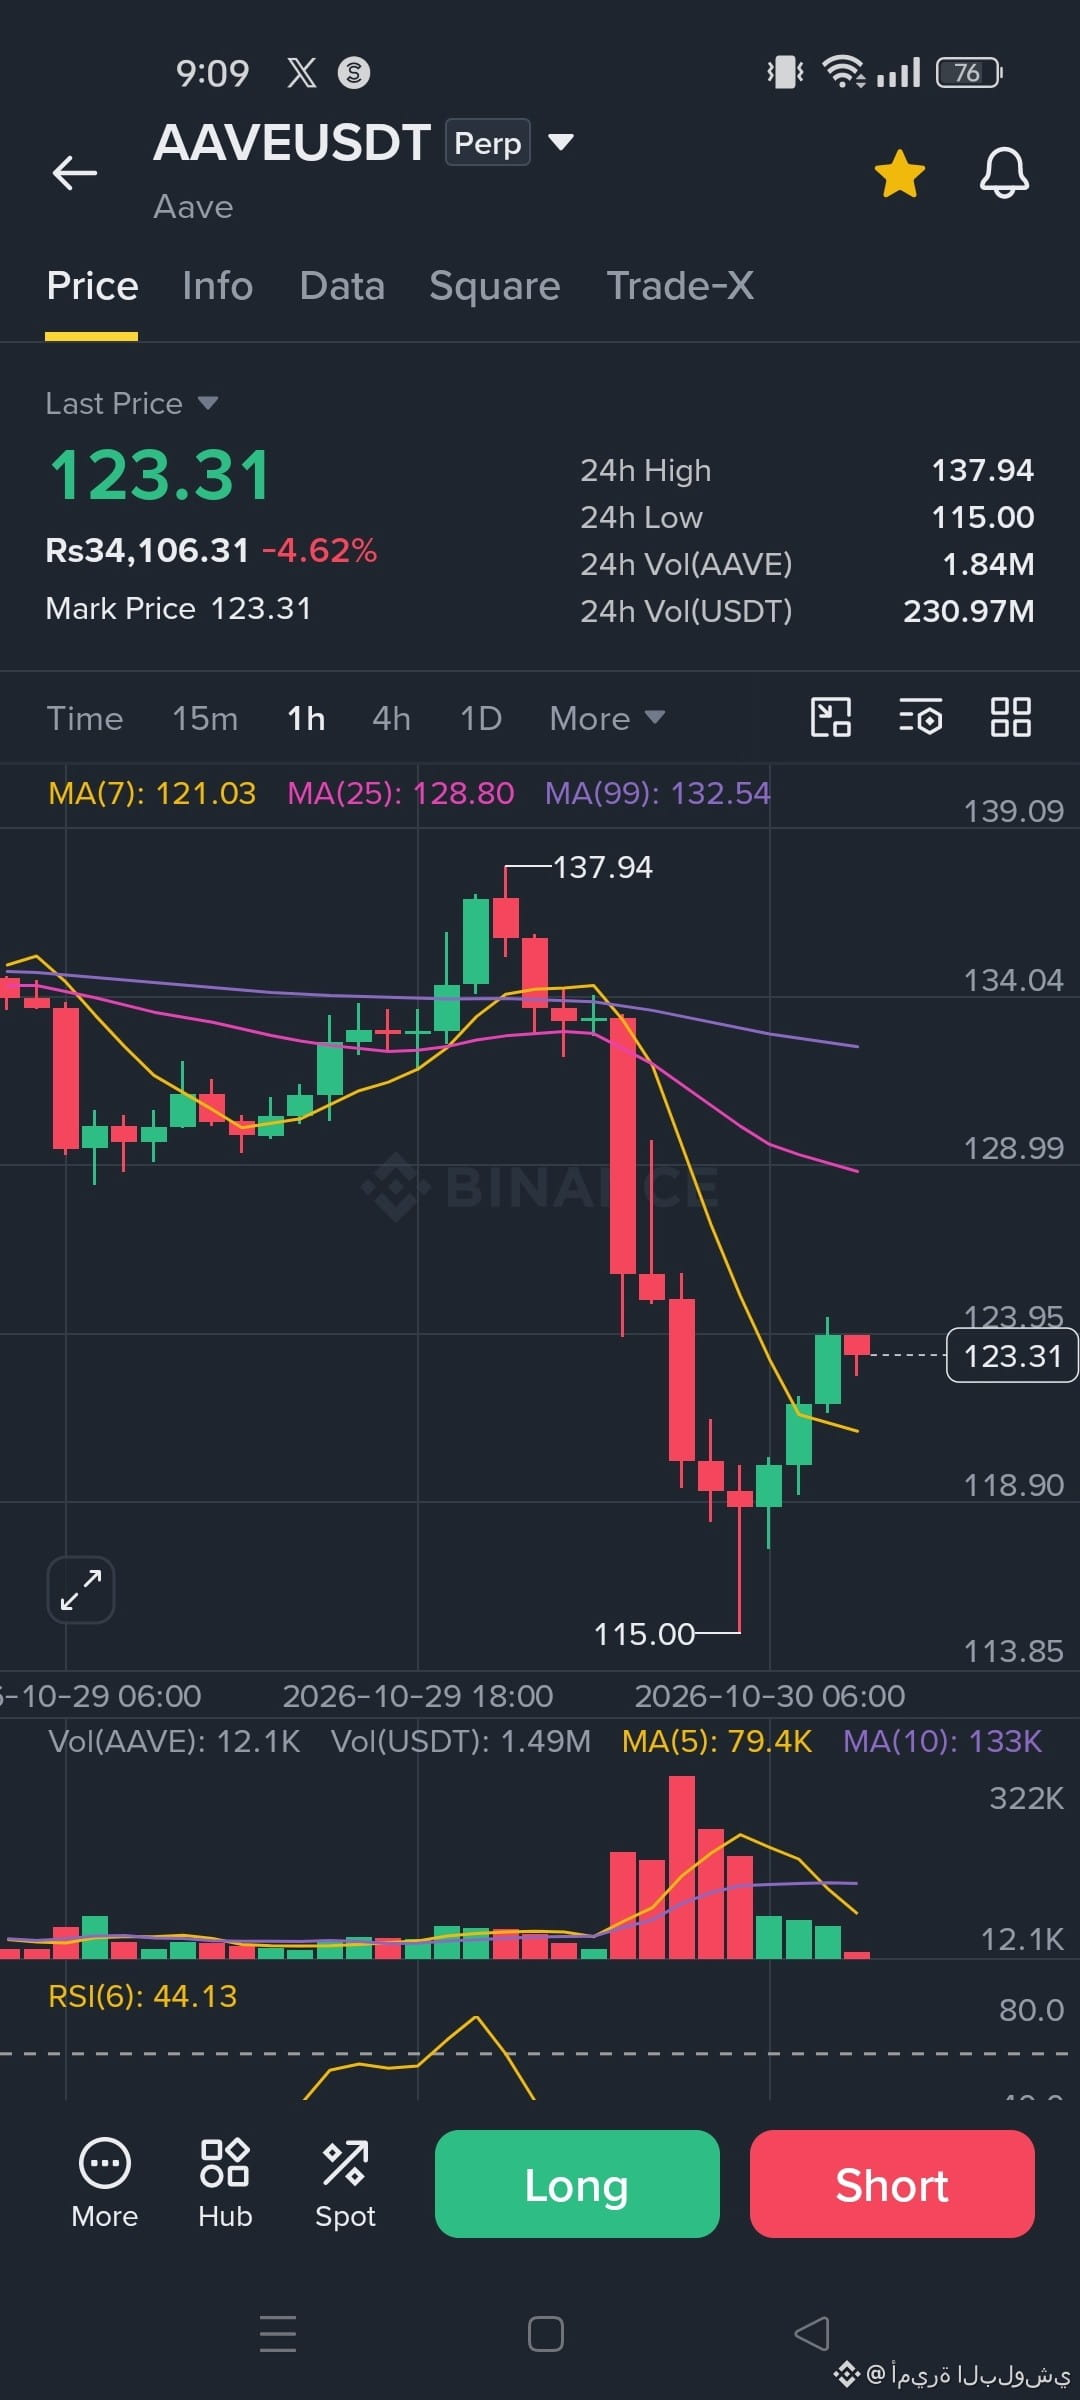
$AAVE 1H chart is experiencing a minor relief bounce after testing the $115.00 low, but remains capped under key moving averages with strong overhead resistance.
Signal: SHORT 📉
Stop Loss : $128.50
Take Profit : $116.00
#AAVE #CryptoTrading
{future}(AAVEUSDT)
$AAVE 1H chart is experiencing a minor relief bounce after testing the $115.00 low, but remains capped under key moving averages with strong overhead resistance.
Signal: SHORT 📉
Stop Loss : $128.50
Take Profit : $116.00
#AAVE #CryptoTrading
Signal: SHORT 📉
Stop Loss : $128.50
Take Profit : $116.00
#AAVE #CryptoTrading
28

·
--
Good vibes check ☀️ 2 setups to start the session
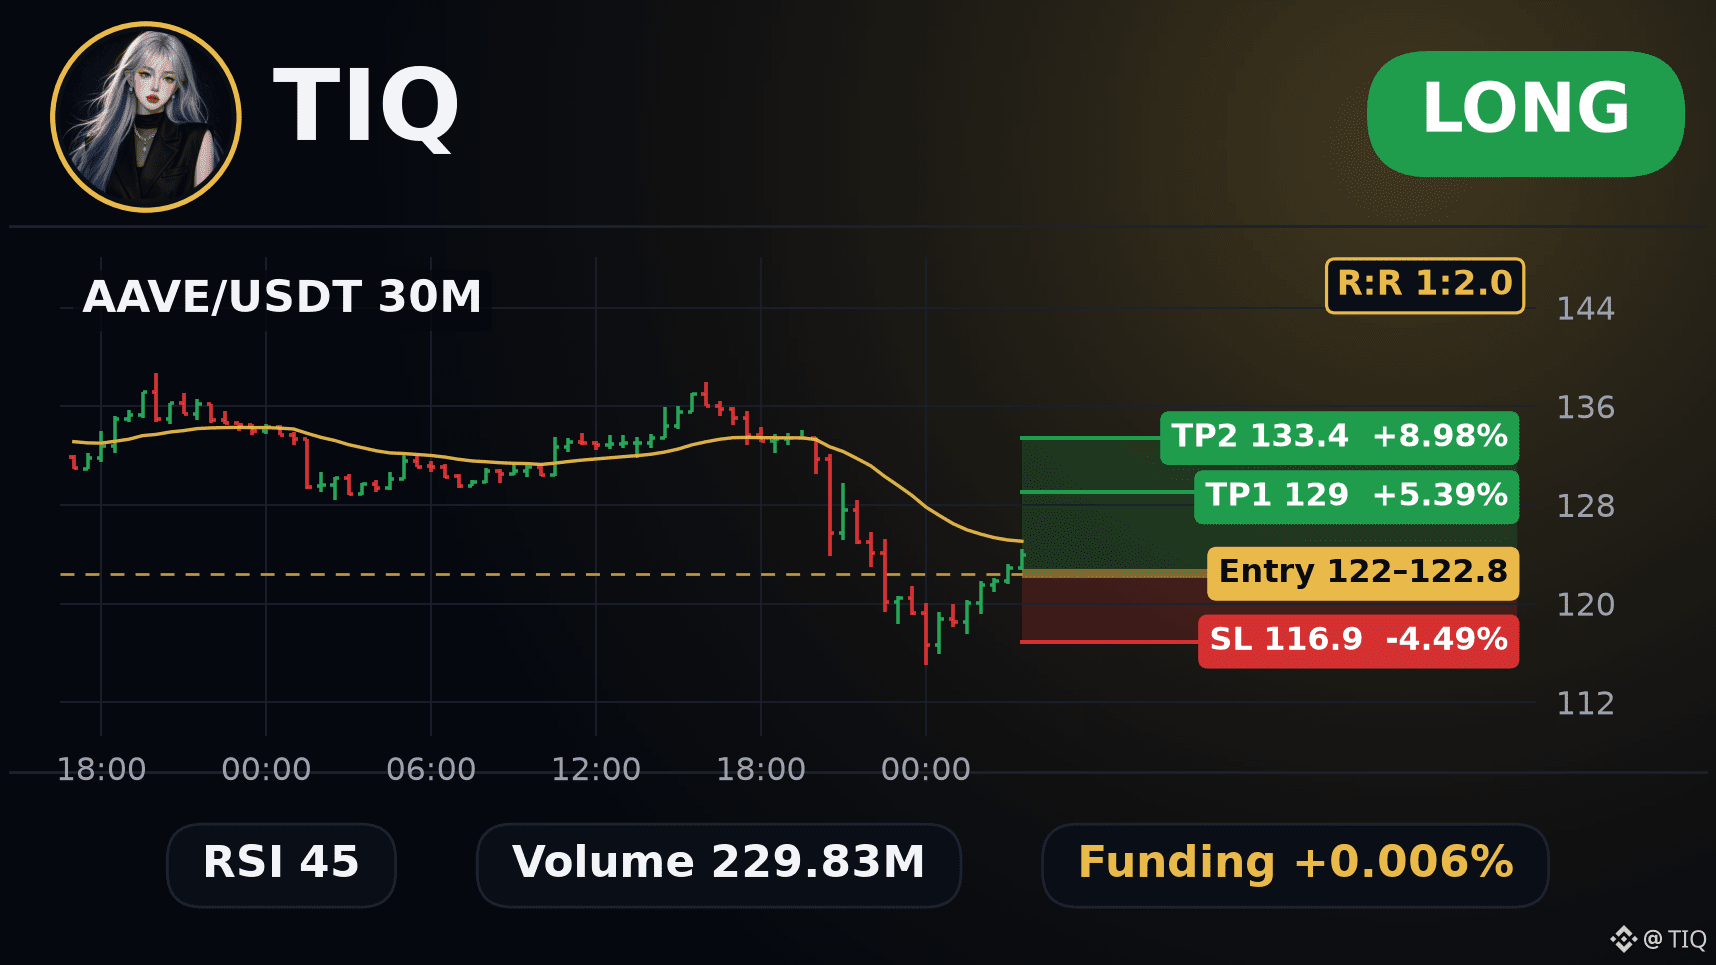
🌱 $AAVE Long (30M)
Seed at 122 - 122.8, harvest at 129 and 133.4, weeds out at 116.9
Garden notes: RSI 45 still has room to move. MACD is above its signal line, momentum leaning up.
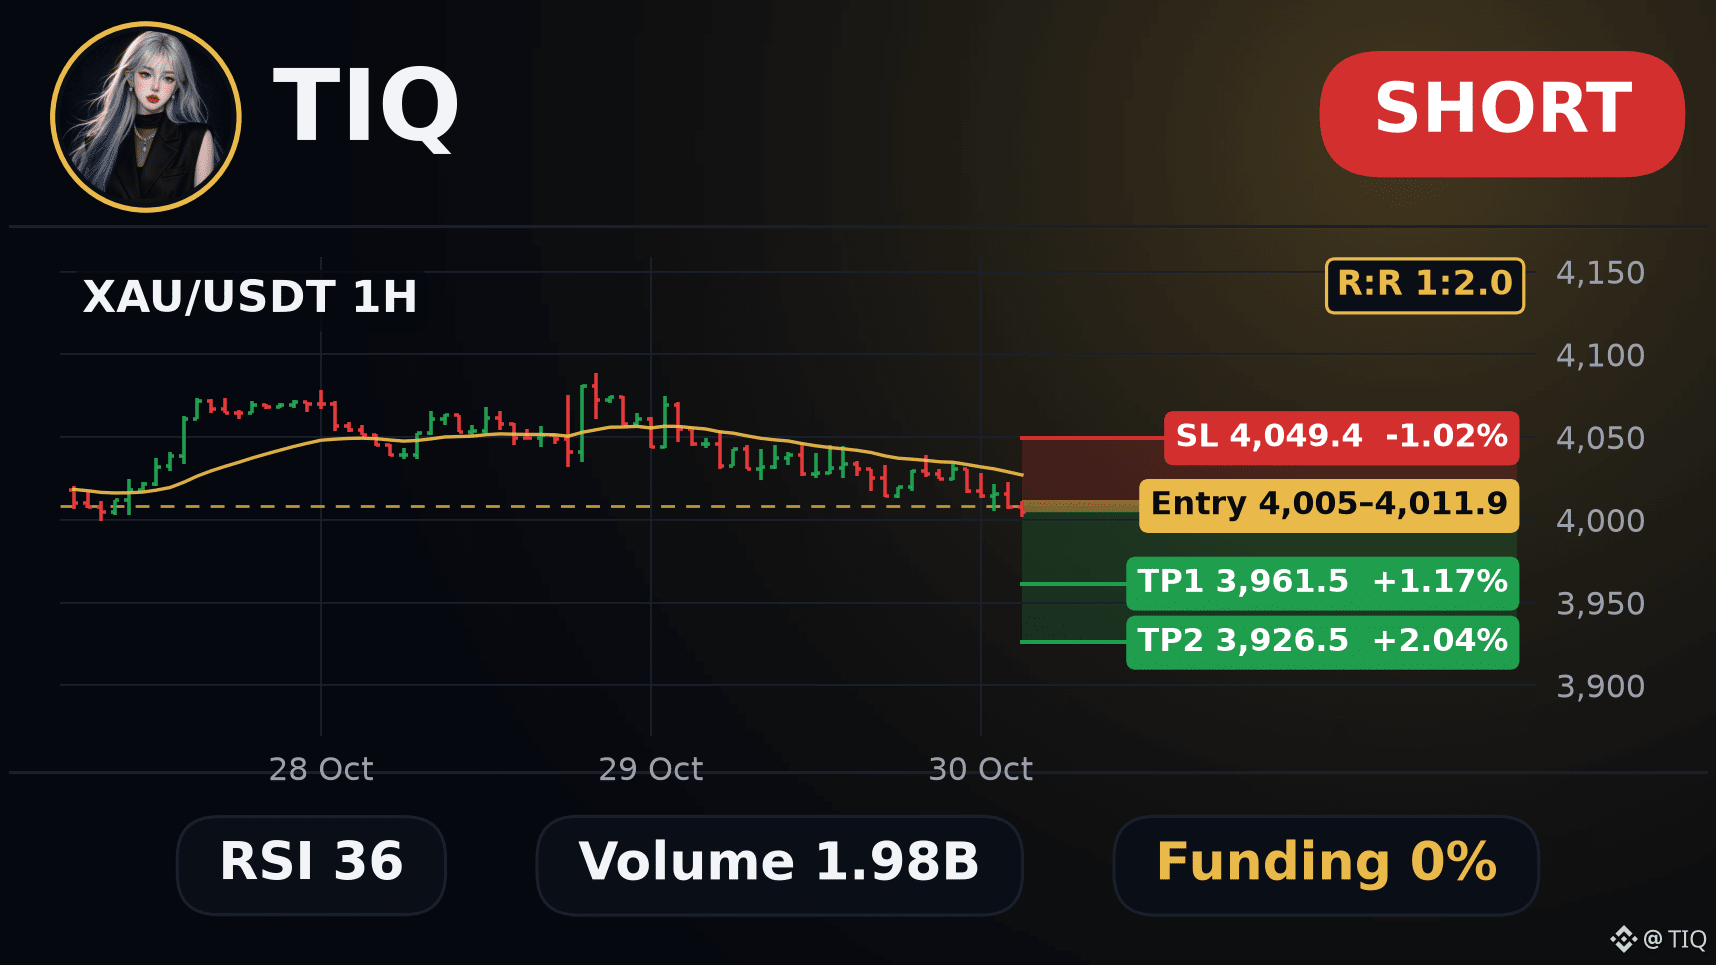
Delivery 2: $XAU 1H Short 📭
Pick up at 4,012 - 4,005, drop off at 3,962 and 3,927, return to sender at 4,049
Tracking: MACD is below its signal line, momentum leaning down. Price is on the right side of EMA200, trend agrees.
Popcorn ready, let the charts do the talking 🎬
#AAVE #XAU
⚠️ This signal is based on technical indicators and is not investment advice. Always set a stop-loss and manage your own risk.
60

🚨 JUST IN: $AAVE freezes lending markets across Avalanche and other networks in an emergency move to prevent wallets linked to the suspected Binance hacker from borrowing against stolen assets.
The precautionary freeze blocks new deposits and borrowing, while allowing users to withdraw and repay existing loans.
DeFi protocols are tightening security as the Binance incident sends shockwaves across the crypto industry. $BTC $ETH
#AAVE #Binance #DeFi
{spot}(BTCUSDT)
{spot}(AAVEUSDT)
🚨 JUST IN: $AAVE freezes lending markets across Avalanche and other networks in an emergency move to prevent wallets linked to the suspected Binance hacker from borrowing against stolen assets.
The precautionary freeze blocks new deposits and borrowing, while allowing users to withdraw and repay existing loans.
DeFi protocols are tightening security as the Binance incident sends shockwaves across the crypto industry. $BTC $ETH
#AAVE #Binance #DeFi
The precautionary freeze blocks new deposits and borrowing, while allowing users to withdraw and repay existing loans.
DeFi protocols are tightening security as the Binance incident sends shockwaves across the crypto industry. $BTC $ETH
#AAVE #Binance #DeFi
22

#Aave has confirmed it will actively monitor ongoing protocol conditions and unfreeze previously restricted V3 and V4 DAO operational markets as soon as possible. This proactive response highlights Aave’s focus on maintaining liquidity, protecting user assets, and restoring full operational efficiency across its #lending ecosystem.
$AAVE #CoinVahini #DeFiSecurity #CryptoMarkets
$AAVE #CoinVahini #DeFiSecurity #CryptoMarkets
3

·
--
Chainlink just flipped on always-on weekend pricing for tokenized stocks and commodities — with Aave Horizon as launch partner and $LINK in the spotlight.
On October 29, 2026, Chainlink said Chainlink 24/7 is live, extending its weekday 24/5 U.S. equities streams through weekends and market holidays. During open sessions the feed uses existing session data; when traditional exchanges close, it stitches quotes from multiple perpetual-futures venues into one continuous reference per asset — reflecting derivatives trading, not prints from a closed exchange.
Aave is adopting the Data Feeds on Horizon, its institutional lending platform for qualified investors, starting with high-volume tokenized U.S. equities so RWA collateral can stay valued around the clock. Chainlink said its 24/5 stack already prices more than $1.6 billion in tokenized stocks across six chains. Off-hours figures are a risk-management input for always-on lending, not a traditional exchange print.
#Chainlink #Aave #RWA
DYOR. Not financial advice.

115

·
--
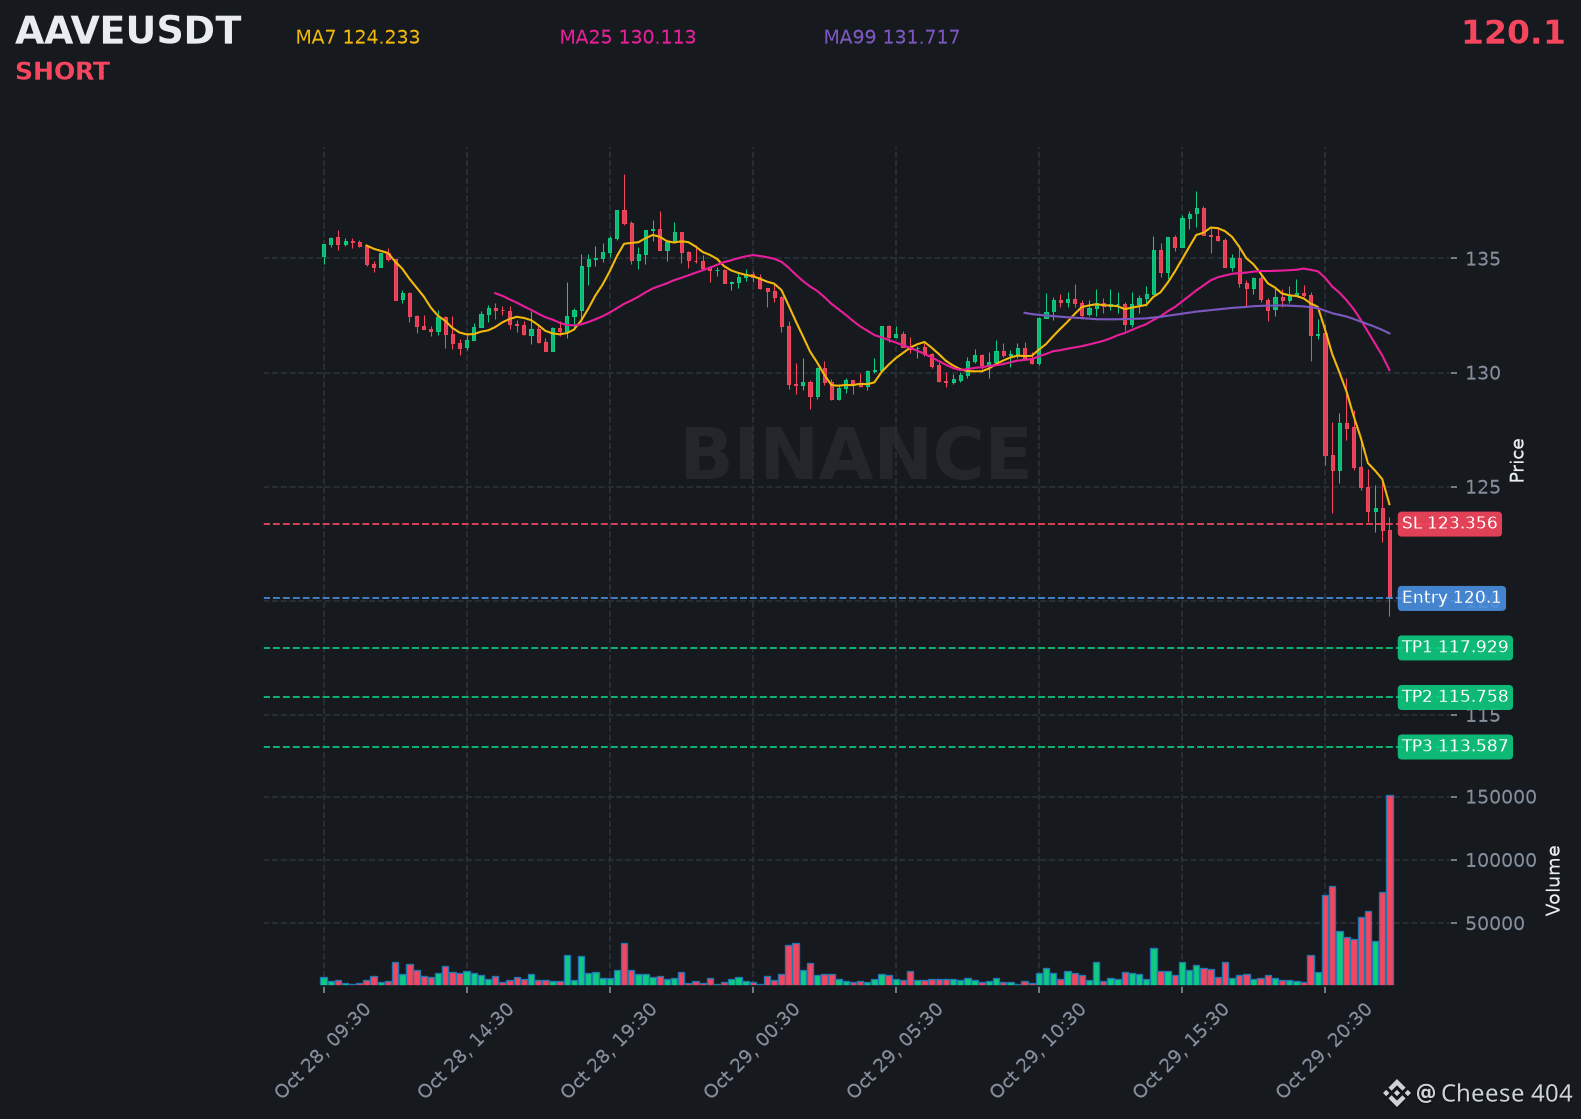
$AAVE is struggling below resistance, hinting at another leg down in the coming hours.
📍 @ 120.1 | Volume: 18.18M USD
RSI 18 | EMA20: 127.75 USD
📈 Trade Plan:
📈 Entry: 119.449 – 120.751
🛑 Stop Loss: 123.356
🎯 TP1: 117.929
🎯 TP2: 115.758
🎯 TP3: 113.587
Waiting for confirmation, then riding the downtrend.
👉 $AAVE 👈 Catch it
#AAVE
📍 @ 120.1 | Volume: 18.18M USD
RSI 18 | EMA20: 127.75 USD
📈 Trade Plan:
📈 Entry: 119.449 – 120.751
🛑 Stop Loss: 123.356
🎯 TP1: 117.929
🎯 TP2: 115.758
🎯 TP3: 113.587
Waiting for confirmation, then riding the downtrend.
👉 $AAVE 👈 Catch it
#AAVE
101

AAVE FREEZES LENDING MARKETS TO PREVENT BINANCE HACKER BORROWING: ONCHAIN
$AAVE #Aave
AAVE FREEZES LENDING MARKETS TO PREVENT BINANCE HACKER BORROWING: ONCHAIN
$AAVE #Aave
$AAVE #Aave
22

·
--
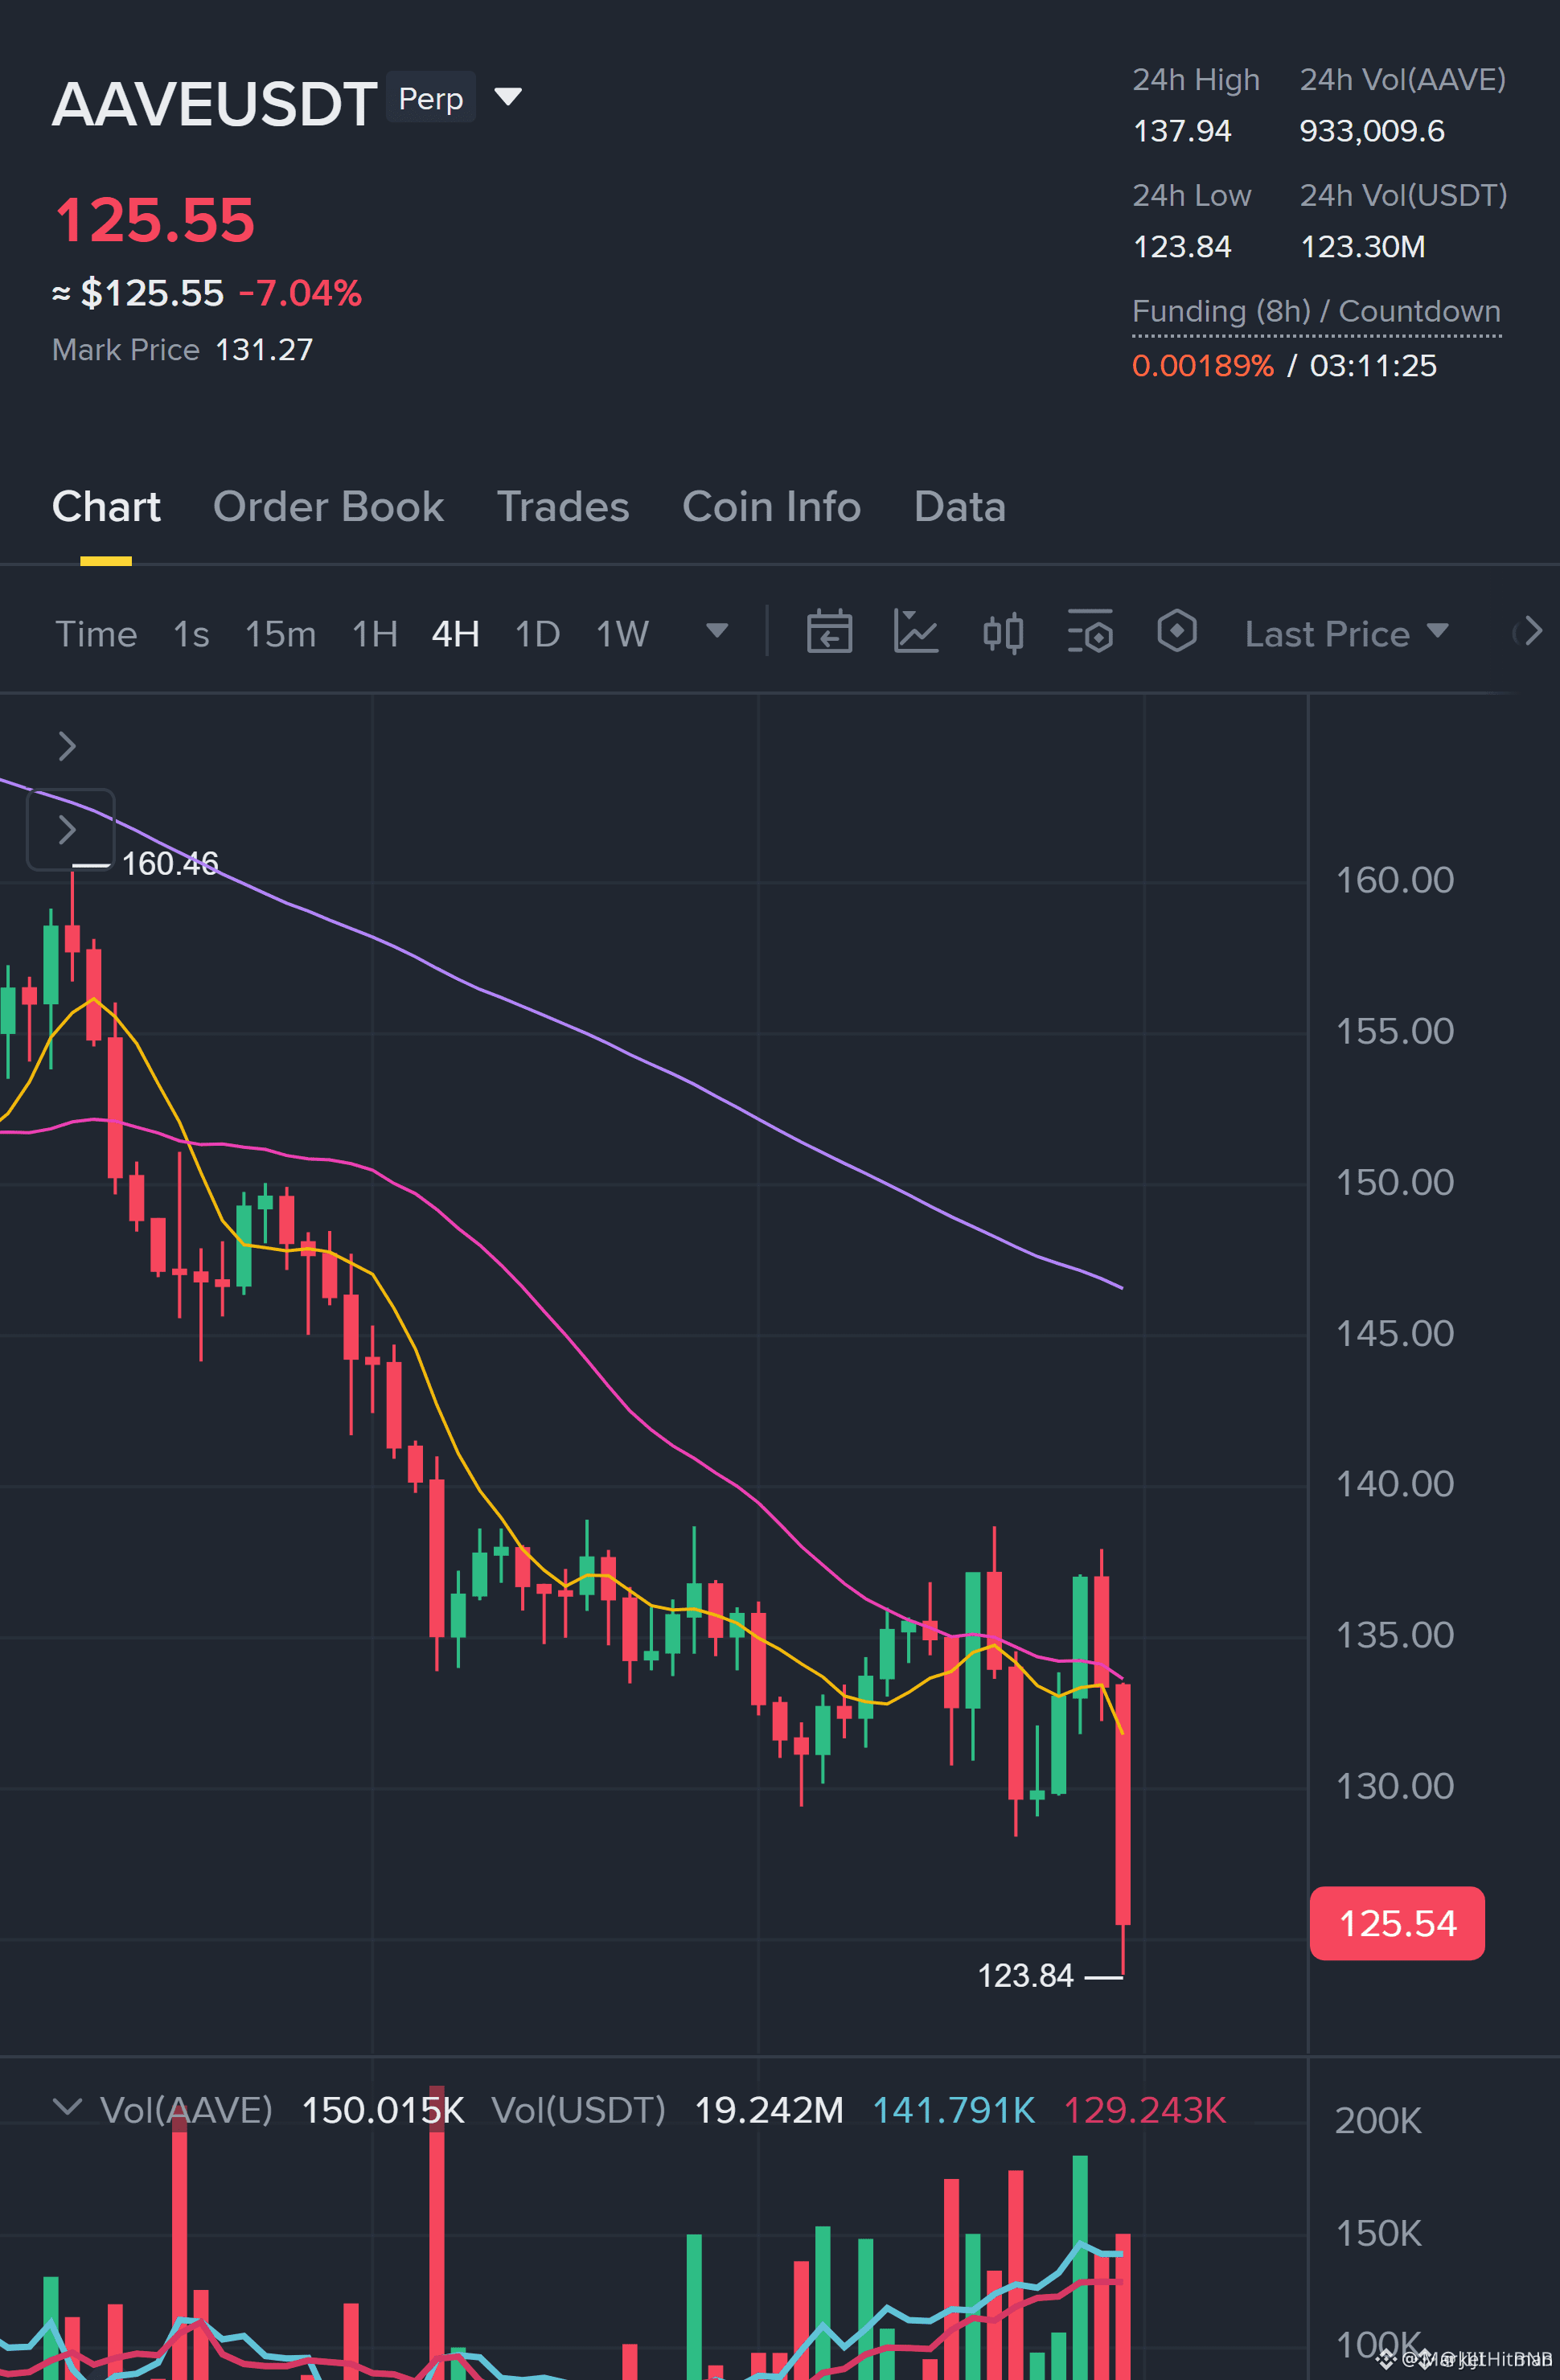
🚨 $AAVE RACES INTO DEEP SHORT ZONE – LIQUIDITY SWEEP LOOMING 🔴
Entry: 126.37-126.78 ⚡
Target: 122.19 🎯
Target: 119.27 🎯
Target: 114.89 🎯
Stop Loss: 132.41 ⚠️
📊 The 4‑hour EMA50/200 stack is screaming bearish, while the 15‑minute DI+ / DI‑ split (9.9 vs 49.8) shows sellers tightening the grip. 🦈 Smart money is likely loading short positions, and ADX at 28.5 confirms the momentum. ⚡ Watch for a clean pullback into the 126.37‑126.78 band before committing – a closed 15‑minute candle will be the final green light. 💬 Are you ready to ride the downside or waiting for the next liquidity trap? 👇
⚠️ Not financial advice. Always manage your risk. 🛡️
🏷️ #AAVE #ShortSetup #Crypto #Futures
🔥 💎
15

·
--
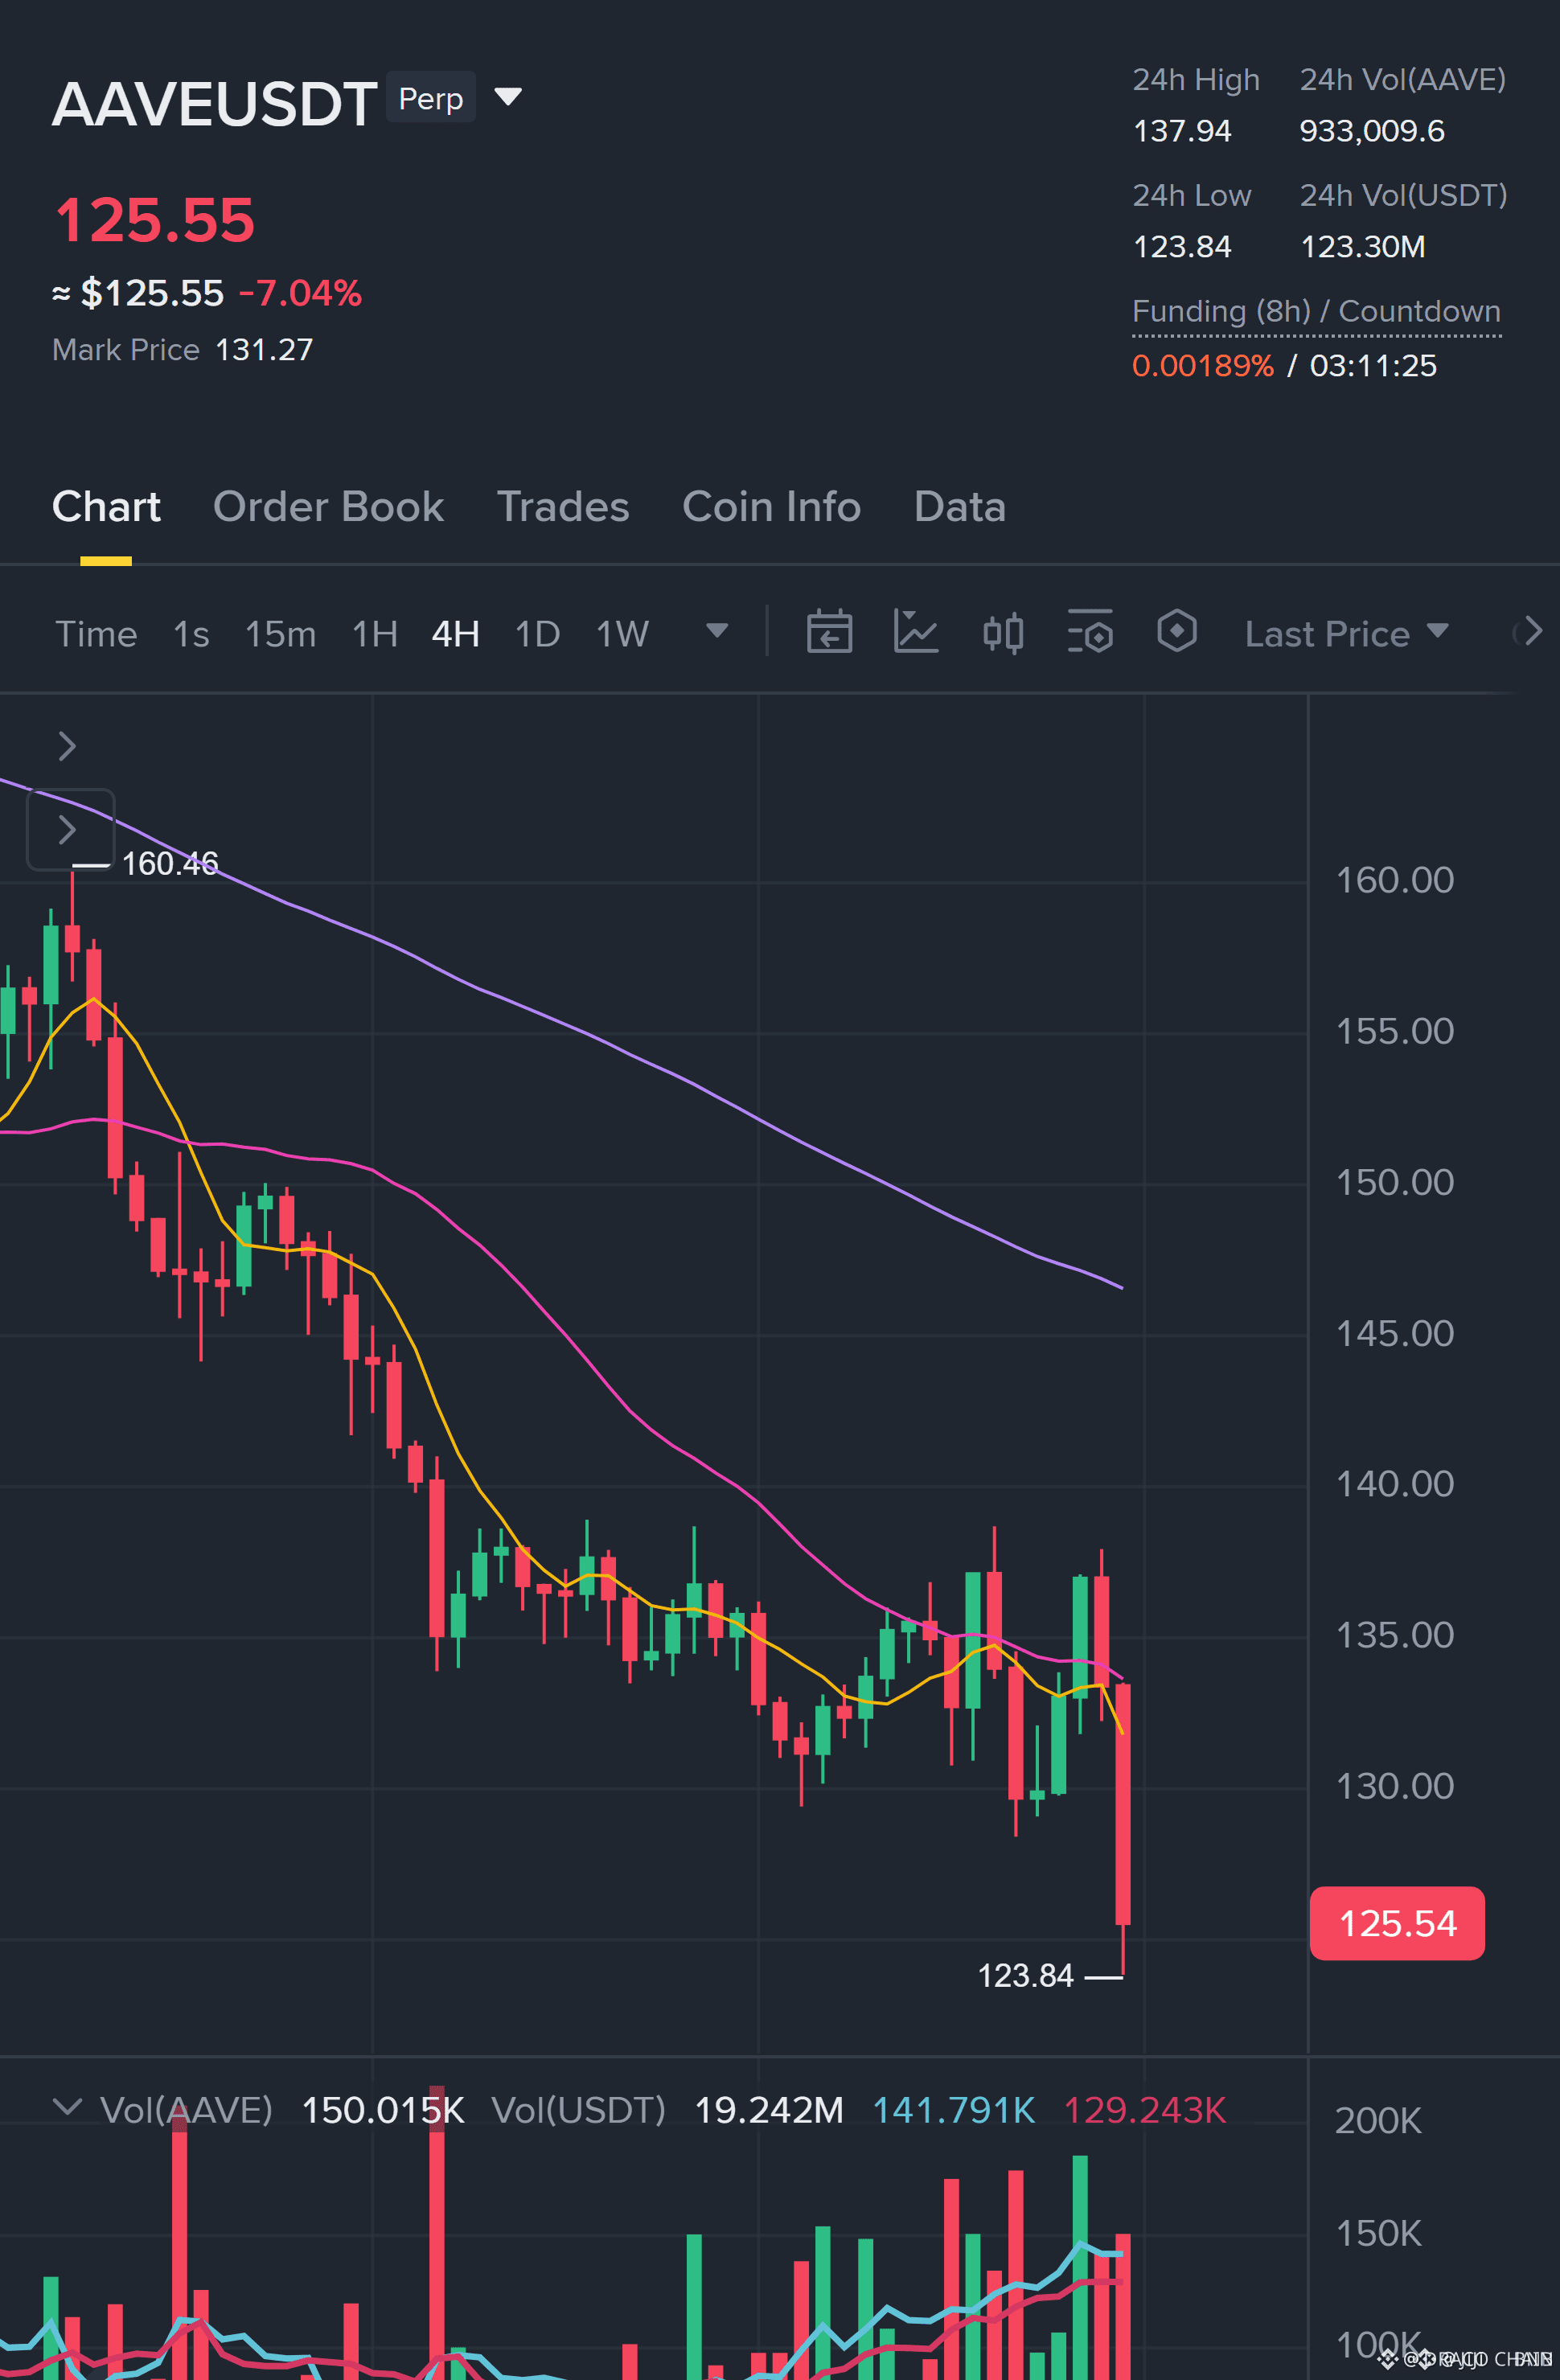
🔴 $AAVE PRIMED FOR SHORT SWEEP ON WEAK 4H EMA STACK 🚀
Entry: 126.37-126.78 ⚡
Target: 122.19 🚀
Target: 119.27 🚀
Target: 114.89 🚀
Stop Loss: 132.41 ⚠️
The 4‑hour EMA50/200 stack sits in a clean bearish alignment, while the 15‑minute DI+ is deep in the red (9.9 vs 49.8) and ADX at 28.5 confirms momentum. 📊 RSI hovers at 51, leaving the 1‑hour picture mixed but still vulnerable to a short bias. 📌 A pullback into the 126.37‑126.78 zone would trigger the conditional short, with three profit buckets stacked down to 114.89. 🌊 The main risk is a sudden 1‑hour EMA flip that could invalidate the trade. 💬 Do you see the downside holding firm? 👇
⚠️ Not financial advice. Always manage your risk. 🛡️
🏷️ #AAVE #ShortSetup #Crypto #DeFi
🦈 🔥
7

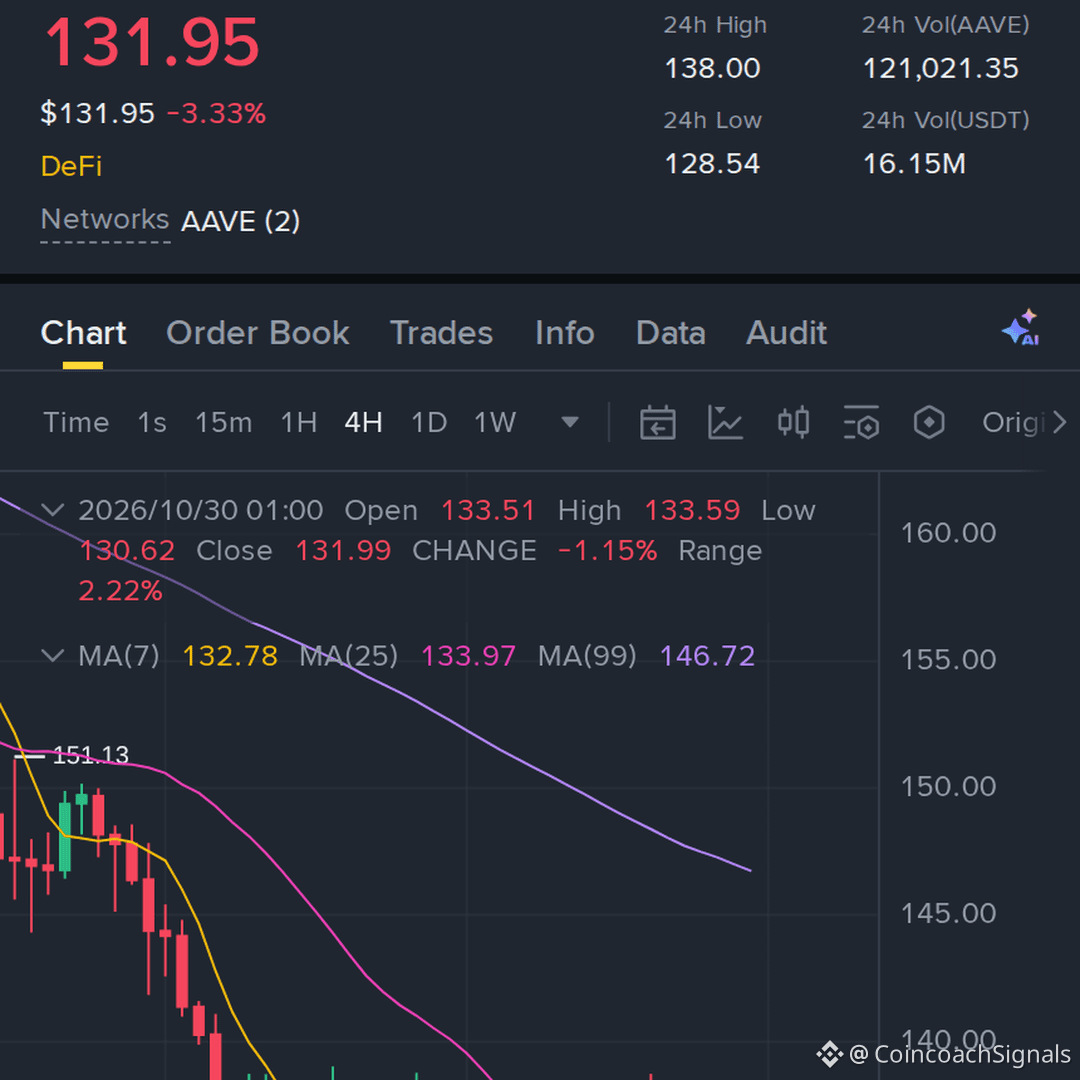
the current range on $AAVE, keeps rejecting the same area, so the short side is worth watching, keeping this one around 38x
Entry: 131.53–132.73 • Stop Loss: 139.61
TP1: 125.53 | TP2: 119.58 | TP3: 113.63
#AAVE #Write2Earn #binance #crypto
the current range on $AAVE , keeps rejecting the same area, so the short side is worth watching, keeping this one around 38x
Entry: 131.53–132.73 • Stop Loss: 139.61
TP1: 125.53 | TP2: 119.58 | TP3: 113.63
#AAVE #Write2Earn #binance #crypto
Entry: 131.53–132.73 • Stop Loss: 139.61
TP1: 125.53 | TP2: 119.58 | TP3: 113.63
#AAVE #Write2Earn #binance #crypto
24

·
--
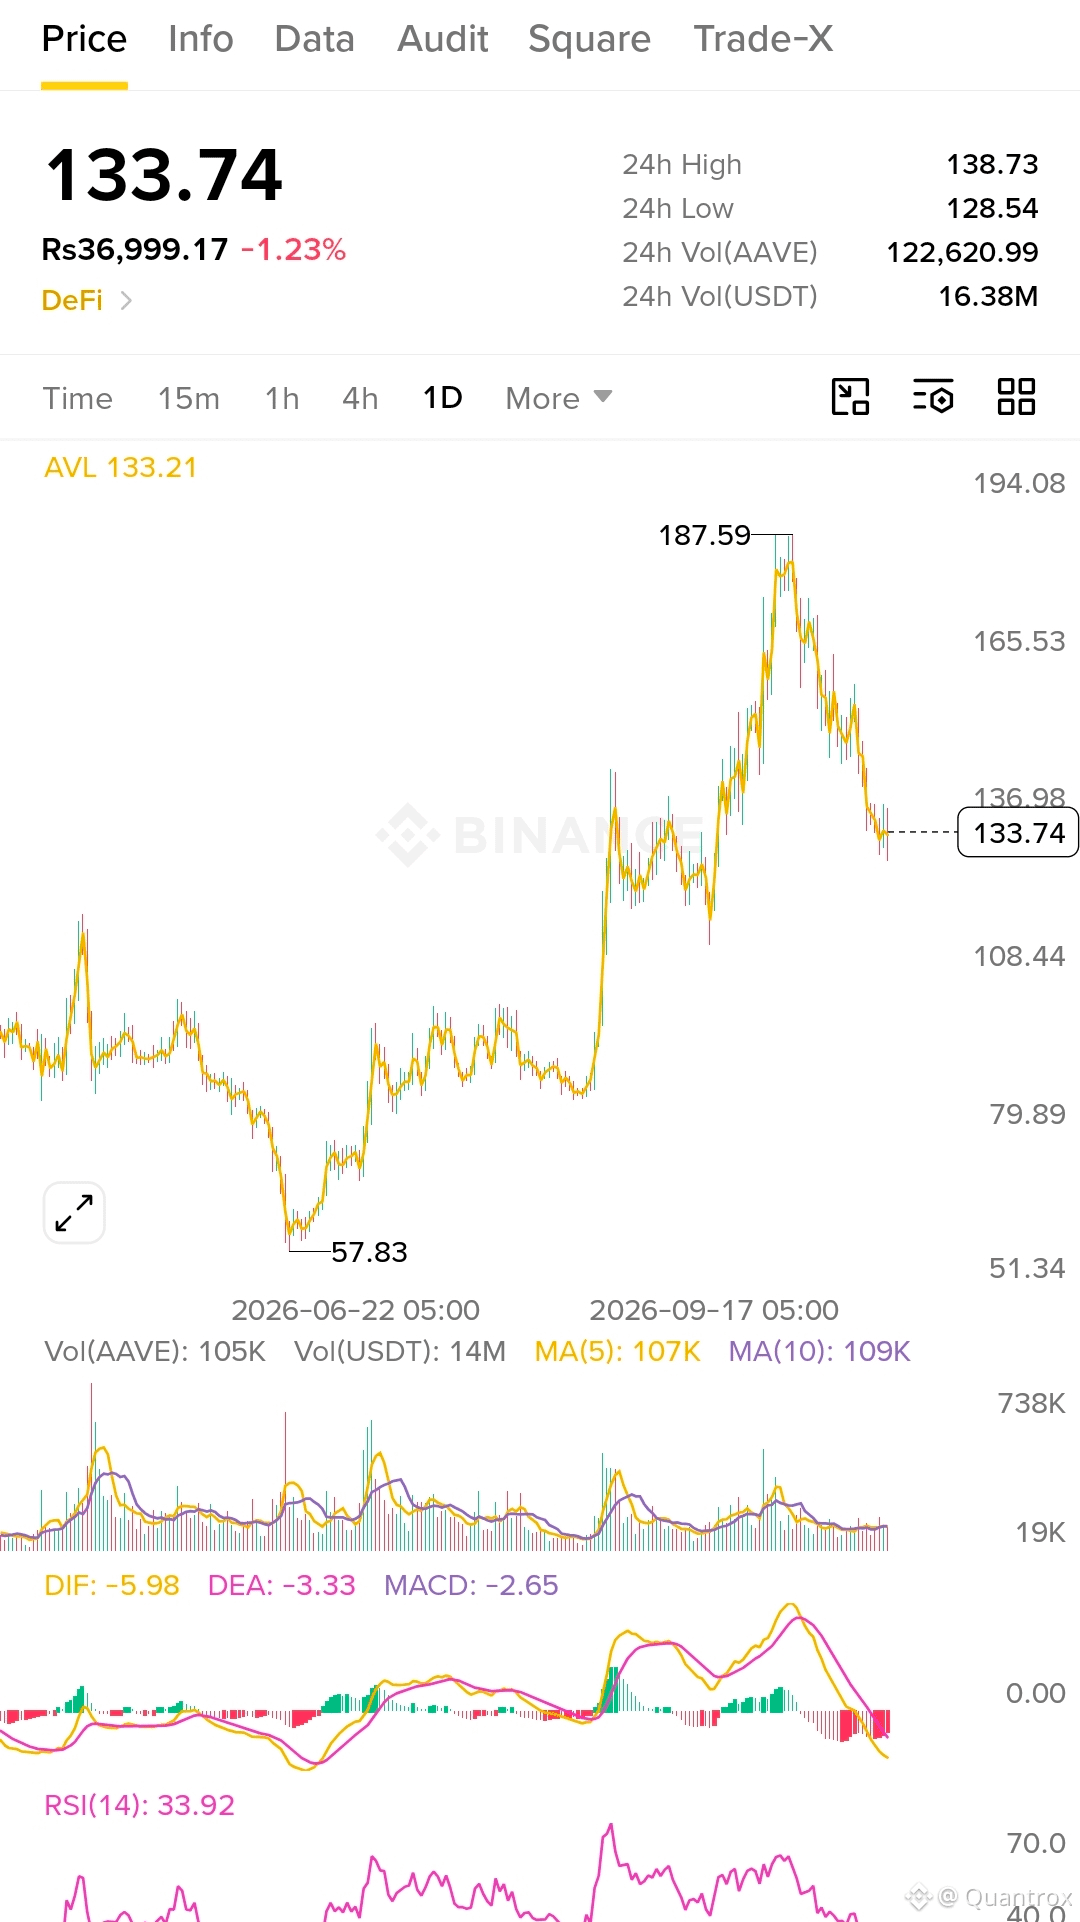
$AAVE just lost 12% in a week, and a whale is the reason. ⚠️
A whale moved $22.9M in AAVE to exchanges, and it fell three times harder than $ETH . It's now at 133.74, and $120 is the line everyone is watching. Lose it and the next support is 108.
But RSI is at 33, close to oversold. If buyers show up here, the bounce will be quick.
I'm only in above 138.7, targeting 150 then 165, with a stop under 128.
Is this whale selling the top or giving you a discount? 👇
#AAVE #DeFi #CryptoTrading
DYOR / NFA
1
345

·
--
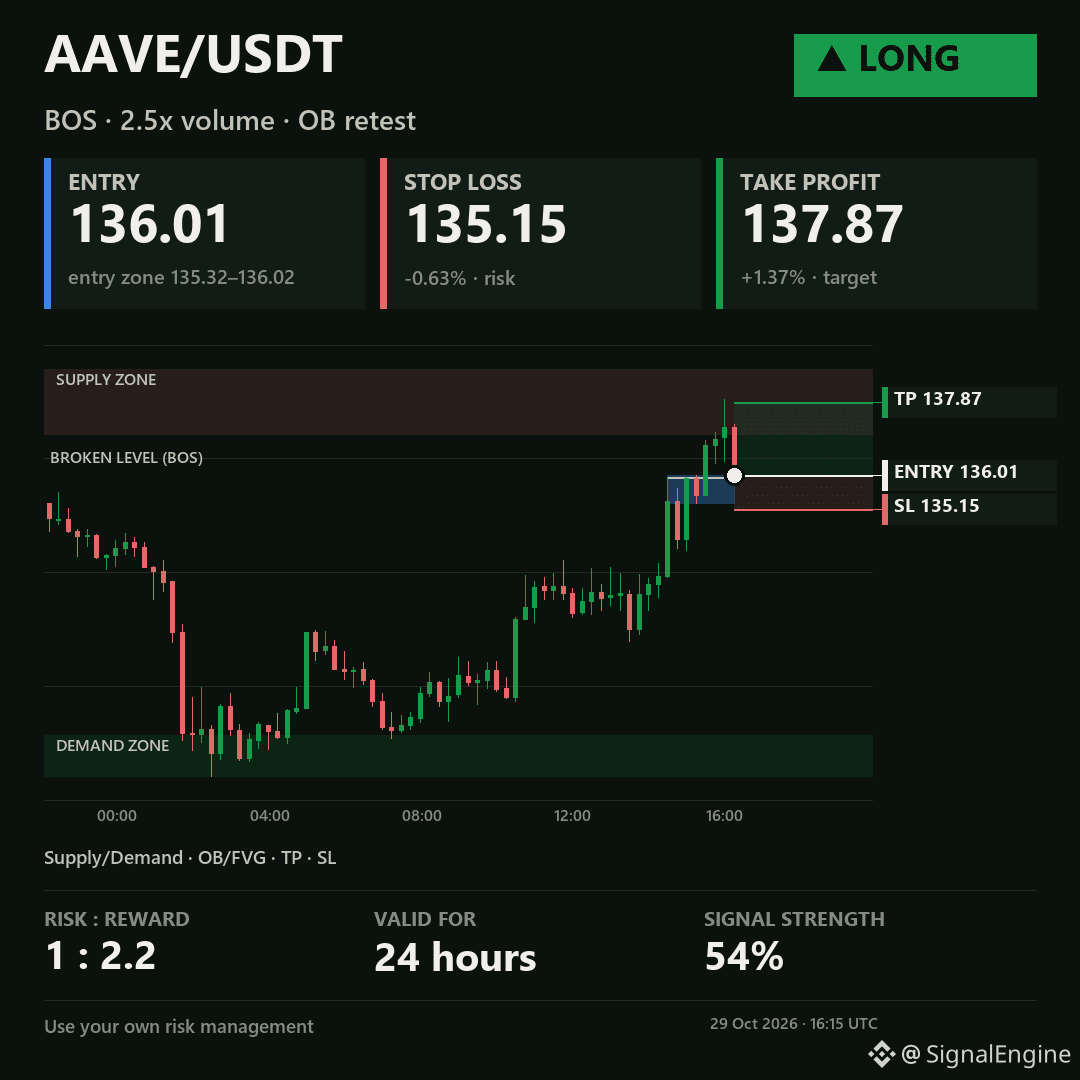
🟢 LONG $AAVE (AAVEUSDT)
ENTRY: 136.01 · SL: 135.15 · TP: 137.87 · R/R: 1:2.2
Break of structure with 2.5x volume → retest of the order block · valid 24 hours
29/10/2026 🗓️ 16:30 UTC 🌐
#AAVE #BinanceSquare
🟢 LONG $AAVE (AAVEUSDT)
ENTRY: 136.01 · SL: 135.15 · TP: 137.87 · R/R: 1:2.2
Break of structure with 2.5x volume → retest of the order block · valid 24 hours
29/10/2026 🗓️ 16:30 UTC 🌐
#AAVE #BinanceSquare
ENTRY: 136.01 · SL: 135.15 · TP: 137.87 · R/R: 1:2.2
Break of structure with 2.5x volume → retest of the order block · valid 24 hours
29/10/2026 🗓️ 16:30 UTC 🌐
#AAVE #BinanceSquare
vuacuoi:
SL
1
192

·
--
$AAVE — Long Setup | Market Analysis
AAVEUSDT exhibits clear bullish momentum, underscored by a significant 3.374% price increase over the last 24 hours coupled with substantial quote volume. This positive price action suggests continued upward potential as buying pressure persists. We anticipate further appreciation in the short term as the market structure favors continuation.
Market Context
24h Change: +3.37%
24h Volume: 17.0M USDT
Trade Plan
Entry: 136.97
Stop Loss: 133.55
TP1: 140.41
TP2: 143.82
TP3: 147.29
⚖️ Risk:Reward (TP1) 1:1.01
Confirmation Trigger: Price at entry level
Risk Note: Trading cryptocurrencies involves substantial risk and is not suitable for all investors. Prices can be highly volatile, and you may lose more than your initial investment.
Patience pays. Wait for your trigger.
#AAVE #aave
4

·
--
$AAVE #AAVE
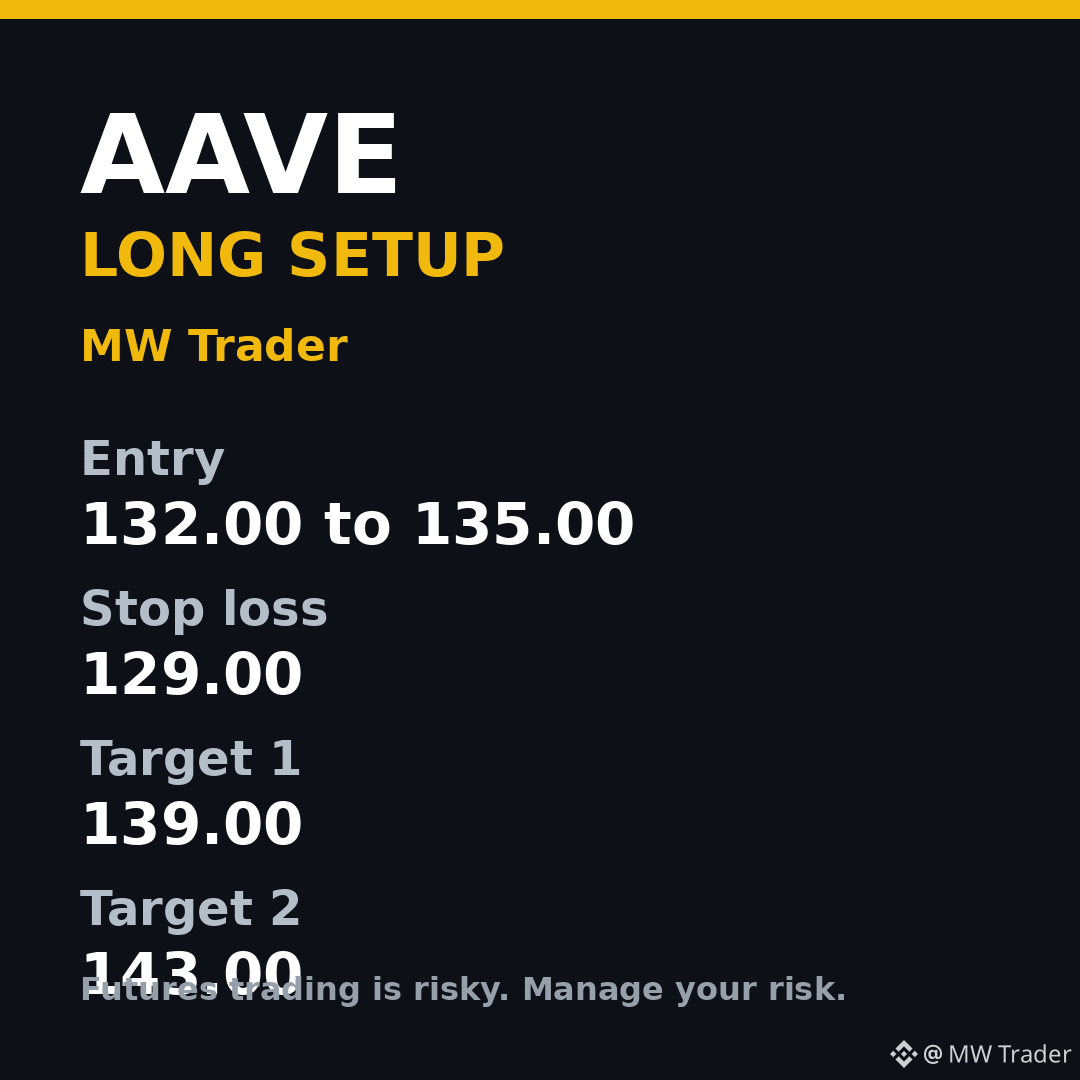
LONG idea, fresh setup for 29 October evening
Entry: 132.00 to 135.00
Stop loss: 129.00
Target 1: 139.00
Target 2: 143.00
Aave is near 134.75, up about 2.50 percent over 24 hours, and it has moved above the earlier short zone, which changes the setup completely. A long while price holds above 132.00 favours a move toward 139.00. Below 129.00, exit and wait.
Futures trading is risky. Trade small, manage your risk, and do your own research.
#Aave #Crypto #FuturesTrading #TradingSignals
Follow for more trades.
7

·
--
🚨 SEVERE ORDER FLOW IMBALANCE: $AAVE
Quantitative analysis reveals a critical failure at the current premium. We are seeing aggressive SELL-SIDE liquidity absorption combined with a bearish CVD divergence, suggesting the current rally is a mere liquidity grab. Price has entered a high-frequency Order Block with a glaring Fair Value Gap (FVG) below, signaling an imminent mean reversion.
EXECUTION:
ENTRY: 132.87 $AAVE
SL: 134.26
TP1: 128.41
RR: 1:3.1
Is $AAVE facing a structural supply flip or just a temporary liquidity sweep before the next leg up?
#AAVE #BinanceSquare #SlowSclap #TradingAnalysis
2

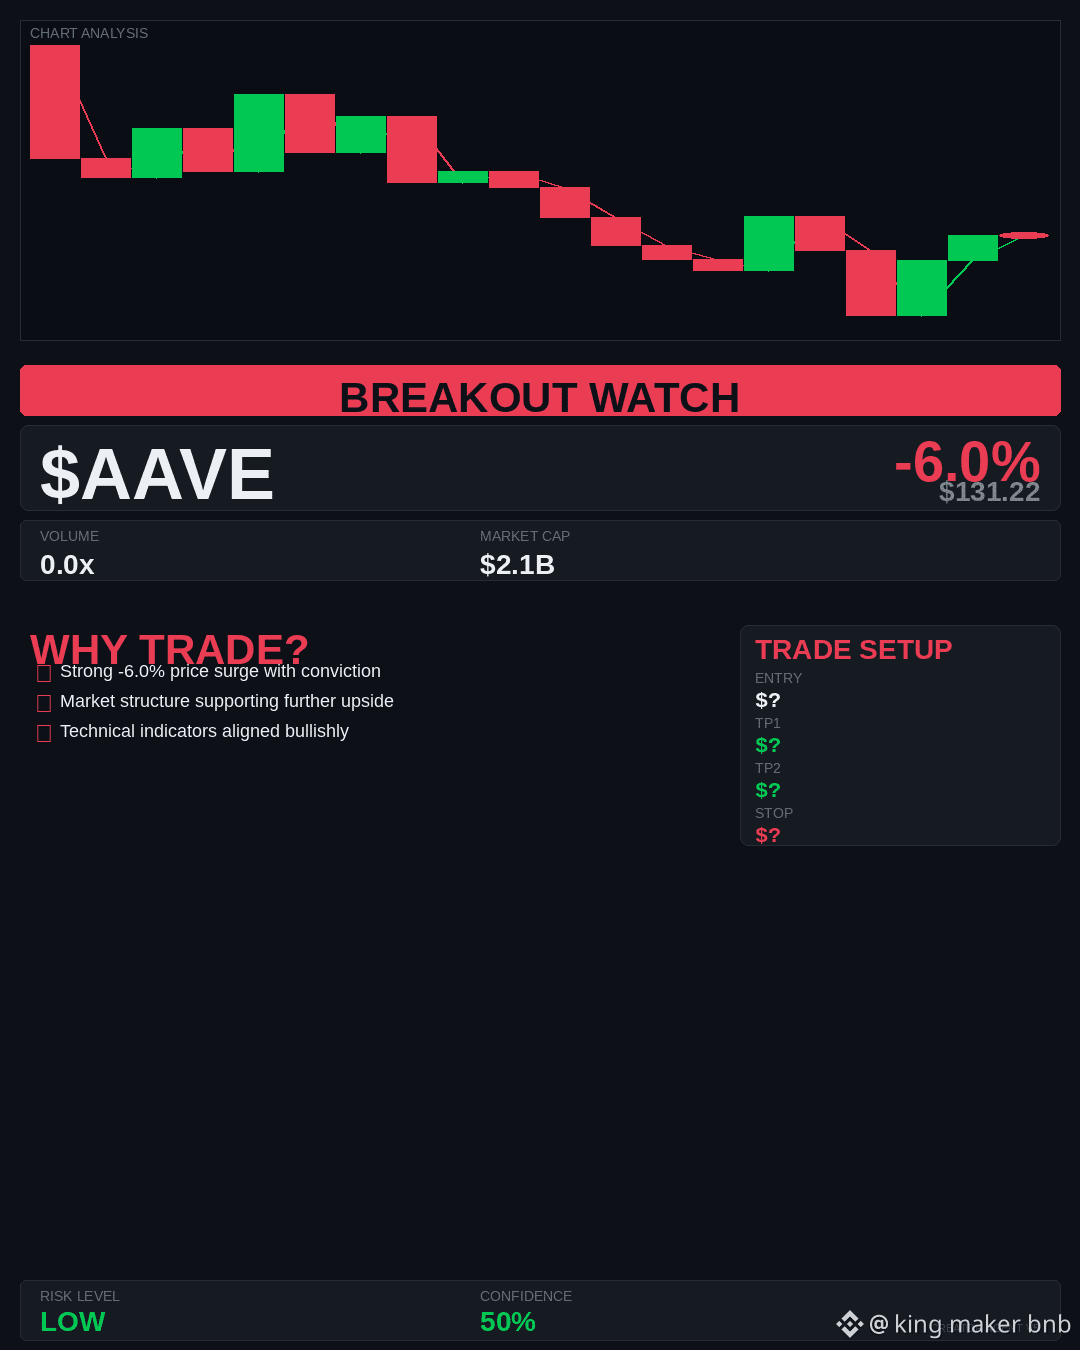
$AAVE just took a solid -6% hit! 📉 This dip might be the entry we've been waiting for on a strong DeFi play.
I’m eyeing an entry zone between $130-$132. Targets at $135 and $140, with a tight stop loss at $127 to manage risk. Momentum is strong, and the DeFi narrative is getting serious traction on Square. This looks like a solid bounce candidate if buyers step in soon. Keep an eye on volume – thin flow means we need quick decisions.
#AAVE #Write2Earn #DeFi #CryptoTrading
92

🚨 $AAVE SLIDES INTO BEARISH ZONE – SHORT ON THE HUNT! 🐻
Entry: 132.71‑133.08 ⚡
Target: 131.85 🚀
Target: 131.54 🚀
Target: 131.11 🚀
Stop Loss: 134.37 ⚠️
📊 The 4h EMA50/200 stack is screaming bearish while the 1h EMA stays under pressure, giving the short side a clean edge. 📈 RSI hovers neutral at 51.6, but the 15m DI+ outpaces DI‑, whispering a fleeting long flirt that could snag timing. ⚡ Watch the 131.67 support on the 1h; a bounce there could stall the descent and force a re‑entry hunt. 💡 With a tight risk‑reward around 0.7‑1.2R, the trade leans heavily on price reclaiming the zone before the candle closes.
💬 How will you time the reclaim before the short flips? 👇
⚠️ Not financial advice. Always manage your risk. 🛡️
🏷️ #AAVE #ShortSetup #Crypto #DeFi #TradeAlert
🔥 🦈
12

$AAVE: Direction vs Distance
Consider $AAVE across different timeframes. The hourly change 0.619055 suggests immediate momentum. Compare that to the four-hour move 2.70479. If the hourly direction was up but the four-hour change was down, price likely retraced a larger move. This distinction clarifies volatility. Now include $ETH. Its hourly direction is up, and volume is above baseline. The same is true for $LITEB. Do not assume these moves are linked. Occiparallel price action on one venue does not prove shared buyers or sector rotation. Market noise often causes this. Focus on how the move holds. Look at relative volume 3.06731. High volume during an hourly up move offers a baseline for strength. Yet it does not guarantee a four-hour trend. A specific check helps. If $AAVE fails to close above 131.626, the hourly strength weakens. The RSI value 66.5315 provides context on momentum extremes. However, RSI alone cannot confirm reversal. Treat peer observations as background, not signals. The current configuration shows parallel hourly strength, not a confirmed correlation pattern.
Probabilistic market research, not a recommendation or guaranteed return.
The comparison to keep in mind: $ETH has hourly direction up and volume above its baseline; $LITEB has hourly direction up and volume above its baseline. This alone does not establish correlation.
Which matters more in this comparison: direction or how the move holds?
#AAVE #ETH #LITEB
$AAVE : Direction vs Distance
Consider $AAVE across different timeframes. The hourly change 0.619055 suggests immediate momentum. Compare that to the four-hour move 2.70479. If the hourly direction was up but the four-hour change was down, price likely retraced a larger move. This distinction clarifies volatility. Now include $ETH . Its hourly direction is up, and volume is above baseline. The same is true for $LITEB . Do not assume these moves are linked. Occiparallel price action on one venue does not prove shared buyers or sector rotation. Market noise often causes this. Focus on how the move holds. Look at relative volume 3.06731. High volume during an hourly up move offers a baseline for strength. Yet it does not guarantee a four-hour trend. A specific check helps. If $AAVE fails to close above 131.626, the hourly strength weakens. The RSI value 66.5315 provides context on momentum extremes. However, RSI alone cannot confirm reversal. Treat peer observations as background, not signals. The current configuration shows parallel hourly strength, not a confirmed correlation pattern.
Probabilistic market research, not a recommendation or guaranteed return.
The comparison to keep in mind: $ETH has hourly direction up and volume above its baseline; $LITEB has hourly direction up and volume above its baseline. This alone does not establish correlation.
Which matters more in this comparison: direction or how the move holds?
#AAVE #ETH #LITEB
49
Войдите, чтобы посмотреть больше материала
Присоединяйтесь к пользователям криптовалют по всему миру на Binance Square
⚡️ Получайте новейшую и полезную информацию о криптоактивах.
💬 Нам доверяет крупнейшая в мире криптобиржа.
👍 Получите достоверные аналитические данные от верифицированных создателей контента.
Эл. почта/номер телефона
В тренде
1
#EarningsSeason
Просмотров: 6.5M
32,636 обсуждают
2
#USMidtermElections
Просмотров: 70,030
889 обсуждают
3
#StrategySTRCReaches$99.95ForFirstTimeIn165Days
Просмотров: 130
7 обсуждают
4
#BinanceWillListPredictPREDICT
Просмотров: 3,264
157 обсуждают
5
#SwitzerlandFirstSpotBitcoinETFExpectedToTradeInNovember
Просмотров: 277
20 обсуждают
6
#StrategyReports$21BQ3OperatingProfit
Просмотров: 131
9 обсуждают
7
#TwoAddressesHoldingAbout1.28BUSDTFrozen
Просмотров: 352
45 обсуждают
8
#FirstDigitalBlacklistsAttackerAddressHoldingAbout3.4MFDUSD
Просмотров: 100
5 обсуждают
9
#BitcoinDropsBelow$80K
Просмотров: 50,771
147 обсуждают
10
#BoEOpensConsultationOnTokenizedCollateralForClearing
Просмотров: 1,913
39 обсуждают