
#hksfcsaystokenizationmovingtocommercialuse
hksfcsaystokenizationmovingtocommercialuse
Популярные
Новые

·
--
Hong Kong's SFC says tokenization is moving from pilots to commercial use — $1.3B already sits in tokenized funds. $BTC flat near $73.4K, -0.8%. If banks follow through, RWA rails win; if not, another seminar. Real shift or PR? #HKSFCSaysTokenizationMovingToCommercialUse #CryptoMarket #BinanceSquare
Hong Kong's SFC says tokenization is moving from pilots to commercial use — $1.3B already sits in tokenized funds. $BTC flat near $73.4K, -0.8%. If banks follow through, RWA rails win; if not, another seminar. Real shift or PR? #HKSFCSaysTokenizationMovingToCommercialUse #CryptoMarket #BinanceSquare
7

·
--
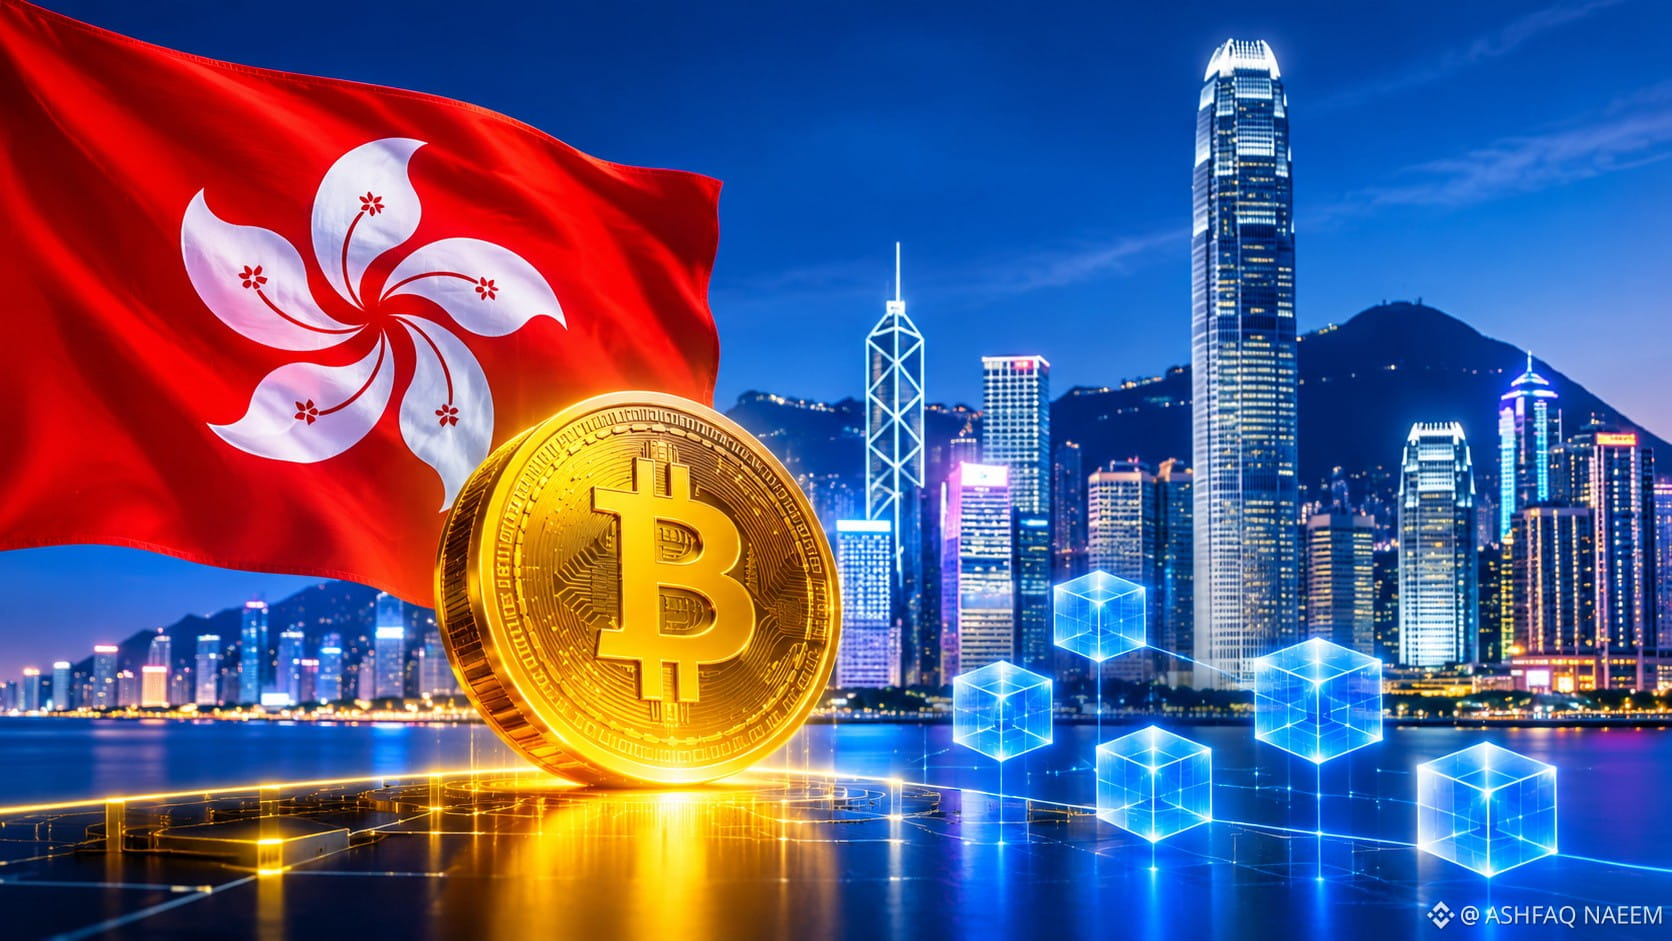
🚨 HONG KONG TOKENIZATION IS ENTERING A NEW ERA!
Hong Kong’s Securities and Futures Commission (SFC) says tokenization is moving beyond experimentation and into real commercial use
On November 12, the Hong Kong Monetary Authority (HKMA) and SFC highlighted growing industry adoption, with around 200 financial professionals discussing the future of tokenized assets
The next big step is connecting tokenized investment products, digital money and financial infrastructure. Project Ensemble is also advancing 24/7 interbank settlement of tokenized deposits, while approved tokenized money market funds are opening the door to round-the-clock secondary trading
This could make financial markets faster, more accessible and more efficient while creating new opportunities for blockchain technology and Real World Asset (RWA) adoption
The bigger story is clear: tokenization is moving from theory to practical financial infrastructure.
Do you think Hong Kong could become a global leader in the RWA revolution?
#hksfcsaystokenizationmovingtocommercialuse
{future}(BTCUSDT)
🚨 HONG KONG TOKENIZATION IS ENTERING A NEW ERA!
Hong Kong’s Securities and Futures Commission (SFC) says tokenization is moving beyond experimentation and into real commercial use
On November 12, the Hong Kong Monetary Authority (HKMA) and SFC highlighted growing industry adoption, with around 200 financial professionals discussing the future of tokenized assets
The next big step is connecting tokenized investment products, digital money and financial infrastructure. Project Ensemble is also advancing 24/7 interbank settlement of tokenized deposits, while approved tokenized money market funds are opening the door to round-the-clock secondary trading
This could make financial markets faster, more accessible and more efficient while creating new opportunities for blockchain technology and Real World Asset (RWA) adoption
The bigger story is clear: tokenization is moving from theory to practical financial infrastructure.
Do you think Hong Kong could become a global leader in the RWA revolution?
#hksfcsaystokenizationmovingtocommercialuse
Hong Kong’s Securities and Futures Commission (SFC) says tokenization is moving beyond experimentation and into real commercial use
On November 12, the Hong Kong Monetary Authority (HKMA) and SFC highlighted growing industry adoption, with around 200 financial professionals discussing the future of tokenized assets
The next big step is connecting tokenized investment products, digital money and financial infrastructure. Project Ensemble is also advancing 24/7 interbank settlement of tokenized deposits, while approved tokenized money market funds are opening the door to round-the-clock secondary trading
This could make financial markets faster, more accessible and more efficient while creating new opportunities for blockchain technology and Real World Asset (RWA) adoption
The bigger story is clear: tokenization is moving from theory to practical financial infrastructure.
Do you think Hong Kong could become a global leader in the RWA revolution?
#hksfcsaystokenizationmovingtocommercialuse
265

·
--
Падение
Проверено
#hksfcsaystokenizationmovingtocommercialuse
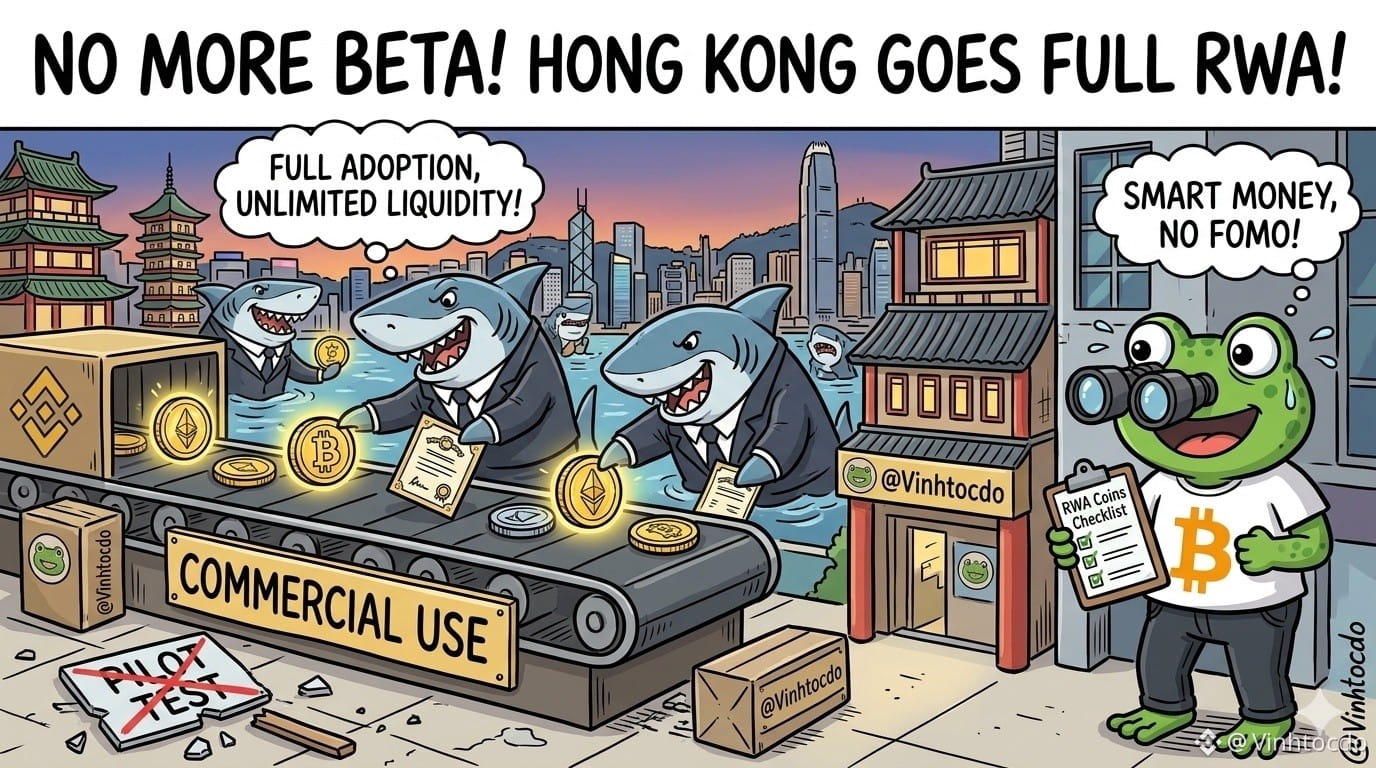
🚀Hồng Kông chơi lớn, RWA hết thời "thử nghiệm"!
Hồng Kông vừa phát tín hiệu cực gắt: SFC và HKMA chính thức xác nhận token hóa (RWA) đã hết thời "chạy thử" để bước thẳng vào giai đoạn thương mại hóa thực tế! Tại hội thảo với hơn 200 tay to tài chính ngày 11/11, giới chức khẳng định sẽ kết nối các quỹ đầu tư token hóa, tiền kỹ thuật số và hạ tầng thanh toán để dòng tiền chảy thực sự trên thị trường thứ cấp.
💡 Trader nên làm gì? Đừng đứng ngoài nhìn "cá mập" gom hàng! Hãy đưa ngay nhóm coin hạ tầng RWA vào danh sách theo dõi, canh nhịp điều chỉnh để tích lũy dần thay vì FOMO đu đỉnh theo tin tức.
⚠️ Đây không phải lời khuyên tài chính.
👇 Click giao dịch bên dưới để ủng hộ tôi: $SKHYB
{spot}(SKHYBUSDT)
$TSMB
{spot}(TSMBUSDT)
$AGT
{future}(AGTUSDT)
#RWA #Tokenization #HongKongCrypto #CryptoNews #Altcoins #VINHTOCDO
#hksfcsaystokenizationmovingtocommercialuse
🚀Hồng Kông chơi lớn, RWA hết thời "thử nghiệm"!
Hồng Kông vừa phát tín hiệu cực gắt: SFC và HKMA chính thức xác nhận token hóa (RWA) đã hết thời "chạy thử" để bước thẳng vào giai đoạn thương mại hóa thực tế! Tại hội thảo với hơn 200 tay to tài chính ngày 11/11, giới chức khẳng định sẽ kết nối các quỹ đầu tư token hóa, tiền kỹ thuật số và hạ tầng thanh toán để dòng tiền chảy thực sự trên thị trường thứ cấp.
💡 Trader nên làm gì? Đừng đứng ngoài nhìn "cá mập" gom hàng! Hãy đưa ngay nhóm coin hạ tầng RWA vào danh sách theo dõi, canh nhịp điều chỉnh để tích lũy dần thay vì FOMO đu đỉnh theo tin tức.
⚠️ Đây không phải lời khuyên tài chính.
👇 Click giao dịch bên dưới để ủng hộ tôi: $SKHYB
$TSMB
$AGT
#RWA #Tokenization #HongKongCrypto #CryptoNews #Altcoins #VINHTOCDO
🚀Hồng Kông chơi lớn, RWA hết thời "thử nghiệm"!
Hồng Kông vừa phát tín hiệu cực gắt: SFC và HKMA chính thức xác nhận token hóa (RWA) đã hết thời "chạy thử" để bước thẳng vào giai đoạn thương mại hóa thực tế! Tại hội thảo với hơn 200 tay to tài chính ngày 11/11, giới chức khẳng định sẽ kết nối các quỹ đầu tư token hóa, tiền kỹ thuật số và hạ tầng thanh toán để dòng tiền chảy thực sự trên thị trường thứ cấp.
💡 Trader nên làm gì? Đừng đứng ngoài nhìn "cá mập" gom hàng! Hãy đưa ngay nhóm coin hạ tầng RWA vào danh sách theo dõi, canh nhịp điều chỉnh để tích lũy dần thay vì FOMO đu đỉnh theo tin tức.
⚠️ Đây không phải lời khuyên tài chính.
👇 Click giao dịch bên dưới để ủng hộ tôi: $SKHYB
$TSMB
$AGT
#RWA #Tokenization #HongKongCrypto #CryptoNews #Altcoins #VINHTOCDO
2
923

·
--
Рост
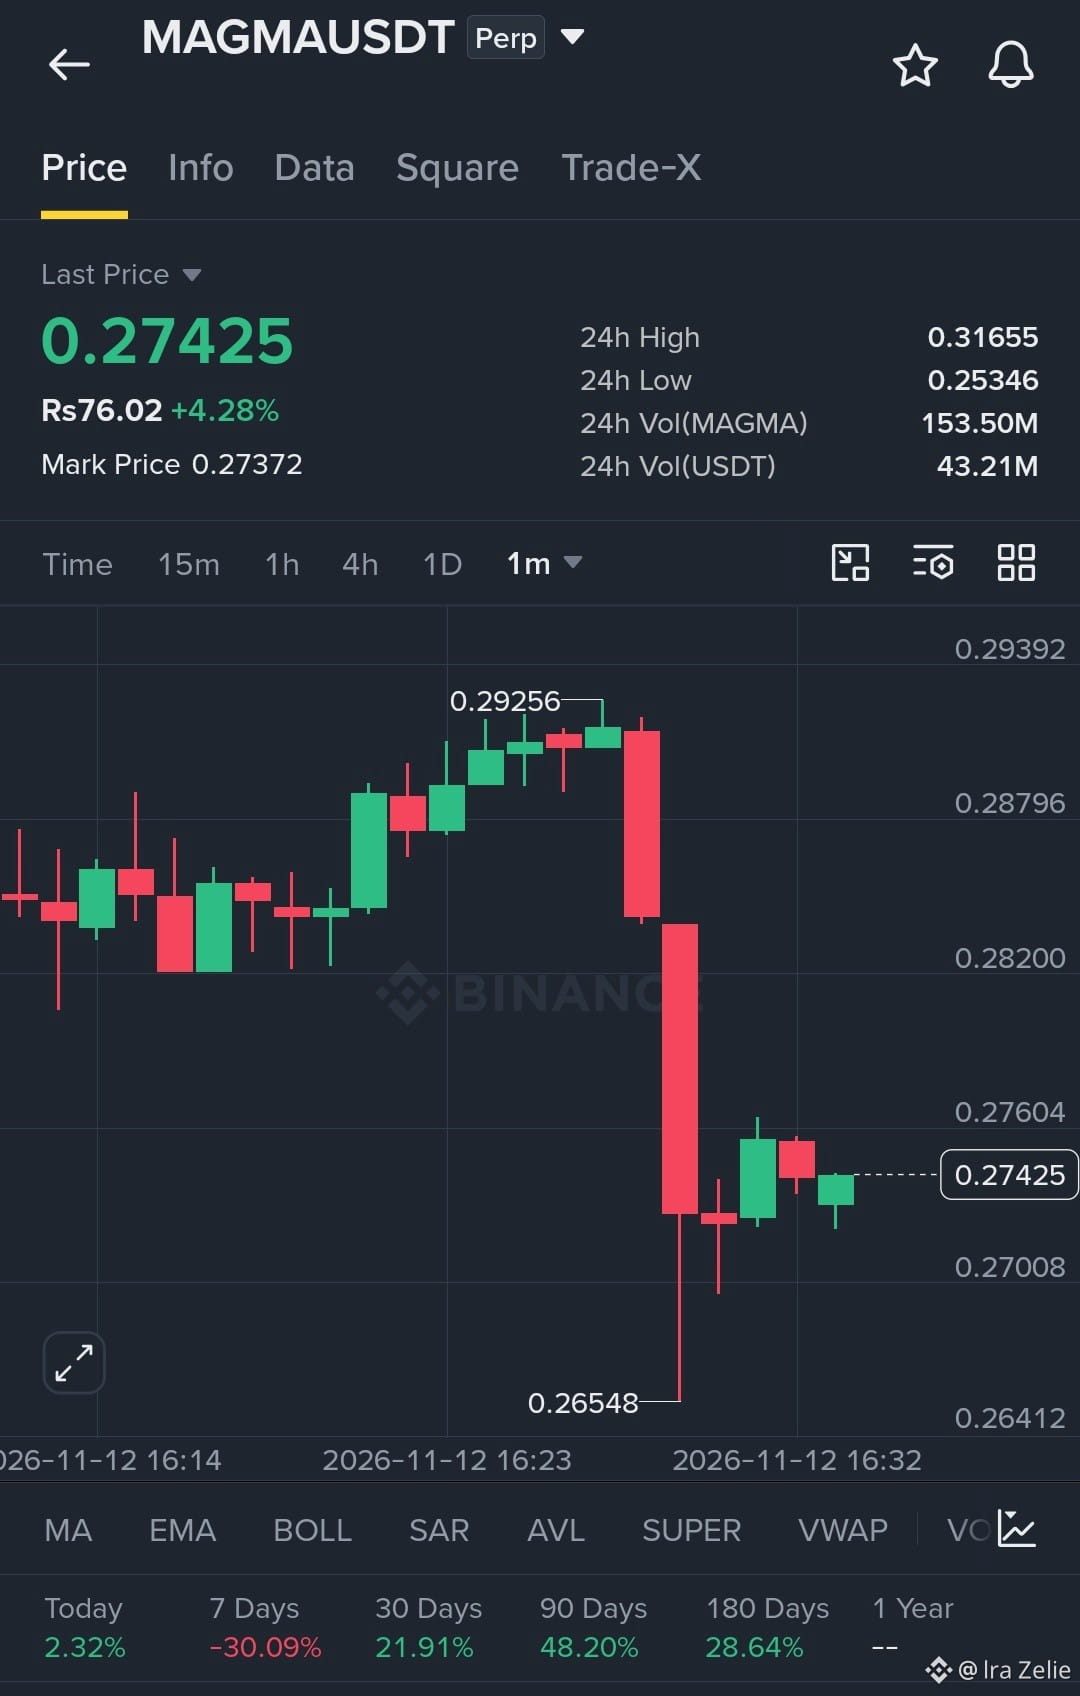
$MAGMA Faces Strong Rejection Near $0.31! Sellers Are Taking Control
$MAGMA is showing signs of weakness after getting rejected near the $0.31 resistance zone. Sellers are stepping in, and the price could move lower toward the $0.27 support area if bearish pressure continues.
Short Entry: 0.2840 – 0.2900
TP1: 0.2800
TP2: 0.2750
TP3: 0.2680
Stop Loss: 0.2980
Watch the price action closely. If sellers maintain control, these downside targets could come into focus. Always manage your risk and use a stop loss.
Let's go and trade $MAGMA
{alpha}(CT_7840x9f854b3ad20f8161ec0886f15f4a1752bf75d22261556f14cc8d3a1c5d50e529::magma::MAGMA)
#HuangRisksOusterOverReportedAffairWithSubordinate #AnthropicRejectsIPODelayValuationinQuestion #HKSFCSaysTokenizationMovingToCommercialUse #CanNvidiaEarningsEaseMarketConcerns? #PythAddsNYSERealTimeDataToMarketplace
$MAGMA Faces Strong Rejection Near $0.31! Sellers Are Taking Control
$MAGMA is showing signs of weakness after getting rejected near the $0.31 resistance zone. Sellers are stepping in, and the price could move lower toward the $0.27 support area if bearish pressure continues.
Short Entry: 0.2840 – 0.2900
TP1: 0.2800
TP2: 0.2750
TP3: 0.2680
Stop Loss: 0.2980
Watch the price action closely. If sellers maintain control, these downside targets could come into focus. Always manage your risk and use a stop loss.
Let's go and trade $MAGMA
#HuangRisksOusterOverReportedAffairWithSubordinate #AnthropicRejectsIPODelayValuationinQuestion #HKSFCSaysTokenizationMovingToCommercialUse #CanNvidiaEarningsEaseMarketConcerns? #PythAddsNYSERealTimeDataToMarketplace
$MAGMA is showing signs of weakness after getting rejected near the $0.31 resistance zone. Sellers are stepping in, and the price could move lower toward the $0.27 support area if bearish pressure continues.
Short Entry: 0.2840 – 0.2900
TP1: 0.2800
TP2: 0.2750
TP3: 0.2680
Stop Loss: 0.2980
Watch the price action closely. If sellers maintain control, these downside targets could come into focus. Always manage your risk and use a stop loss.
Let's go and trade $MAGMA
#HuangRisksOusterOverReportedAffairWithSubordinate #AnthropicRejectsIPODelayValuationinQuestion #HKSFCSaysTokenizationMovingToCommercialUse #CanNvidiaEarningsEaseMarketConcerns? #PythAddsNYSERealTimeDataToMarketplace
246

·
--
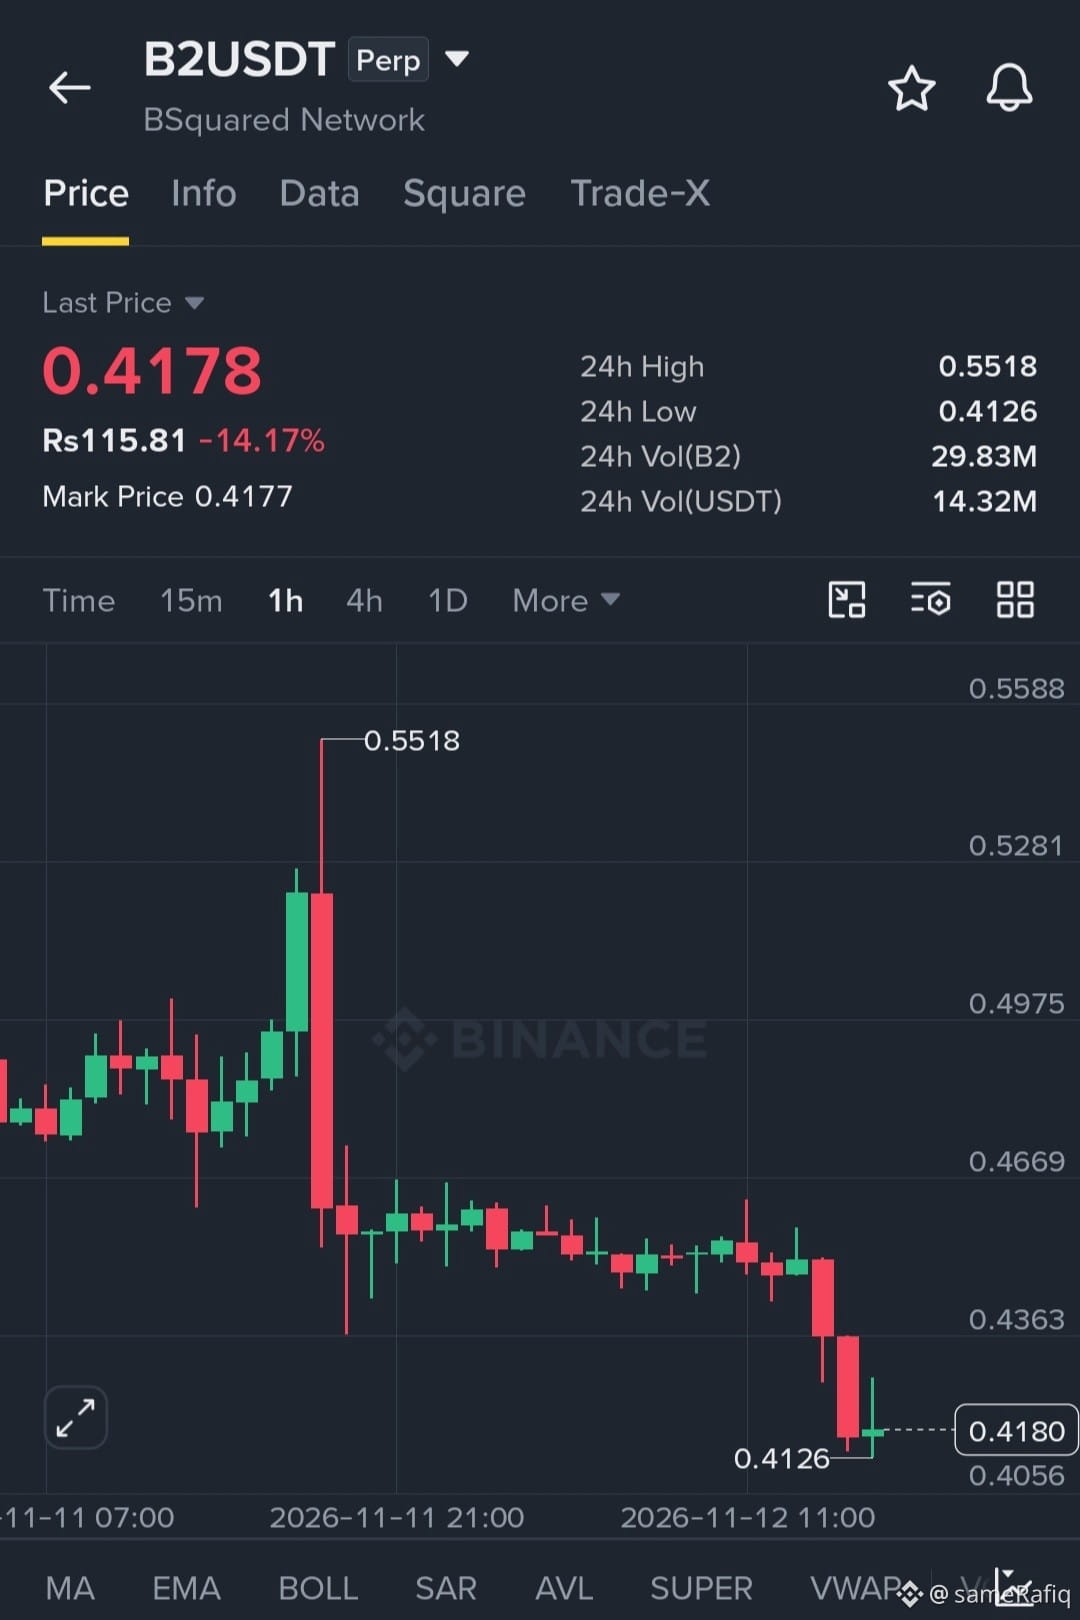
Going long on $B2 as oversold conditions create room for a potential relief bounce.
Entry: 0.4081 – 0.4173
TP1: 0.4359
TP2: 0.4545
SL: 0.3918
$B2 is attempting to recover after heavy selling pressure. A bounce toward local MA resistance levels could be next.
$B2
{alpha}(560x783c3f003f172c6ac5ac700218a357d2d66ee2a2)
#HuangRisksOusterOverReportedAffairWithSubordinate #AnthropicRejectsIPODelayValuationinQuestion #CoreWeaveJumps10%On168%RevenueGrowth #MSCIRemovalMayCurbStrategy’sBitcoinBuying #HKSFCSaysTokenizationMovingToCommercialUse
Going long on $B2 as oversold conditions create room for a potential relief bounce.
Entry: 0.4081 – 0.4173
TP1: 0.4359
TP2: 0.4545
SL: 0.3918
$B2 is attempting to recover after heavy selling pressure. A bounce toward local MA resistance levels could be next.
$B2
#HuangRisksOusterOverReportedAffairWithSubordinate #AnthropicRejectsIPODelayValuationinQuestion #CoreWeaveJumps10%On168%RevenueGrowth #MSCIRemovalMayCurbStrategy’sBitcoinBuying #HKSFCSaysTokenizationMovingToCommercialUse
Entry: 0.4081 – 0.4173
TP1: 0.4359
TP2: 0.4545
SL: 0.3918
$B2 is attempting to recover after heavy selling pressure. A bounce toward local MA resistance levels could be next.
$B2
#HuangRisksOusterOverReportedAffairWithSubordinate #AnthropicRejectsIPODelayValuationinQuestion #CoreWeaveJumps10%On168%RevenueGrowth #MSCIRemovalMayCurbStrategy’sBitcoinBuying #HKSFCSaysTokenizationMovingToCommercialUse
10
·
--
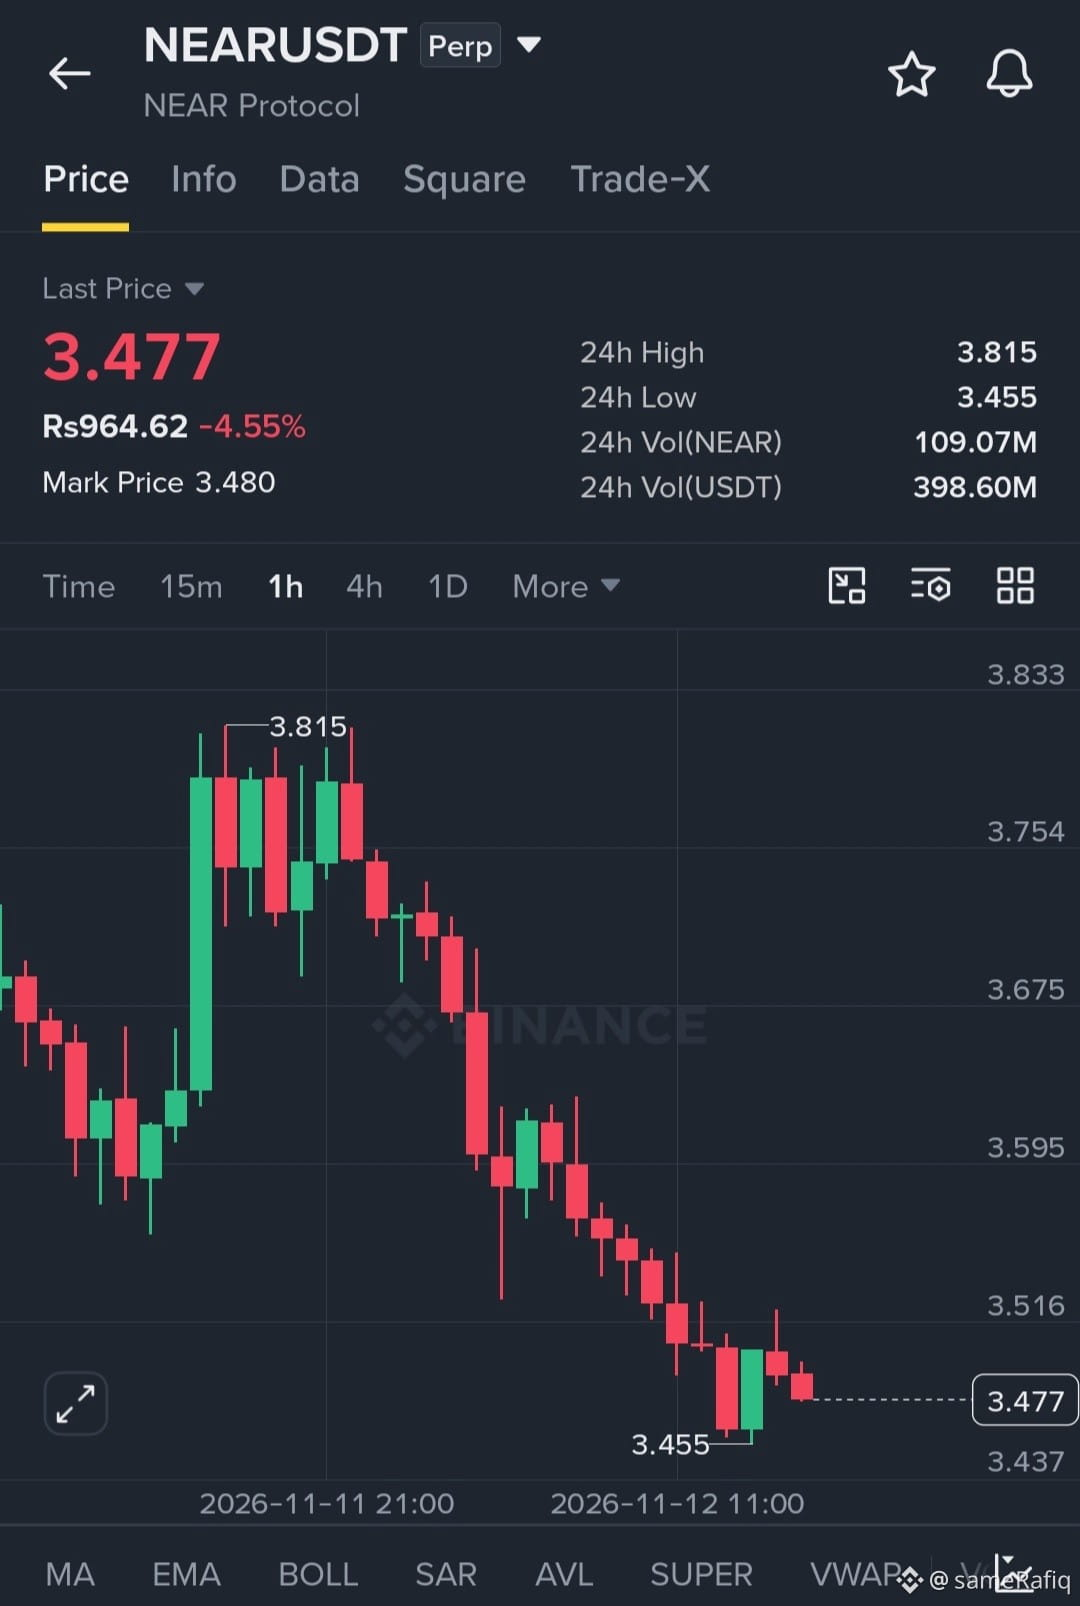
Opening a short position on $NEAR as bearish pressure continues to dominate.
Entry: 3.485 – 3.518
TP1: 3.339
TP2: 3.209
SL: 3.624
NEAR is showing continued weakness, with sellers maintaining control. Further downside could bring price toward daily support.
$NEAR
{spot}(NEARUSDT)
#HuangRisksOusterOverReportedAffairWithSubordinate #AnthropicRejectsIPODelayValuationinQuestion #CoreWeaveJumps10%On168%RevenueGrowth #MSCIRemovalMayCurbStrategy’sBitcoinBuying #HKSFCSaysTokenizationMovingToCommercialUse
Opening a short position on $NEAR as bearish pressure continues to dominate.
Entry: 3.485 – 3.518
TP1: 3.339
TP2: 3.209
SL: 3.624
NEAR is showing continued weakness, with sellers maintaining control. Further downside could bring price toward daily support.
$NEAR
#HuangRisksOusterOverReportedAffairWithSubordinate #AnthropicRejectsIPODelayValuationinQuestion #CoreWeaveJumps10%On168%RevenueGrowth #MSCIRemovalMayCurbStrategy’sBitcoinBuying #HKSFCSaysTokenizationMovingToCommercialUse
Entry: 3.485 – 3.518
TP1: 3.339
TP2: 3.209
SL: 3.624
NEAR is showing continued weakness, with sellers maintaining control. Further downside could bring price toward daily support.
$NEAR
#HuangRisksOusterOverReportedAffairWithSubordinate #AnthropicRejectsIPODelayValuationinQuestion #CoreWeaveJumps10%On168%RevenueGrowth #MSCIRemovalMayCurbStrategy’sBitcoinBuying #HKSFCSaysTokenizationMovingToCommercialUse
16

·
--
Рост
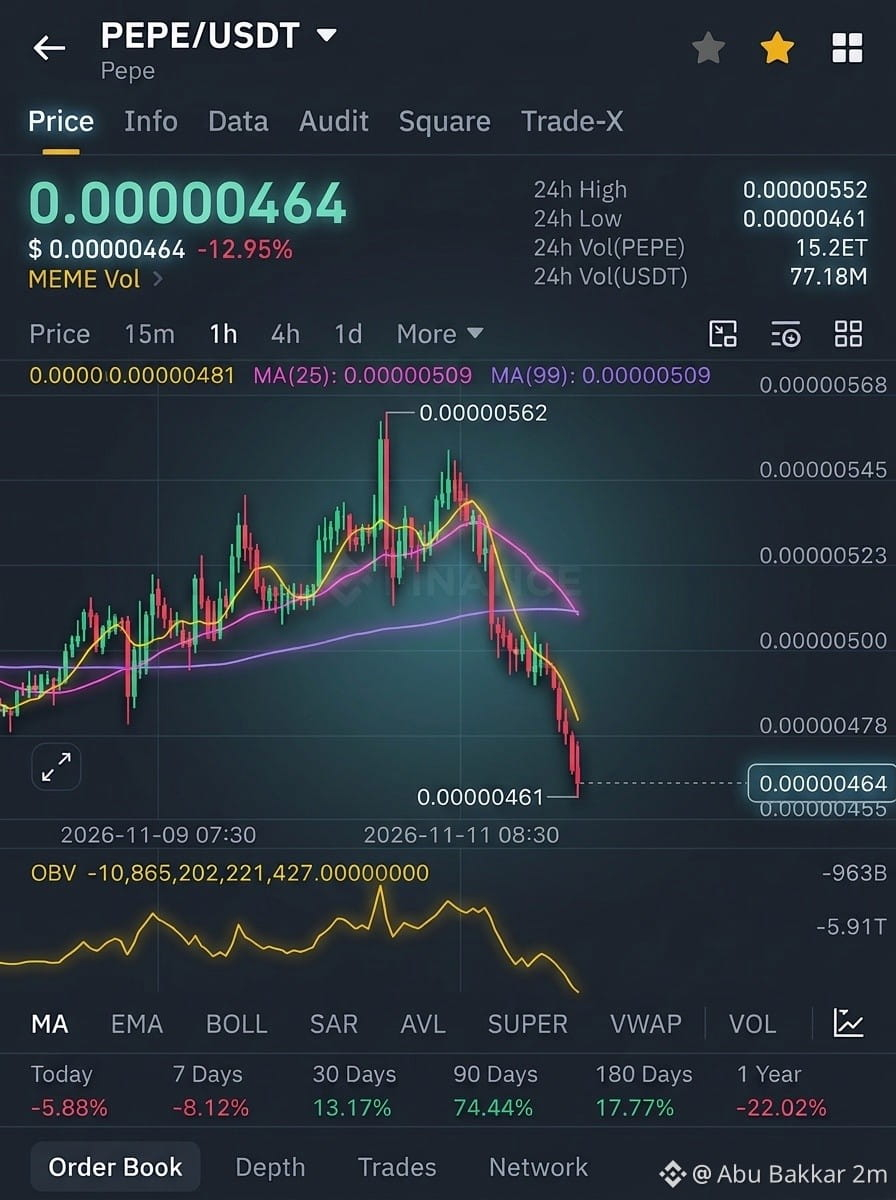
🚨 $PEPE UNDER HEAVY SELLING PRESSURE! 🐸📉
Is PEPE preparing for a deeper correction, or could a reversal be approaching?
📊 Market Breakdown (1H Chart)
💰 Current Price: $0.00000464 🔻 24H Change: -12.95% 📈 24H High: $0.00000552 📉 24H Low: $0.00000461
🔍 Technical Analysis:
• PEPE is trading below both MA(25) and MA(99), indicating strong bearish momentum. • The price has dropped sharply from the $0.00000562 peak. • OBV is declining, suggesting increasing selling pressure. • $0.00000461 is the immediate support level to watch.
🎯 Key Levels to Watch:
Support: $0.00000461–$0.00000455
Resistance: $0.00000478
Major Resistance: $0.00000500–$0.00000509
⚠️ What Comes Next?
A breakdown below $0.00000461 could expose PEPE to further downside. However, a strong recovery above $0.00000478, supported by rising volume, could signal an early attempt at reversal.
👀 The big question: Can PEPE bulls defend the $0.00000461 support zone, or will sellers take control again?
#PEPE #PEPEUSDT #Binance #CryptoAnalysis #Altcoins #TradingSignals #TechnicalAnalysis
#CoreWeaveJumps10%On168%RevenueGrowth #CanNvidiaEarningsEaseMarketConcerns? #HKSFCSaysTokenizationMovingToCommercialUse #CanNvidiaEarningsEaseMarketConcerns? $AAPLB $AVGOB
🚨 $PEPE UNDER HEAVY SELLING PRESSURE! 🐸📉
Is PEPE preparing for a deeper correction, or could a reversal be approaching?
📊 Market Breakdown (1H Chart)
💰 Current Price: $0.00000464 🔻 24H Change: -12.95% 📈 24H High: $0.00000552 📉 24H Low: $0.00000461
🔍 Technical Analysis:
• PEPE is trading below both MA(25) and MA(99), indicating strong bearish momentum. • The price has dropped sharply from the $0.00000562 peak. • OBV is declining, suggesting increasing selling pressure. • $0.00000461 is the immediate support level to watch.
🎯 Key Levels to Watch:
Support: $0.00000461–$0.00000455
Resistance: $0.00000478
Major Resistance: $0.00000500–$0.00000509
⚠️ What Comes Next?
A breakdown below $0.00000461 could expose PEPE to further downside. However, a strong recovery above $0.00000478, supported by rising volume, could signal an early attempt at reversal.
👀 The big question: Can PEPE bulls defend the $0.00000461 support zone, or will sellers take control again?
#PEPE #PEPEUSDT #Binance #CryptoAnalysis #Altcoins #TradingSignals #TechnicalAnalysis
#CoreWeaveJumps10%On168%RevenueGrowth #CanNvidiaEarningsEaseMarketConcerns? #HKSFCSaysTokenizationMovingToCommercialUse #CanNvidiaEarningsEaseMarketConcerns? $AAPLB $AVGOB
Is PEPE preparing for a deeper correction, or could a reversal be approaching?
📊 Market Breakdown (1H Chart)
💰 Current Price: $0.00000464 🔻 24H Change: -12.95% 📈 24H High: $0.00000552 📉 24H Low: $0.00000461
🔍 Technical Analysis:
• PEPE is trading below both MA(25) and MA(99), indicating strong bearish momentum. • The price has dropped sharply from the $0.00000562 peak. • OBV is declining, suggesting increasing selling pressure. • $0.00000461 is the immediate support level to watch.
🎯 Key Levels to Watch:
Support: $0.00000461–$0.00000455
Resistance: $0.00000478
Major Resistance: $0.00000500–$0.00000509
⚠️ What Comes Next?
A breakdown below $0.00000461 could expose PEPE to further downside. However, a strong recovery above $0.00000478, supported by rising volume, could signal an early attempt at reversal.
👀 The big question: Can PEPE bulls defend the $0.00000461 support zone, or will sellers take control again?
#PEPE #PEPEUSDT #Binance #CryptoAnalysis #Altcoins #TradingSignals #TechnicalAnalysis
#CoreWeaveJumps10%On168%RevenueGrowth #CanNvidiaEarningsEaseMarketConcerns? #HKSFCSaysTokenizationMovingToCommercialUse #CanNvidiaEarningsEaseMarketConcerns? $AAPLB $AVGOB
22


·
--
Рост
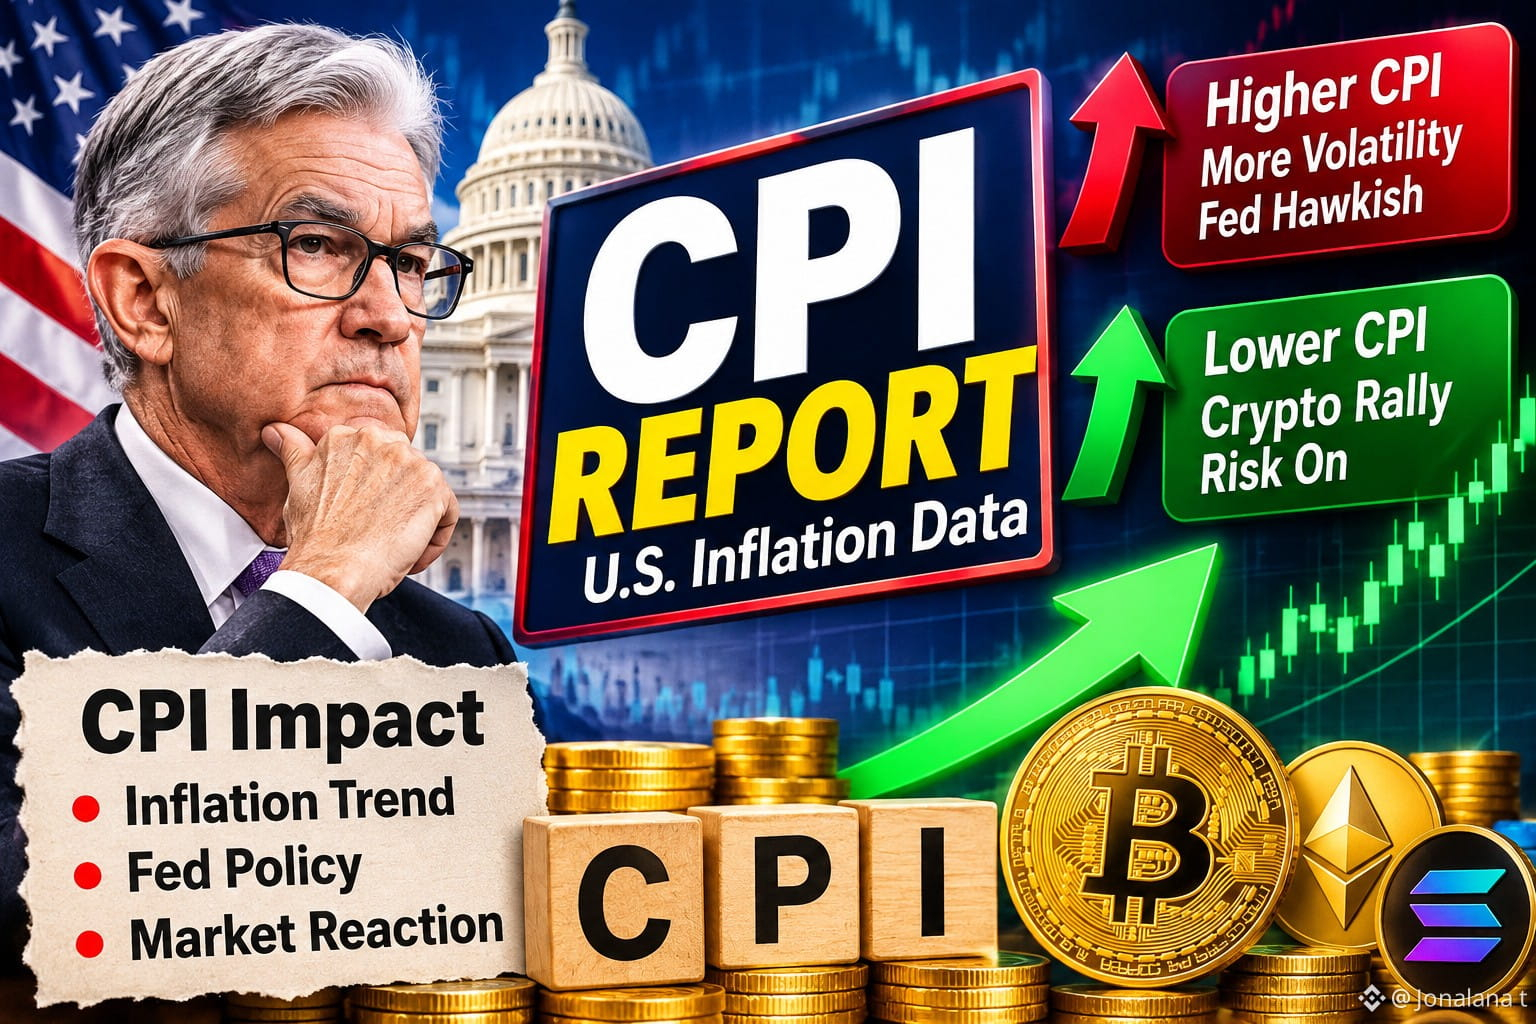
The CPI report is a key market catalyst! Lower inflation could boost risk appetite and fuel a crypto rally, while hotter data may increase volatility. Watch Fed signals and market reaction! 📊🚀#HuangRisksOusterOverReportedAffairWithSubordinate #AnthropicRejectsIPODelayValuationinQuestion #CoreWeaveJumps10%On168%RevenueGrowth #MSCIRemovalMayCurbStrategy’sBitcoinBuying #HKSFCSaysTokenizationMovingToCommercialUse $BTC
$BNB
$ETH
{future}(ETHUSDT)
The CPI report is a key market catalyst! Lower inflation could boost risk appetite and fuel a crypto rally, while hotter data may increase volatility. Watch Fed signals and market reaction! 📊🚀#HuangRisksOusterOverReportedAffairWithSubordinate #AnthropicRejectsIPODelayValuationinQuestion #CoreWeaveJumps10%On168%RevenueGrowth #MSCIRemovalMayCurbStrategy’sBitcoinBuying #HKSFCSaysTokenizationMovingToCommercialUse $BTC
$BNB
$ETH
$BNB
$ETH
70
·
--
Рост
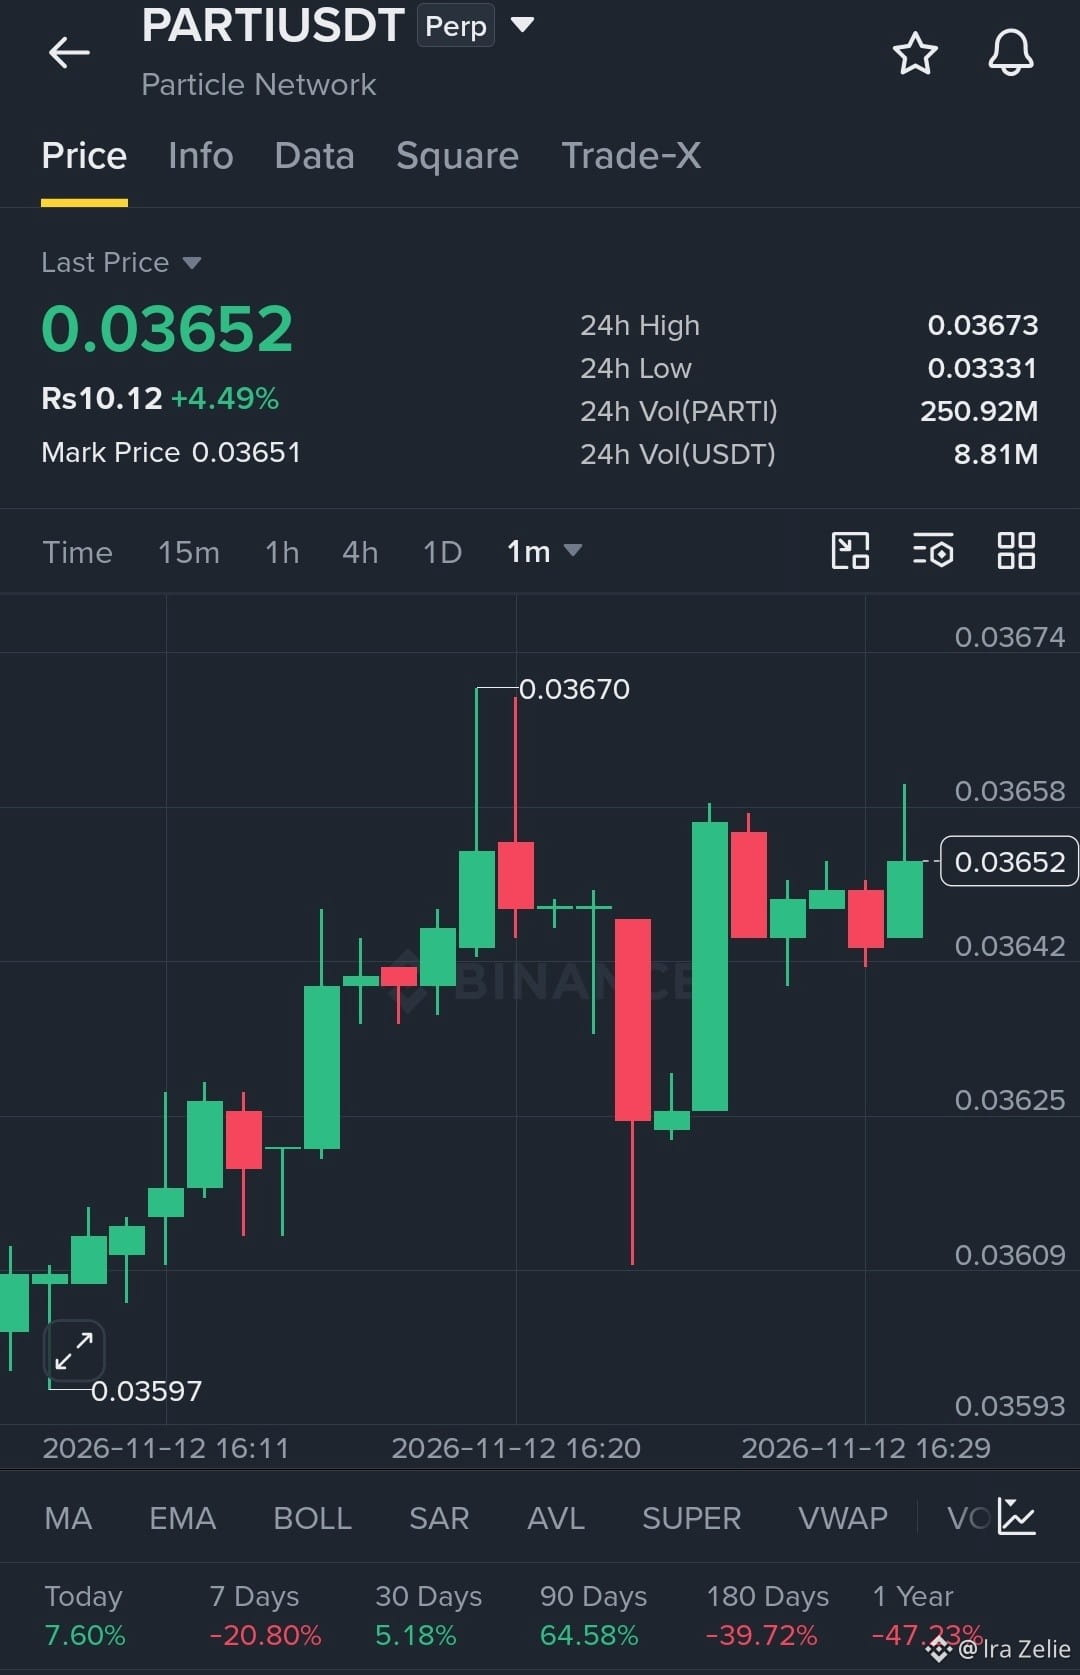
$PARTI Showing Strong Recovery! Buyers Are Pushing Higher as Bullish Momentum Builds
PARTI is gaining strength with several strong green candles, showing that buyers are stepping back into the market. The price is approaching an important resistance zone, while RSI is getting close to overbought territory. A little caution is needed, but the upside targets remain in focus.
Long Entry: 0.0363 – 0.0366
TP1: 0.0370
TP2: 0.0375
TP3: 0.0380
Stop Loss: 0.0357
As long as PARTI holds above 0.0354, the bullish recovery remains valid. Watch for confirmation before entering, and manage your risk carefully.
DYOR • NFA
Let's go and trade $PARTI
{spot}(PARTIUSDT)
#HuangRisksOusterOverReportedAffairWithSubordinate #AnthropicRejectsIPODelayValuationinQuestion #MSCIRemovalMayCurbStrategy’sBitcoinBuying #HKSFCSaysTokenizationMovingToCommercialUse #PythAddsNYSERealTimeDataToMarketplace
$PARTI Showing Strong Recovery! Buyers Are Pushing Higher as Bullish Momentum Builds
PARTI is gaining strength with several strong green candles, showing that buyers are stepping back into the market. The price is approaching an important resistance zone, while RSI is getting close to overbought territory. A little caution is needed, but the upside targets remain in focus.
Long Entry: 0.0363 – 0.0366
TP1: 0.0370
TP2: 0.0375
TP3: 0.0380
Stop Loss: 0.0357
As long as PARTI holds above 0.0354, the bullish recovery remains valid. Watch for confirmation before entering, and manage your risk carefully.
DYOR • NFA
Let's go and trade $PARTI
#HuangRisksOusterOverReportedAffairWithSubordinate #AnthropicRejectsIPODelayValuationinQuestion #MSCIRemovalMayCurbStrategy’sBitcoinBuying #HKSFCSaysTokenizationMovingToCommercialUse #PythAddsNYSERealTimeDataToMarketplace
PARTI is gaining strength with several strong green candles, showing that buyers are stepping back into the market. The price is approaching an important resistance zone, while RSI is getting close to overbought territory. A little caution is needed, but the upside targets remain in focus.
Long Entry: 0.0363 – 0.0366
TP1: 0.0370
TP2: 0.0375
TP3: 0.0380
Stop Loss: 0.0357
As long as PARTI holds above 0.0354, the bullish recovery remains valid. Watch for confirmation before entering, and manage your risk carefully.
DYOR • NFA
Let's go and trade $PARTI
#HuangRisksOusterOverReportedAffairWithSubordinate #AnthropicRejectsIPODelayValuationinQuestion #MSCIRemovalMayCurbStrategy’sBitcoinBuying #HKSFCSaysTokenizationMovingToCommercialUse #PythAddsNYSERealTimeDataToMarketplace
70


·
--
Рост
$SXT USDT (+5.84%)
SXT is showing a positive recovery. A successful retest of the entry area could create an opportunity for another upward move.
EP: 0.009755 – 0.009805
TP1: 0.009953
TP2: 0.010051
TP3: 0.010150
SL: 0.009608
#HuangRisksOusterOverReportedAffairWithSubordinate #PythAddsNYSERealTimeDataToMarketplace #CanNvidiaEarningsEaseMarketConcerns? #HKSFCSaysTokenizationMovingToCommercialUse
$SXT
{future}(SXTUSDT)
$SXT USDT (+5.84%)
SXT is showing a positive recovery. A successful retest of the entry area could create an opportunity for another upward move.
EP: 0.009755 – 0.009805
TP1: 0.009953
TP2: 0.010051
TP3: 0.010150
SL: 0.009608
#HuangRisksOusterOverReportedAffairWithSubordinate #PythAddsNYSERealTimeDataToMarketplace #CanNvidiaEarningsEaseMarketConcerns? #HKSFCSaysTokenizationMovingToCommercialUse
$SXT
SXT is showing a positive recovery. A successful retest of the entry area could create an opportunity for another upward move.
EP: 0.009755 – 0.009805
TP1: 0.009953
TP2: 0.010051
TP3: 0.010150
SL: 0.009608
#HuangRisksOusterOverReportedAffairWithSubordinate #PythAddsNYSERealTimeDataToMarketplace #CanNvidiaEarningsEaseMarketConcerns? #HKSFCSaysTokenizationMovingToCommercialUse
$SXT
39

·
--
Рост
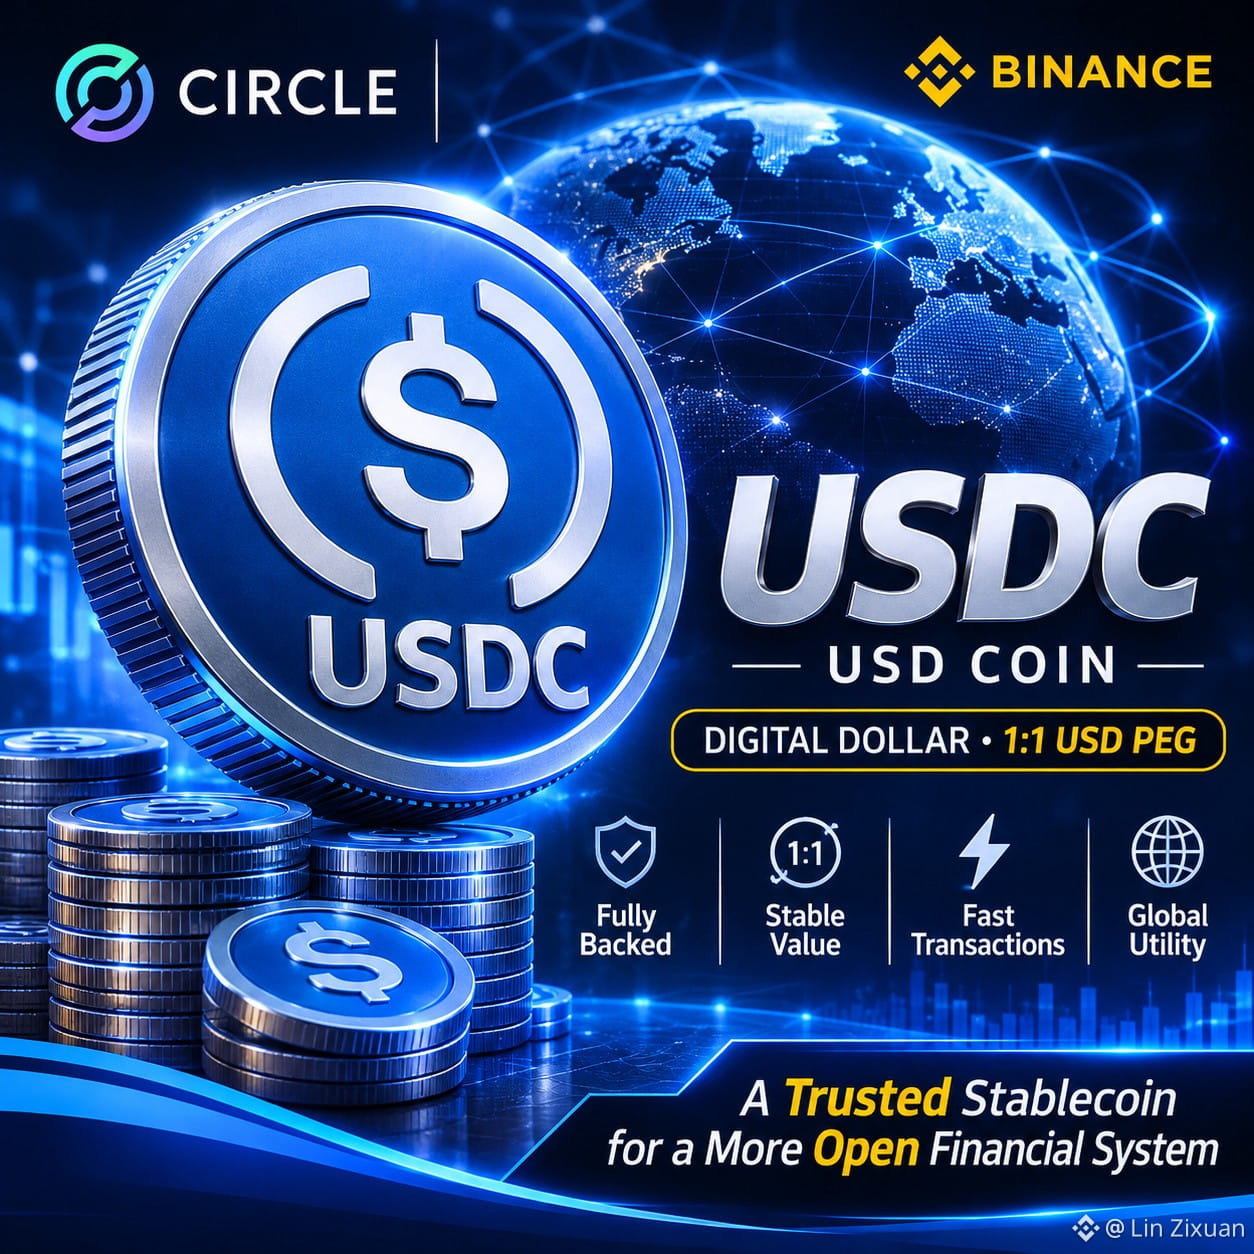
💵 $USDC — Stability in a Volatile Crypto Market
While Bitcoin and other cryptocurrencies experience price swings, $USDC offers something different: stability.
$USDC
{spot}(USDCUSDT)
is designed to maintain a 1:1 value with the US dollar and is backed by cash and cash-equivalent reserves.
Sometimes, protecting your capital matters more than chasing profits.
What's your choice: USDC or USDT?
#USDC #Crypto #Stablecoin #BinanceSquare #CoreWeaveJumps10%On168%RevenueGrowth #HKSFCSaysTokenizationMovingToCommercialUse #PythAddsNYSERealTimeDataToMarketplace
💵 $USDC — Stability in a Volatile Crypto Market
While Bitcoin and other cryptocurrencies experience price swings, $USDC offers something different: stability.
$USDC
is designed to maintain a 1:1 value with the US dollar and is backed by cash and cash-equivalent reserves.
Sometimes, protecting your capital matters more than chasing profits.
What's your choice: USDC or USDT?
#USDC #Crypto #Stablecoin #BinanceSquare #CoreWeaveJumps10%On168%RevenueGrowth #HKSFCSaysTokenizationMovingToCommercialUse #PythAddsNYSERealTimeDataToMarketplace
While Bitcoin and other cryptocurrencies experience price swings, $USDC offers something different: stability.
$USDC
is designed to maintain a 1:1 value with the US dollar and is backed by cash and cash-equivalent reserves.
Sometimes, protecting your capital matters more than chasing profits.
What's your choice: USDC or USDT?
#USDC #Crypto #Stablecoin #BinanceSquare #CoreWeaveJumps10%On168%RevenueGrowth #HKSFCSaysTokenizationMovingToCommercialUse #PythAddsNYSERealTimeDataToMarketplace
7
·
--
Рост
$ONE USDT (+12.27%)
ONE is attracting buyers with a 12.27% gain. Momentum is positive, but I would avoid entering during an extended upward candle.
EP: 0.0017067 – 0.0017153
TP1: 0.0017411
TP2: 0.0017584
TP3: 0.0017756
SL: 0.0016808
#HuangRisksOusterOverReportedAffairWithSubordinate #AnthropicRejectsIPODelayValuationinQuestion #CoreWeaveJumps10%On168%RevenueGrowth #HKSFCSaysTokenizationMovingToCommercialUse
$ONE
{future}(ONEUSDT)
$ONE USDT (+12.27%)
ONE is attracting buyers with a 12.27% gain. Momentum is positive, but I would avoid entering during an extended upward candle.
EP: 0.0017067 – 0.0017153
TP1: 0.0017411
TP2: 0.0017584
TP3: 0.0017756
SL: 0.0016808
#HuangRisksOusterOverReportedAffairWithSubordinate #AnthropicRejectsIPODelayValuationinQuestion #CoreWeaveJumps10%On168%RevenueGrowth #HKSFCSaysTokenizationMovingToCommercialUse
$ONE
ONE is attracting buyers with a 12.27% gain. Momentum is positive, but I would avoid entering during an extended upward candle.
EP: 0.0017067 – 0.0017153
TP1: 0.0017411
TP2: 0.0017584
TP3: 0.0017756
SL: 0.0016808
#HuangRisksOusterOverReportedAffairWithSubordinate #AnthropicRejectsIPODelayValuationinQuestion #CoreWeaveJumps10%On168%RevenueGrowth #HKSFCSaysTokenizationMovingToCommercialUse
$ONE
39
·
--
Рост
$RUM USDT (+11.71%)
RUM is showing healthy upside momentum. Buyers currently have the advantage, but a confirmed hold around the entry zone is necessary.
EP: 5.876 – 5.905
TP1: 5.994
TP2: 6.054
TP3: 6.113
SL: 5.787
#HuangRisksOusterOverReportedAffairWithSubordinate #PythAddsNYSERealTimeDataToMarketplace #CanNvidiaEarningsEaseMarketConcerns? #HKSFCSaysTokenizationMovingToCommercialUse
$RUM
{future}(RUMUSDT)
$RUM USDT (+11.71%)
RUM is showing healthy upside momentum. Buyers currently have the advantage, but a confirmed hold around the entry zone is necessary.
EP: 5.876 – 5.905
TP1: 5.994
TP2: 6.054
TP3: 6.113
SL: 5.787
#HuangRisksOusterOverReportedAffairWithSubordinate #PythAddsNYSERealTimeDataToMarketplace #CanNvidiaEarningsEaseMarketConcerns? #HKSFCSaysTokenizationMovingToCommercialUse
$RUM
RUM is showing healthy upside momentum. Buyers currently have the advantage, but a confirmed hold around the entry zone is necessary.
EP: 5.876 – 5.905
TP1: 5.994
TP2: 6.054
TP3: 6.113
SL: 5.787
#HuangRisksOusterOverReportedAffairWithSubordinate #PythAddsNYSERealTimeDataToMarketplace #CanNvidiaEarningsEaseMarketConcerns? #HKSFCSaysTokenizationMovingToCommercialUse
$RUM
35

·
--
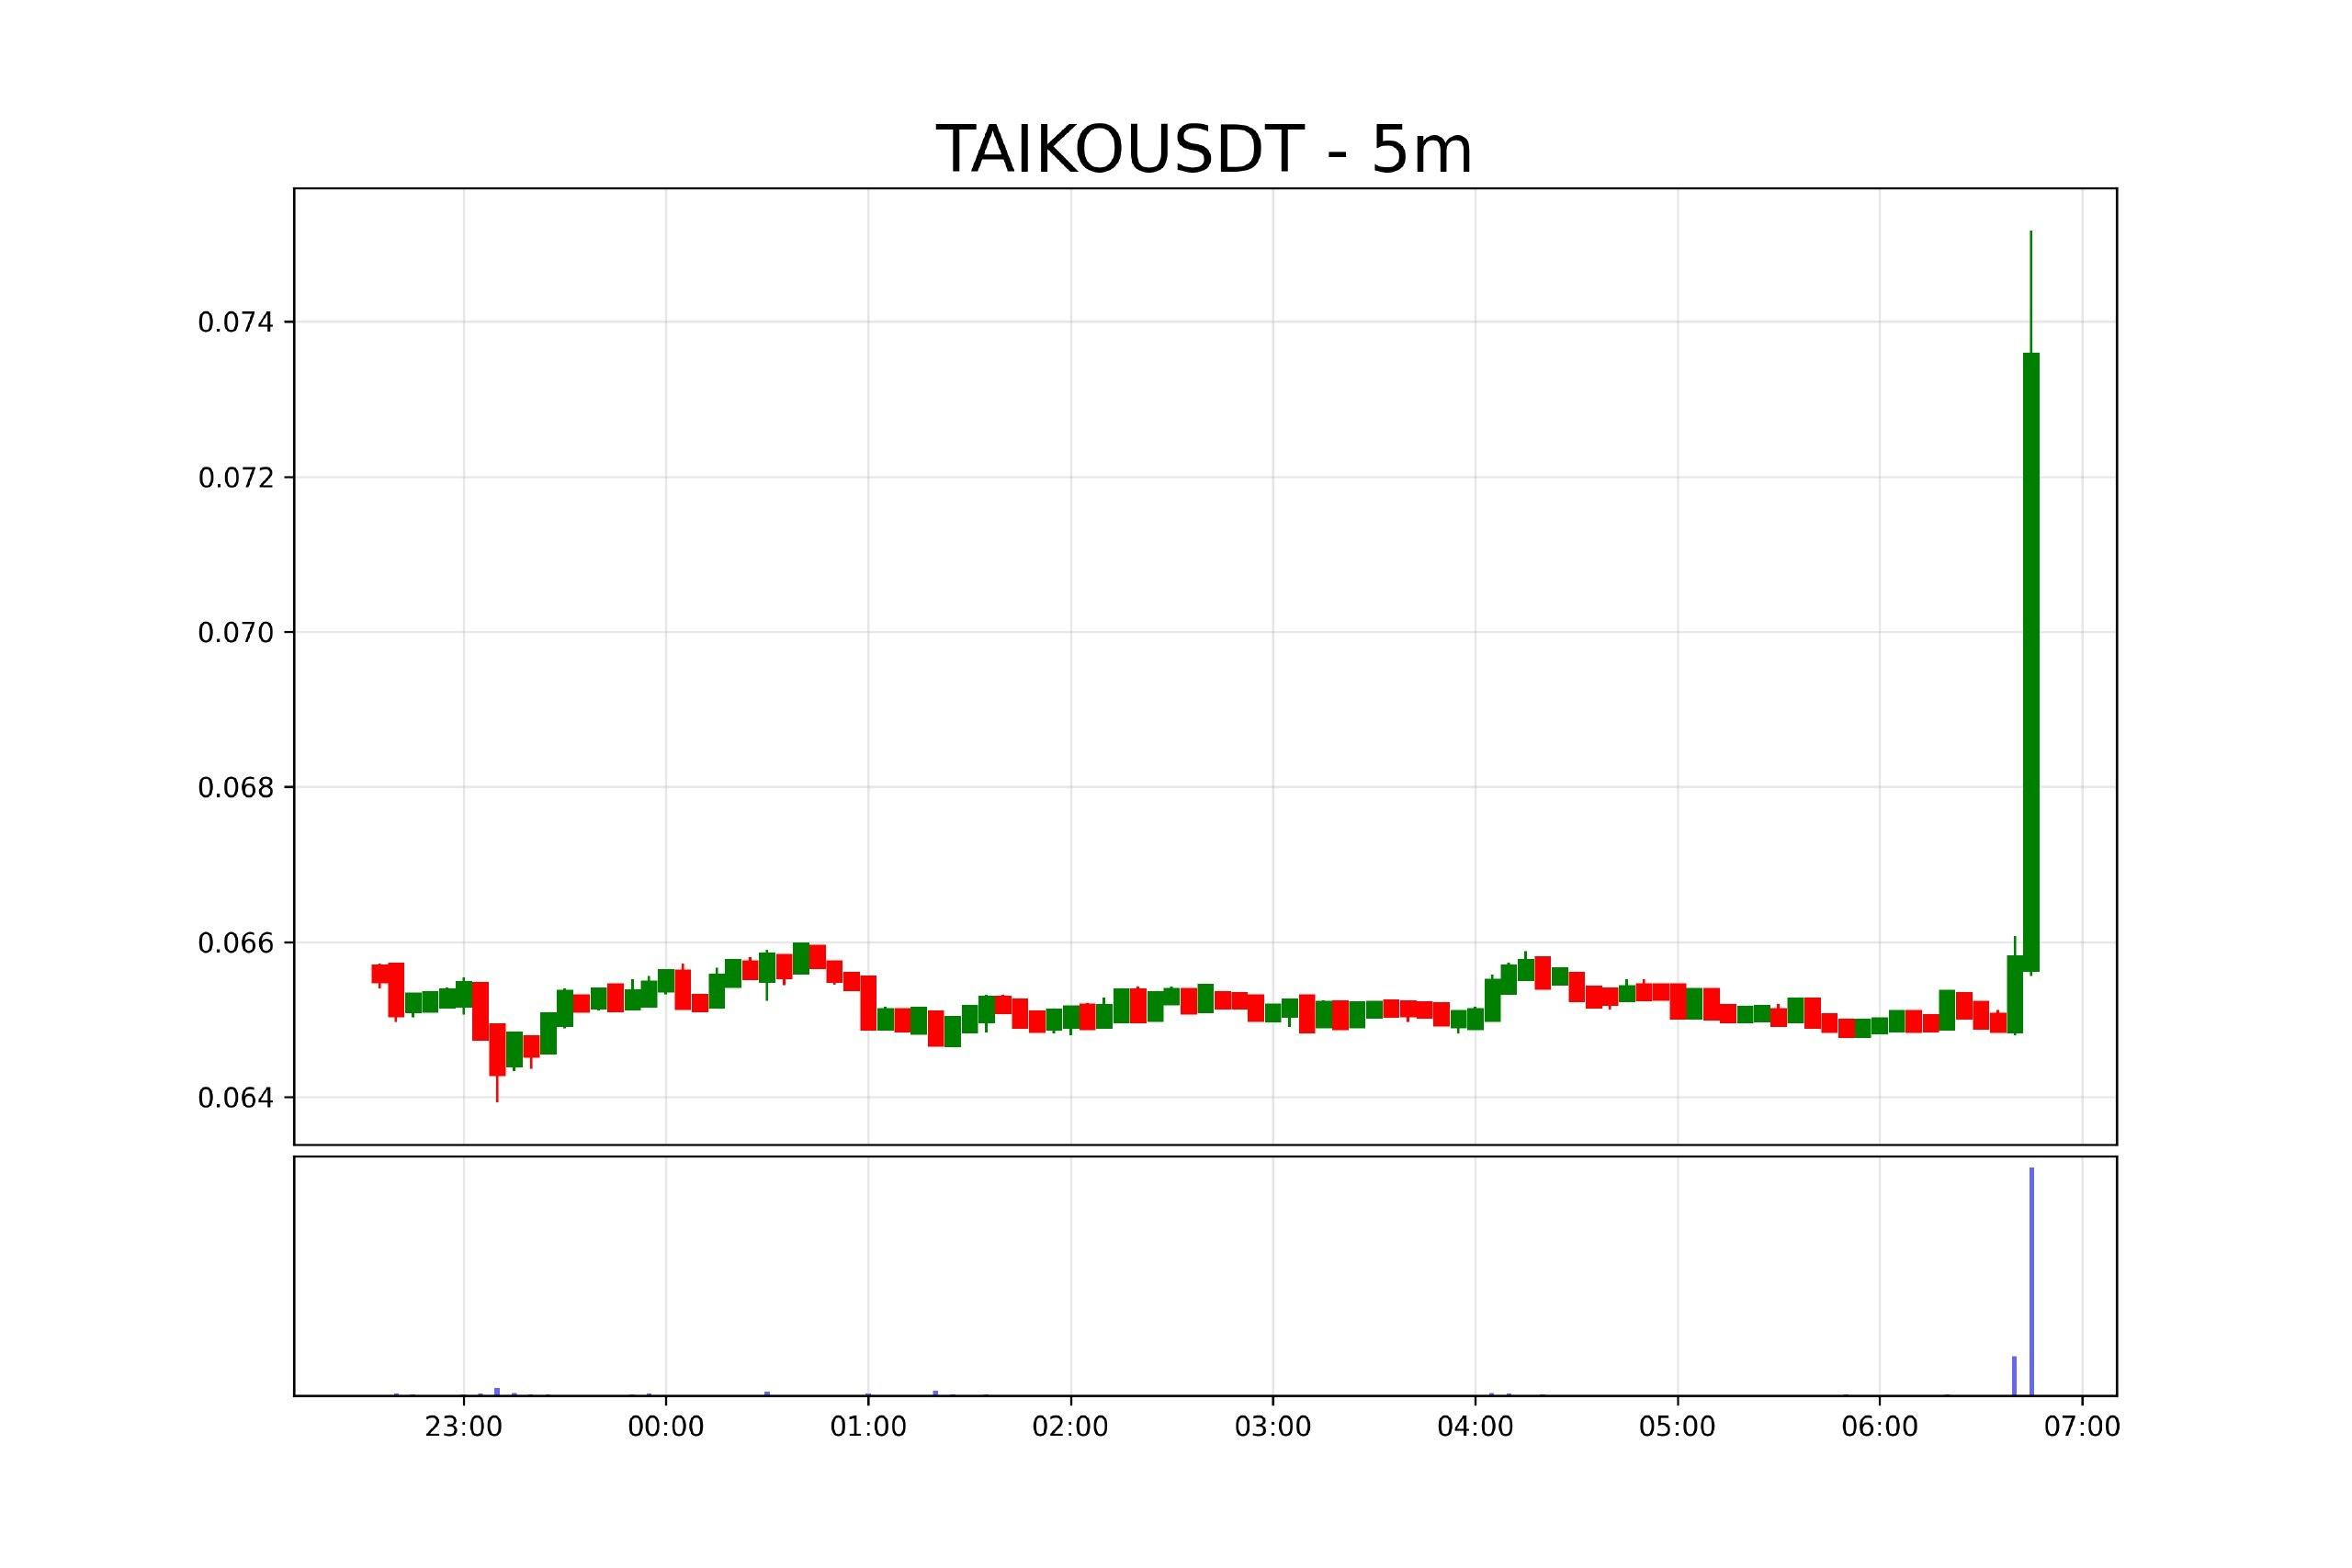
🚀 $TAIKO — MASSIVE VOLUME EXPLOSION! BULLS ARE ACTIVE! 🔥
TAIKO is showing impressive bullish momentum, with volume exploding by 5,211% and price gaining 11.7% in 24 hours. Trading activity is heating up, suggesting strong market interest and potential continuation.
🟢 LONG SETUP
💰 Current Price: 0.0735
📍 Entry Range: 0.0715 – 0.0735
🎯 TP1: 0.0755
🎯 TP2: 0.0780
🎯 Final Target: 0.0820
🛑 Stop Loss: 0.0690
📊 Market Outlook:
The massive volume expansion signals aggressive trading activity and strengthening short-term momentum. The 0.0715 area is an important zone to watch; holding above it could support another upward move. A confirmed breakout above 0.0755 may open the door toward higher targets.
⚠️ Risk Management: Wait for a proper pullback or breakout confirmation. Avoid chasing an extended pump and always use a stop loss.
Trade on $TAIKO
{future}(TAIKOUSDT)
#HKSFCSaysTokenizationMovingToCommercialUse #AnthropicRejectsIPODelayValuationinQuestion #PythAddsNYSERealTimeDataToMarketplace
🚀 $TAIKO — MASSIVE VOLUME EXPLOSION! BULLS ARE ACTIVE! 🔥
TAIKO is showing impressive bullish momentum, with volume exploding by 5,211% and price gaining 11.7% in 24 hours. Trading activity is heating up, suggesting strong market interest and potential continuation.
🟢 LONG SETUP
💰 Current Price: 0.0735
📍 Entry Range: 0.0715 – 0.0735
🎯 TP1: 0.0755
🎯 TP2: 0.0780
🎯 Final Target: 0.0820
🛑 Stop Loss: 0.0690
📊 Market Outlook:
The massive volume expansion signals aggressive trading activity and strengthening short-term momentum. The 0.0715 area is an important zone to watch; holding above it could support another upward move. A confirmed breakout above 0.0755 may open the door toward higher targets.
⚠️ Risk Management: Wait for a proper pullback or breakout confirmation. Avoid chasing an extended pump and always use a stop loss.
Trade on $TAIKO
#HKSFCSaysTokenizationMovingToCommercialUse #AnthropicRejectsIPODelayValuationinQuestion #PythAddsNYSERealTimeDataToMarketplace
TAIKO is showing impressive bullish momentum, with volume exploding by 5,211% and price gaining 11.7% in 24 hours. Trading activity is heating up, suggesting strong market interest and potential continuation.
🟢 LONG SETUP
💰 Current Price: 0.0735
📍 Entry Range: 0.0715 – 0.0735
🎯 TP1: 0.0755
🎯 TP2: 0.0780
🎯 Final Target: 0.0820
🛑 Stop Loss: 0.0690
📊 Market Outlook:
The massive volume expansion signals aggressive trading activity and strengthening short-term momentum. The 0.0715 area is an important zone to watch; holding above it could support another upward move. A confirmed breakout above 0.0755 may open the door toward higher targets.
⚠️ Risk Management: Wait for a proper pullback or breakout confirmation. Avoid chasing an extended pump and always use a stop loss.
Trade on $TAIKO
#HKSFCSaysTokenizationMovingToCommercialUse #AnthropicRejectsIPODelayValuationinQuestion #PythAddsNYSERealTimeDataToMarketplace
41
·
--
Рост
$AMD USDT (+6.28%)
AMD is gaining ground with positive market sentiment. Buyers have an opportunity to continue the move if the pullback zone holds.
EP: 571.27 – 574.15
TP1: 582.81
TP2: 588.58
TP3: 594.35
SL: 562.61
#PythAddsNYSERealTimeDataToMarketplace #CanNvidiaEarningsEaseMarketConcerns? #HKSFCSaysTokenizationMovingToCommercialUse
$AMD
{future}(AMDUSDT)
$AMD USDT (+6.28%)
AMD is gaining ground with positive market sentiment. Buyers have an opportunity to continue the move if the pullback zone holds.
EP: 571.27 – 574.15
TP1: 582.81
TP2: 588.58
TP3: 594.35
SL: 562.61
#PythAddsNYSERealTimeDataToMarketplace #CanNvidiaEarningsEaseMarketConcerns? #HKSFCSaysTokenizationMovingToCommercialUse
$AMD
AMD is gaining ground with positive market sentiment. Buyers have an opportunity to continue the move if the pullback zone holds.
EP: 571.27 – 574.15
TP1: 582.81
TP2: 588.58
TP3: 594.35
SL: 562.61
#PythAddsNYSERealTimeDataToMarketplace #CanNvidiaEarningsEaseMarketConcerns? #HKSFCSaysTokenizationMovingToCommercialUse
$AMD
37

·
--
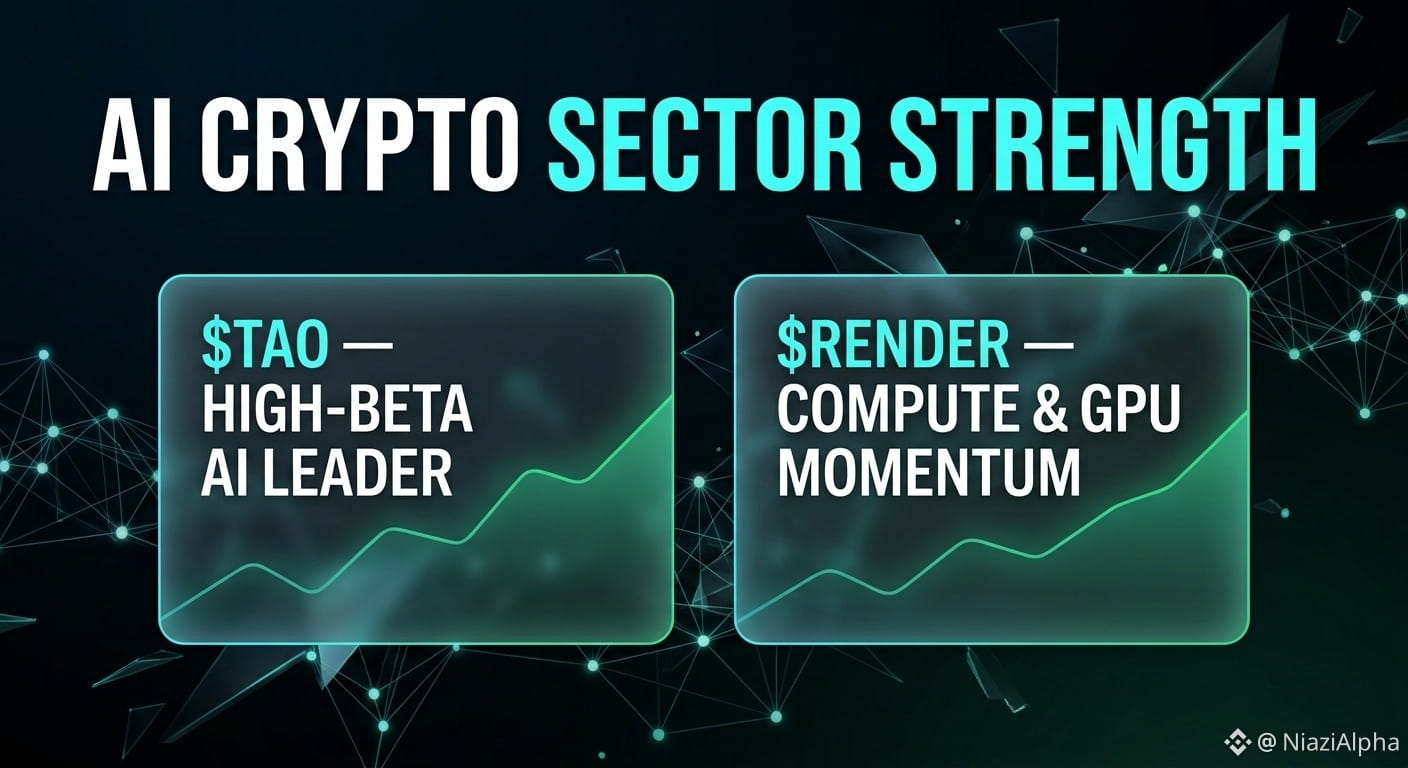
AI tokens are showing the strongest relative strength on the entire market this week.
Every time $BTC pauses near $73,800, liquidity immediately rotates back into high-beta AI plays like $TAO and $RENDER
{future}(RENDERUSDT)
. When the broader market finally flips green, the coins that refused to drop usually lead the first 20% to 30% rally.
Which AI coin is on your watchlist for the next leg up?
#HuangRisksOusterOverReportedAffairWithSubordinate #AnthropicRejectsIPODelayValuationinQuestion #CoreWeaveJumps10%On168%RevenueGrowth #MSCIRemovalMayCurbStrategy’sBitcoinBuying #HKSFCSaysTokenizationMovingToCommercialUse #AICrypto #Altcoins $TAO $RENDER
AI tokens are showing the strongest relative strength on the entire market this week.
Every time $BTC pauses near $73,800, liquidity immediately rotates back into high-beta AI plays like $TAO and $RENDER
. When the broader market finally flips green, the coins that refused to drop usually lead the first 20% to 30% rally.
Which AI coin is on your watchlist for the next leg up?
#HuangRisksOusterOverReportedAffairWithSubordinate #AnthropicRejectsIPODelayValuationinQuestion #CoreWeaveJumps10%On168%RevenueGrowth #MSCIRemovalMayCurbStrategy’sBitcoinBuying #HKSFCSaysTokenizationMovingToCommercialUse #AICrypto #Altcoins $TAO $RENDER
Every time $BTC pauses near $73,800, liquidity immediately rotates back into high-beta AI plays like $TAO and $RENDER
. When the broader market finally flips green, the coins that refused to drop usually lead the first 20% to 30% rally.
Which AI coin is on your watchlist for the next leg up?
#HuangRisksOusterOverReportedAffairWithSubordinate #AnthropicRejectsIPODelayValuationinQuestion #CoreWeaveJumps10%On168%RevenueGrowth #MSCIRemovalMayCurbStrategy’sBitcoinBuying #HKSFCSaysTokenizationMovingToCommercialUse #AICrypto #Altcoins $TAO $RENDER
1
129

·
--
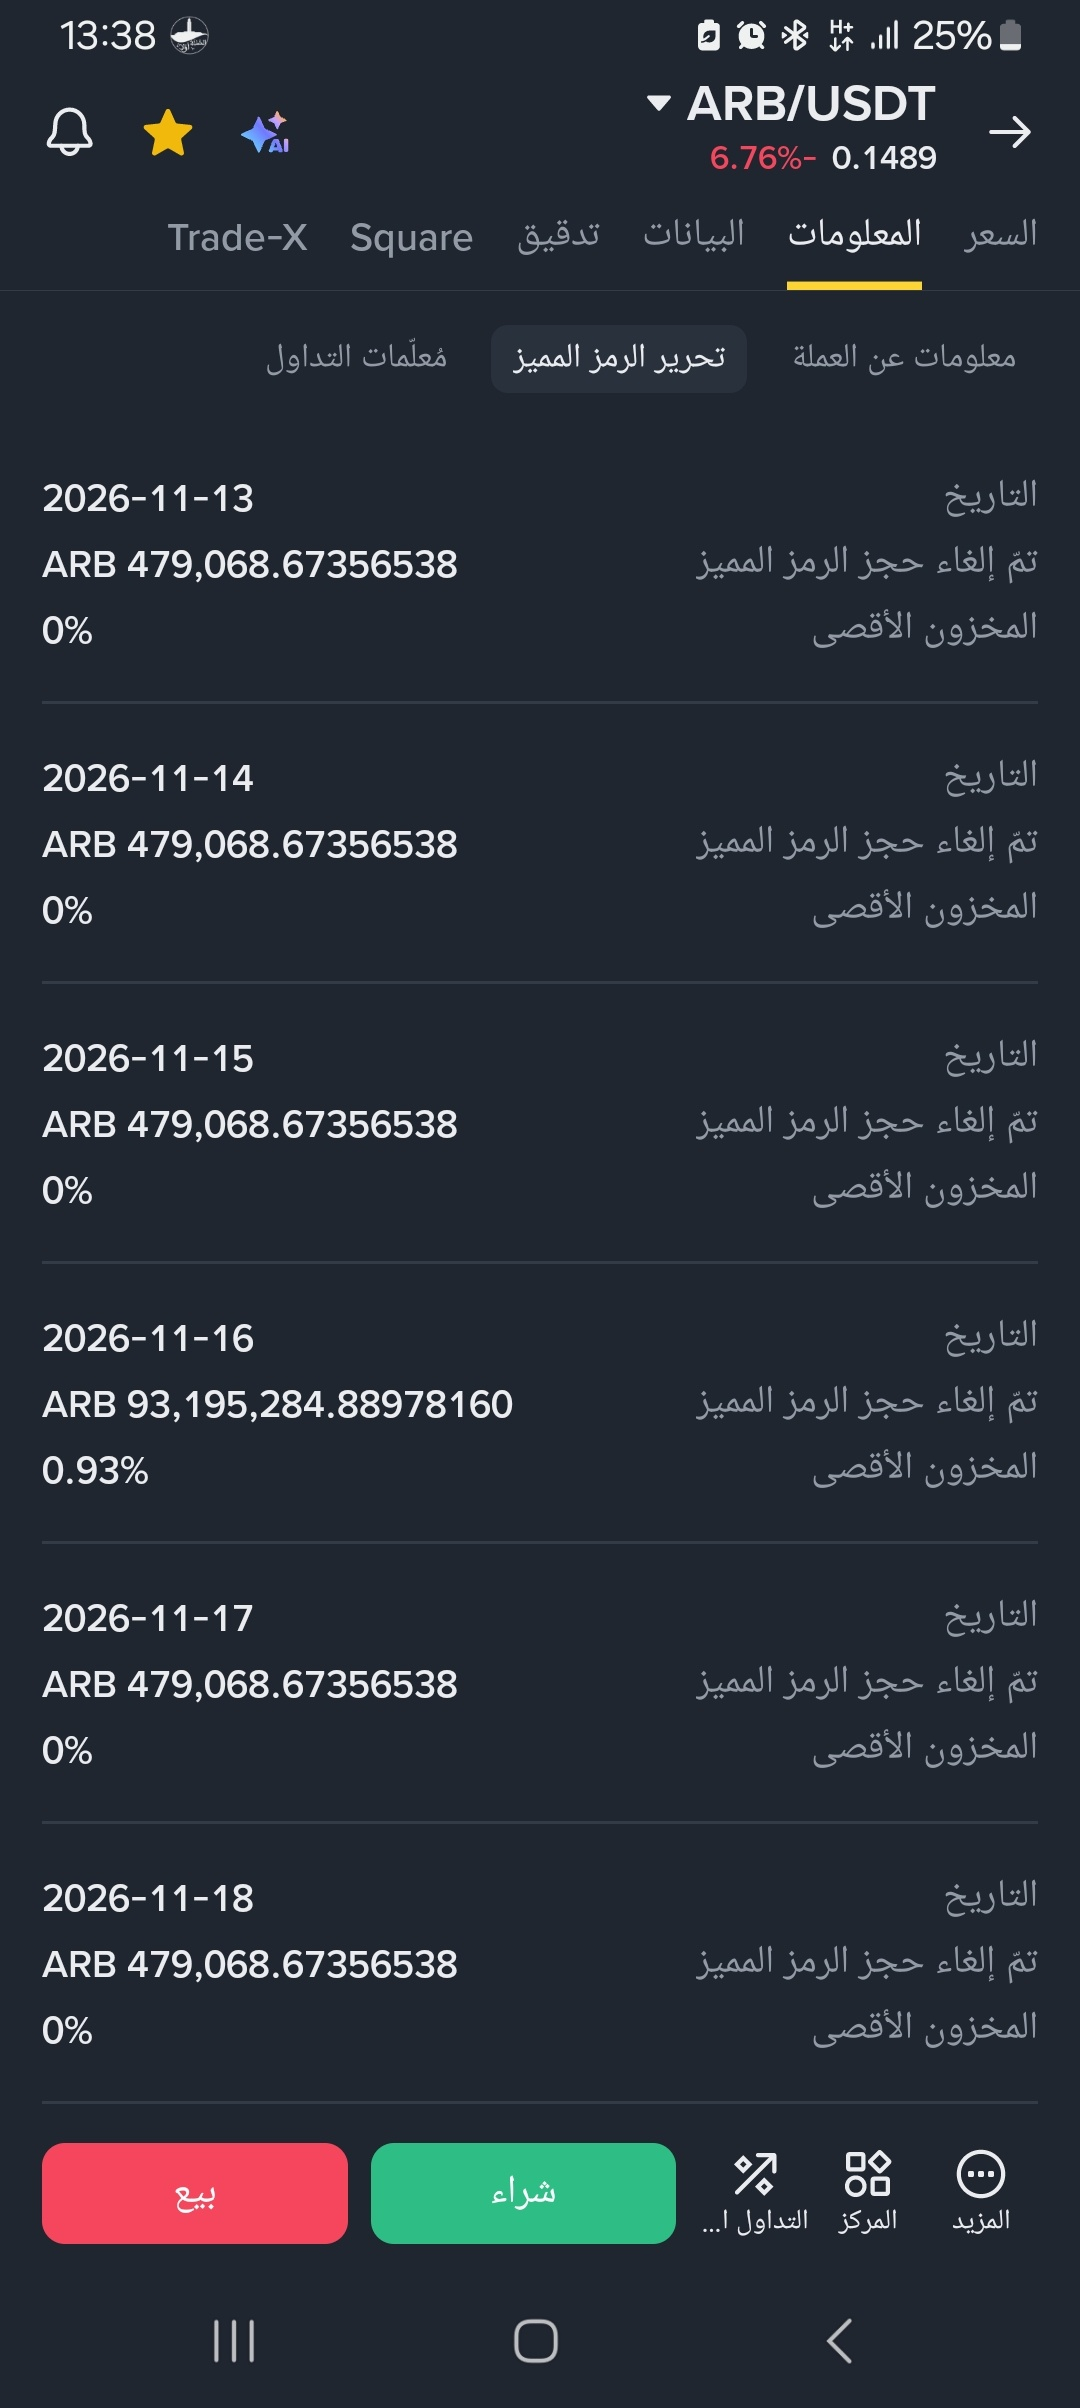
*🚨 ARB | تحرير يومي لمدة 158 يومًا!*
انتبه يا حامل عملة Arbitrum (ARB)
بدأ التحرير اليومي من *13 نوفمبر 2026* وسيستمر حتى *19 أبريل 2027*
*التفاصيل الدقيقة:*
*كل يوم:* 479,068 رمز ARB
*المدة:* 158 يومًا متتاليًا
*الإجمالي:* 75.69 مليون ARB
*القيمة:* ∼12.1 مليون دولار
هذا يعني أن هناك بيعًا ضاغطًا صغيرًا كل يوم، وليس صدمة واحدة في الشهر.
*ماذا يعني هذا للسعر؟*
السعر الحالي: *0.14$*
ضغط يومي بحوالي *76,000$* يوميًا
لن ينهار السعر في يوم واحد، لكنه سيبقى تحت الضغط حتى *19 أبريل 2027*، وهو تاريخ نهاية التحرير بالكامل.
$ARB
$BTC
{future}(BTCUSDT)
$ETH
{future}(ARBUSDT)
#AnthropicRejectsIPODelayValuationinQuestion #CanNvidiaEarningsEaseMarketConcerns? #HuangRisksOusterOverReportedAffairWithSubordinate #HKSFCSaysTokenizationMovingToCommercialUse
#Binance #ARB #Arbitrum #TokenUnlock #Crypto #Altcoins #Layer2 #Ethereum #BinanceSquare #تحرير_الرموز #العملات_الرقمية
*🚨 ARB | تحرير يومي لمدة 158 يومًا!*
انتبه يا حامل عملة Arbitrum (ARB)
بدأ التحرير اليومي من *13 نوفمبر 2026* وسيستمر حتى *19 أبريل 2027*
*التفاصيل الدقيقة:*
*كل يوم:* 479,068 رمز ARB
*المدة:* 158 يومًا متتاليًا
*الإجمالي:* 75.69 مليون ARB
*القيمة:* ∼12.1 مليون دولار
هذا يعني أن هناك بيعًا ضاغطًا صغيرًا كل يوم، وليس صدمة واحدة في الشهر.
*ماذا يعني هذا للسعر؟*
السعر الحالي: *0.14$*
ضغط يومي بحوالي *76,000$* يوميًا
لن ينهار السعر في يوم واحد، لكنه سيبقى تحت الضغط حتى *19 أبريل 2027*، وهو تاريخ نهاية التحرير بالكامل.
$ARB
$BTC
$ETH
#AnthropicRejectsIPODelayValuationinQuestion #CanNvidiaEarningsEaseMarketConcerns? #HuangRisksOusterOverReportedAffairWithSubordinate #HKSFCSaysTokenizationMovingToCommercialUse
#Binance #ARB #Arbitrum #TokenUnlock #Crypto #Altcoins #Layer2 #Ethereum #BinanceSquare #تحرير_الرموز #العملات_الرقمية
انتبه يا حامل عملة Arbitrum (ARB)
بدأ التحرير اليومي من *13 نوفمبر 2026* وسيستمر حتى *19 أبريل 2027*
*التفاصيل الدقيقة:*
*كل يوم:* 479,068 رمز ARB
*المدة:* 158 يومًا متتاليًا
*الإجمالي:* 75.69 مليون ARB
*القيمة:* ∼12.1 مليون دولار
هذا يعني أن هناك بيعًا ضاغطًا صغيرًا كل يوم، وليس صدمة واحدة في الشهر.
*ماذا يعني هذا للسعر؟*
السعر الحالي: *0.14$*
ضغط يومي بحوالي *76,000$* يوميًا
لن ينهار السعر في يوم واحد، لكنه سيبقى تحت الضغط حتى *19 أبريل 2027*، وهو تاريخ نهاية التحرير بالكامل.
$ARB
$BTC
$ETH
#AnthropicRejectsIPODelayValuationinQuestion #CanNvidiaEarningsEaseMarketConcerns? #HuangRisksOusterOverReportedAffairWithSubordinate #HKSFCSaysTokenizationMovingToCommercialUse
#Binance #ARB #Arbitrum #TokenUnlock #Crypto #Altcoins #Layer2 #Ethereum #BinanceSquare #تحرير_الرموز #العملات_الرقمية
1
132
Войдите, чтобы посмотреть больше материала
Присоединяйтесь к пользователям криптовалют по всему миру на Binance Square
⚡️ Получайте новейшую и полезную информацию о криптоактивах.
💬 Нам доверяет крупнейшая в мире криптобиржа.
👍 Получите достоверные аналитические данные от верифицированных создателей контента.
Эл. почта/номер телефона
В тренде
1
#HuangRisksOusterOverReportedAffairWithSubordinate
Просмотров: 60,361
842 обсуждают
2
#AnthropicRejectsIPODelayValuationinQuestion
Просмотров: 517,975
4,234 обсуждают
3
#CoreWeaveJumps10%On168%RevenueGrowth
Просмотров: 91,174
1,080 обсуждают
4
#ZcashFallsBelow$1000ForFirstTimeSinceSeptember
Просмотров: 49,430
216 обсуждают
5
#MSCIRemovalMayCurbStrategy’sBitcoinBuying
Просмотров: 11,419
194 обсуждают
6
#HKSFCSaysTokenizationMovingToCommercialUse
Просмотров: 592
22 обсуждают
7
#CanNvidiaEarningsEaseMarketConcerns?
Просмотров: 199,907
1,984 обсуждают
8
#SouthKoreaToLetExchangesSuspendWithdrawalsOnSuspectedHacks
Просмотров: 203
12 обсуждают
9
#PythAddsNYSERealTimeDataToMarketplace
Просмотров: 5,343
133 обсуждают
10
#SolanaCompanyReports$3.4MQ3Revenue
Просмотров: 1,465
30 обсуждают