

#btc
btc
Просмотров: 9.4G
61.2M обсуждают
Популярные
Новые


🟡 Bitcoin price wobbles ahead of Fed’s rate decision
Bitcoin (BTC) dipped as low as $59,500 on Binance ahead of tomorrow’s Federal Open Market Committee (FOMC) meeting. Market participants are bracing for a hawkish stance from the Federal Reserve (Fed), with expectations set for unchanged interest rates.
The CME FedWatch Tool indicates a mere 4.4% of economists predict a rate cut—the first in over a decade—while a dominant 95.6% anticipate rates to hold steady between 525-550 basis points.
According to The Kobeissi Letter, current market data indicates a 36% probability that there will be no interest rate cuts this year. Four months ago, the likelihood of maintaining current rates was only about 3%.
Expectations have also shifted to just one reduction this year. Previously, the market anticipated six rate cuts. Additionally, the probability of experiencing two or more rate cuts has diminished to 31%.
🔺 Stagflation risk
Amidst this financial climate, the US grapples with stagflation risks as inflation persists and economic growth slows.
The first quarter of 2024 saw GDP growth decelerate to 1.6%, falling short of the 2.2% forecast and down from the previous quarter’s 3.4%. Concurrently, the US Core PCE inflation index climbed from 2.0% to 3.7%.
Fed Chair Jerome Powell stated that recent data does not make the Fed more confident, suggesting a longer timeline to regain economic stability. He expressed belief in the adequacy of current policies to navigate the risks at hand, hinting at sustained high-interest rates without increases.
Bitcoin’s trajectory mirrored these economic uncertainties, dropping below $62,000 earlier in the week due to renewed stagflation worries.
A brief rally above $64,000 occurred with the launch of spot Bitcoin and Ethereum ETFs in Hong Kong yesterday, but the momentum was short-lived as investor caution set in ahead of the Fed’s key decision.
$BTC #BTC #Bitcoin

AliRazaCrypto55:
Great analysis bro! Super helpful. Following you 🚀 Check my latest $BTC post too if you get time.
137
57
394
294.5k

·
--
Частичная правда
🚨 FOMC ALERT: BTC FACES A CRITICAL TEST!
The Fed is expected to HOLD rates at 3.75%–4.00%, but don’t mistake a pause for a pivot.
Inflation remains hot at 3.7%. A hawkish message could boost the dollar and Treasury yields, putting $BTC , $ETH and risk assets under pressure.
December hike fears remain alive.
HOLD ≠ DOVISH. VOLATILITY AHEAD!
Will BTC pump or dump? #FOMC #BTC

1.9k

·
--
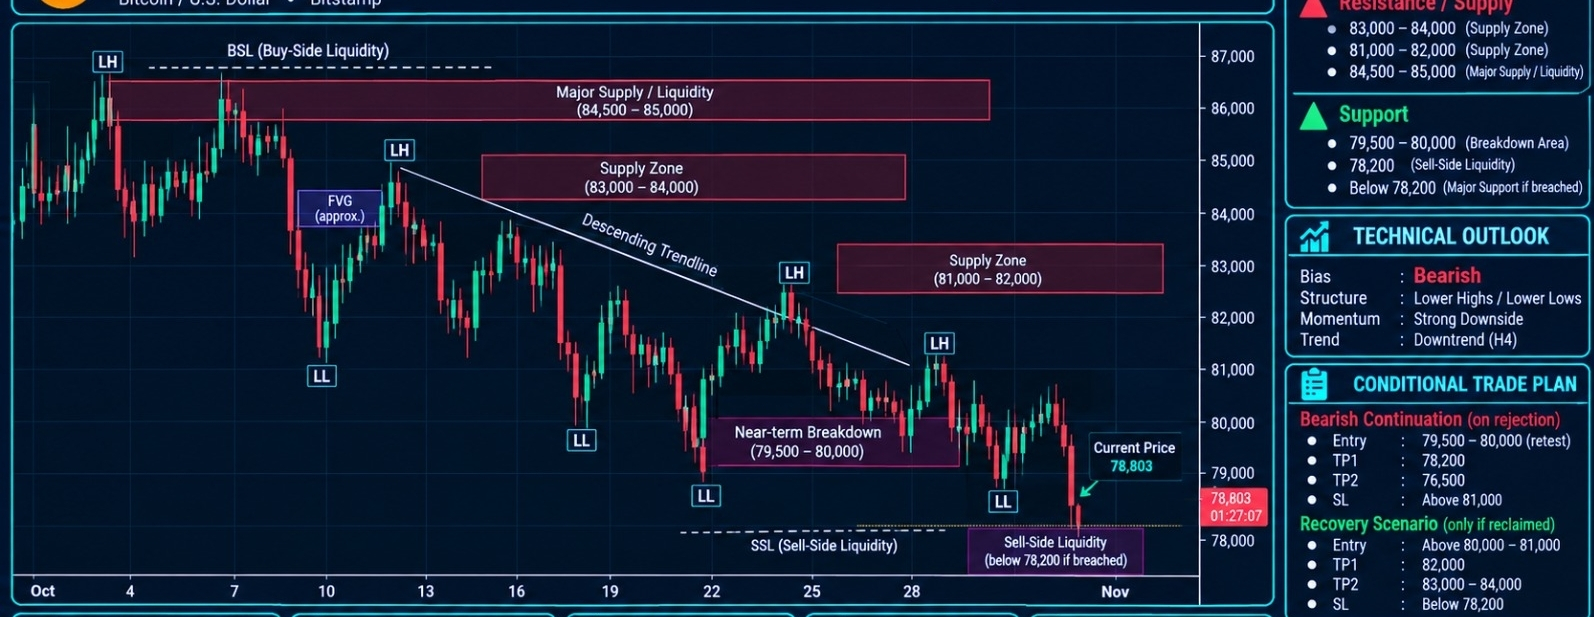
Статья
BITCOIN / U.S. DOLLAR (BTCUSD)H4 Bias: Strongly Bearish
Structure State: $BTC maintains a pronounced bearish H4 structure characterized by successive lower highs, lower lows, and confirmed bearish BOS. Price has declined below the 79,500–80,000 breakdown region, with downside momentum remaining dominant.
Market Structure
BTCUSD continues to exhibit a strong bearish market structure following the breakdown from the higher supply regions. The sequence of lower highs and lower lows confirms that sellers remain in control of the H4 trend.
The current price of 78,803 places Bitcoin below the 79,500–80,000 breakdown region. This area represents an important near-term recovery threshold and potential resistance if price attempts to retrace.
Overhead supply remains distributed across 81,000–82,000, 83,000–84,000, and the major 84,500–85,000 liquidity region. These areas represent successive resistance zones that price would need to reclaim to establish a meaningful structural recovery.
On the downside, 78,200 represents the identified sell-side liquidity reference. A sustained breakdown beneath this level would expose further downside, while any bullish recovery requires a reclaim of 80,000–81,000 followed by stronger acceptance above 82,000.
Key Resistance
Resistance 1: 79,500–80,000 — immediate breakdown area and near-term recovery threshold.
Resistance 2: 81,000–82,000 — overhead supply region and important structural resistance.
Major Supply: 83,000–84,000 — additional bearish supply region.
Major Supply / Liquidity: 84,500–85,000 — significant overhead supply and buy-side liquidity region.
Higher Buy-Side Liquidity: Around 87,000.
Key Support
Immediate Support: 78,200 — identified sell-side liquidity reference.
Lower Support: Below 78,200 — major support region already breached according to the chart.
Downside Reference: 76,500 — lower price objective indicated by the chart.
FVG — Fair Value Gap
The chart identifies a potential bearish imbalance associated with the preceding downward displacement. These imbalance regions may act as resistance during corrective retracements.
The 79,500–80,000 breakdown area is the immediate region to monitor for a possible retest. A rejection followed by renewed bearish displacement would support continuation of the prevailing trend.
Order Block (OB)
The 81,000–82,000 region represents an important bearish supply and order-block candidate within the current descending structure.
The 83,000–84,000 zone provides additional overhead supply, while 84,500–85,000 represents the major supply and liquidity region.
The 79,500–80,000 breakdown area is the immediate structural region that needs to be reclaimed before a stronger bullish recovery can develop.
Liquidity Map
Buy-Side Liquidity (BSL): 84,500–85,000, with a higher liquidity reference around 87,000.
Sell-Side Liquidity (SSL): Below 78,200.
Near-Term Breakdown Liquidity: 79,500–80,000.
Major Overhead Liquidity: Above the 84,500–85,000 swing-high region.
Trade Scenarios
Bearish continuation: A corrective retracement toward 79,500–80,000 followed by rejection would support continuation of the existing bearish structure. A sustained break below 78,200 would confirm further downside pressure.
Bullish recovery: A reclaim of 80,000–81,000 would provide the first indication of improving momentum. A confirmed break and hold above 82,000 would strengthen the recovery scenario, with 83,000–84,000 becoming the next major resistance region.
Trendline
The descending trendline remains consistent with the sequence of lower highs. The current price position below the 79,500–80,000 breakdown region confirms that the broader bearish structure has not yet been reversed.
Invalidation
A daily close above 81,000 would weaken the immediate bearish continuation interpretation.
A sustained break and hold above 82,000 would provide stronger evidence of structural recovery and challenge the existing bearish trend.
Professional Summary
Primary Bias: Strongly bearish.
Current Price: 78,803.
Immediate Resistance: 79,500–80,000.
Major Resistance: 81,000–82,000.
Higher Supply: 83,000–84,000.
Major Supply: 84,500–85,000.
Immediate SSL: 78,200.
Bullish Trigger: Reclaim 80,000–81,000, followed by acceptance above 82,000.
Bearish Trigger: Rejection from 79,500–80,000 and confirmed breakdown below 78,200.
Risk Consideration: #BTC is trading below its identified breakdown region with strong downside momentum. Countertrend buying requires clear bullish displacement and structural confirmation rather than relying solely on the possibility of a liquidity sweep.
BITCOIN / U.S. DOLLAR (BTCUSD)
H4 Bias: Strongly Bearish
Structure State: $BTC maintains a pronounced bearish H4 structure characterized by successive lower highs, lower lows, and confirmed bearish BOS. Price has declined below the 79,500–80,000 breakdown region, with downside momentum remaining dominant.
Market Structure
BTCUSD continues to exhibit a strong bearish market structure following the breakdown from the higher supply regions. The sequence of lower highs and lower lows confirms that sellers remain in control of the H4 trend.
The current price of 78,803 places Bitcoin below the 79,500–80,000 breakdown region. This area represents an important near-term recovery threshold and potential resistance if price attempts to retrace.
Overhead supply remains distributed across 81,000–82,000, 83,000–84,000, and the major 84,500–85,000 liquidity region. These areas represent successive resistance zones that price would need to reclaim to establish a meaningful structural recovery.
On the downside, 78,200 represents the identified sell-side liquidity reference. A sustained breakdown beneath this level would expose further downside, while any bullish recovery requires a reclaim of 80,000–81,000 followed by stronger acceptance above 82,000.
Key Resistance
Resistance 1: 79,500–80,000 — immediate breakdown area and near-term recovery threshold.
Resistance 2: 81,000–82,000 — overhead supply region and important structural resistance.
Major Supply: 83,000–84,000 — additional bearish supply region.
Major Supply / Liquidity: 84,500–85,000 — significant overhead supply and buy-side liquidity region.
Higher Buy-Side Liquidity: Around 87,000.
Key Support
Immediate Support: 78,200 — identified sell-side liquidity reference.
Lower Support: Below 78,200 — major support region already breached according to the chart.
Downside Reference: 76,500 — lower price objective indicated by the chart.
FVG — Fair Value Gap
The chart identifies a potential bearish imbalance associated with the preceding downward displacement. These imbalance regions may act as resistance during corrective retracements.
The 79,500–80,000 breakdown area is the immediate region to monitor for a possible retest. A rejection followed by renewed bearish displacement would support continuation of the prevailing trend.
Order Block (OB)
The 81,000–82,000 region represents an important bearish supply and order-block candidate within the current descending structure.
The 83,000–84,000 zone provides additional overhead supply, while 84,500–85,000 represents the major supply and liquidity region.
The 79,500–80,000 breakdown area is the immediate structural region that needs to be reclaimed before a stronger bullish recovery can develop.
Liquidity Map
Buy-Side Liquidity (BSL): 84,500–85,000, with a higher liquidity reference around 87,000.
Sell-Side Liquidity (SSL): Below 78,200.
Near-Term Breakdown Liquidity: 79,500–80,000.
Major Overhead Liquidity: Above the 84,500–85,000 swing-high region.
Trade Scenarios
Bearish continuation: A corrective retracement toward 79,500–80,000 followed by rejection would support continuation of the existing bearish structure. A sustained break below 78,200 would confirm further downside pressure.
Bullish recovery: A reclaim of 80,000–81,000 would provide the first indication of improving momentum. A confirmed break and hold above 82,000 would strengthen the recovery scenario, with 83,000–84,000 becoming the next major resistance region.
Trendline
The descending trendline remains consistent with the sequence of lower highs. The current price position below the 79,500–80,000 breakdown region confirms that the broader bearish structure has not yet been reversed.
Invalidation
A daily close above 81,000 would weaken the immediate bearish continuation interpretation.
A sustained break and hold above 82,000 would provide stronger evidence of structural recovery and challenge the existing bearish trend.
Professional Summary
Primary Bias: Strongly bearish.
Current Price: 78,803.
Immediate Resistance: 79,500–80,000.
Major Resistance: 81,000–82,000.
Higher Supply: 83,000–84,000.
Major Supply: 84,500–85,000.
Immediate SSL: 78,200.
Bullish Trigger: Reclaim 80,000–81,000, followed by acceptance above 82,000.
Bearish Trigger: Rejection from 79,500–80,000 and confirmed breakdown below 78,200.
Risk Consideration: #BTC is trading below its identified breakdown region with strong downside momentum. Countertrend buying requires clear bullish displacement and structural confirmation rather than relying solely on the possibility of a liquidity sweep.
189

·
--
Рост
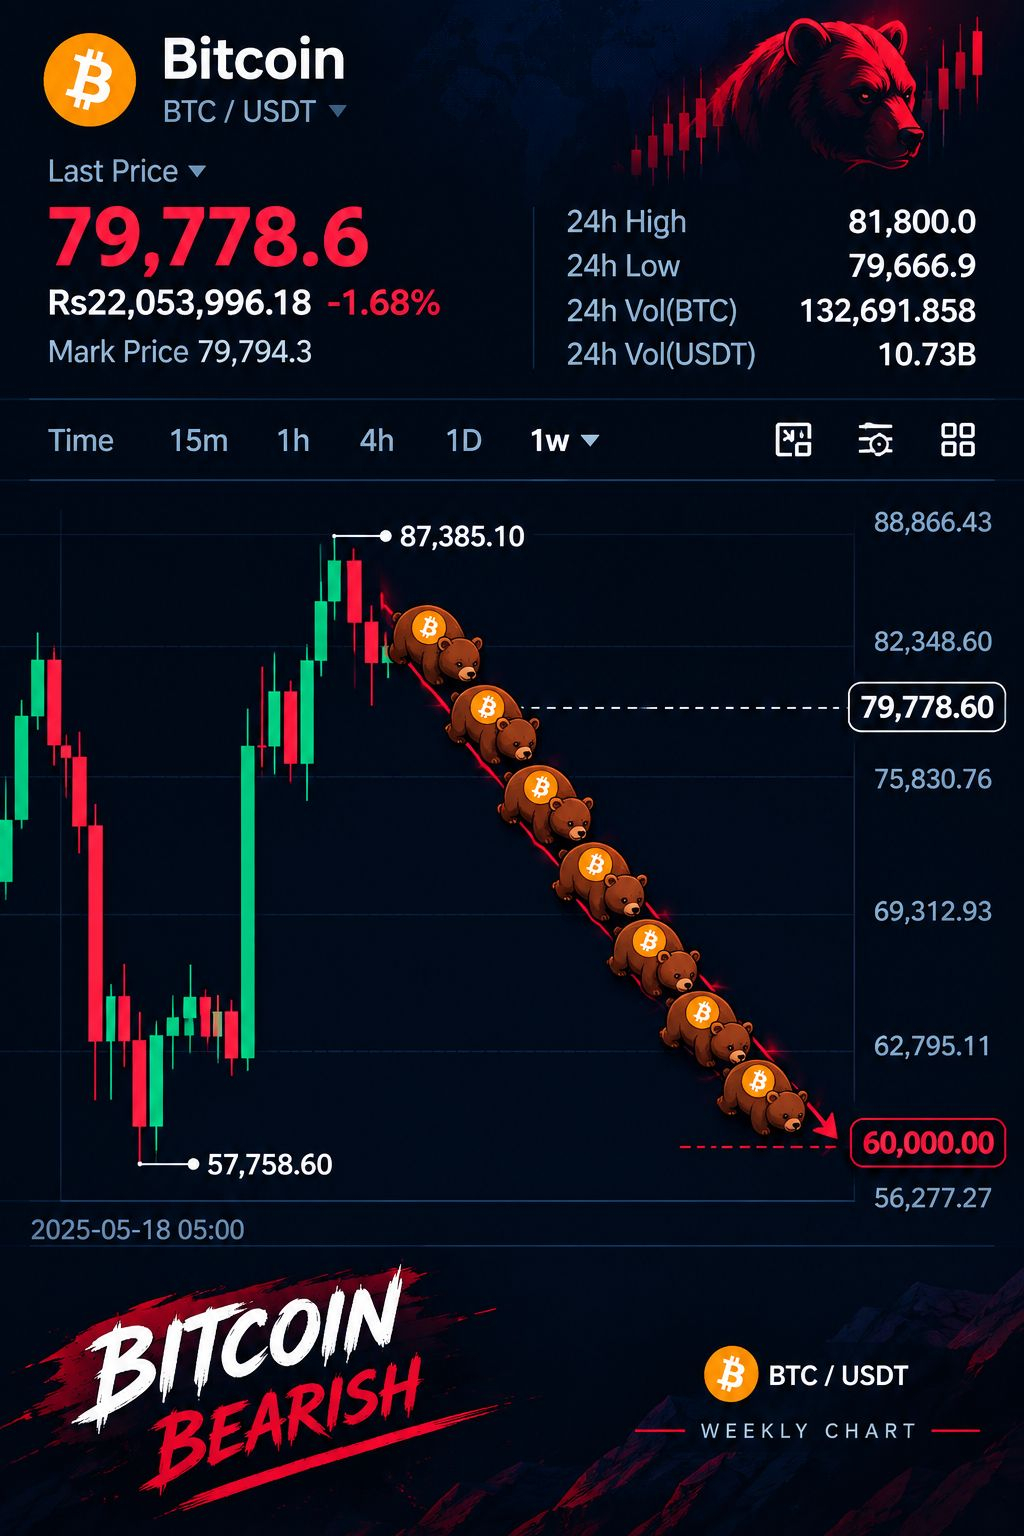
🚨 #BITCOIN IN FULL BEARISH MODE! 🐻📉
Could Bitcoin drop straight from $87,000 to $60,000 with no brakes? 😱
⚠️ This is a possible market scenario, not a guaranteed prediction.
#bitcoin #BTC #CryptoMarket #BearMarket #AXABIR
$BTC $SUI $ADA
🚨 #BITCOIN IN FULL BEARISH MODE! 🐻📉
Could Bitcoin drop straight from $87,000 to $60,000 with no brakes? 😱
⚠️ This is a possible market scenario, not a guaranteed prediction.
#bitcoin #BTC #CryptoMarket #BearMarket #AXABIR
$BTC $SUI $ADA
Could Bitcoin drop straight from $87,000 to $60,000 with no brakes? 😱
⚠️ This is a possible market scenario, not a guaranteed prediction.
#bitcoin #BTC #CryptoMarket #BearMarket #AXABIR
$BTC $SUI $ADA
443
·
--
🚨 $BTC FOMC: RELIEF RALLY OR SHARP SELL-OFF?
Inflation is heating up, and the Fed’s next move could shake the entire crypto market.
🔴 Hawkish: BTC under pressure
🟢 Dovish: Potential relief rally
⚫ Unclear outlook: Volatility ahead
All eyes on rates, inflation, and the Fed’s next signal.
Will Bitcoin pump or dump? 👀
{spot}(BTCUSDT)
#BTC #FOMC #Crypto #Bitcoin
🚨 $BTC FOMC: RELIEF RALLY OR SHARP SELL-OFF?
Inflation is heating up, and the Fed’s next move could shake the entire crypto market.
🔴 Hawkish: BTC under pressure
🟢 Dovish: Potential relief rally
⚫ Unclear outlook: Volatility ahead
All eyes on rates, inflation, and the Fed’s next signal.
Will Bitcoin pump or dump? 👀
#BTC #FOMC #Crypto #Bitcoin
Inflation is heating up, and the Fed’s next move could shake the entire crypto market.
🔴 Hawkish: BTC under pressure
🟢 Dovish: Potential relief rally
⚫ Unclear outlook: Volatility ahead
All eyes on rates, inflation, and the Fed’s next signal.
Will Bitcoin pump or dump? 👀
#BTC #FOMC #Crypto #Bitcoin

508

·
--
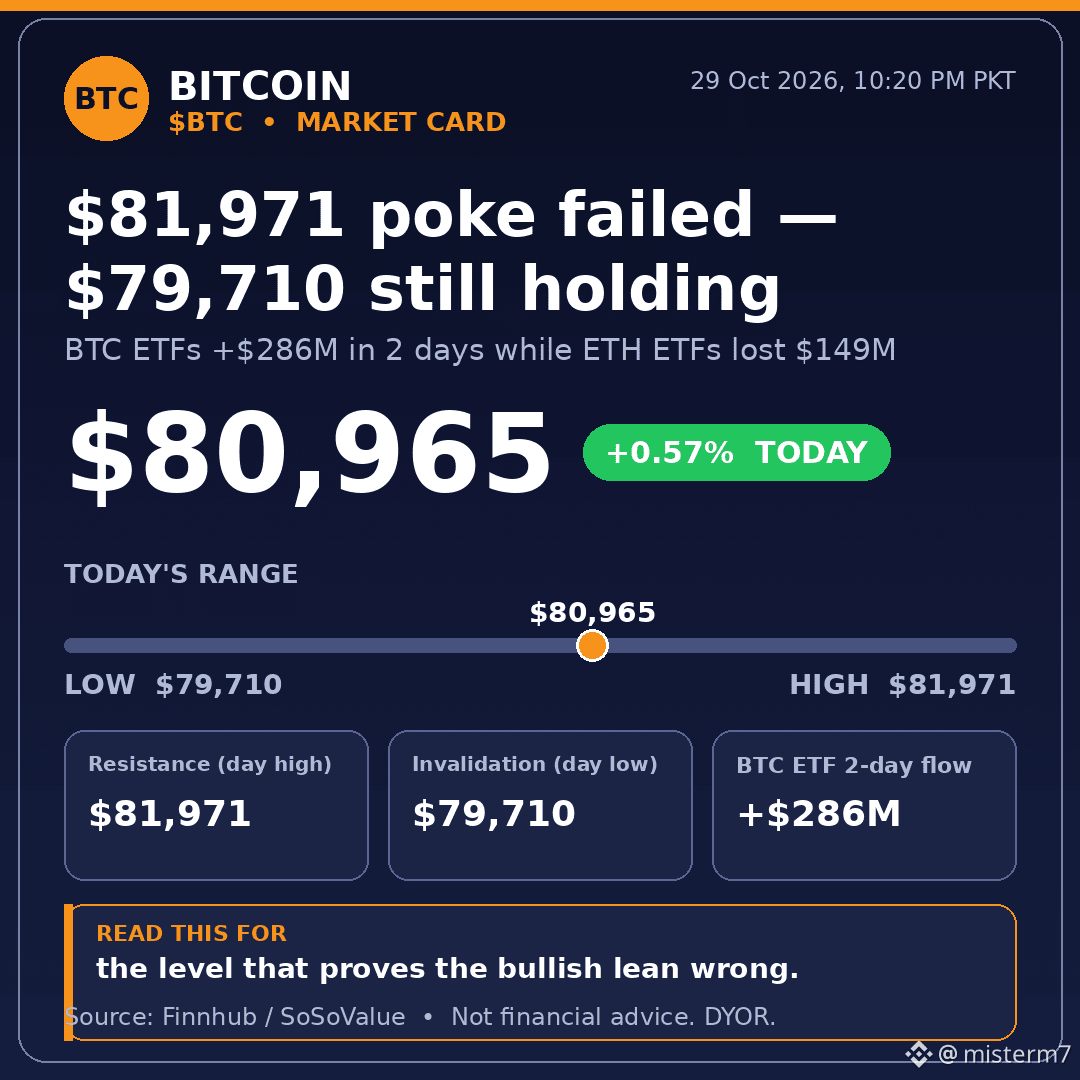
$BTC touched $81,971 — above my $81,789 resistance — and still couldn't hold it.
That's the honest follow-up. My last post said the reclaim near $81,730 needed to stick. It didn't. We're back around $80,965, up 0.57% on the day, and the $79,710 low is still intact. So the invalidation level held, but the breakout didn't. A range, not a trend — yet.
I'm leaning bullish, not strong. US spot $BTC ETFs took in $176M on Tuesday, $286M over two days, cutting October's net outflows to about $26M. Over the same two days, $ETH ETFs lost about $149M. That's institutions rotating into Bitcoin, not blind risk-on buying — and that's a conclusion, not just a flow number.
If $81,971 breaks and holds, the range breaks with it. If $79,710 gives way on a daily close, my lean is wrong.
Drop your number: does $BTC close the week above $81,971, or back under $79,710?
Data: Finnhub, 10:20 PM PKT; flows via SoSoValue.
#Bitcoin #BTC #Crypto
Not financial advice. DYOR.
115

·
--
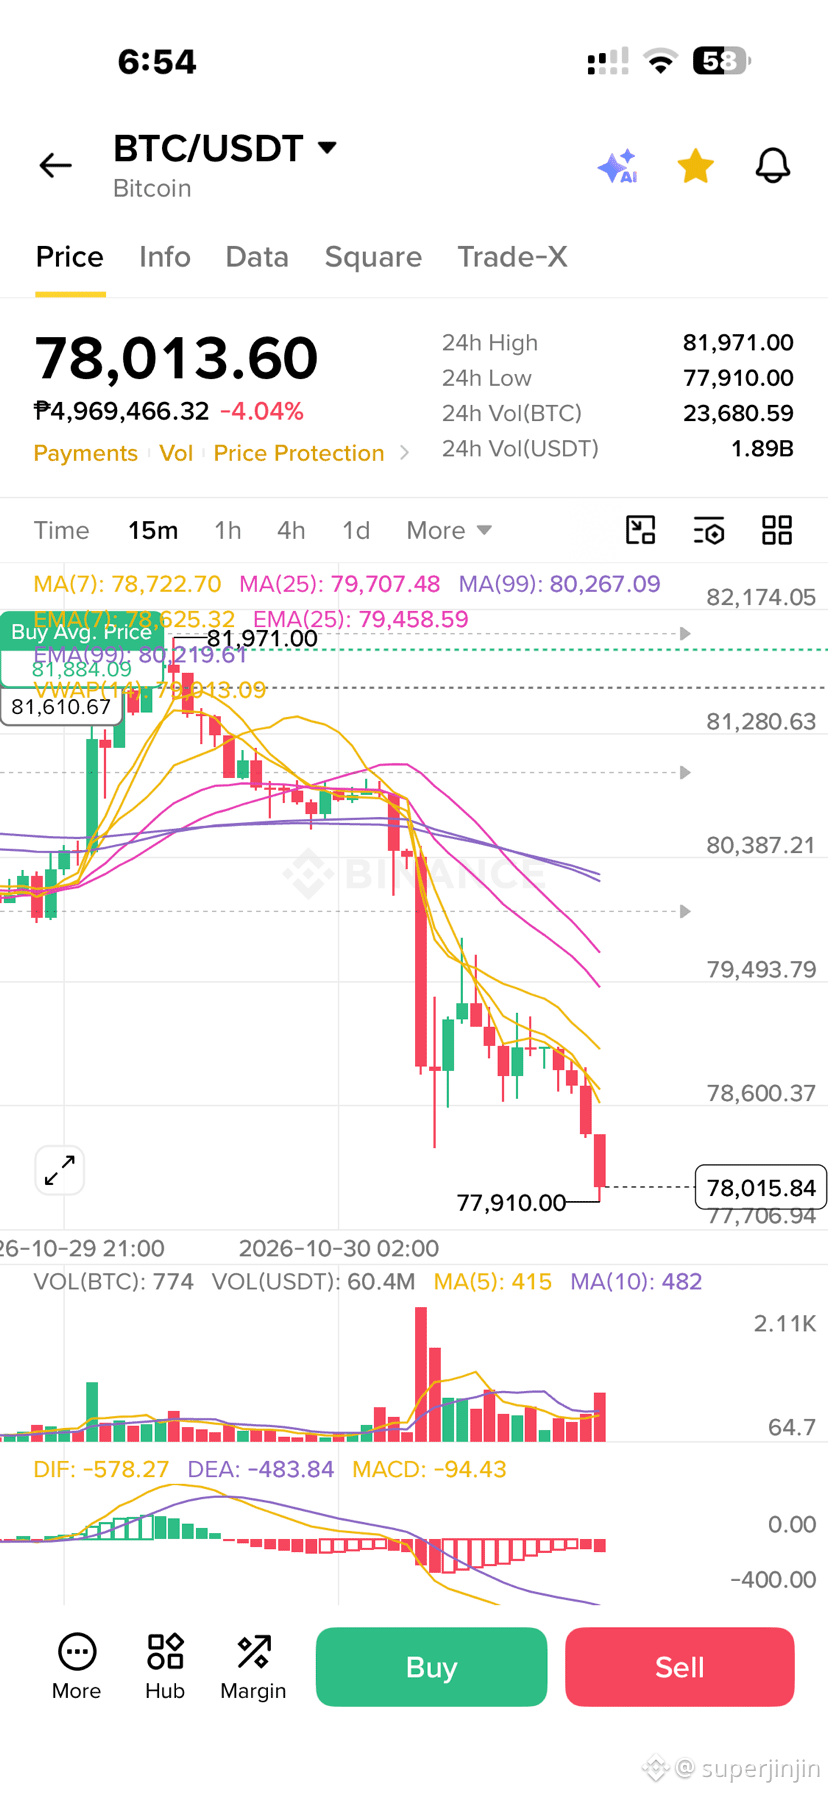
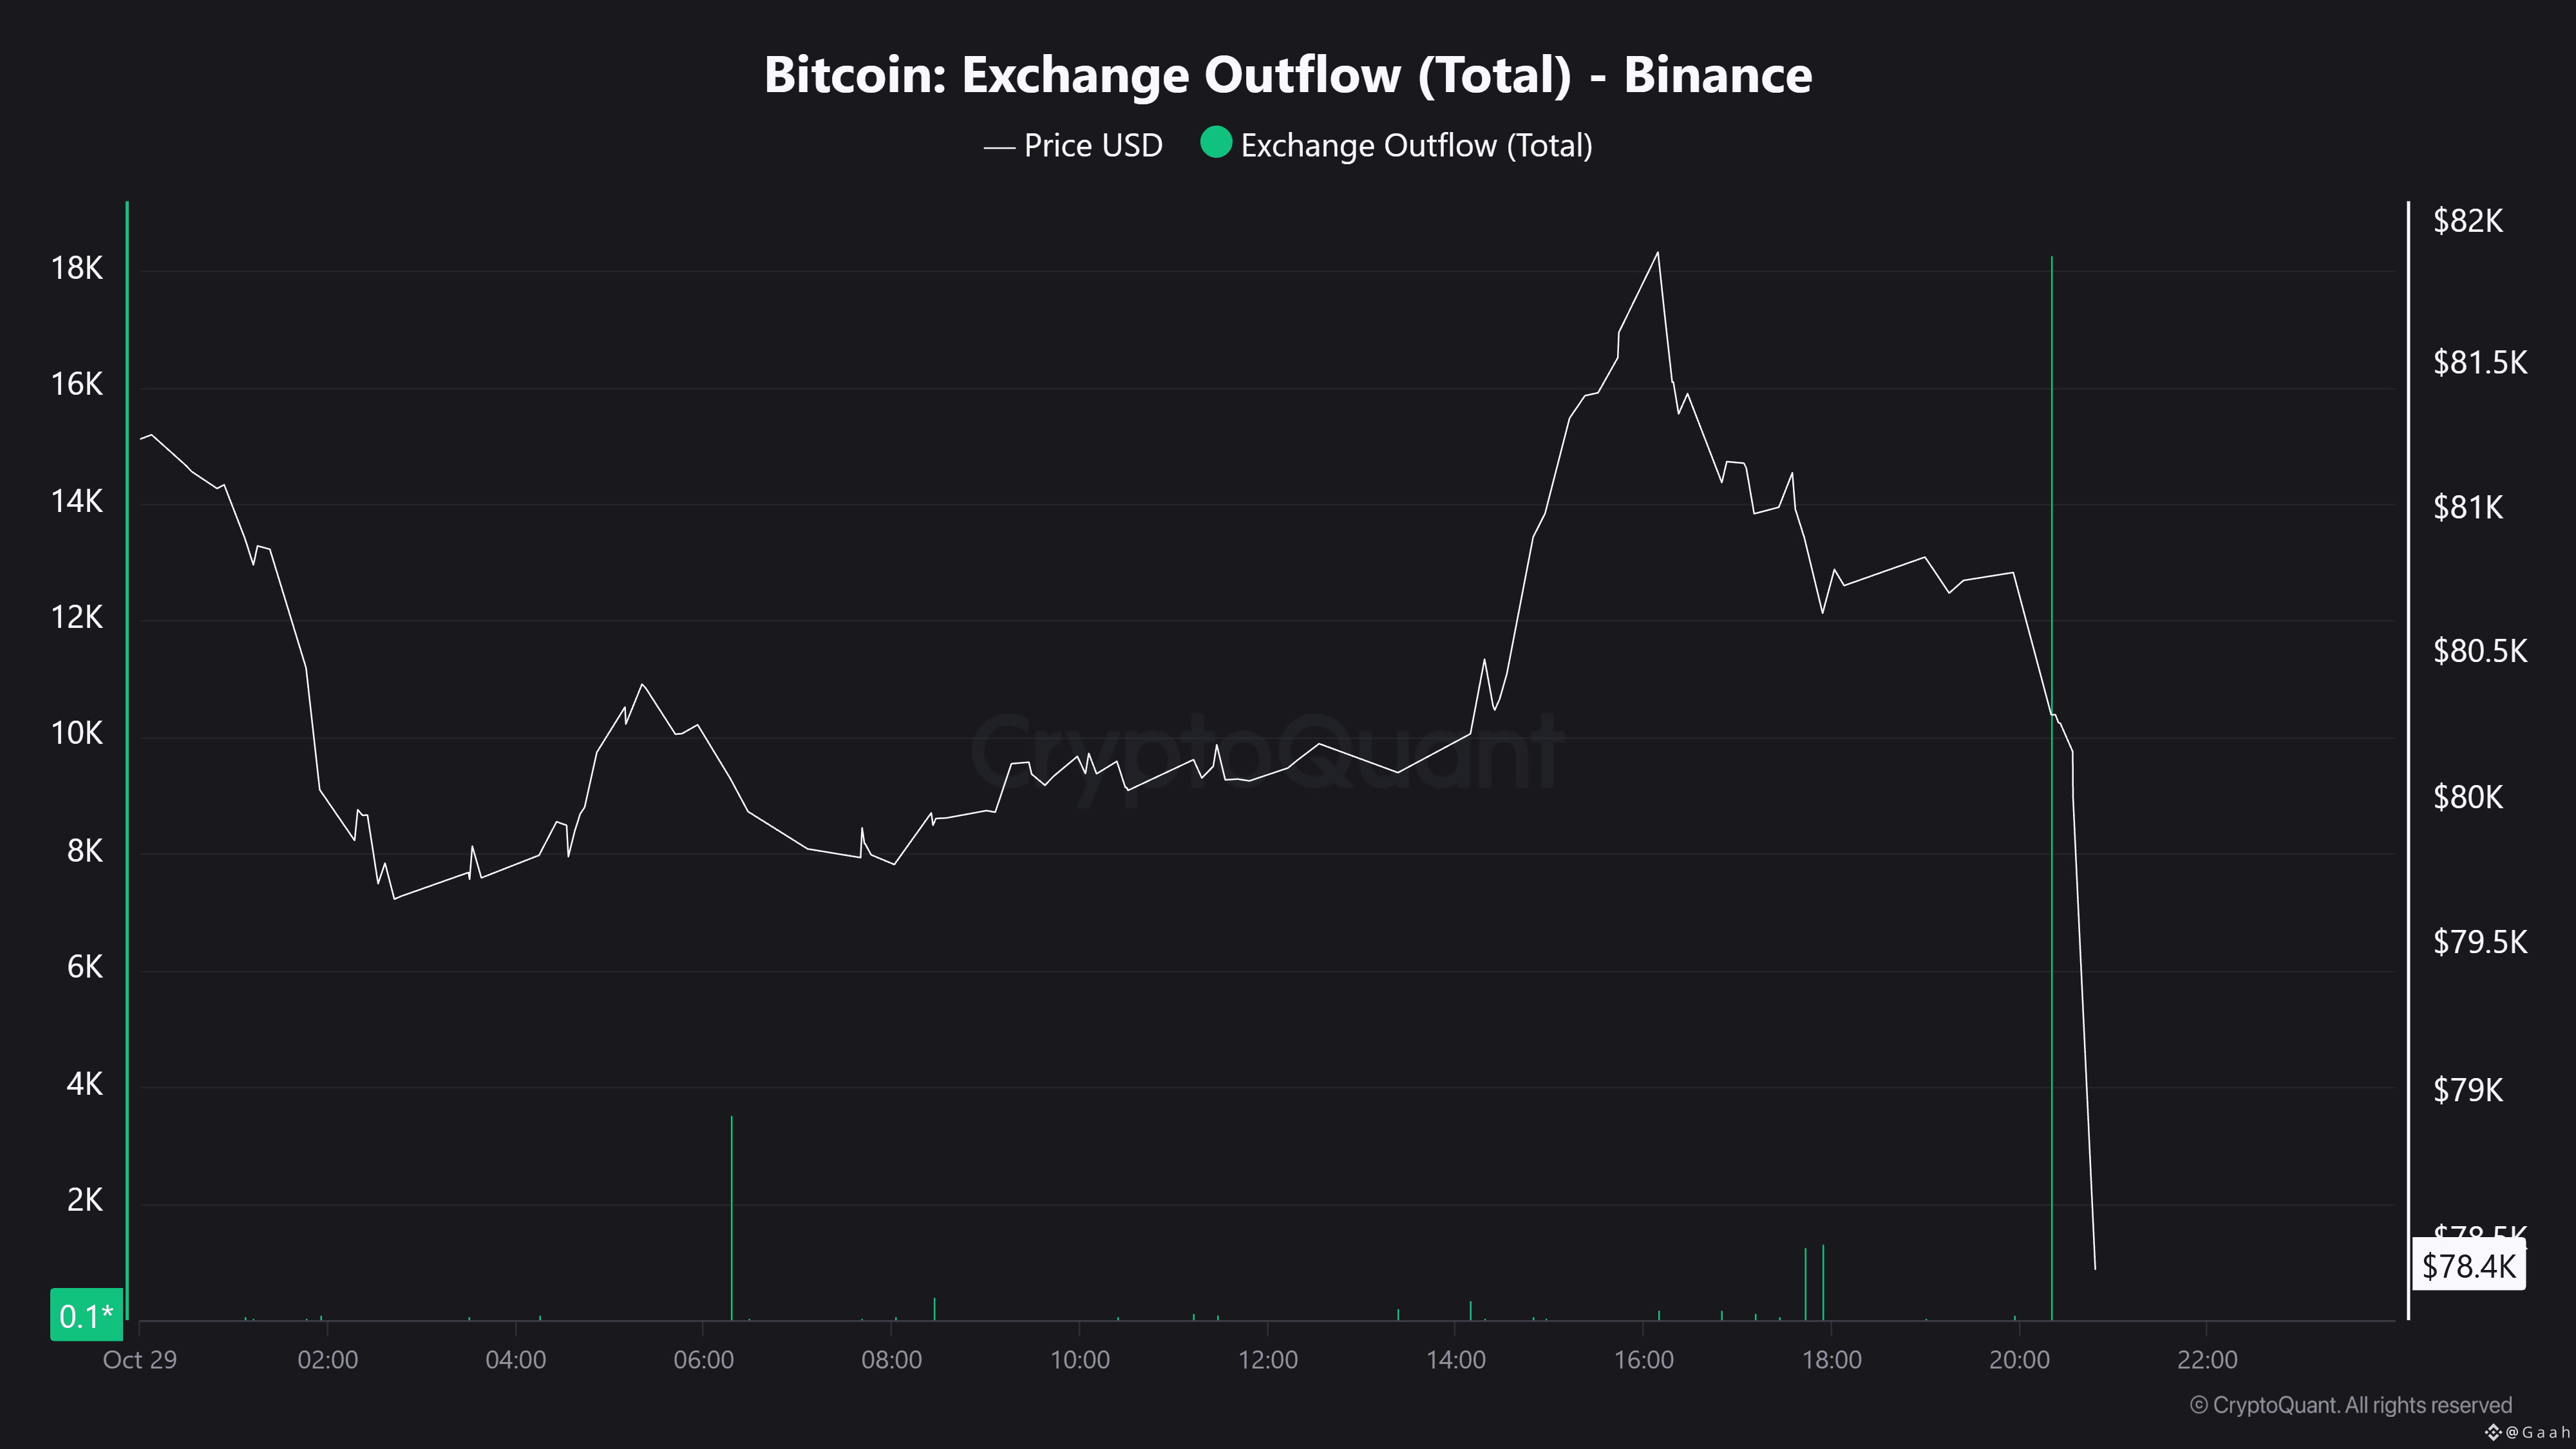
📉 $BTC just dropped to $78K! 😳🔴
Bitcoin is bleeding, selling pressure is strong, and the bears are clearly in control. 🐻
Will $77K hold as support, or are we heading toward $75K? 👀
Panic selling or another buying opportunity? 💰🚀
#Bitcoin #BTC #CryptoMarket #BuyTheDip #CryptoTrading
📉 $BTC just dropped to $78K! 😳🔴
Bitcoin is bleeding, selling pressure is strong, and the bears are clearly in control. 🐻
Will $77K hold as support, or are we heading toward $75K? 👀
Panic selling or another buying opportunity? 💰🚀
#Bitcoin #BTC #CryptoMarket #BuyTheDip #CryptoTrading
Bitcoin is bleeding, selling pressure is strong, and the bears are clearly in control. 🐻
Will $77K hold as support, or are we heading toward $75K? 👀
Panic selling or another buying opportunity? 💰🚀
#Bitcoin #BTC #CryptoMarket #BuyTheDip #CryptoTrading
135


·
--
Статья
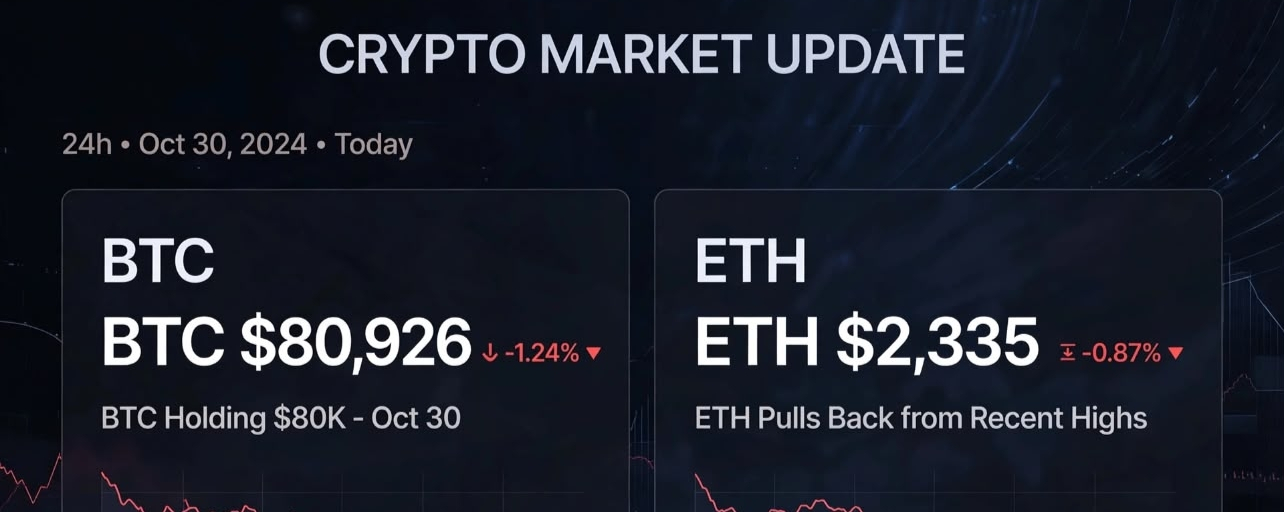
Market Update Today: BTC holding $80K
BTC $80.9K (-0.4%) & ETH $2.33K (-1.1%) today. Fed held rates but 2 members wanted hike = cautious market.
BTC ETFs got $137M inflow for 3rd day, but ETH still has outflows.
No panic - market is in tight range $79K-$81.7K. Good time to learn, not to FOMO with $0 balance like me.
What do you think next? $78K or $82K?
#BTC #ETH #MarketUpdate
{future}(BTCUSDT)
{spot}(ETHUSDT)
Market Update Today:
BTC holding $80K
BTC $80.9K (-0.4%) & ETH $2.33K (-1.1%) today. Fed held rates but 2 members wanted hike = cautious market.
BTC ETFs got $137M inflow for 3rd day, but ETH still has outflows.
No panic - market is in tight range $79K-$81.7K. Good time to learn, not to FOMO with $0 balance like me.
What do you think next? $78K or $82K?
#BTC #ETH #MarketUpdate
1
243

·
--
Падение
$BTC
🚨 BTC Quick Update🚨
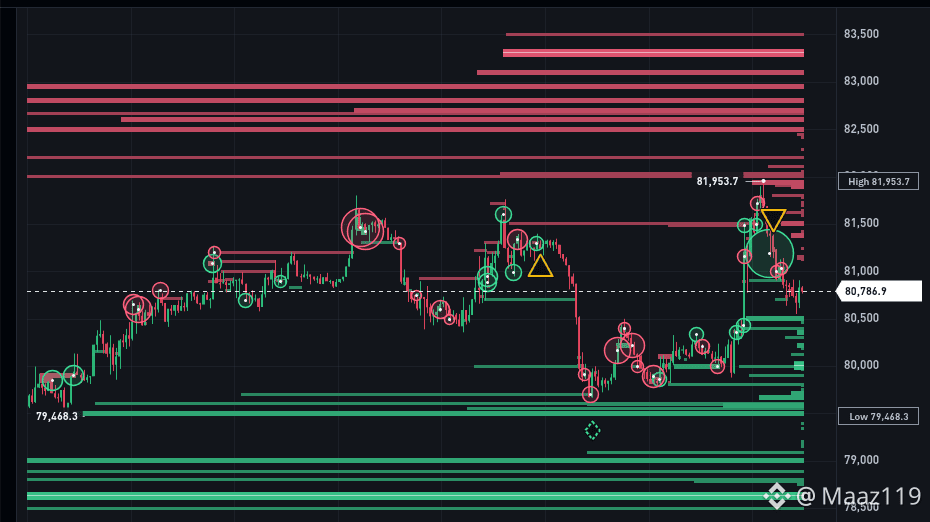
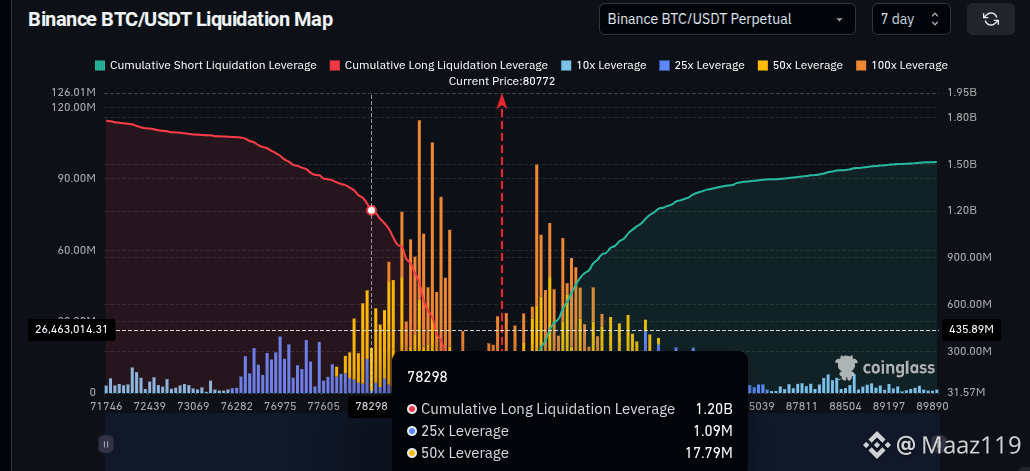
Bitcoin just hit a high of $81,953 and is now dropping. Do not buy right here because the big players want to push the price lower first to clean out early buyers.
BTC plan to open Long position between $78,000 and $78,500 is perfect. The charts show a massive pending orders and strong support waiting in that exact area for a big bounce.Wait for the price drop into this $78k-$78.5k zone before you enter your trade, and always use a Stop Loss to stay safe!
#Binance #BTC #TrendingTopic
{future}(BTCUSDT)
$BTC
🚨 BTC Quick Update🚨
Bitcoin just hit a high of $81,953 and is now dropping. Do not buy right here because the big players want to push the price lower first to clean out early buyers.
BTC plan to open Long position between $78,000 and $78,500 is perfect. The charts show a massive pending orders and strong support waiting in that exact area for a big bounce.Wait for the price drop into this $78k-$78.5k zone before you enter your trade, and always use a Stop Loss to stay safe!
#Binance #BTC #TrendingTopic
1
145

·
--
Bitcoin climbs to $81,800 after Q3 GDP surprise. The rally follows a 2.6% YoY GDP jump, but bears warn of a slide toward $76k as Fed holds rates.
#BTC
Bitcoin climbs to $81,800 after Q3 GDP surprise. The rally follows a 2.6% YoY GDP jump, but bears warn of a slide toward $76k as Fed holds rates.
#BTC
#BTC
4
358

·
--
Today's Bitcoin Options Analysis
⚠️ Today marks a major options expiration! ⚠️
BTC has declined following the reported Binance hack.
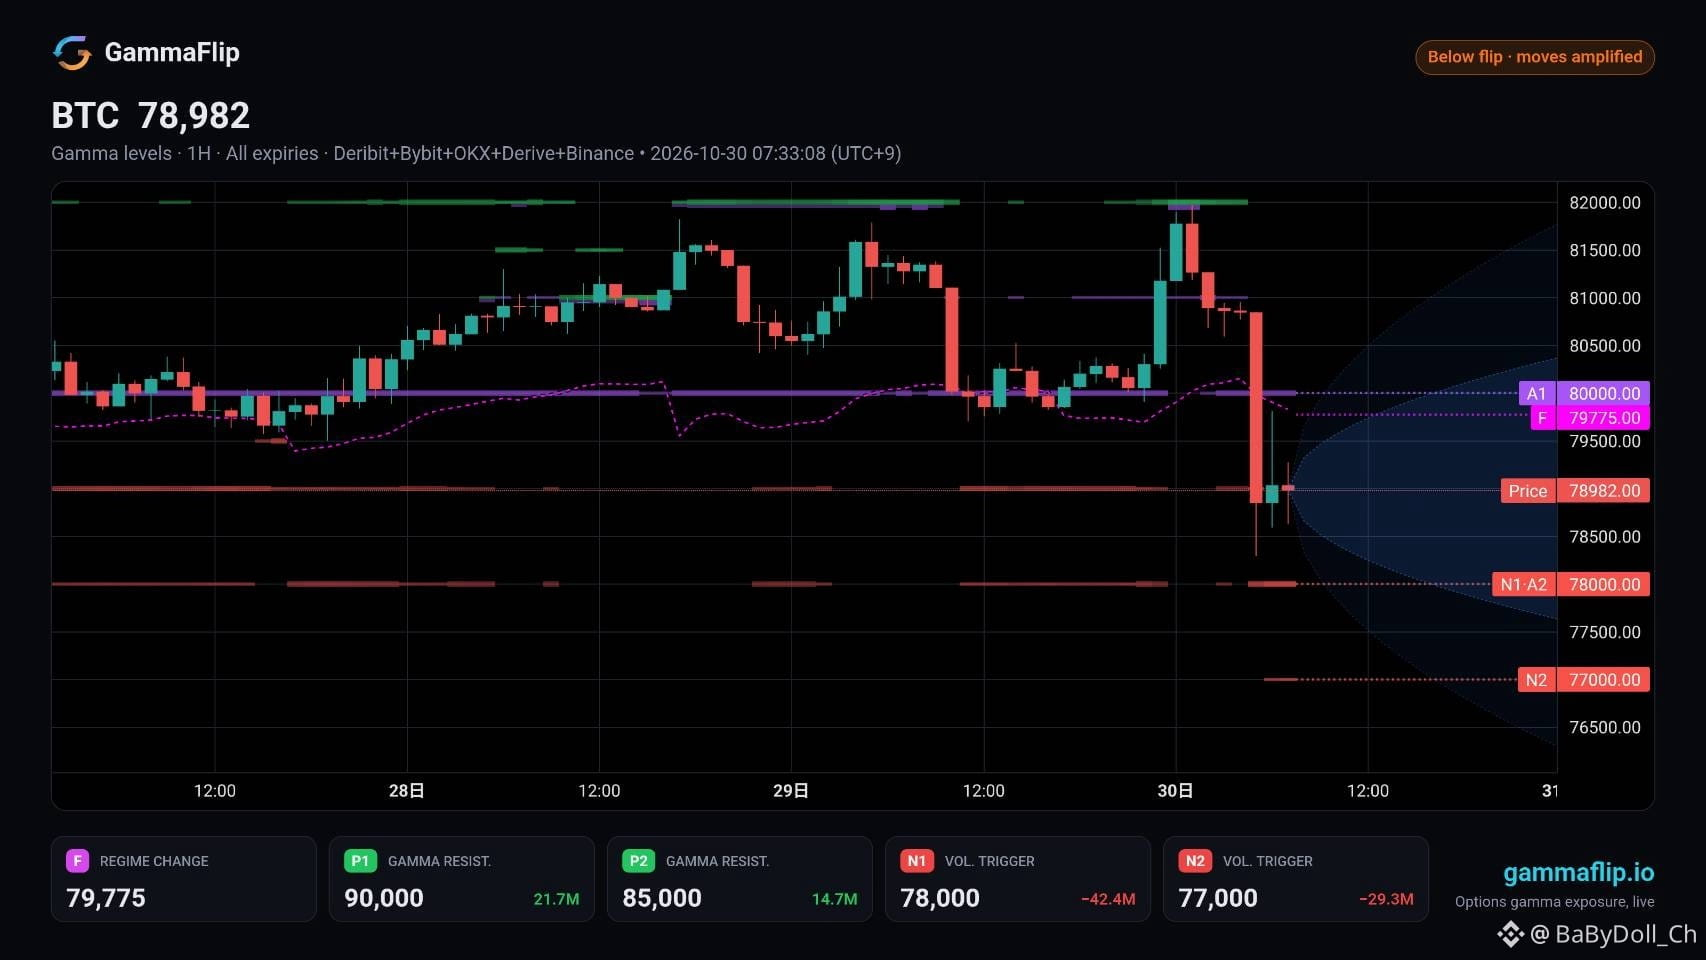
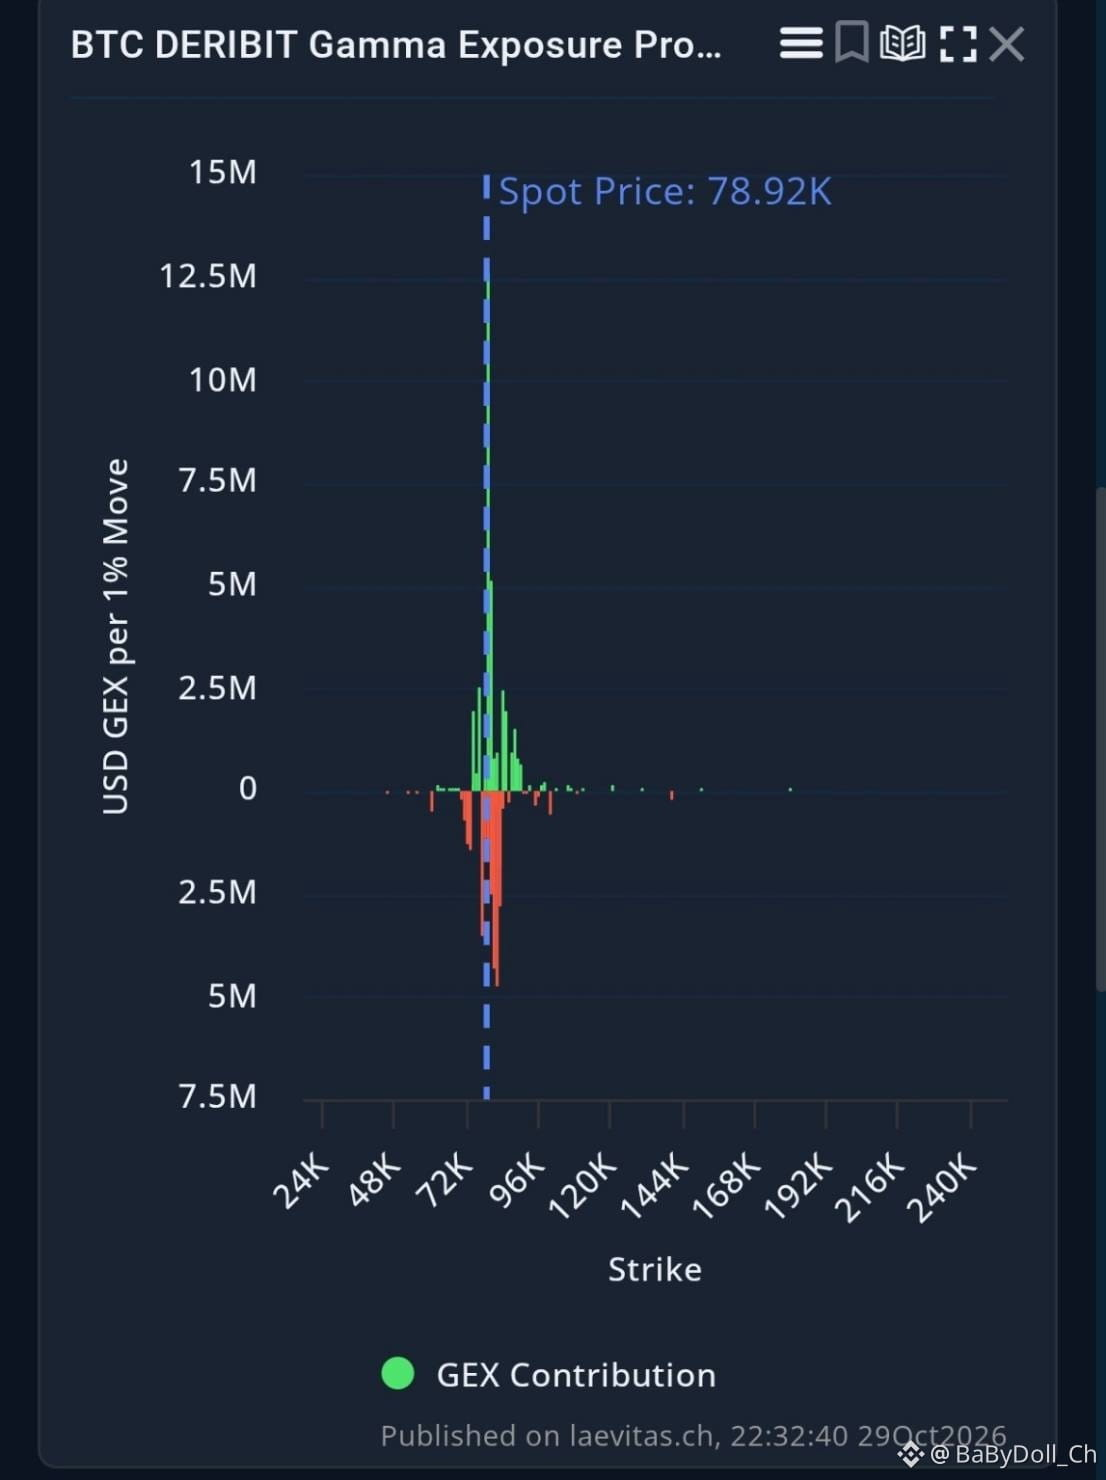
The nearest major upside options wall has shifted lower from $82,000 to around $80,000.
Hedging demand is now heavily concentrated around $80,000.
The key downside options wall remains at $79,000.
This is a significant level, and BTC appears to be battling around it right now.
The next important downside level is $78,000. If BTC breaks below $79,000, the $78,000 area could become the next focus.
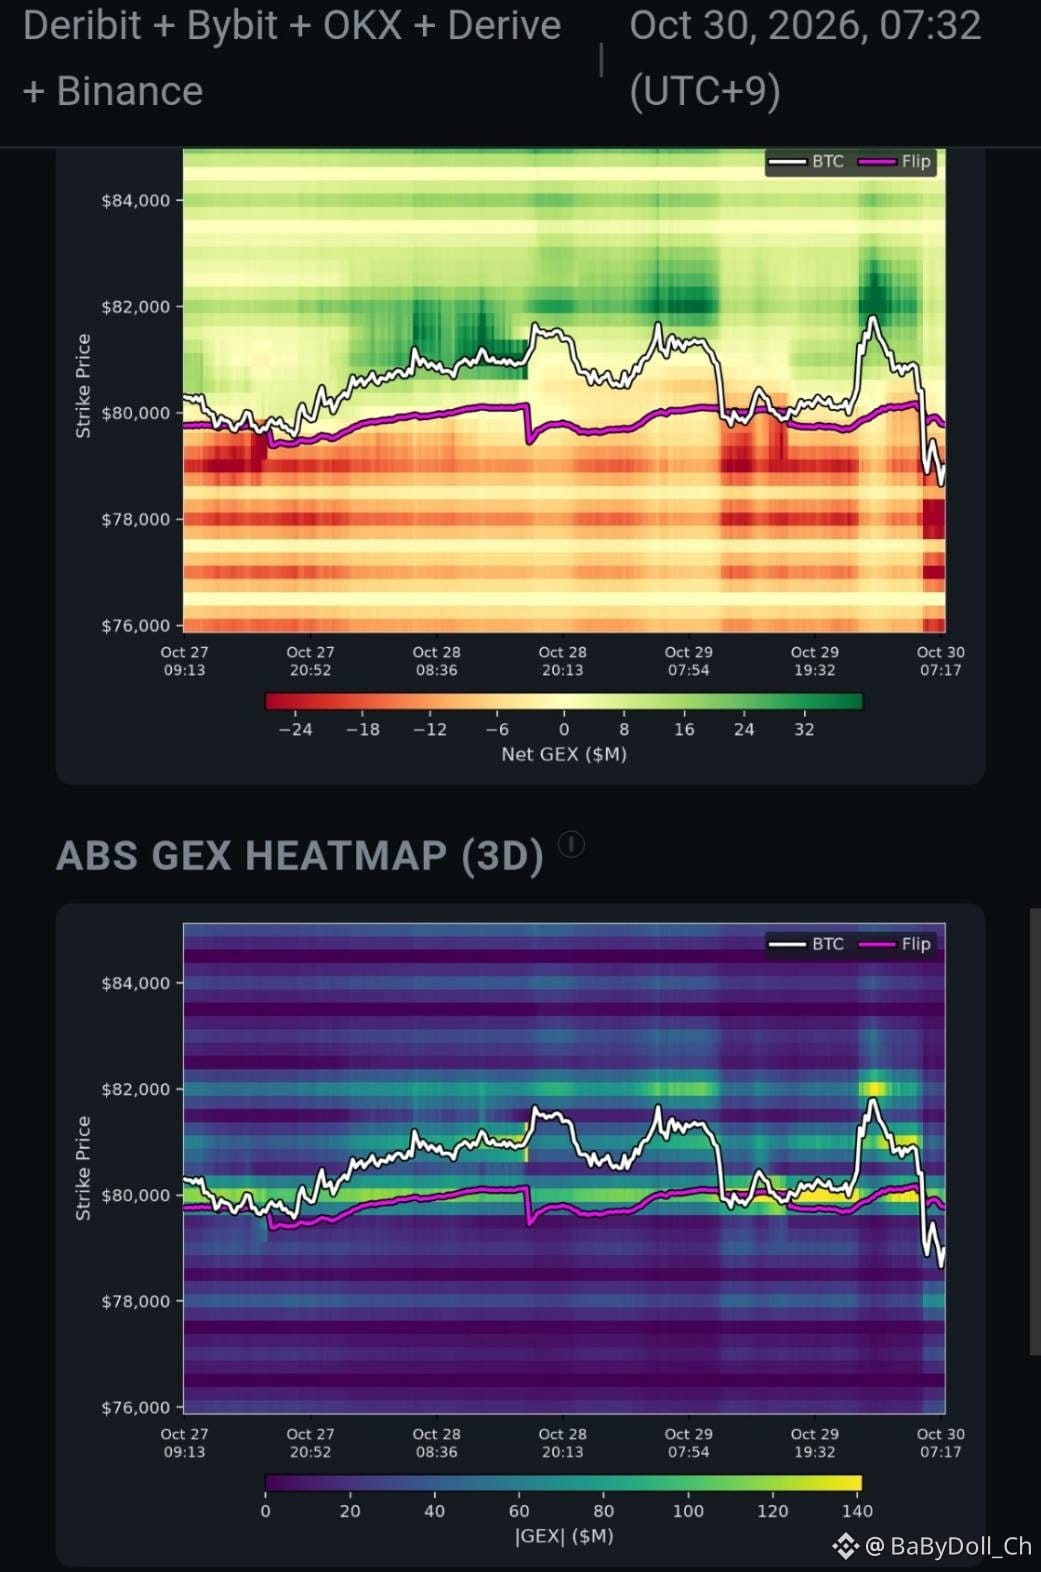
The key Gamma Flip level for market makers (MMs) is also around $80,000.
With BTC currently trading below this level, caution is warranted as price movements could become more volatile.
In this environment, traditional technical support and resistance levels may become less reliable.
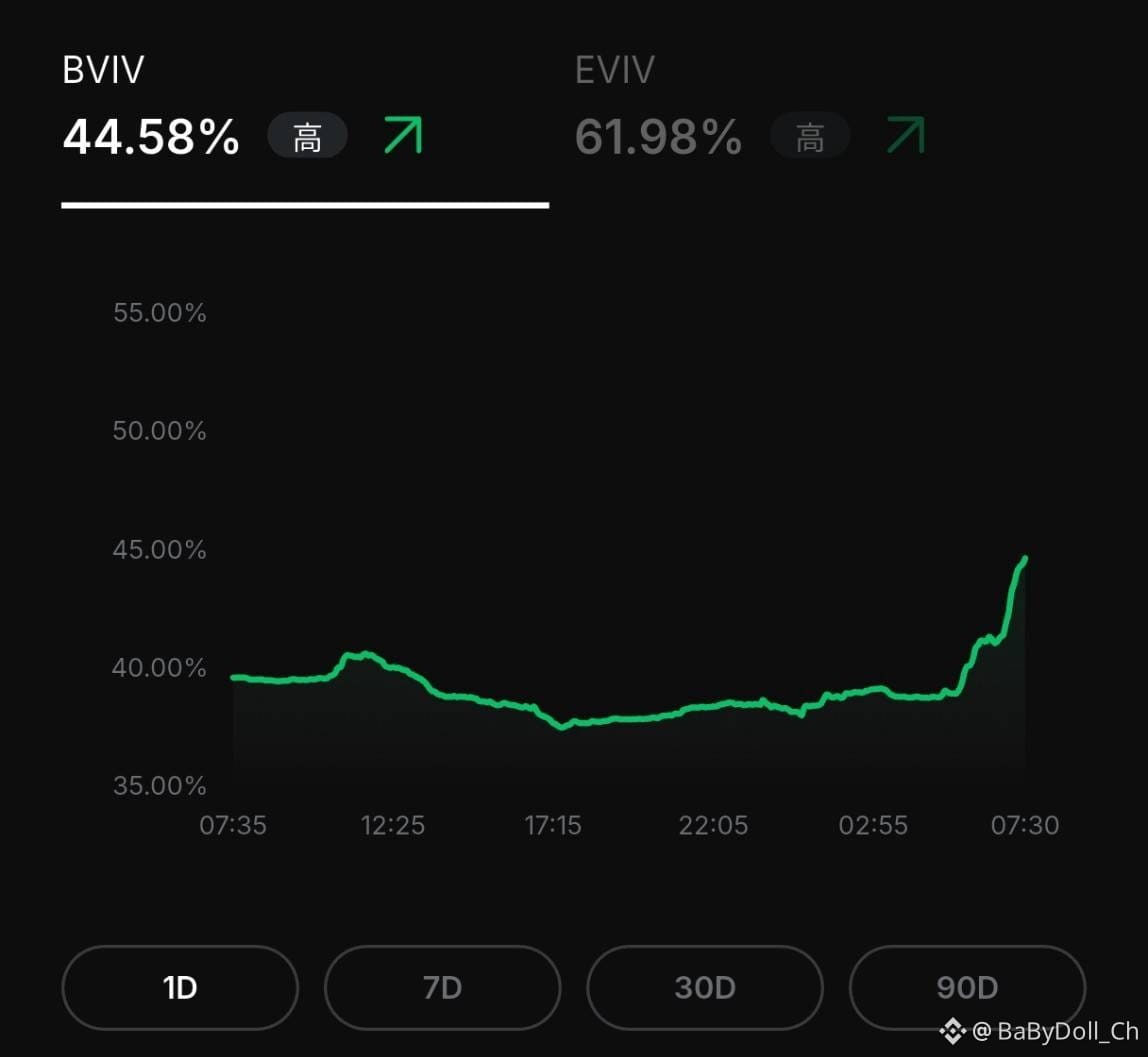
Meanwhile, Bitcoin implied volatility (BVIV) has surged into the mid-40% range.
This indicates that the options market is pricing in larger potential price swings ahead, so extra caution is advised.
{spot}(BTCUSDT)
#BTC
#bitcoin
Today's Bitcoin Options Analysis
⚠️ Today marks a major options expiration! ⚠️
BTC has declined following the reported Binance hack.
The nearest major upside options wall has shifted lower from $82,000 to around $80,000.
Hedging demand is now heavily concentrated around $80,000.
The key downside options wall remains at $79,000.
This is a significant level, and BTC appears to be battling around it right now.
The next important downside level is $78,000. If BTC breaks below $79,000, the $78,000 area could become the next focus.
The key Gamma Flip level for market makers (MMs) is also around $80,000.
With BTC currently trading below this level, caution is warranted as price movements could become more volatile.
In this environment, traditional technical support and resistance levels may become less reliable.
Meanwhile, Bitcoin implied volatility (BVIV) has surged into the mid-40% range.
This indicates that the options market is pricing in larger potential price swings ahead, so extra caution is advised.
#BTC
#bitcoin
1
363

·
--
BTC MARKET UPDATE: KEY SUPPORT AND RECOVERY LEVELS
1. Whale Activity: A reported $121M BTC transfer between unidentified wallets highlights significant on-chain movement. However, the transfer alone does not confirm institutional accumulation or distribution. Market depth and exchange flows remain important metrics to monitor.
2. Price Action: BTC previously dropped to $78,200 before attempting a recovery. The $80,114 level marks a key intraday reference, while a sustained reclaim of $81,537 could strengthen short-term bullish momentum, with $81,971 as the next resistance to watch.
3. Confirmation Levels: Holding above $80,400 could indicate improving short-term stability. However, after the sharp downside move, buyers still need to demonstrate sustained strength. A rejection near resistance or a loss of support could trigger renewed selling pressure.
Strategy: Monitor confirmation rather than chasing the rebound. A sustained hold above support would strengthen the recovery scenario, while a breakdown could expose BTC to further downside volatility.
Key levels: $78,200 support zone | $80,400 short-term support | $81,537 recovery trigger | $81,971 resistance
#BTC #bitcoin #CryptoMarket #TechnicalAnalysis
1
173

·
--
Падение
🚨💥 CRYPTO BLOODBATH! IS THIS JUST THE BEGINNING?
📉 BTC CRASHING TOWARD $78,000!
🔻 Altcoins BLEEDING 15–20% in just ONE HOUR!
🔥 Billions in market value wiped out.
😱 Panic spreading across the market.
💀 Leveraged traders facing brutal liquidations.
But here's the BIG question…
IS THE MARKET ABOUT TO COLLAPSE FURTHER — OR IS A MASSIVE BOUNCE LOADING? 👀
⚠️ Don't confuse a temporary bounce with a confirmed recovery.
$LDO $TIA $GALA
#BTC #cryptocrash #ALTCOİNS #CryptoMarket
1
72

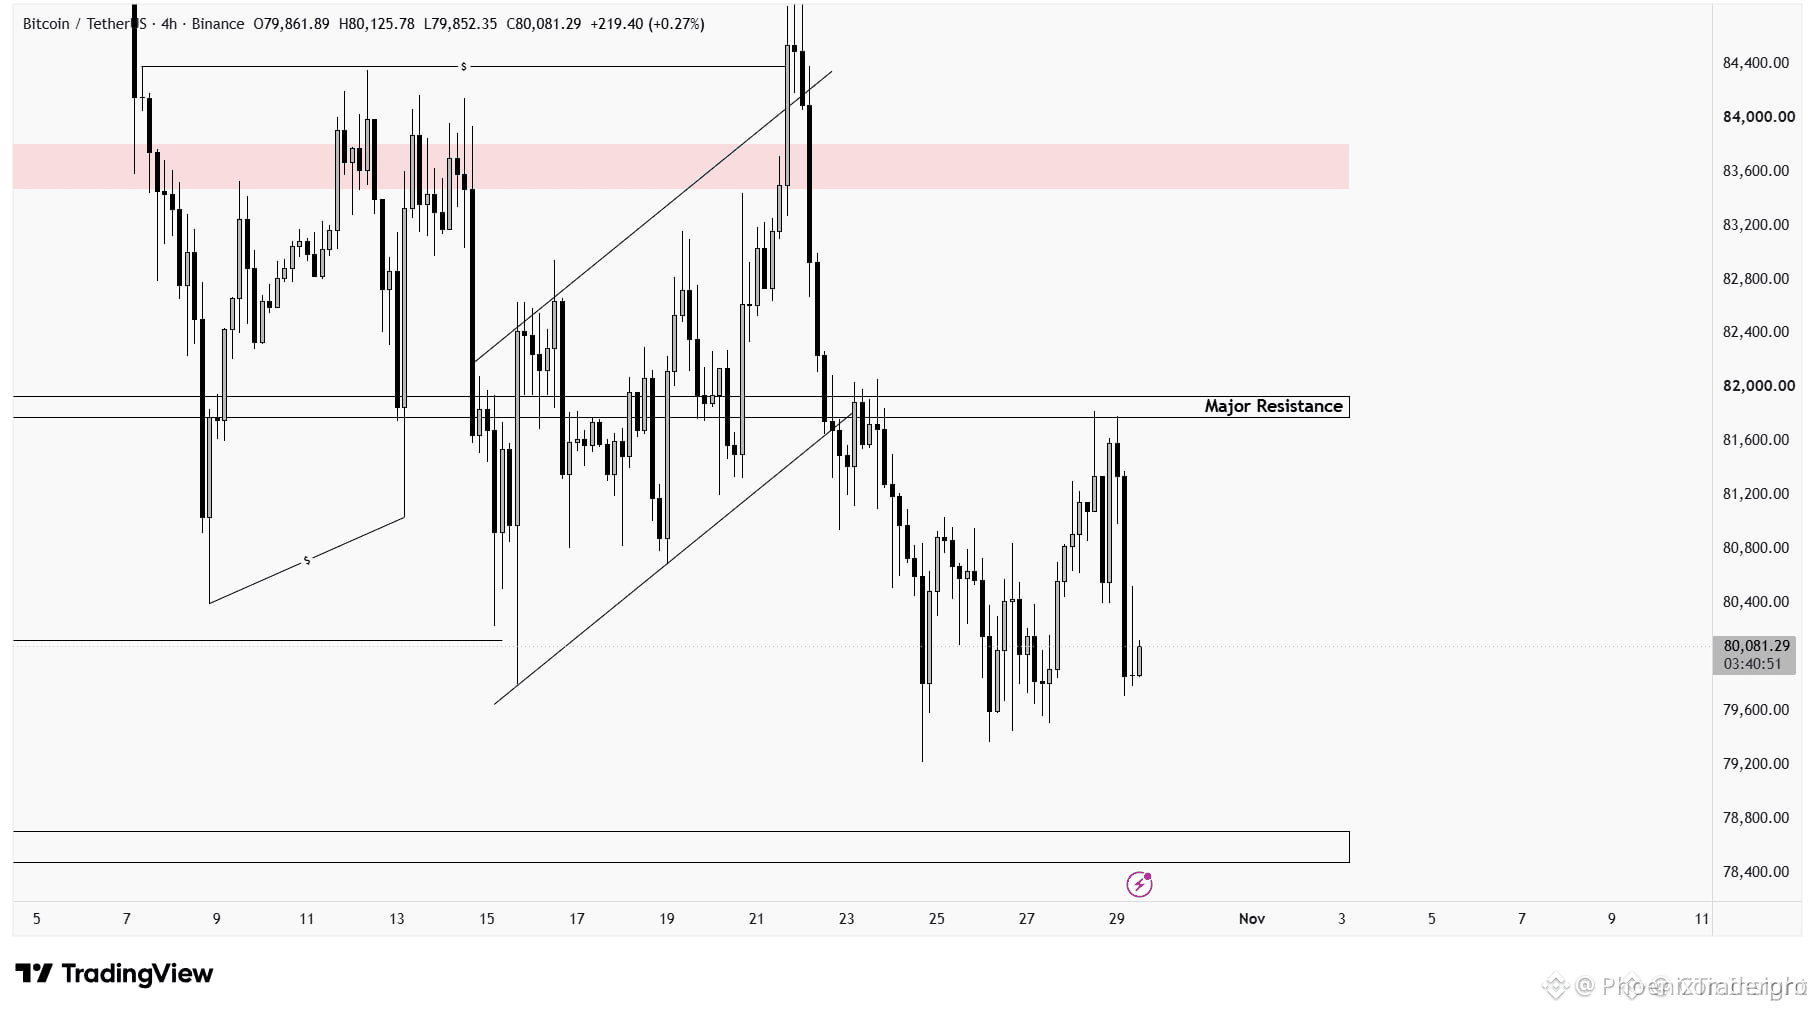
🚨 $BTC REJECTED AT RESISTANCE, FOMC FREEZES MOMENTUM 🟢
📊 The market hit the ceiling at the classic $BTC resistance, only to be slammed back by a FOMC‑driven pause. Sellers seized the moment, swallowing every bid that tried to breach the ceiling.
Now the price is coasting toward the $78,500‑$78,700 support corridor 📌, trading flat on the 4‑hour chart. ⚡ With liquidity drying up, any premature entry could get caught in a squeeze. 💬 Are you waiting for a clean break below support or staying on the sidelines? 👇
⚠️ Not financial advice. Always manage your risk. 🛡️
🏷️ #BTC #Resistance #SupportZone #Crypto
🔥 💎
33

$BTC
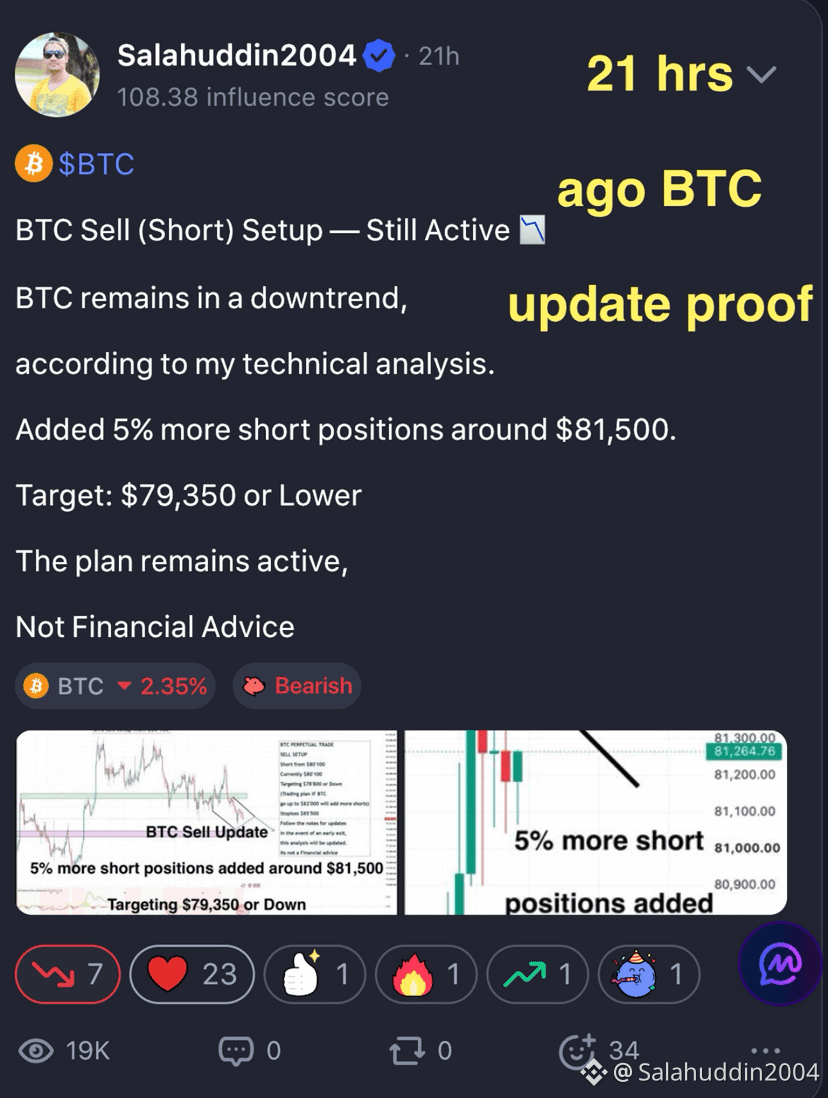
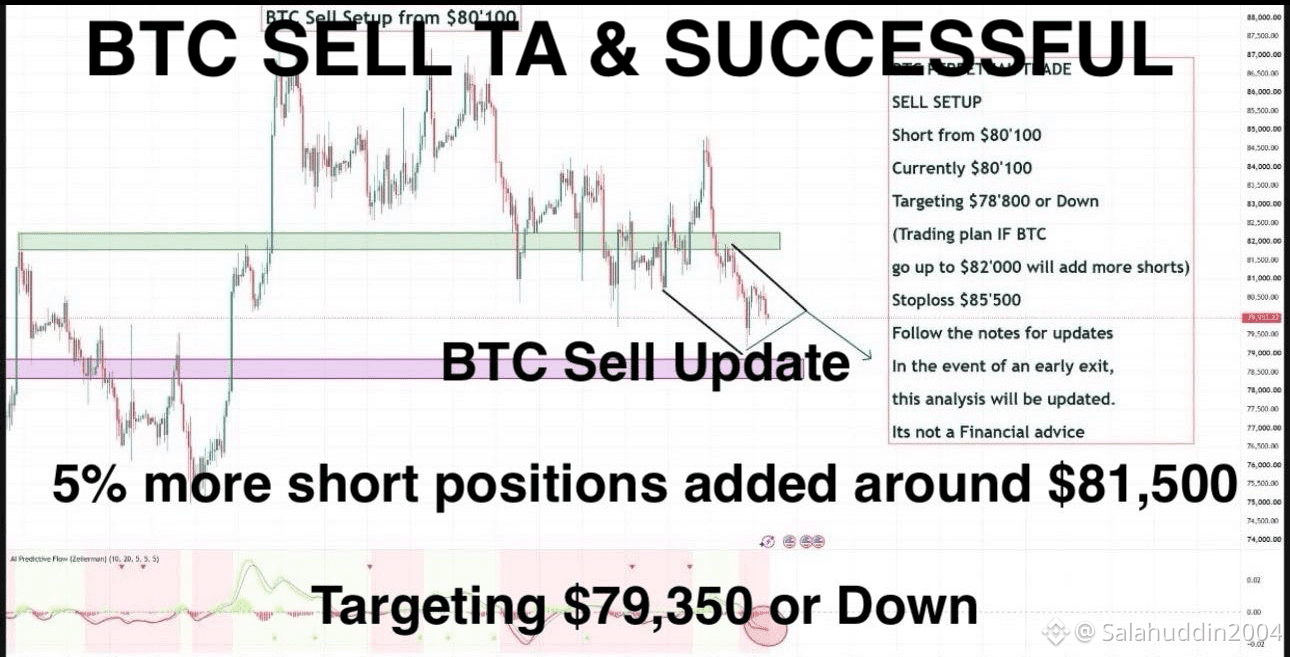
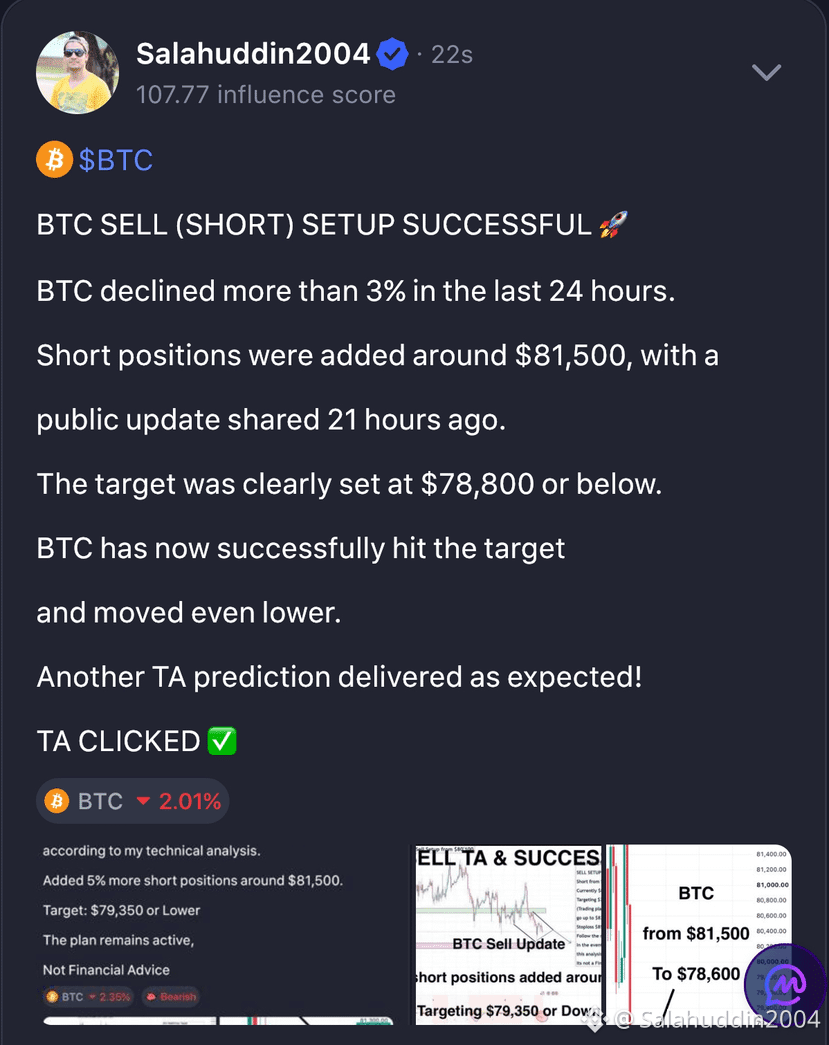
BTC SELL (SHORT) SETUP SUCCESSFUL
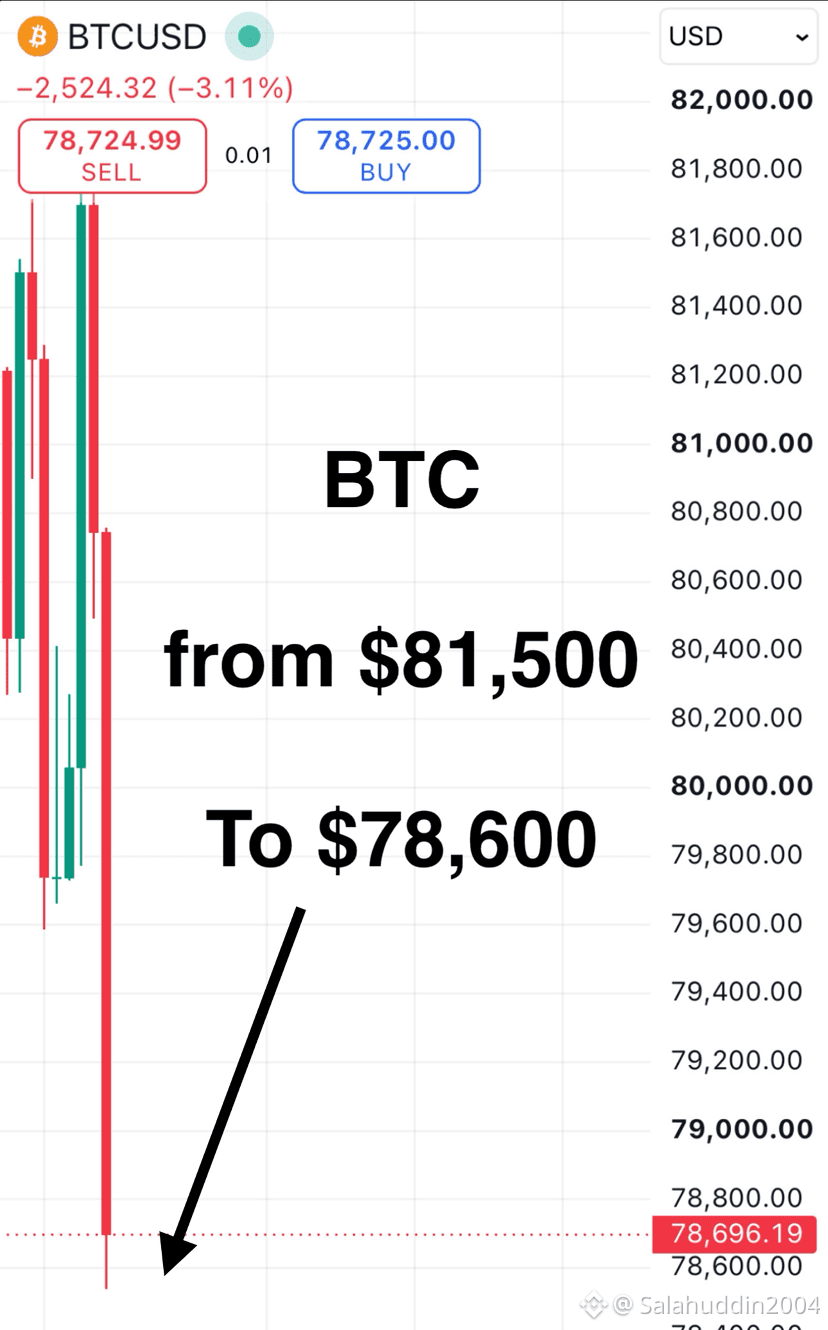
BTC declined more than
3% in the last 24 hours.
Short positions were added around
$81,500, with a
public update shared 21 hours ago.
The target was clearly set
at $78,800 or below.
BTC has now successfully hit the target
and moved even lower.
Another TA prediction
delivered as expected!
TA CLICKED
#USMidtermElections #btc
1
257

·
--
Рост
$BTC BTC Market Levels to Watch
BTC/USDT is trading around $80,760. A move toward $81,164–$81,568 may bring these resistance levels into focus, while $80,189 is a level some traders may monitor for potential downside risk.
These are reference levels only not an entry, target, stop-loss, or instruction to use leverage. Verify the setup independently and manage risk according to your own plan.
$BTC #BTC☀ #BTC
83

·
--
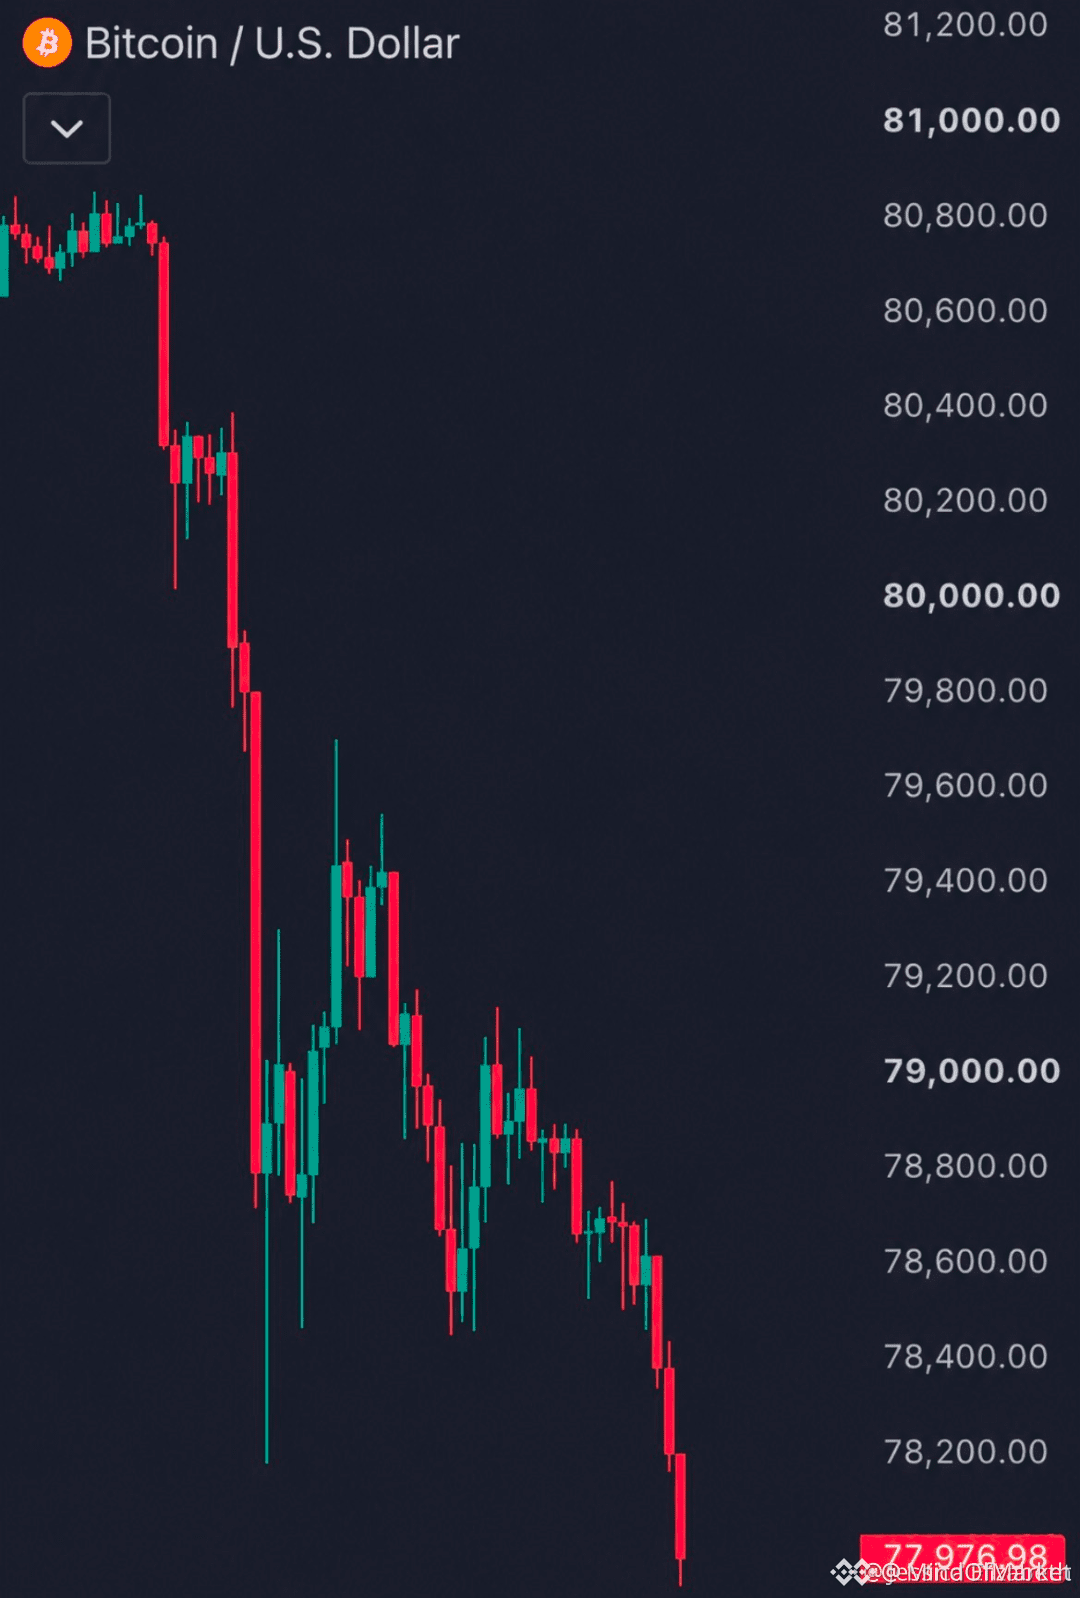
🚨 $BTC BREAKS BELOW $77K – LIQUIDITY SWEEP UNLEASHED! 💥
📊 Smart money has punctured the last bullish order block under $77k, flushing $700 M of long exposure in a tight 4‑hour window. The sell‑side pressure carved a fresh fair‑value gap that institutional hunters will likely target as a liquidity pool. 🦈
With the 4H range now broken, the next pivot hinges on whether sellers can protect the $75.5k‑$74k liquidity basin or if a rapid reclamation of the gap forces a short‑cover rally. 🔍 Expect volume spikes on any retest. 💬 Will the market honor the downside bias or flip the script with a swift gap fill? 👇
⚠️ Not financial advice. Always manage your risk. 🛡️
🏷️ #BTC #ShortSetup #LiquiditySweep #Crypto
🦈 🔥
34

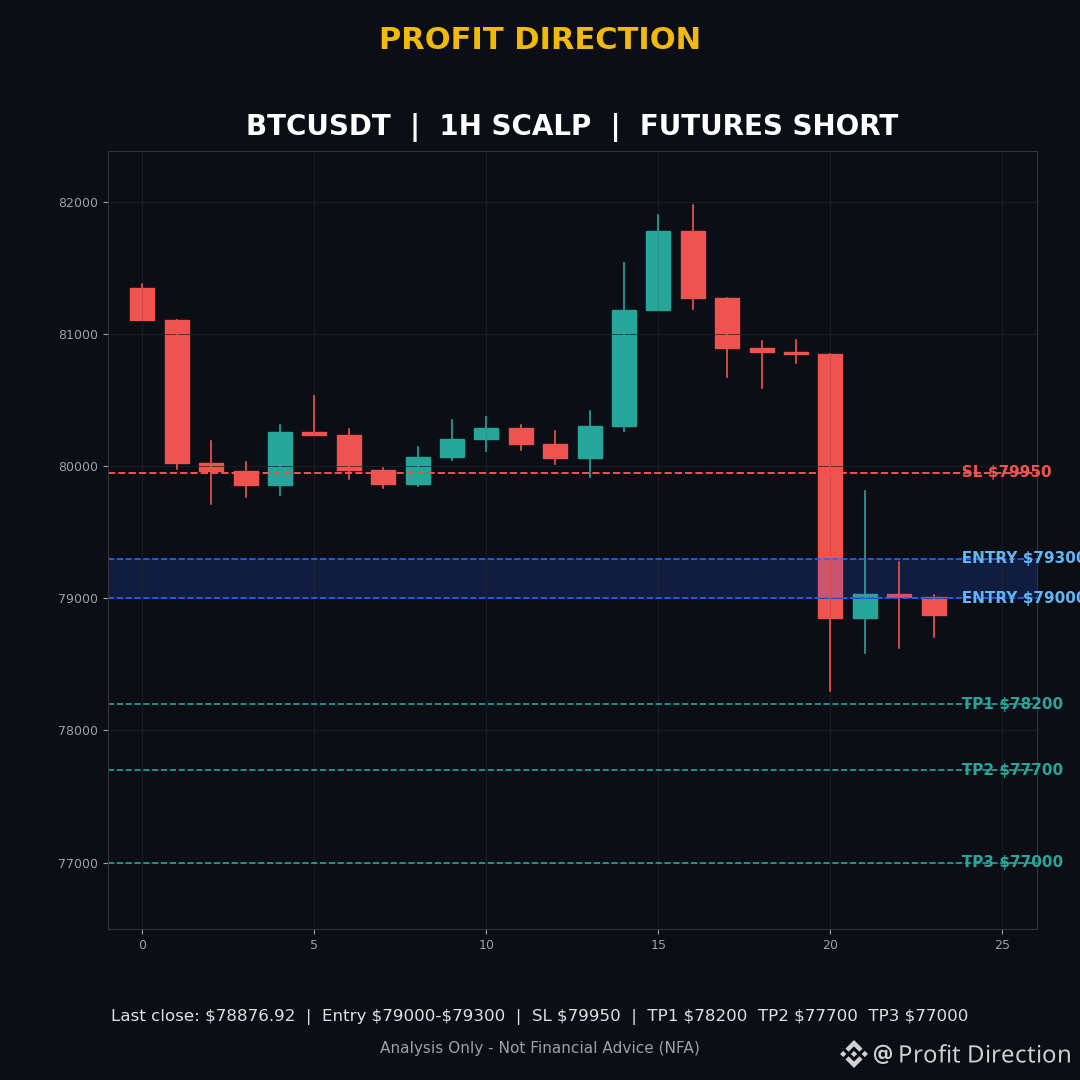
🔴 BTCUSDT — FUTURES SHORT (1H SCALP, conditional)
Entry Zone: $79000-$79300
Stop Loss: $79950
TP1: $78200
TP2: $77700
TP3: $77000
R:R: 1:1.19 to TP1, 1:1.81 to TP2, 1:2.69 to TP3 (midpoint $79150)
Timeframe: 1H SCALP
Bitcoin dropped hard and then failed to bounce properly, and that is the setup I am watching from the short side.
Why I like this one: BTC fell from about $80850 to $78297 in the 20:00 UTC hour on October 29, then bounced up to $79811 and got rejected, and the next bounces made lower highs at $79272 and $79025. Price is now below the entry zone at about $78877, so this is a conditional setup — I am not chasing it here, I am waiting for a retest back into $79000-$79300. If it gets there and fails again, the path back toward $78200, then $77700 and $77000, opens up with good reward against the risk.
Invalidation: a 1H close above $79950 breaks the rejection pattern and cancels this idea — do not hold a losing short hoping it turns around.
Analysis Only — Not Financial Advice (NFA). Trading involves risk.
Follow Profit Direction for more signals, best signals and market updates. Share your opinion in the comments.
#BTC #BTCUSDT #Bitcoin #CryptoTrading
73

·
--
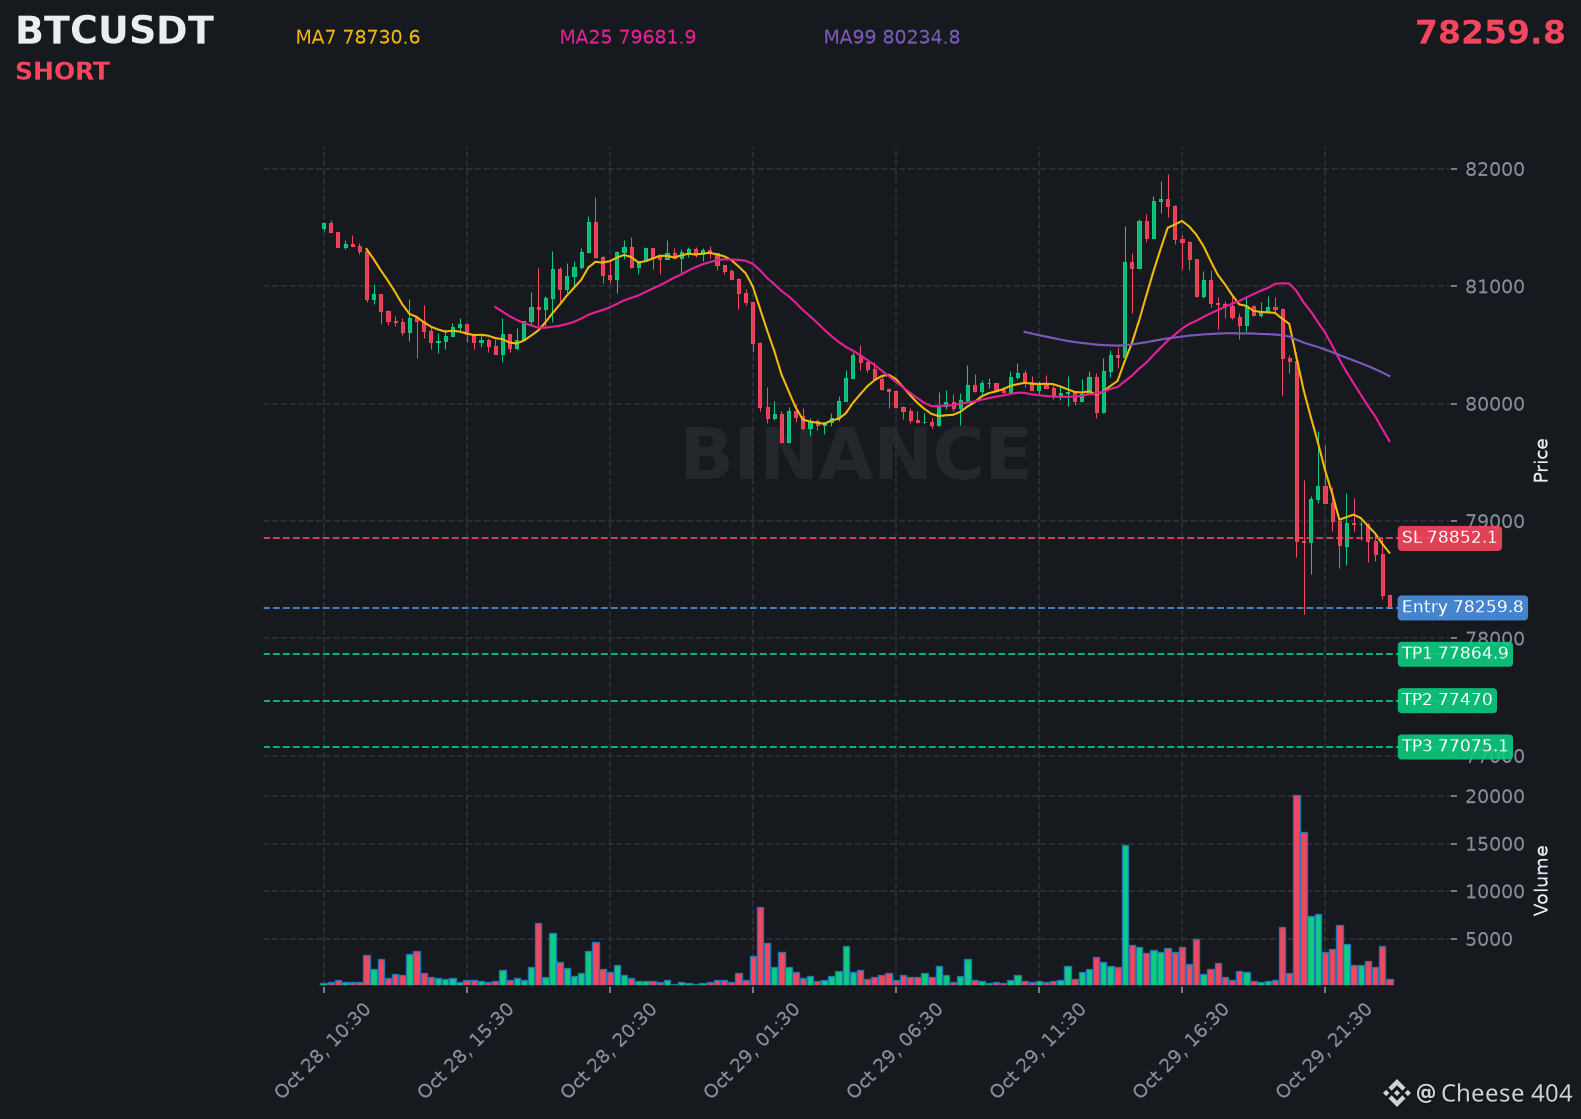
$BTC is showing a clear downtrend, with sellers stepping in and pushing the price lower.
📍 @ 78259.8 | Volume: 57.70M USD
RSI 23 | EMA20: 79277.5 USD
📈 Trade Plan:
📈 Entry: 78141.3 – 78378.3
🛑 Stop Loss: 78852.1
🎯 TP1: 77864.9
🎯 TP2: 77470
🎯 TP3: 77075.1
Waiting for confirmation, then riding the downtrend.
👉 $BTC 👈 Catch it
#BTC
📍 @ 78259.8 | Volume: 57.70M USD
RSI 23 | EMA20: 79277.5 USD
📈 Trade Plan:
📈 Entry: 78141.3 – 78378.3
🛑 Stop Loss: 78852.1
🎯 TP1: 77864.9
🎯 TP2: 77470
🎯 TP3: 77075.1
Waiting for confirmation, then riding the downtrend.
👉 $BTC 👈 Catch it
#BTC
48

·
--
Падение
$BTC Down, $ETH Down, and the Market Is in the Red! 🔴
Well, just look at the market today!
$BTC , $ETH, and most altcoins are taking a hit. If you've been following my recent posts, you'll remember that I warned about this possibility two days ago.
Since then, I've been sharing potential short setups across multiple coins, and we're now seeing that bearish scenario play out.
I will soon be looking to take bullish setups at my predefined levels. Some have already been shared, and I'll be sharing some more opportunities.
The approach remains simple: Plan, wait, execute, repeat. Always with proper risk management.
For now, enjoy the move down!
#BTC #ETH #altcoins
$BTC Down, $ETH Down, and the Market Is in the Red! 🔴
Well, just look at the market today!
$BTC , $ETH , and most altcoins are taking a hit. If you've been following my recent posts, you'll remember that I warned about this possibility two days ago.
Since then, I've been sharing potential short setups across multiple coins, and we're now seeing that bearish scenario play out.
I will soon be looking to take bullish setups at my predefined levels. Some have already been shared, and I'll be sharing some more opportunities.
The approach remains simple: Plan, wait, execute, repeat. Always with proper risk management.
For now, enjoy the move down!
#BTC #ETH #altcoins

225
Войдите, чтобы посмотреть больше материала
Присоединяйтесь к пользователям криптовалют по всему миру на Binance Square
⚡️ Получайте новейшую и полезную информацию о криптоактивах.
💬 Нам доверяет крупнейшая в мире криптобиржа.
👍 Получите достоверные аналитические данные от верифицированных создателей контента.
Эл. почта/номер телефона
В тренде
1
#FedWatch
Просмотров: 16.3M
39,472 обсуждают
2
#EarningsSeason
Просмотров: 6.5M
32,182 обсуждают
3
#USMidtermElections
Просмотров: 49,408
656 обсуждают
4
#BitcoinDropsBelow$80K
Просмотров: 33,202
128 обсуждают
5
#BoEOpensConsultationOnTokenizedCollateralForClearing
Просмотров: 696
32 обсуждают
6
#BrazilCryptoExchangesMustApplyForLicensesByFriday
Просмотров: 35,990
528 обсуждают
7
#ICEPartnersWithTradeXYZToBringPerpetualContractsToUS
Просмотров: 727
21 обсуждают
8
#SolidusLabsReportsSuspected$170MSpoofingOnHyperliquidOilContracts
Просмотров: 1,775
29 обсуждают
9
#StanDruckenmillerBecomesInvestorInTradeXYZ
Просмотров: 27,455
457 обсуждают
10
#RussiaProposedNonCustodialWalletLimitsExcludeIntlSettlements
Просмотров: 2,459
41 обсуждают