
Arjun 55
327 Публикации

Arjun 55
Отправить жалобу
Заблокировать пользователя
start your journey with binance and grow your knowledge and mindset you will be success your dream journey
Открытая сделка
Случайный трейдер
1.8 г
22 подписок(и/а)
48 подписчиков(а)
62 понравилось
Посты
Портфель
·
--
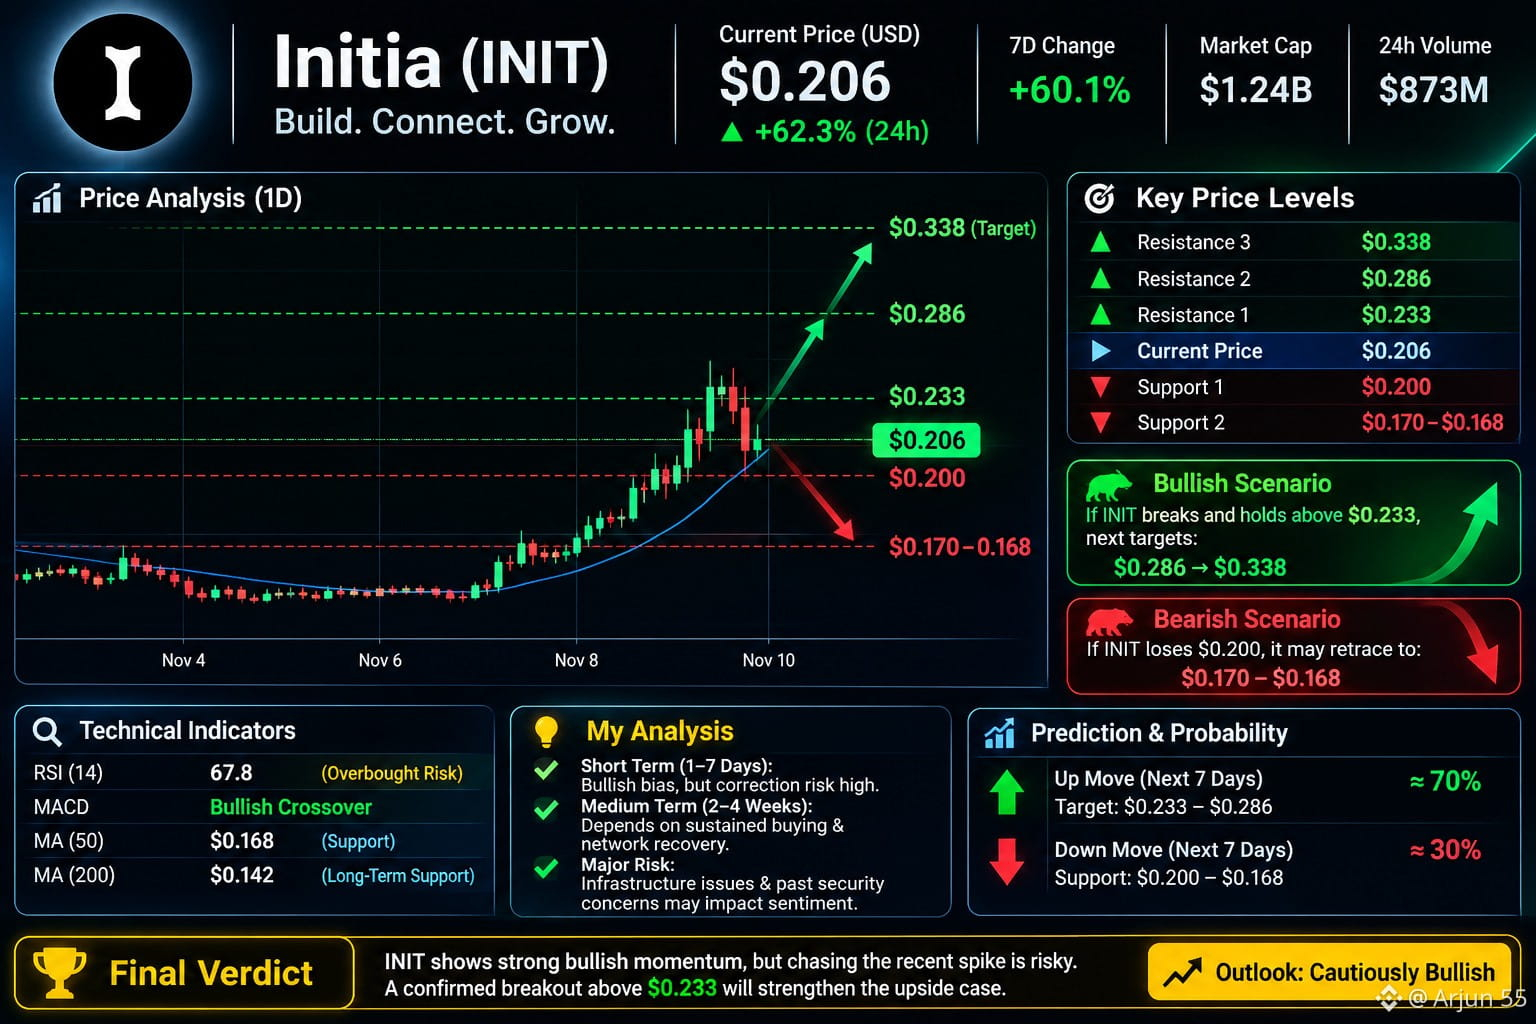
$INIT INIT (Ini tia) Token – Recent Analysis & Future Prediction
As of 10 November 2026, INIT is showing a strong recovery.
Market snapshot (USD)
Current price: approximately $0.20–$0.21
24-hour gain: approximately 58–71%
7-day gain: approximately 57–64%
RSI: approximately 67–69, indicating potentially overbought conditions.
Important price levels
Level Price (USD)
First resistance $0.215–0.216
Second resistance $0.233
Major resistance $0.286
Strong upside target $0.338
First support $0.200
Strong support $0.170–0.168
Future movement prediction
If INIT breaks and sustains above $0.233, the next possible targets are $0.286 and $0.338.
If INIT loses $0.200, it could retrace towards $0.170–$0.168.
My analysis
Short term (1–7 days): Bullish bias, but correction risk is high.
Medium term (2–4 weeks): Depends on sustained buying and network recovery.
Major risk: Recent rollup infrastructure disruption and earlier security concerns could affect investor confidence.
My verdict: INIT has bullish momentum, but chasing the recent sharp rise is risky. A confirmed breakout above $0.233 would strengthen the bullish case.
#INIT #QI #one #CPIWatch #USJobData
{spot}(INITUSDT)
{spot}(QIUSDT)
{spot}(ONEUSDT)
$INIT INIT (Ini tia) Token – Recent Analysis & Future Prediction
As of 10 November 2026, INIT is showing a strong recovery.
Market snapshot (USD)
Current price: approximately $0.20–$0.21
24-hour gain: approximately 58–71%
7-day gain: approximately 57–64%
RSI: approximately 67–69, indicating potentially overbought conditions.
Important price levels
Level Price (USD)
First resistance $0.215–0.216
Second resistance $0.233
Major resistance $0.286
Strong upside target $0.338
First support $0.200
Strong support $0.170–0.168
Future movement prediction
If INIT breaks and sustains above $0.233, the next possible targets are $0.286 and $0.338.
If INIT loses $0.200, it could retrace towards $0.170–$0.168.
My analysis
Short term (1–7 days): Bullish bias, but correction risk is high.
Medium term (2–4 weeks): Depends on sustained buying and network recovery.
Major risk: Recent rollup infrastructure disruption and earlier security concerns could affect investor confidence.
My verdict: INIT has bullish momentum, but chasing the recent sharp rise is risky. A confirmed breakout above $0.233 would strengthen the bullish case.
#INIT #QI #one #CPIWatch #USJobData
As of 10 November 2026, INIT is showing a strong recovery.
Market snapshot (USD)
Current price: approximately $0.20–$0.21
24-hour gain: approximately 58–71%
7-day gain: approximately 57–64%
RSI: approximately 67–69, indicating potentially overbought conditions.
Important price levels
Level Price (USD)
First resistance $0.215–0.216
Second resistance $0.233
Major resistance $0.286
Strong upside target $0.338
First support $0.200
Strong support $0.170–0.168
Future movement prediction
If INIT breaks and sustains above $0.233, the next possible targets are $0.286 and $0.338.
If INIT loses $0.200, it could retrace towards $0.170–$0.168.
My analysis
Short term (1–7 days): Bullish bias, but correction risk is high.
Medium term (2–4 weeks): Depends on sustained buying and network recovery.
Major risk: Recent rollup infrastructure disruption and earlier security concerns could affect investor confidence.
My verdict: INIT has bullish momentum, but chasing the recent sharp rise is risky. A confirmed breakout above $0.233 would strengthen the bullish case.
#INIT #QI #one #CPIWatch #USJobData
224
·
--
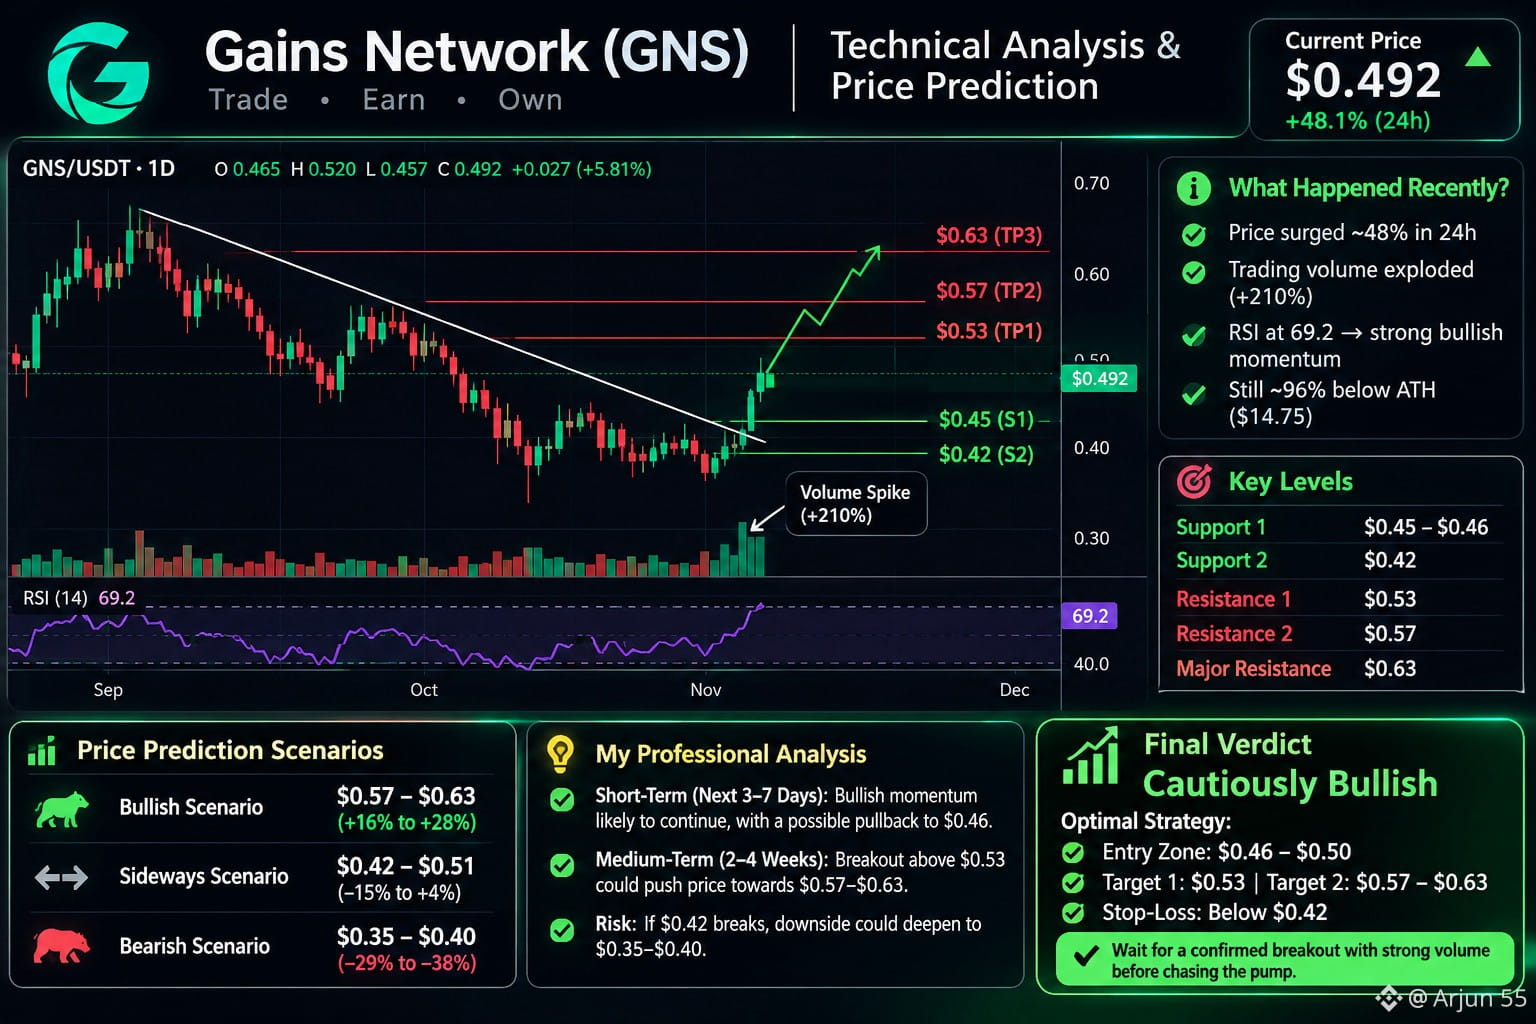
$GNS Gains Network (GNS) – Price Analysis & Prediction
Current price: Approximately $0.48–$0.51 (November 9, 2026).
What happened recently?
GNS surged approximately 48% in 24 hours.
Trading volume increased sharply, indicating strong buying activity.
However, the token remains around 96% below its all-time high.
RSI is around 60, showing positive but not yet extreme momentum.
Important price levels
Level Price (USD)
Support 1 $0.45–0.46
Support 2 $0.42
Resistance 1 $0.50–0.51
Resistance 2 $0.53
Major resistance $0.57
Future prediction
These are scenario estimates, not guaranteed targets.
Scenario Possible price
Bullish $0.57–$0.63
Sideways $0.42–$0.51
Bearish $0.35–$0.40
My assessment:
Next few days: Bullish momentum, but a pullback is possible.
Next 2–4 weeks: Potential upside if GNS breaks and holds above $0.51.
If it loses $0.42, downside risk increases considerably.
Final verdict
I would not chase the recent 48% pump. A sustained breakout above $0.51 with strong volume would strengthen the bullish case.
#GNS #TST #ARB #CPIWatch #USJobData
{spot}(GNSUSDT)
{spot}(TSTUSDT)
{spot}(ARBUSDT)
$GNS Gains Network (GNS) – Price Analysis & Prediction
Current price: Approximately $0.48–$0.51 (November 9, 2026).
What happened recently?
GNS surged approximately 48% in 24 hours.
Trading volume increased sharply, indicating strong buying activity.
However, the token remains around 96% below its all-time high.
RSI is around 60, showing positive but not yet extreme momentum.
Important price levels
Level Price (USD)
Support 1 $0.45–0.46
Support 2 $0.42
Resistance 1 $0.50–0.51
Resistance 2 $0.53
Major resistance $0.57
Future prediction
These are scenario estimates, not guaranteed targets.
Scenario Possible price
Bullish $0.57–$0.63
Sideways $0.42–$0.51
Bearish $0.35–$0.40
My assessment:
Next few days: Bullish momentum, but a pullback is possible.
Next 2–4 weeks: Potential upside if GNS breaks and holds above $0.51.
If it loses $0.42, downside risk increases considerably.
Final verdict
I would not chase the recent 48% pump. A sustained breakout above $0.51 with strong volume would strengthen the bullish case.
#GNS #TST #ARB #CPIWatch #USJobData
Current price: Approximately $0.48–$0.51 (November 9, 2026).
What happened recently?
GNS surged approximately 48% in 24 hours.
Trading volume increased sharply, indicating strong buying activity.
However, the token remains around 96% below its all-time high.
RSI is around 60, showing positive but not yet extreme momentum.
Important price levels
Level Price (USD)
Support 1 $0.45–0.46
Support 2 $0.42
Resistance 1 $0.50–0.51
Resistance 2 $0.53
Major resistance $0.57
Future prediction
These are scenario estimates, not guaranteed targets.
Scenario Possible price
Bullish $0.57–$0.63
Sideways $0.42–$0.51
Bearish $0.35–$0.40
My assessment:
Next few days: Bullish momentum, but a pullback is possible.
Next 2–4 weeks: Potential upside if GNS breaks and holds above $0.51.
If it loses $0.42, downside risk increases considerably.
Final verdict
I would not chase the recent 48% pump. A sustained breakout above $0.51 with strong volume would strengthen the bullish case.
#GNS #TST #ARB #CPIWatch #USJobData
325
·
--
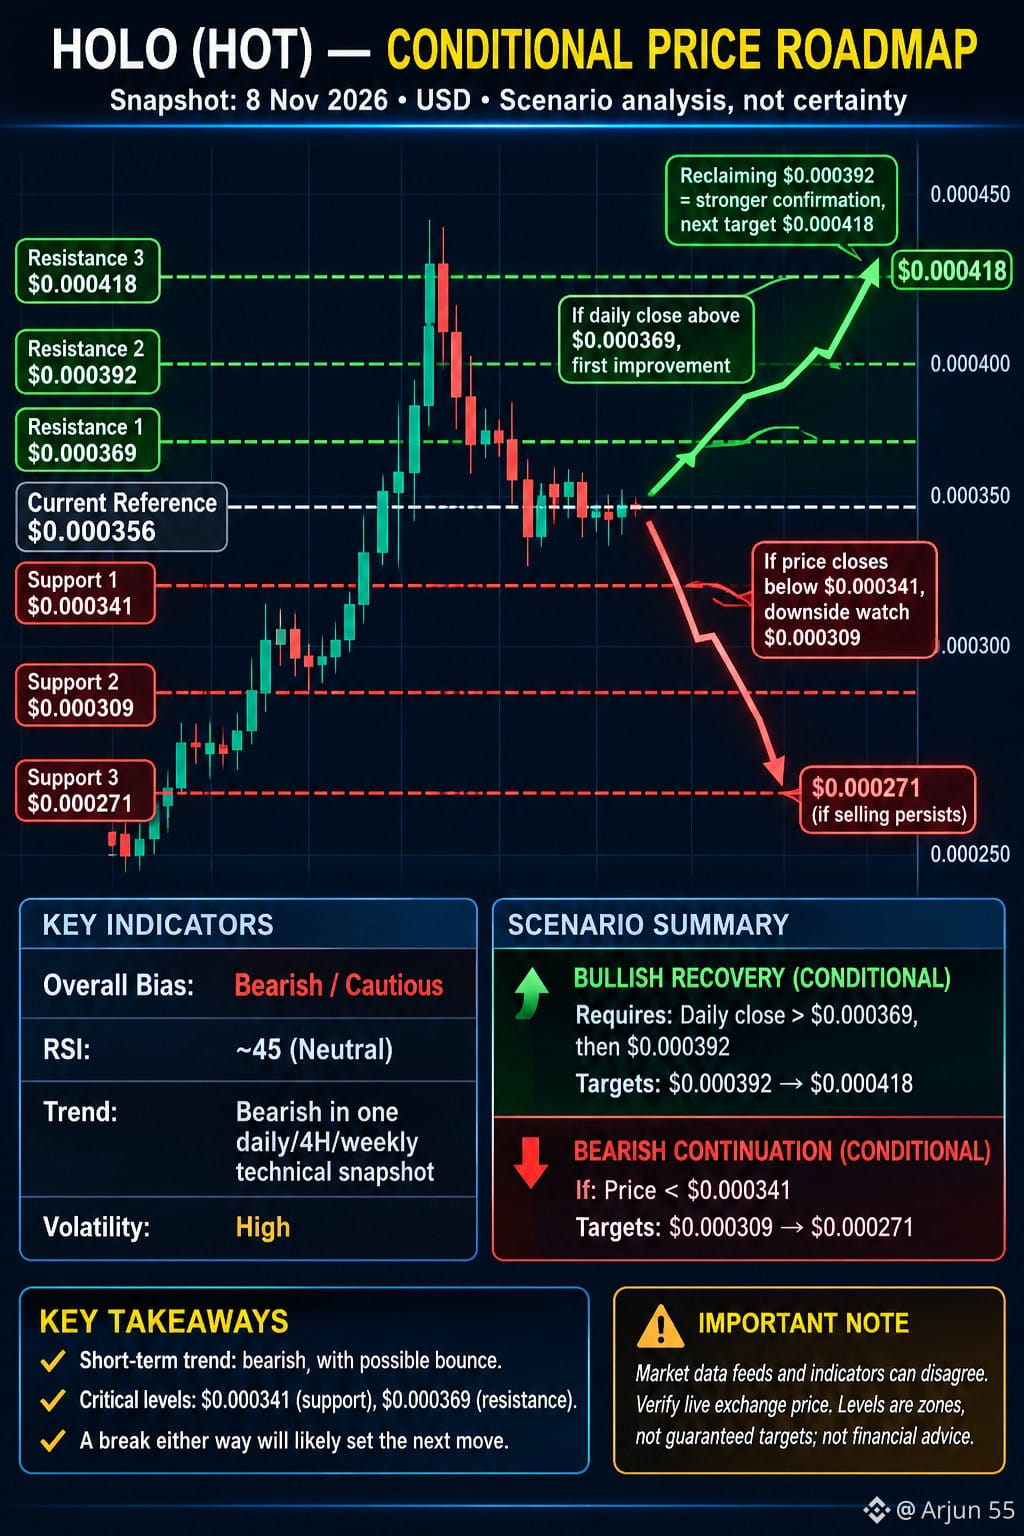
$HOT Holo (HOT) – Recent performance & future price prediction
HOLO (HOT)
My approach: Evaluate the recent price movement, buying and selling pressure, support and resistance, and the probability of an upward or downward move.
The key question is whether HOT is preparing for a recovery or continuing its downward trend. A price increase alone does not confirm a trend reversal.
Recent market performance
As of November 8, 2026, market feeds are showing conflicting prices:
Source HOT price 24h movement
$0.0003538 -3.88%
Investing.com $0.000462 +26.96%
$0.0004778 +33.72%
These discrepancies are significant. Verify the actual HOT/USDT exchange price before trading.
Important technical levels
Using the analysis as the reference:
Level Price
Support 1 $0.000361
Support 2 $0.000307
Resistance 1 $0.000383
A sustained move above $0.000383 would improve the bullish outlook. Losing $0.000307 would increase downside risk.
Future movement prediction
Bullish scenario: Buyers defend support and reclaim resistance, potentially starting another recovery.
Sideways scenario: HOT consolidates while buyers and sellers find balance.
Bearish scenario: Support breaks, leading to another decline.
One important warning: Investing.com reports RSI around 84.9 on its November 8 snapshot, indicating overbought conditions. A pullback is possible even during a strong rally.
My assessment
I would not call HOT a confirmed buy yet. I would wait for price confirmation, particularly a sustained breakout with strong trading volume.
#HOT #BMT #ACT #CPIWatch #USJobData
{spot}(HOTUSDT)
{spot}(BMTUSDT)
{spot}(ACTUSDT)
$HOT Holo (HOT) – Recent performance & future price prediction
HOLO (HOT)
My approach: Evaluate the recent price movement, buying and selling pressure, support and resistance, and the probability of an upward or downward move.
The key question is whether HOT is preparing for a recovery or continuing its downward trend. A price increase alone does not confirm a trend reversal.
Recent market performance
As of November 8, 2026, market feeds are showing conflicting prices:
Source HOT price 24h movement
$0.0003538 -3.88%
Investing.com $0.000462 +26.96%
$0.0004778 +33.72%
These discrepancies are significant. Verify the actual HOT/USDT exchange price before trading.
Important technical levels
Using the analysis as the reference:
Level Price
Support 1 $0.000361
Support 2 $0.000307
Resistance 1 $0.000383
A sustained move above $0.000383 would improve the bullish outlook. Losing $0.000307 would increase downside risk.
Future movement prediction
Bullish scenario: Buyers defend support and reclaim resistance, potentially starting another recovery.
Sideways scenario: HOT consolidates while buyers and sellers find balance.
Bearish scenario: Support breaks, leading to another decline.
One important warning: Investing.com reports RSI around 84.9 on its November 8 snapshot, indicating overbought conditions. A pullback is possible even during a strong rally.
My assessment
I would not call HOT a confirmed buy yet. I would wait for price confirmation, particularly a sustained breakout with strong trading volume.
#HOT #BMT #ACT #CPIWatch #USJobData
HOLO (HOT)
My approach: Evaluate the recent price movement, buying and selling pressure, support and resistance, and the probability of an upward or downward move.
The key question is whether HOT is preparing for a recovery or continuing its downward trend. A price increase alone does not confirm a trend reversal.
Recent market performance
As of November 8, 2026, market feeds are showing conflicting prices:
Source HOT price 24h movement
$0.0003538 -3.88%
Investing.com $0.000462 +26.96%
$0.0004778 +33.72%
These discrepancies are significant. Verify the actual HOT/USDT exchange price before trading.
Important technical levels
Using the analysis as the reference:
Level Price
Support 1 $0.000361
Support 2 $0.000307
Resistance 1 $0.000383
A sustained move above $0.000383 would improve the bullish outlook. Losing $0.000307 would increase downside risk.
Future movement prediction
Bullish scenario: Buyers defend support and reclaim resistance, potentially starting another recovery.
Sideways scenario: HOT consolidates while buyers and sellers find balance.
Bearish scenario: Support breaks, leading to another decline.
One important warning: Investing.com reports RSI around 84.9 on its November 8 snapshot, indicating overbought conditions. A pullback is possible even during a strong rally.
My assessment
I would not call HOT a confirmed buy yet. I would wait for price confirmation, particularly a sustained breakout with strong trading volume.
#HOT #BMT #ACT #CPIWatch #USJobData
134
·
--
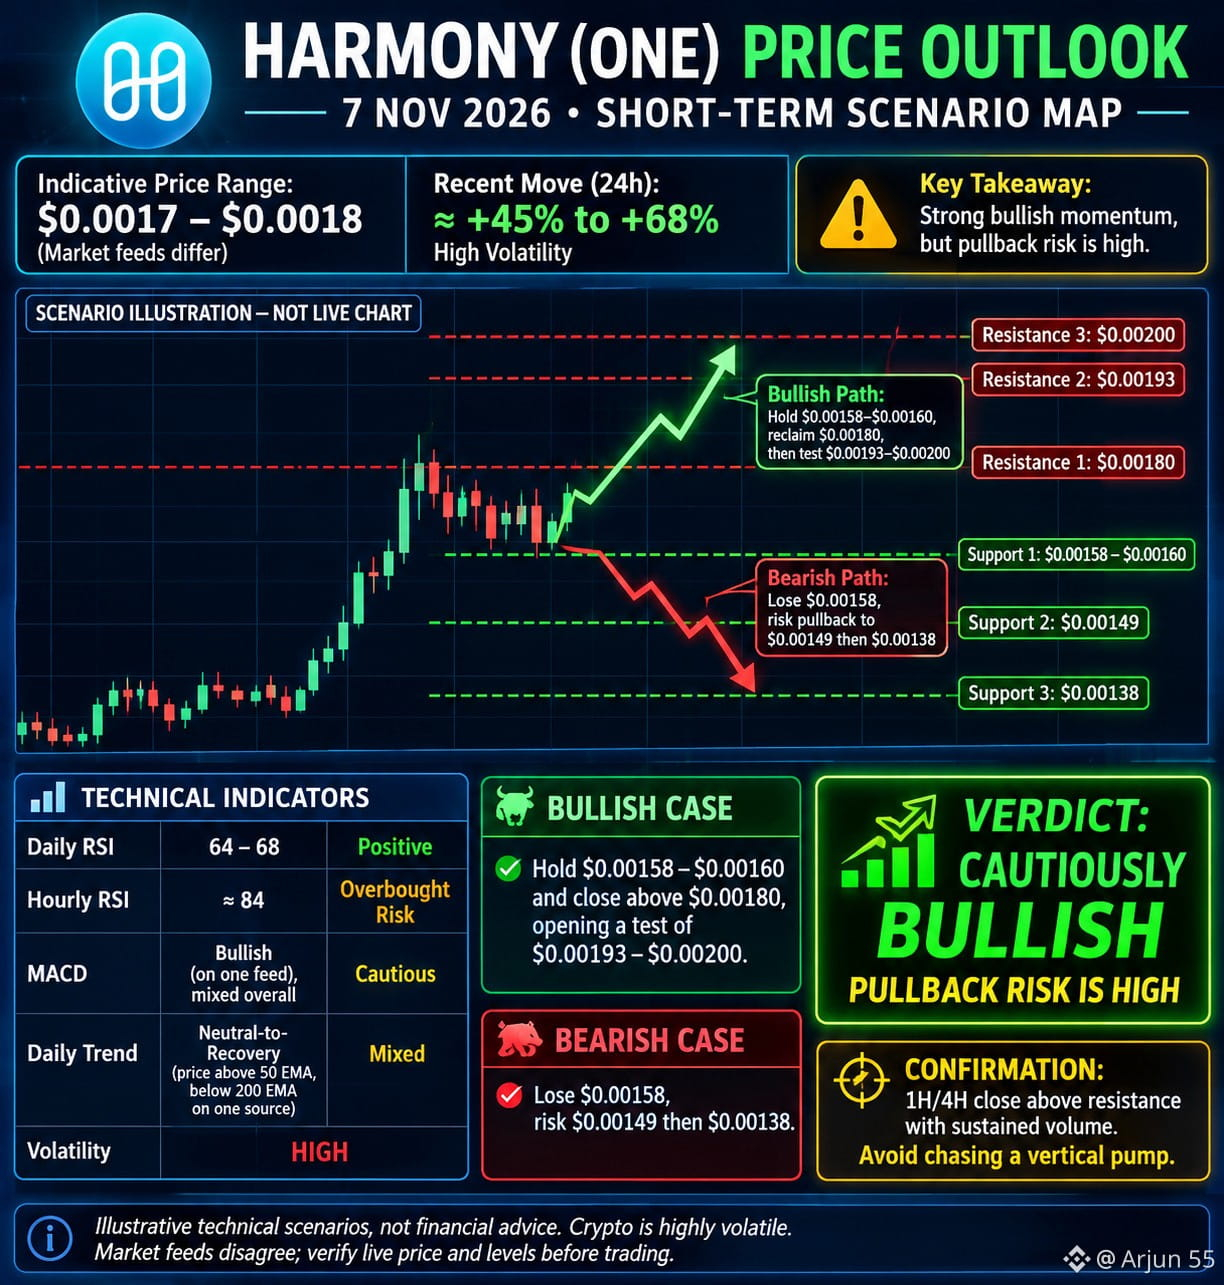
$ONE Harmony (ONE) — Technical Analysis
Harmony (ONE)
$0.001712
Approximately +56.59% in 24 hours
Recent movement
Strong price breakout.
Trading volume surged significantly.
Buyers currently have short-term control.
Price remains highly volatile.
Technical indicators
Indicator Reading Signal
RSI (daily) 63.84 Bullish
RSI (hourly) 83.99 Overbought
MACD Bullish Buy
ADX (hourly) 51.51 Strong trend
Important price levels
Level USD
Support $0.00175
Lower support $0.00169
Resistance $0.00188
Next resistance $0.00190–0.00201
My prediction
Next few hours: Possible upward continuation, but correction risk is high.
Next 24 hours: Bullish if price holds above $0.00175.
Break above $0.00190: Could open further upside.
Fall below $0.00169: Bearish warning.
Final verdict: UP bias, but avoid chasing the sudden pump. Wait for confirmation or a pullback.
#one #QNTB #ACT #CPIWatch #USJobData
{spot}(ONEUSDT)
{spot}(QNTBUSDT)
{spot}(ACTUSDT)
$ONE Harmony (ONE) — Technical Analysis
Harmony (ONE)
$0.001712
Approximately +56.59% in 24 hours
Recent movement
Strong price breakout.
Trading volume surged significantly.
Buyers currently have short-term control.
Price remains highly volatile.
Technical indicators
Indicator Reading Signal
RSI (daily) 63.84 Bullish
RSI (hourly) 83.99 Overbought
MACD Bullish Buy
ADX (hourly) 51.51 Strong trend
Important price levels
Level USD
Support $0.00175
Lower support $0.00169
Resistance $0.00188
Next resistance $0.00190–0.00201
My prediction
Next few hours: Possible upward continuation, but correction risk is high.
Next 24 hours: Bullish if price holds above $0.00175.
Break above $0.00190: Could open further upside.
Fall below $0.00169: Bearish warning.
Final verdict: UP bias, but avoid chasing the sudden pump. Wait for confirmation or a pullback.
#one #QNTB #ACT #CPIWatch #USJobData
Harmony (ONE)
$0.001712
Approximately +56.59% in 24 hours
Recent movement
Strong price breakout.
Trading volume surged significantly.
Buyers currently have short-term control.
Price remains highly volatile.
Technical indicators
Indicator Reading Signal
RSI (daily) 63.84 Bullish
RSI (hourly) 83.99 Overbought
MACD Bullish Buy
ADX (hourly) 51.51 Strong trend
Important price levels
Level USD
Support $0.00175
Lower support $0.00169
Resistance $0.00188
Next resistance $0.00190–0.00201
My prediction
Next few hours: Possible upward continuation, but correction risk is high.
Next 24 hours: Bullish if price holds above $0.00175.
Break above $0.00190: Could open further upside.
Fall below $0.00169: Bearish warning.
Final verdict: UP bias, but avoid chasing the sudden pump. Wait for confirmation or a pullback.
#one #QNTB #ACT #CPIWatch #USJobData
193
·
--
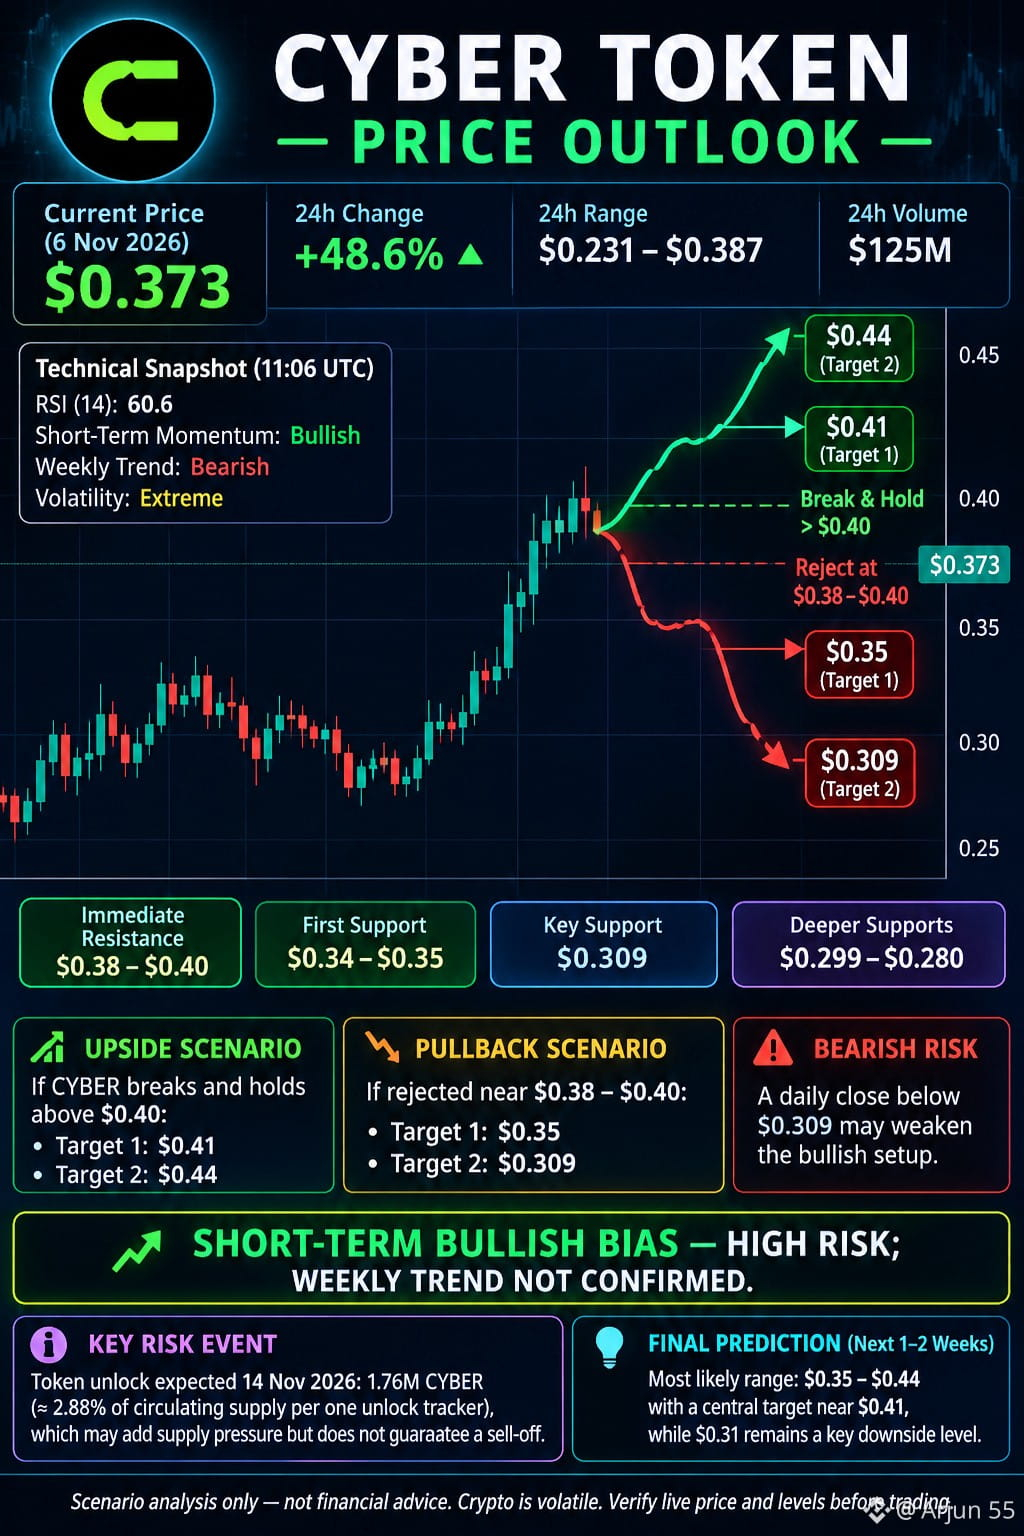
$CYBER CYBER Token – Recent Analysis & Future Prediction
$0.373
Cyber (CYBER) · Approximate market price, 6 November 2026
Recent movement
CYBER has experienced a very strong rally, rising approximately 49.6% in 24 hours.
Price recovered from around $0.23 to $0.37.
Trading volume increased sharply, indicating strong market activity.
The project is developing its AI and blockchain infrastructure narrative.
Technical analysis
Indicator Price
Immediate resistance $0.40
Next resistance $0.42–0.45
First support $0.35
Strong support $0.31
Major support $0.28
Technical indicators show bullish short-term momentum, but weekly trend remains bearish.
Future prediction
Scenario Possible movement
Bullish $0.40–$0.45
Strong bullish breakout $0.48–$0.50
Normal correction $0.31–$0.35
Bearish breakdown Below $0.28
My assessment:
Next 1–3 days: Upside possible, but profit booking is likely after such a sharp rally.
Next 1–2 weeks: Direction depends on whether CYBER can sustain above $0.35 and break $0.40.
Token unlocks and leveraged trading increase volatility.
Final prediction
I favour a bullish continuation only if price holds above $0.35 and breaks $0.40 convincingly. Otherwise, a correction toward $0.31–$0.35 is possible.
#CYBER #one #movr #CPIWatch #USJobData
{spot}(CYBERUSDT)
{spot}(ONEUSDT)
{spot}(MOVRUSDT)
$CYBER CYBER Token – Recent Analysis & Future Prediction
$0.373
Cyber (CYBER) · Approximate market price, 6 November 2026
Recent movement
CYBER has experienced a very strong rally, rising approximately 49.6% in 24 hours.
Price recovered from around $0.23 to $0.37.
Trading volume increased sharply, indicating strong market activity.
The project is developing its AI and blockchain infrastructure narrative.
Technical analysis
Indicator Price
Immediate resistance $0.40
Next resistance $0.42–0.45
First support $0.35
Strong support $0.31
Major support $0.28
Technical indicators show bullish short-term momentum, but weekly trend remains bearish.
Future prediction
Scenario Possible movement
Bullish $0.40–$0.45
Strong bullish breakout $0.48–$0.50
Normal correction $0.31–$0.35
Bearish breakdown Below $0.28
My assessment:
Next 1–3 days: Upside possible, but profit booking is likely after such a sharp rally.
Next 1–2 weeks: Direction depends on whether CYBER can sustain above $0.35 and break $0.40.
Token unlocks and leveraged trading increase volatility.
Final prediction
I favour a bullish continuation only if price holds above $0.35 and breaks $0.40 convincingly. Otherwise, a correction toward $0.31–$0.35 is possible.
#CYBER #one #movr #CPIWatch #USJobData
$0.373
Cyber (CYBER) · Approximate market price, 6 November 2026
Recent movement
CYBER has experienced a very strong rally, rising approximately 49.6% in 24 hours.
Price recovered from around $0.23 to $0.37.
Trading volume increased sharply, indicating strong market activity.
The project is developing its AI and blockchain infrastructure narrative.
Technical analysis
Indicator Price
Immediate resistance $0.40
Next resistance $0.42–0.45
First support $0.35
Strong support $0.31
Major support $0.28
Technical indicators show bullish short-term momentum, but weekly trend remains bearish.
Future prediction
Scenario Possible movement
Bullish $0.40–$0.45
Strong bullish breakout $0.48–$0.50
Normal correction $0.31–$0.35
Bearish breakdown Below $0.28
My assessment:
Next 1–3 days: Upside possible, but profit booking is likely after such a sharp rally.
Next 1–2 weeks: Direction depends on whether CYBER can sustain above $0.35 and break $0.40.
Token unlocks and leveraged trading increase volatility.
Final prediction
I favour a bullish continuation only if price holds above $0.35 and breaks $0.40 convincingly. Otherwise, a correction toward $0.31–$0.35 is possible.
#CYBER #one #movr #CPIWatch #USJobData
84
·
--
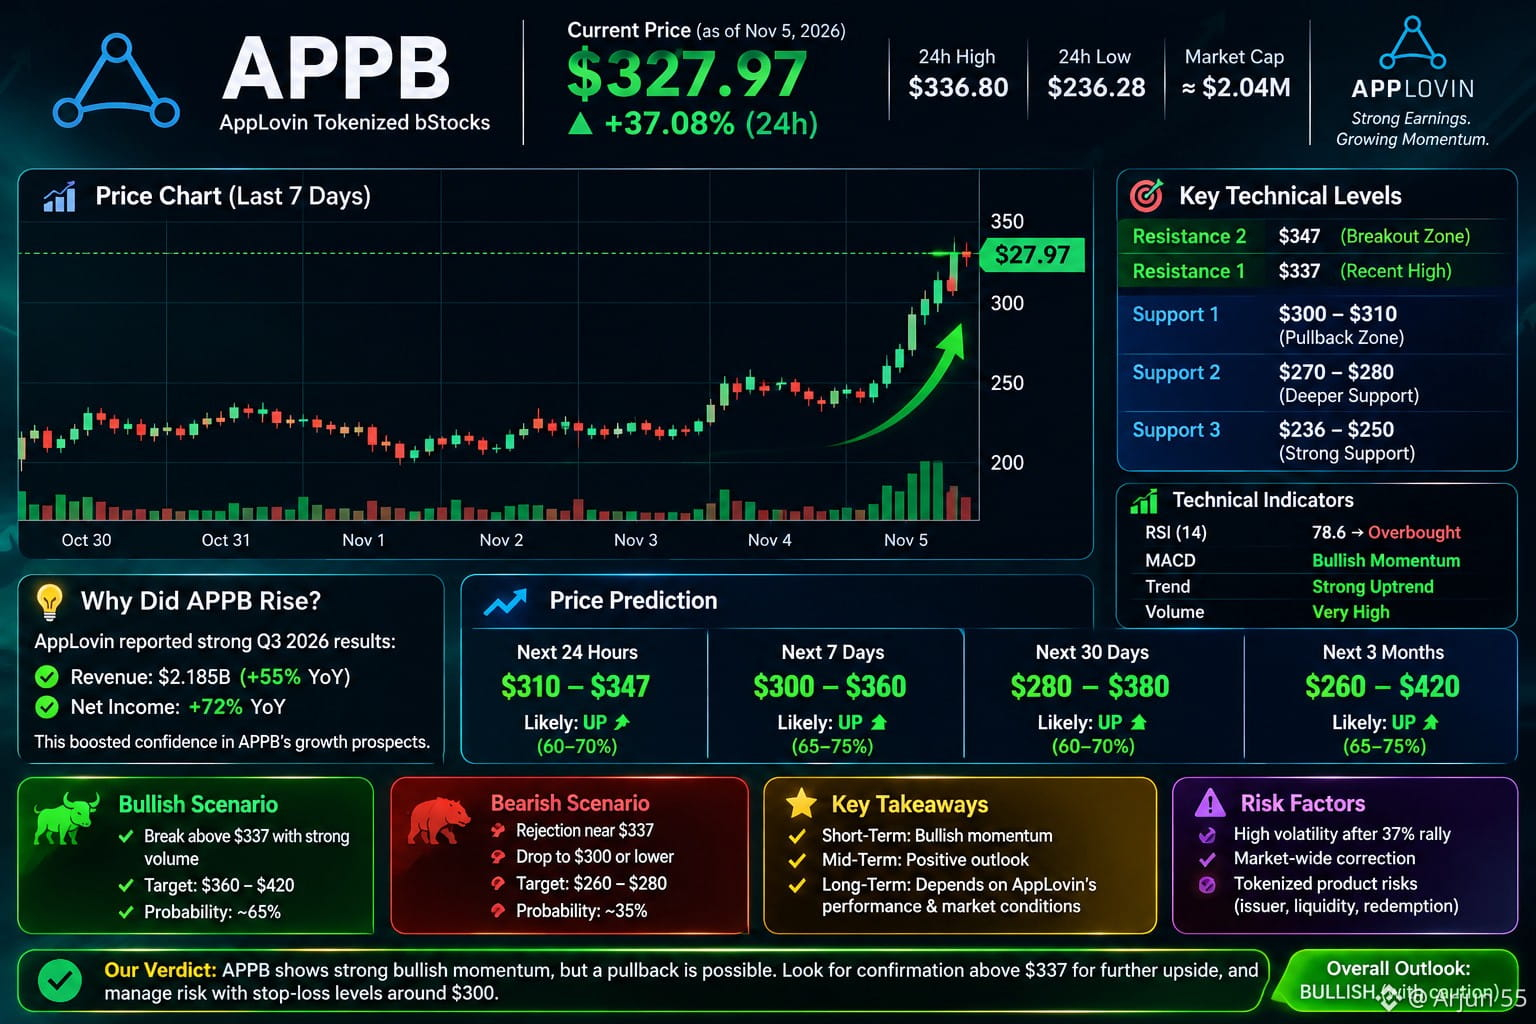
$APPB APP B (AppLovin Tokenized b Stocks) – Analysis
As of 5 November 2026, APP B is showing a major price movement.
Recent market movement reported price
$327.97
24h high: $336.80
24h low: $236.28 · Market cap: approximately $2.04 million
Source:
Important: Other price trackers are reporting approximately $226–$327. This is a substantial discrepancy. Confirm the APP B/USDT exchange price before trading.
Why did APP B rise
AppLovin announced strong Q3 2026 results on November 4:
Revenue: $2.185 billion.
Revenue growth: 55% year over year.
Net income growth: 72% year over year.
These are positive fundamental signals for the underlying company.
Technical levels to watch
Based on the reported trading range:
Level APP B price (USD) Importance
Resistance 2 $347 Breakout zone
Resistance 1 $337 Recent high
Support 1 $300–310 Potential pullback zone
Support 2 $270–280 Deeper correction zone
Support 3 $236–250 Recent lower range
These are provisional price zones, not confirmed technical support levels.
Future prediction
Next 24–48 hours
Bullish scenario
Holds above $310 and breaks $337 with strong volume.
Correction scenario
Rejection near $337 could lead to profit-taking toward $300 or lower.
Next 7–30 days
Direction depends on App Lovin's underlying stock performance, earnings momentum and APP B market liquidity.
My assessment: Bullish underlying fundamentals, but chasing a 37% rally is risky. I would wait for price consolidation and confirmation rather than buy immediately.
#APPB #fogo #SOXSB #CPIWatch #USJobData
{spot}(APPBUSDT)
{spot}(FOGOUSDT)
{spot}(SOXSBUSDT)
$APPB APP B (AppLovin Tokenized b Stocks) – Analysis
As of 5 November 2026, APP B is showing a major price movement.
Recent market movement reported price
$327.97
24h high: $336.80
24h low: $236.28 · Market cap: approximately $2.04 million
Source:
Important: Other price trackers are reporting approximately $226–$327. This is a substantial discrepancy. Confirm the APP B/USDT exchange price before trading.
Why did APP B rise
AppLovin announced strong Q3 2026 results on November 4:
Revenue: $2.185 billion.
Revenue growth: 55% year over year.
Net income growth: 72% year over year.
These are positive fundamental signals for the underlying company.
Technical levels to watch
Based on the reported trading range:
Level APP B price (USD) Importance
Resistance 2 $347 Breakout zone
Resistance 1 $337 Recent high
Support 1 $300–310 Potential pullback zone
Support 2 $270–280 Deeper correction zone
Support 3 $236–250 Recent lower range
These are provisional price zones, not confirmed technical support levels.
Future prediction
Next 24–48 hours
Bullish scenario
Holds above $310 and breaks $337 with strong volume.
Correction scenario
Rejection near $337 could lead to profit-taking toward $300 or lower.
Next 7–30 days
Direction depends on App Lovin's underlying stock performance, earnings momentum and APP B market liquidity.
My assessment: Bullish underlying fundamentals, but chasing a 37% rally is risky. I would wait for price consolidation and confirmation rather than buy immediately.
#APPB #fogo #SOXSB #CPIWatch #USJobData
As of 5 November 2026, APP B is showing a major price movement.
Recent market movement reported price
$327.97
24h high: $336.80
24h low: $236.28 · Market cap: approximately $2.04 million
Source:
Important: Other price trackers are reporting approximately $226–$327. This is a substantial discrepancy. Confirm the APP B/USDT exchange price before trading.
Why did APP B rise
AppLovin announced strong Q3 2026 results on November 4:
Revenue: $2.185 billion.
Revenue growth: 55% year over year.
Net income growth: 72% year over year.
These are positive fundamental signals for the underlying company.
Technical levels to watch
Based on the reported trading range:
Level APP B price (USD) Importance
Resistance 2 $347 Breakout zone
Resistance 1 $337 Recent high
Support 1 $300–310 Potential pullback zone
Support 2 $270–280 Deeper correction zone
Support 3 $236–250 Recent lower range
These are provisional price zones, not confirmed technical support levels.
Future prediction
Next 24–48 hours
Bullish scenario
Holds above $310 and breaks $337 with strong volume.
Correction scenario
Rejection near $337 could lead to profit-taking toward $300 or lower.
Next 7–30 days
Direction depends on App Lovin's underlying stock performance, earnings momentum and APP B market liquidity.
My assessment: Bullish underlying fundamentals, but chasing a 37% rally is risky. I would wait for price consolidation and confirmation rather than buy immediately.
#APPB #fogo #SOXSB #CPIWatch #USJobData
322
·
--
Проверено
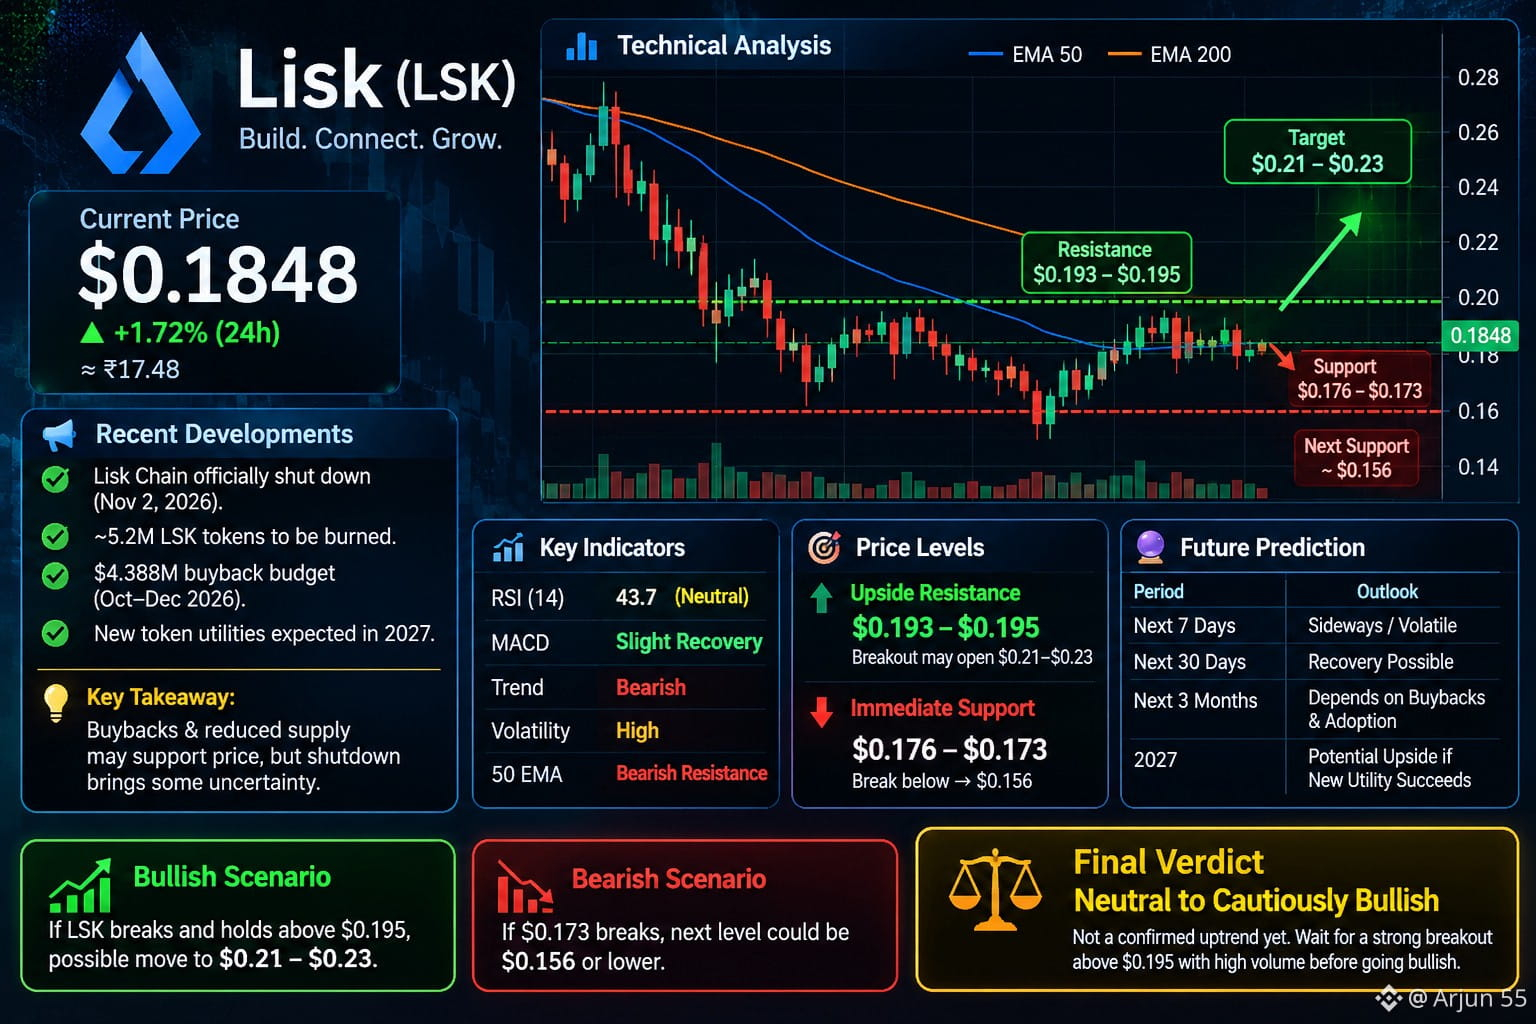
$LSK Lisk has shifted its focus from blockchain infrastructure to business finance services.
Its old Lisk Chain officially shut down on November 2, 2026.
Approximately 5.2 million LSK tokens are planned to be burned.
Lisk has announced a $4.388 million buyback budget for October–December 2026.
New token utilities are expected from 2027.
My interpretation: Buybacks and reduced supply could support the price, but the shutdown also creates uncertainty about future demand.
Technical analysis
Indicator Current indication
RSI 43.7 – neutral
Overall trend Bearish
MACD Slight recovery
Volatility High
50 EMA Bearish resistance
3. Important price levels
Upside resistance
$0.193 – $0.195
A sustained breakout could open the way toward $0.21–$0.23.
Immediate support
$0.176 – $0.173
If this breaks, the next downside level is around $0.156.
Technical levels are approximate and may change with market conditions.
4. My future prediction
These are scenario estimates, not guaranteed targets.Period My outlook
Next 7 days Sideways / volatile
Next 30 days Recovery possible
Next 3 months Depends on buybacks and adoption
2027 Potential upside if new utility succeeds
Bullish scenario: Break and hold above $0.195, then possible $0.21–$0.23.
Bearish scenario: Lose $0.173, then possible $0.156 or lower.
5. Final verdict
I would not call LSK a confirmed uptrend yet. The project has potentially positive tokenomics, but its technical trend remains weak.
I would wait for a confirmed breakout above $0.195 with strong trading volume before considering a bullish reversal.
#LSK #SXTUSDT #zec #CPIWatch #USJobData
{spot}(LSKUSDT)
{spot}(SXTUSDT)
{spot}(ZECUSDT)
$LSK Lisk has shifted its focus from blockchain infrastructure to business finance services.
Its old Lisk Chain officially shut down on November 2, 2026.
Approximately 5.2 million LSK tokens are planned to be burned.
Lisk has announced a $4.388 million buyback budget for October–December 2026.
New token utilities are expected from 2027.
My interpretation: Buybacks and reduced supply could support the price, but the shutdown also creates uncertainty about future demand.
Technical analysis
Indicator Current indication
RSI 43.7 – neutral
Overall trend Bearish
MACD Slight recovery
Volatility High
50 EMA Bearish resistance
3. Important price levels
Upside resistance
$0.193 – $0.195
A sustained breakout could open the way toward $0.21–$0.23.
Immediate support
$0.176 – $0.173
If this breaks, the next downside level is around $0.156.
Technical levels are approximate and may change with market conditions.
4. My future prediction
These are scenario estimates, not guaranteed targets.Period My outlook
Next 7 days Sideways / volatile
Next 30 days Recovery possible
Next 3 months Depends on buybacks and adoption
2027 Potential upside if new utility succeeds
Bullish scenario: Break and hold above $0.195, then possible $0.21–$0.23.
Bearish scenario: Lose $0.173, then possible $0.156 or lower.
5. Final verdict
I would not call LSK a confirmed uptrend yet. The project has potentially positive tokenomics, but its technical trend remains weak.
I would wait for a confirmed breakout above $0.195 with strong trading volume before considering a bullish reversal.
#LSK #SXTUSDT #zec #CPIWatch #USJobData
Its old Lisk Chain officially shut down on November 2, 2026.
Approximately 5.2 million LSK tokens are planned to be burned.
Lisk has announced a $4.388 million buyback budget for October–December 2026.
New token utilities are expected from 2027.
My interpretation: Buybacks and reduced supply could support the price, but the shutdown also creates uncertainty about future demand.
Technical analysis
Indicator Current indication
RSI 43.7 – neutral
Overall trend Bearish
MACD Slight recovery
Volatility High
50 EMA Bearish resistance
3. Important price levels
Upside resistance
$0.193 – $0.195
A sustained breakout could open the way toward $0.21–$0.23.
Immediate support
$0.176 – $0.173
If this breaks, the next downside level is around $0.156.
Technical levels are approximate and may change with market conditions.
4. My future prediction
These are scenario estimates, not guaranteed targets.Period My outlook
Next 7 days Sideways / volatile
Next 30 days Recovery possible
Next 3 months Depends on buybacks and adoption
2027 Potential upside if new utility succeeds
Bullish scenario: Break and hold above $0.195, then possible $0.21–$0.23.
Bearish scenario: Lose $0.173, then possible $0.156 or lower.
5. Final verdict
I would not call LSK a confirmed uptrend yet. The project has potentially positive tokenomics, but its technical trend remains weak.
I would wait for a confirmed breakout above $0.195 with strong trading volume before considering a bullish reversal.
#LSK #SXTUSDT #zec #CPIWatch #USJobData
795
·
--
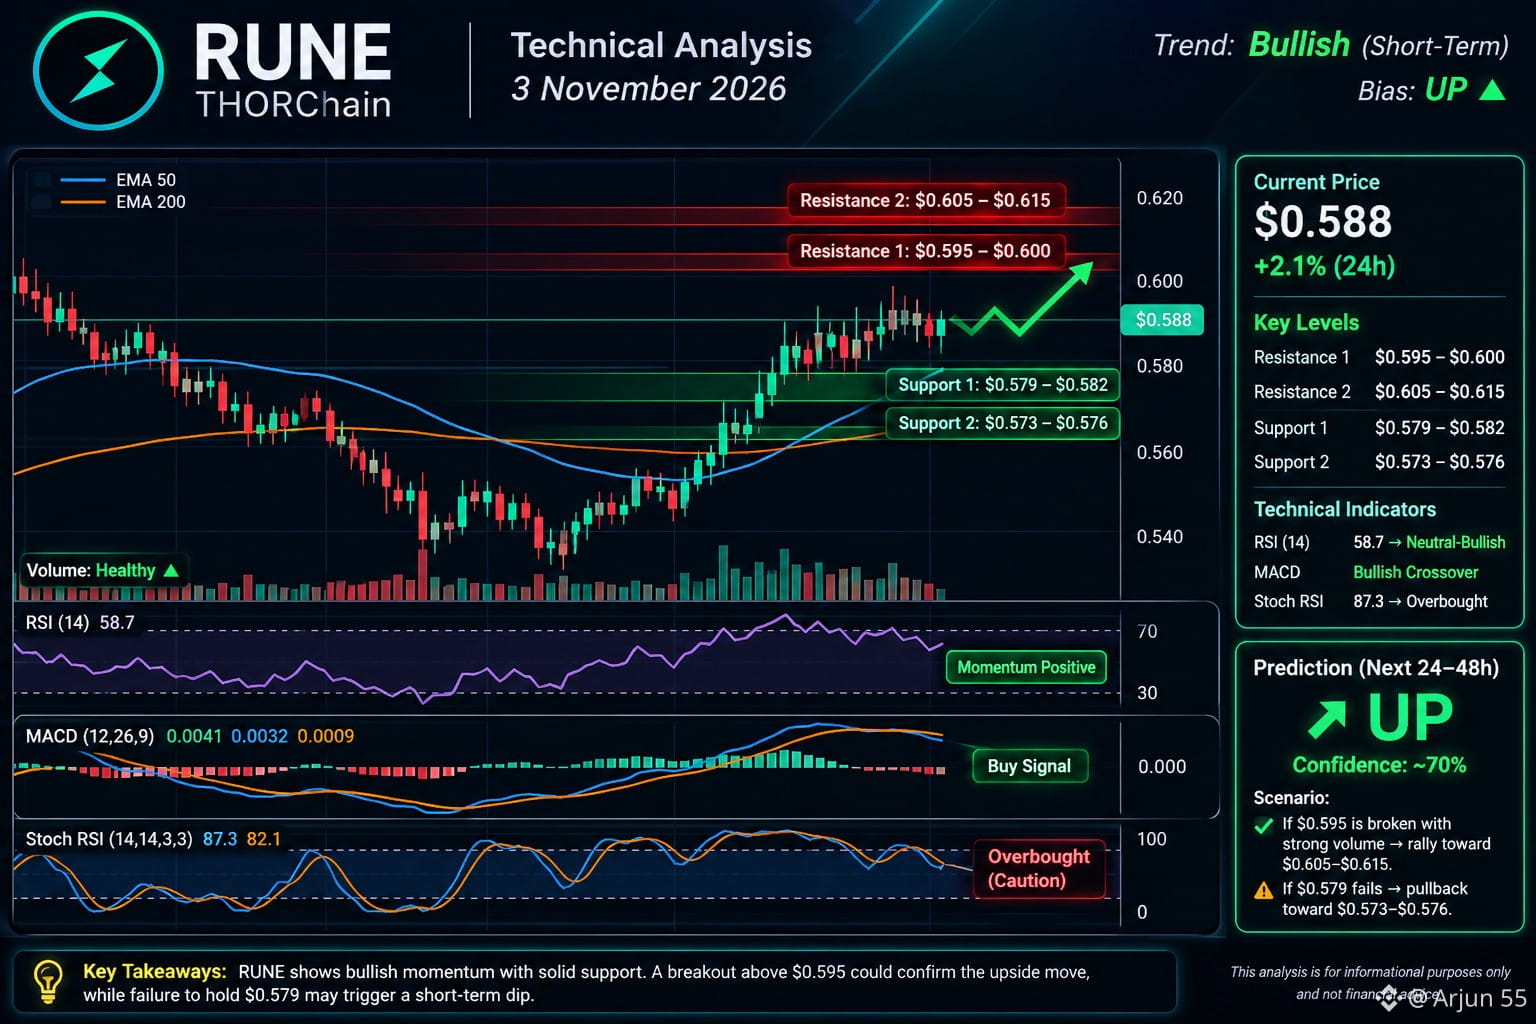
$RUNE RUNE (THOR Chain) — 3 November 2026
Current bias: Short-term BULLISH, but confirmation is needed.
Recent movement: RSI is 58 and MACD signals a buy, suggesting positive momentum.
Support: $0.573–$0.579 pivot zone.
Resistance: $0.589, then $0.595–$0.605.
Next 24–48 hours: UP bias if price breaks resistance with strong volume. Rejection could trigger a pullback toward support.
Risk: The short-term Stochastic RSI is overbought, so a correction is possible.
#Rune #BMT #HOT #CPIWatch #USJobData
{spot}(RUNEUSDT)
{spot}(BMTUSDT)
{spot}(HOTUSDT)
$RUNE RUNE (THOR Chain) — 3 November 2026
Current bias: Short-term BULLISH, but confirmation is needed.
Recent movement: RSI is 58 and MACD signals a buy, suggesting positive momentum.
Support: $0.573–$0.579 pivot zone.
Resistance: $0.589, then $0.595–$0.605.
Next 24–48 hours: UP bias if price breaks resistance with strong volume. Rejection could trigger a pullback toward support.
Risk: The short-term Stochastic RSI is overbought, so a correction is possible.
#Rune #BMT #HOT #CPIWatch #USJobData
Current bias: Short-term BULLISH, but confirmation is needed.
Recent movement: RSI is 58 and MACD signals a buy, suggesting positive momentum.
Support: $0.573–$0.579 pivot zone.
Resistance: $0.589, then $0.595–$0.605.
Next 24–48 hours: UP bias if price breaks resistance with strong volume. Rejection could trigger a pullback toward support.
Risk: The short-term Stochastic RSI is overbought, so a correction is possible.
#Rune #BMT #HOT #CPIWatch #USJobData
432
·
--
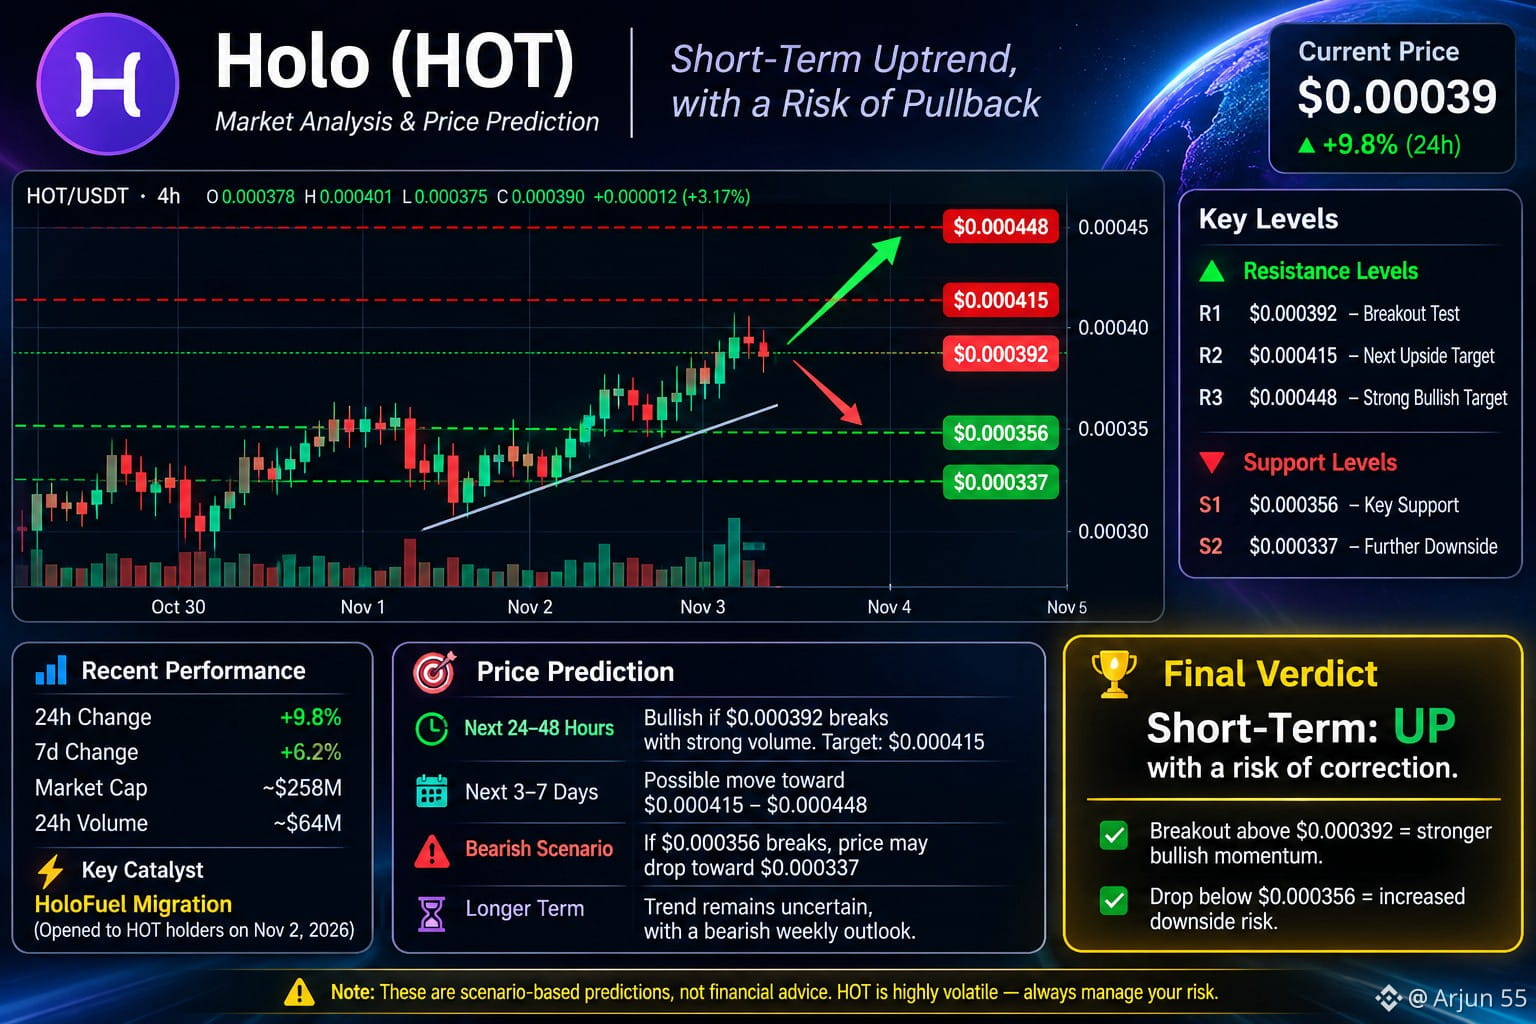
$HOT HOT Token (Holo) — Short-Term Price Prediction
My view: Short-term bullish, but a pullback is possible. Medium-term trend remains uncertain.
Recent performance
Current price: Approximately $0.00038–$0.00040.
Recent movement: HOT has risen around 8–10% over 24 hours, according to market data.
Main catalyst: Excitement around the Holo Fuel migration, which reportedly opened to HOT holders on November 2, 2026.
Risk: Traders may take profits after the recent rally.
Important support and resistance
Based on the latest technical analysis for November 2
Level
HOT price
Meaning
Resistance 1
$0.000392
Breakout test
Resistance 2
$0.000415
Next upside target
Resistance 3
$0.000448
Stronger bullish target
Support 1
$0.000356
Important support
Support 2
$0.000337
Further downside risk
Future prediction
Next 24–48 hours: Bullish if HOT breaks above $0.000392 with strong volume; $0.000415 becomes the next target.
Next 3–7 days: A move toward $0.000415–$0.000448 is possible if buying momentum continues.
Bearish scenario: If HOT falls below $0.000356, it could decline toward $0.000337.
Longer term: Uncertain. The weekly trend remains bearish despite short-term recovery.
Final verdict
My prediction: SHORT-TERM UP, with a risk of correction. A sustained breakout above $0.000392 would strengthen the bullish case, while a drop below $0.000356 would weaken it.
#HOT #HotTrends #mito #KORUB #CPIWatch
{spot}(HOTUSDT)
{spot}(MITOUSDT)
{spot}(KORUBUSDT)
$HOT HOT Token (Holo) — Short-Term Price Prediction
My view: Short-term bullish, but a pullback is possible. Medium-term trend remains uncertain.
Recent performance
Current price: Approximately $0.00038–$0.00040.
Recent movement: HOT has risen around 8–10% over 24 hours, according to market data.
Main catalyst: Excitement around the Holo Fuel migration, which reportedly opened to HOT holders on November 2, 2026.
Risk: Traders may take profits after the recent rally.
Important support and resistance
Based on the latest technical analysis for November 2
Level
HOT price
Meaning
Resistance 1
$0.000392
Breakout test
Resistance 2
$0.000415
Next upside target
Resistance 3
$0.000448
Stronger bullish target
Support 1
$0.000356
Important support
Support 2
$0.000337
Further downside risk
Future prediction
Next 24–48 hours: Bullish if HOT breaks above $0.000392 with strong volume; $0.000415 becomes the next target.
Next 3–7 days: A move toward $0.000415–$0.000448 is possible if buying momentum continues.
Bearish scenario: If HOT falls below $0.000356, it could decline toward $0.000337.
Longer term: Uncertain. The weekly trend remains bearish despite short-term recovery.
Final verdict
My prediction: SHORT-TERM UP, with a risk of correction. A sustained breakout above $0.000392 would strengthen the bullish case, while a drop below $0.000356 would weaken it.
#HOT #HotTrends #mito #KORUB #CPIWatch
My view: Short-term bullish, but a pullback is possible. Medium-term trend remains uncertain.
Recent performance
Current price: Approximately $0.00038–$0.00040.
Recent movement: HOT has risen around 8–10% over 24 hours, according to market data.
Main catalyst: Excitement around the Holo Fuel migration, which reportedly opened to HOT holders on November 2, 2026.
Risk: Traders may take profits after the recent rally.
Important support and resistance
Based on the latest technical analysis for November 2
Level
HOT price
Meaning
Resistance 1
$0.000392
Breakout test
Resistance 2
$0.000415
Next upside target
Resistance 3
$0.000448
Stronger bullish target
Support 1
$0.000356
Important support
Support 2
$0.000337
Further downside risk
Future prediction
Next 24–48 hours: Bullish if HOT breaks above $0.000392 with strong volume; $0.000415 becomes the next target.
Next 3–7 days: A move toward $0.000415–$0.000448 is possible if buying momentum continues.
Bearish scenario: If HOT falls below $0.000356, it could decline toward $0.000337.
Longer term: Uncertain. The weekly trend remains bearish despite short-term recovery.
Final verdict
My prediction: SHORT-TERM UP, with a risk of correction. A sustained breakout above $0.000392 would strengthen the bullish case, while a drop below $0.000356 would weaken it.
#HOT #HotTrends #mito #KORUB #CPIWatch
219
·
--
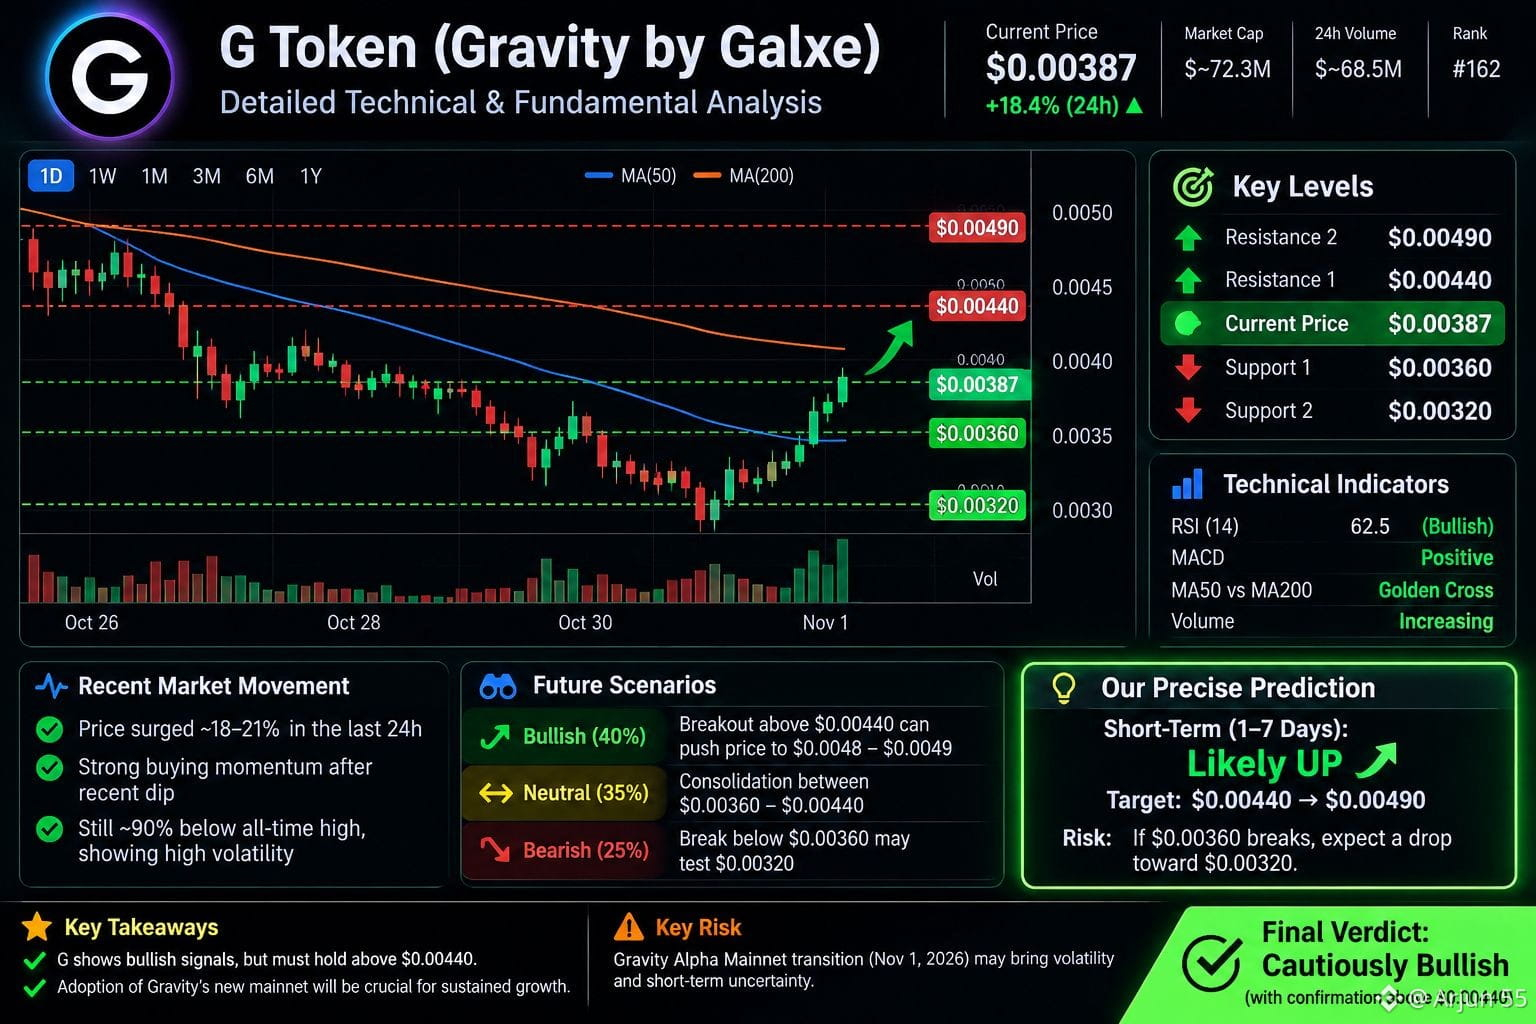
$G G Token (Gravity) — Recent Trend & Future Prediction
My preliminary view: Short-term bullish rebound, but high volatility and downside risk remain. A recent price increase alone does not confirm a sustained uptrend. The key is whether G breaks resistance and holds above it with strong trading volume.
Recent market movement
Current price: Approximately $0.0038–$0.0040, based on market data available on November 1, 2026.
Recent movement: G has rebounded sharply, with reported 24-hour gains of around 16–21% on some trackers.
Key concern: This rally could face profit-taking, particularly given G's substantial decline from its historical high. Prices also vary by exchange.
Technical levels to watch
Price level
Interpretation
$0.0043–$0.0044
Resistance; breakout could support further upside
$0.0048–$0.0049
Next potential upside target
$0.0036–$0.0037
Important area to monitor for support
$0.0032–$0.0033
Lower support zone if selling resumes
These are approximate analysis levels, not guaranteed price targets.
Future prediction
Short term (1–7 days):
Bullish scenario: A sustained break above $0.0044 with strong volume could open a move toward $0.0048–$0.0049.
Neutral scenario: Price consolidates between approximately $0.0036 and $0.0044.
Bearish scenario: A break below $0.0036 could expose the $0.0032 area.
Medium term (2–4 weeks): Direction depends on sustained buying, adoption of Gravity's new main net, and whether the recent rally holds. A continued recovery is possible, but a fresh decline cannot be ruled out.
Important fundamental risk
Gravity Alpha Main net is scheduled to stop operating on November 1, 2026. Gal xe s official notice says the native bridge and staking dashboard went offline on October 26. This transition creates risks for holders whose assets remain on the old network. Verify your token's network before making transfers.
#Gravity #INIT #zro #CPIWatch #USJobData
{future}(GUSDT)
{spot}(INITUSDT)
{spot}(ZROUSDT)
$G G Token (Gravity) — Recent Trend & Future Prediction
My preliminary view: Short-term bullish rebound, but high volatility and downside risk remain. A recent price increase alone does not confirm a sustained uptrend. The key is whether G breaks resistance and holds above it with strong trading volume.
Recent market movement
Current price: Approximately $0.0038–$0.0040, based on market data available on November 1, 2026.
Recent movement: G has rebounded sharply, with reported 24-hour gains of around 16–21% on some trackers.
Key concern: This rally could face profit-taking, particularly given G's substantial decline from its historical high. Prices also vary by exchange.
Technical levels to watch
Price level
Interpretation
$0.0043–$0.0044
Resistance; breakout could support further upside
$0.0048–$0.0049
Next potential upside target
$0.0036–$0.0037
Important area to monitor for support
$0.0032–$0.0033
Lower support zone if selling resumes
These are approximate analysis levels, not guaranteed price targets.
Future prediction
Short term (1–7 days):
Bullish scenario: A sustained break above $0.0044 with strong volume could open a move toward $0.0048–$0.0049.
Neutral scenario: Price consolidates between approximately $0.0036 and $0.0044.
Bearish scenario: A break below $0.0036 could expose the $0.0032 area.
Medium term (2–4 weeks): Direction depends on sustained buying, adoption of Gravity's new main net, and whether the recent rally holds. A continued recovery is possible, but a fresh decline cannot be ruled out.
Important fundamental risk
Gravity Alpha Main net is scheduled to stop operating on November 1, 2026. Gal xe s official notice says the native bridge and staking dashboard went offline on October 26. This transition creates risks for holders whose assets remain on the old network. Verify your token's network before making transfers.
#Gravity #INIT #zro #CPIWatch #USJobData
My preliminary view: Short-term bullish rebound, but high volatility and downside risk remain. A recent price increase alone does not confirm a sustained uptrend. The key is whether G breaks resistance and holds above it with strong trading volume.
Recent market movement
Current price: Approximately $0.0038–$0.0040, based on market data available on November 1, 2026.
Recent movement: G has rebounded sharply, with reported 24-hour gains of around 16–21% on some trackers.
Key concern: This rally could face profit-taking, particularly given G's substantial decline from its historical high. Prices also vary by exchange.
Technical levels to watch
Price level
Interpretation
$0.0043–$0.0044
Resistance; breakout could support further upside
$0.0048–$0.0049
Next potential upside target
$0.0036–$0.0037
Important area to monitor for support
$0.0032–$0.0033
Lower support zone if selling resumes
These are approximate analysis levels, not guaranteed price targets.
Future prediction
Short term (1–7 days):
Bullish scenario: A sustained break above $0.0044 with strong volume could open a move toward $0.0048–$0.0049.
Neutral scenario: Price consolidates between approximately $0.0036 and $0.0044.
Bearish scenario: A break below $0.0036 could expose the $0.0032 area.
Medium term (2–4 weeks): Direction depends on sustained buying, adoption of Gravity's new main net, and whether the recent rally holds. A continued recovery is possible, but a fresh decline cannot be ruled out.
Important fundamental risk
Gravity Alpha Main net is scheduled to stop operating on November 1, 2026. Gal xe s official notice says the native bridge and staking dashboard went offline on October 26. This transition creates risks for holders whose assets remain on the old network. Verify your token's network before making transfers.
#Gravity #INIT #zro #CPIWatch #USJobData
405
·
--
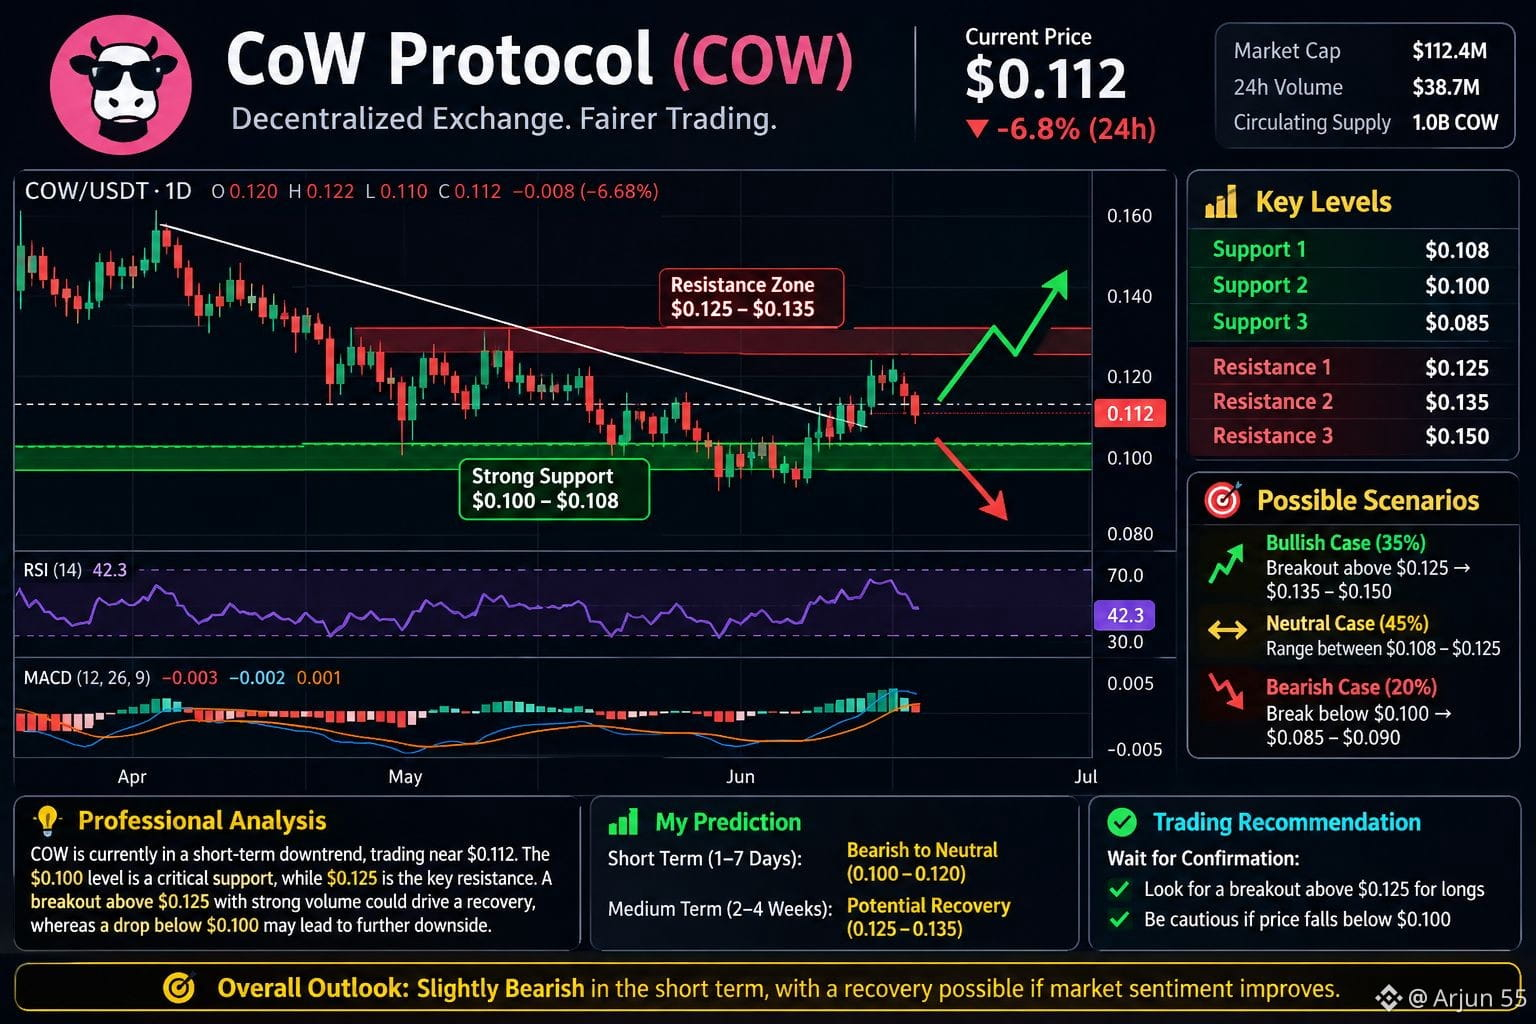
$COW CoW Protocol (COW) — Recent Analysis & Future Prediction
My view: Short-term bearish, with a possibility of a recovery bounce. COW has recently experienced strong selling pressure, so a bullish reversal needs confirmation before considering the trend upward.
What is COW
CoW Protocol (COW) is a crypto token associated with a decentralized trading protocol that aims to improve swap execution and protect users from certain forms of transaction manipulation. Its price is influenced by Bitcoin's direction, overall market sentiment, trading volume, and demand for the token.
Recent price movement
According to the latest available market data:
Current price: Approximately $0.11–$0.12 in recent reports.
Recent trend: Heavy selling pressure and sharp volatility.
Main reason: Broader crypto-market weakness and risk aversion.
Important support: $0.10–$0.108.
Resistance to watch: $0.12–$0.125.
Future prediction: Up or down?
Scenario
Possible movement
Confirmation
Bearish
$0.10, potentially $0.085–$0.09
Price breaks below $0.10
Sideways
$0.10–$0.12
Price holds support but fails to break resistance
Bullish
$0.125–$0.135
Strong volume and a sustained breakout above $0.125
These are conditional scenarios, not guaranteed price targets.
My final prediction
Short term (next 1–7 days): Bearish to neutral. Further downside remains possible, although a temporary rebound could occur.
Medium term (next 2–4 weeks): Recovery is possible if Bitcoin stabilizes, market sentiment improves, and COW breaks above resistance with strong volume.
My key levels to watch:
Below $0.10: Bearish pressure increases.
Above $0.125: Bullish recovery becomes more credible.
Between $0.10 and $0.125: Wait for a clearer direction.
#COW #LSK #Eden #CPIWatch #USJobData
{spot}(COWUSDT)
{spot}(LSKUSDT)
{spot}(EDENUSDT)
$COW CoW Protocol (COW) — Recent Analysis & Future Prediction
My view: Short-term bearish, with a possibility of a recovery bounce. COW has recently experienced strong selling pressure, so a bullish reversal needs confirmation before considering the trend upward.
What is COW
CoW Protocol (COW) is a crypto token associated with a decentralized trading protocol that aims to improve swap execution and protect users from certain forms of transaction manipulation. Its price is influenced by Bitcoin's direction, overall market sentiment, trading volume, and demand for the token.
Recent price movement
According to the latest available market data:
Current price: Approximately $0.11–$0.12 in recent reports.
Recent trend: Heavy selling pressure and sharp volatility.
Main reason: Broader crypto-market weakness and risk aversion.
Important support: $0.10–$0.108.
Resistance to watch: $0.12–$0.125.
Future prediction: Up or down?
Scenario
Possible movement
Confirmation
Bearish
$0.10, potentially $0.085–$0.09
Price breaks below $0.10
Sideways
$0.10–$0.12
Price holds support but fails to break resistance
Bullish
$0.125–$0.135
Strong volume and a sustained breakout above $0.125
These are conditional scenarios, not guaranteed price targets.
My final prediction
Short term (next 1–7 days): Bearish to neutral. Further downside remains possible, although a temporary rebound could occur.
Medium term (next 2–4 weeks): Recovery is possible if Bitcoin stabilizes, market sentiment improves, and COW breaks above resistance with strong volume.
My key levels to watch:
Below $0.10: Bearish pressure increases.
Above $0.125: Bullish recovery becomes more credible.
Between $0.10 and $0.125: Wait for a clearer direction.
#COW #LSK #Eden #CPIWatch #USJobData
My view: Short-term bearish, with a possibility of a recovery bounce. COW has recently experienced strong selling pressure, so a bullish reversal needs confirmation before considering the trend upward.
What is COW
CoW Protocol (COW) is a crypto token associated with a decentralized trading protocol that aims to improve swap execution and protect users from certain forms of transaction manipulation. Its price is influenced by Bitcoin's direction, overall market sentiment, trading volume, and demand for the token.
Recent price movement
According to the latest available market data:
Current price: Approximately $0.11–$0.12 in recent reports.
Recent trend: Heavy selling pressure and sharp volatility.
Main reason: Broader crypto-market weakness and risk aversion.
Important support: $0.10–$0.108.
Resistance to watch: $0.12–$0.125.
Future prediction: Up or down?
Scenario
Possible movement
Confirmation
Bearish
$0.10, potentially $0.085–$0.09
Price breaks below $0.10
Sideways
$0.10–$0.12
Price holds support but fails to break resistance
Bullish
$0.125–$0.135
Strong volume and a sustained breakout above $0.125
These are conditional scenarios, not guaranteed price targets.
My final prediction
Short term (next 1–7 days): Bearish to neutral. Further downside remains possible, although a temporary rebound could occur.
Medium term (next 2–4 weeks): Recovery is possible if Bitcoin stabilizes, market sentiment improves, and COW breaks above resistance with strong volume.
My key levels to watch:
Below $0.10: Bearish pressure increases.
Above $0.125: Bullish recovery becomes more credible.
Between $0.10 and $0.125: Wait for a clearer direction.
#COW #LSK #Eden #CPIWatch #USJobData
607
·
--
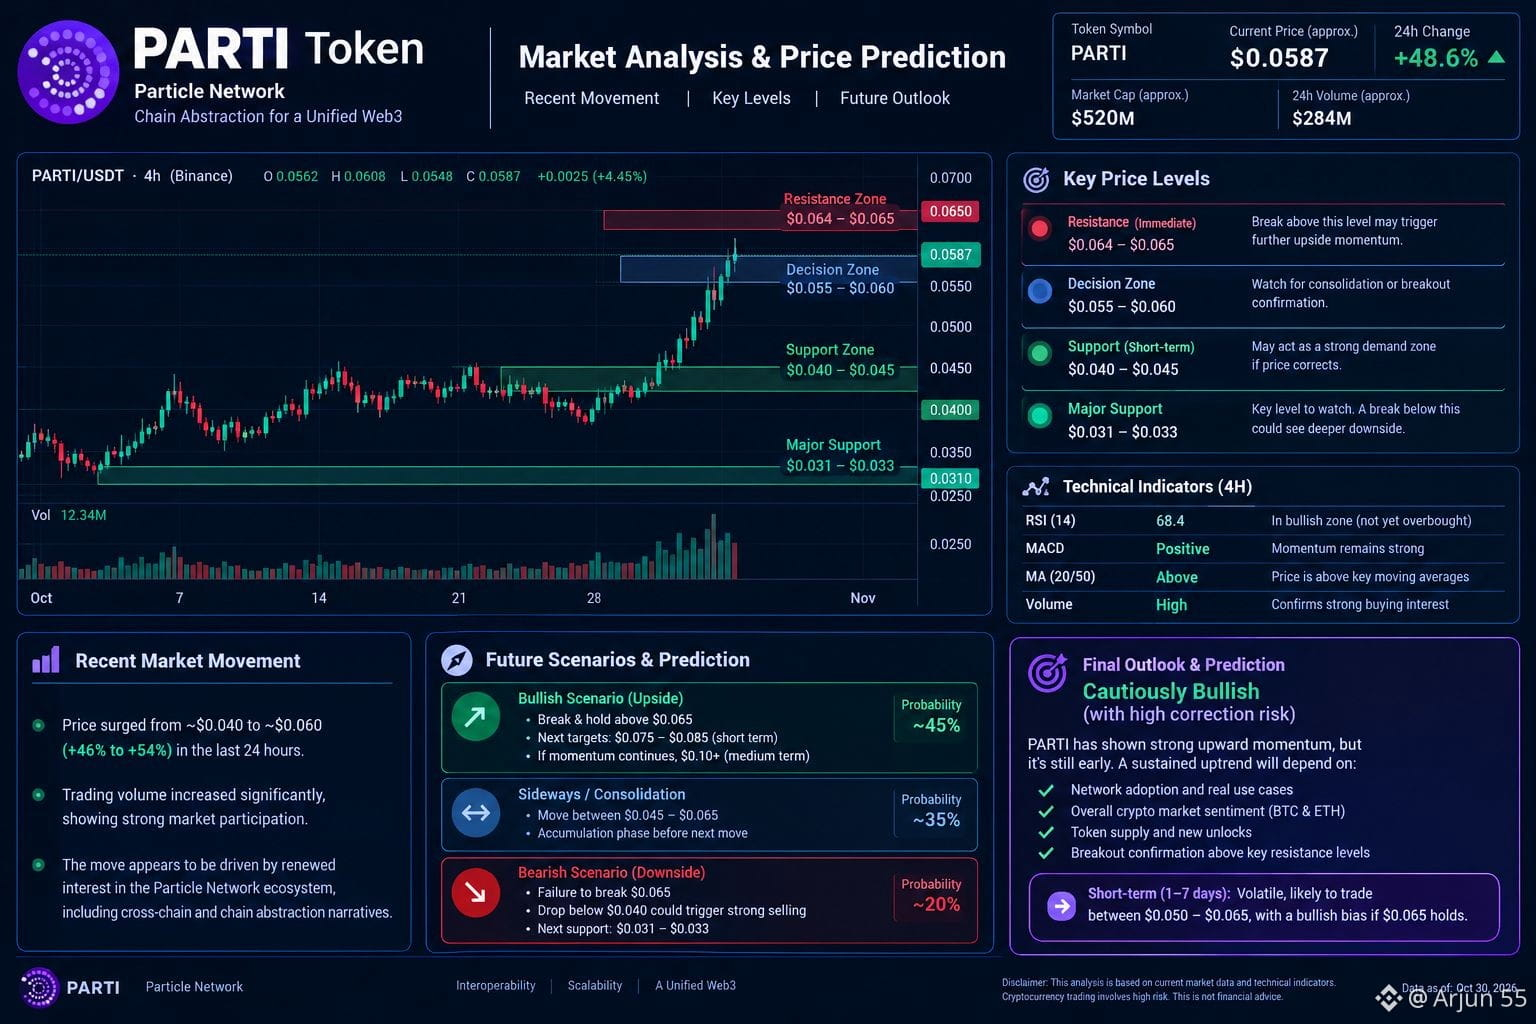
$PARTI PARTI Token — Recent Movement & Future Prediction
Token: Particle Network (PARTI)
Recent price movement
According to the latest market data available for October 30, 2026, PARTI has experienced a sharp price increase.
Recent price: Approximately $0.056–$0.060.
24-hour movement: Around +46% to +54%, depending on the data source and update time.
Trading volume: Elevated, suggesting strong market activity.
Risk: After such a rapid rally, profit-taking and a sharp correction are possible.
Important support and resistance levels
Based on the recent price range, these are the levels I would watch:
Price level
Significance
$0.064–$0.065
Immediate resistance
$0.055–$0.060
Short-term decision zone
$0.040–$0.045
Potential support
$0.031–$0.033
Major recent support zone
These are indicative levels, not confirmed support or resistance; the price is moving rapidly.
Future prediction: UP or DOWN?
Short-term outlook: Volatile; bullish continuation is possible, but a correction is also likely.
Bullish scenario: If PARTI breaks above $0.065 and holds that level, further upward movement may follow.
Bearish scenario: If it fails to break resistance and falls below $0.040, selling pressure could increase.
Medium-term outlook: Depends on actual network adoption, broader crypto market conditions, and token supply entering circulation.
My conclusion
Current bias: Cautiously bullish, with high correction risk.
PARTI's sharp rally indicates strong buying activity, but one day's price increase does not establish a sustained uptrend. Avoid chasing the price after a large pump without confirmation.
#PARTI #BEAMX #SOXSB #CPIWatch #USJobData
{spot}(PARTIUSDT)
{spot}(BEAMXUSDT)
{spot}(SOXSBUSDT)
$PARTI PARTI Token — Recent Movement & Future Prediction
Token: Particle Network (PARTI)
Recent price movement
According to the latest market data available for October 30, 2026, PARTI has experienced a sharp price increase.
Recent price: Approximately $0.056–$0.060.
24-hour movement: Around +46% to +54%, depending on the data source and update time.
Trading volume: Elevated, suggesting strong market activity.
Risk: After such a rapid rally, profit-taking and a sharp correction are possible.
Important support and resistance levels
Based on the recent price range, these are the levels I would watch:
Price level
Significance
$0.064–$0.065
Immediate resistance
$0.055–$0.060
Short-term decision zone
$0.040–$0.045
Potential support
$0.031–$0.033
Major recent support zone
These are indicative levels, not confirmed support or resistance; the price is moving rapidly.
Future prediction: UP or DOWN?
Short-term outlook: Volatile; bullish continuation is possible, but a correction is also likely.
Bullish scenario: If PARTI breaks above $0.065 and holds that level, further upward movement may follow.
Bearish scenario: If it fails to break resistance and falls below $0.040, selling pressure could increase.
Medium-term outlook: Depends on actual network adoption, broader crypto market conditions, and token supply entering circulation.
My conclusion
Current bias: Cautiously bullish, with high correction risk.
PARTI's sharp rally indicates strong buying activity, but one day's price increase does not establish a sustained uptrend. Avoid chasing the price after a large pump without confirmation.
#PARTI #BEAMX #SOXSB #CPIWatch #USJobData
Token: Particle Network (PARTI)
Recent price movement
According to the latest market data available for October 30, 2026, PARTI has experienced a sharp price increase.
Recent price: Approximately $0.056–$0.060.
24-hour movement: Around +46% to +54%, depending on the data source and update time.
Trading volume: Elevated, suggesting strong market activity.
Risk: After such a rapid rally, profit-taking and a sharp correction are possible.
Important support and resistance levels
Based on the recent price range, these are the levels I would watch:
Price level
Significance
$0.064–$0.065
Immediate resistance
$0.055–$0.060
Short-term decision zone
$0.040–$0.045
Potential support
$0.031–$0.033
Major recent support zone
These are indicative levels, not confirmed support or resistance; the price is moving rapidly.
Future prediction: UP or DOWN?
Short-term outlook: Volatile; bullish continuation is possible, but a correction is also likely.
Bullish scenario: If PARTI breaks above $0.065 and holds that level, further upward movement may follow.
Bearish scenario: If it fails to break resistance and falls below $0.040, selling pressure could increase.
Medium-term outlook: Depends on actual network adoption, broader crypto market conditions, and token supply entering circulation.
My conclusion
Current bias: Cautiously bullish, with high correction risk.
PARTI's sharp rally indicates strong buying activity, but one day's price increase does not establish a sustained uptrend. Avoid chasing the price after a large pump without confirmation.
#PARTI #BEAMX #SOXSB #CPIWatch #USJobData
287
·
--
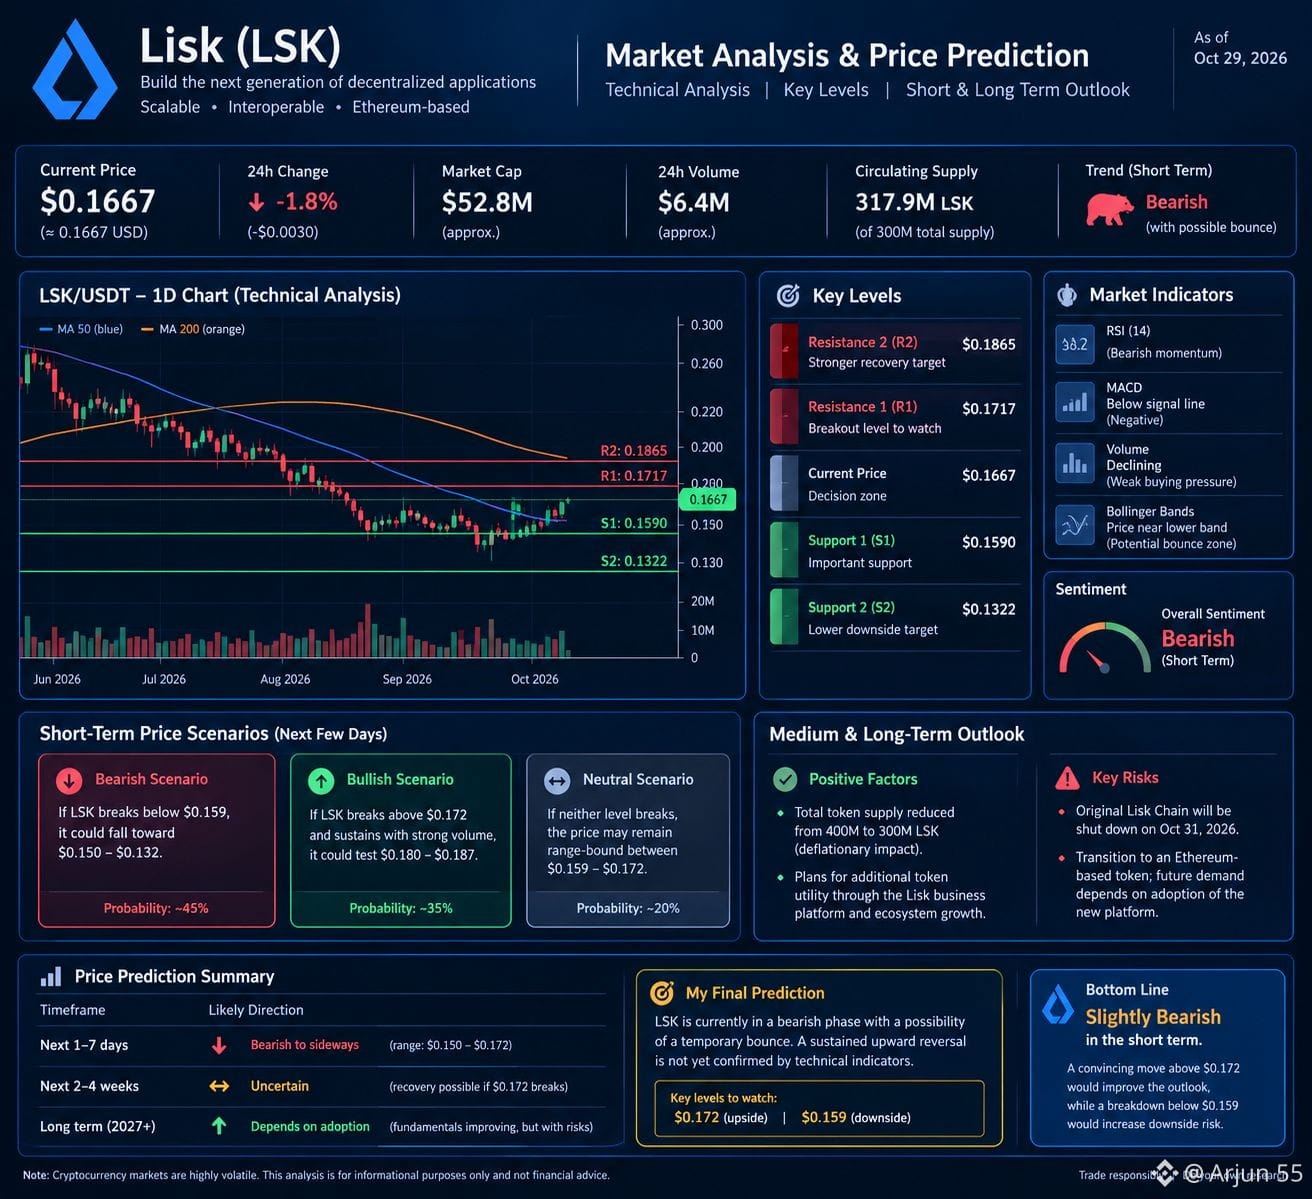
$LSK Lisk (LSK) Token: Recent Analysis & Future Prediction
My view: LSK is currently bearish in the short term, with a possibility of a temporary bounce. A sustained upward reversal is not yet confirmed by the technical indicators.
Recent market movement
As of October 29, 2026, available market analysis reports LSK trading around $0.166–$0.167.
Recent trend: Weak, with selling pressure.
Momentum: Bearish; the daily RSI is around 38, indicating weak momentum.
Market influence: Bitcoin's direction and broader crypto-market sentiment could influence LSK's next move.
Recent recovery: A bounce has occurred, but it does not yet establish a long-term uptrend.
Important support and resistance levels
Based on technical analysis published on October 29
Level
LSK price
Significance
Resistance 2
$0.1865
Stronger recovery target
Resistance 1
$0.1717
Breakout level to watch
Current price
~$0.167
Decision zone
Support 1
$0.1590
Important support
Support 2
$0.1322
Lower downside target
Future prediction: Up or down?
Short term (next few days)
Bearish scenario: If LSK breaks below $0.159, it could fall toward $0.150–$0.132.
Bullish scenario: If LSK breaks above $0.172 and sustains that level with strong volume, it could test $0.180–$0.187.
Neutral scenario: If neither level breaks, the price may remain range-bound.
These are conditional scenarios, not guaranteed price targets.
Medium to long term (2027 onward)
There are two important fundamental developments:
Positive: Lisk has reduced its total token supply from 400 million to 300 million LSK and plans to introduce additional token utility through its business platform.
Risk: The original Lisk Chain is scheduled to shut down on October 31, 2026. LSK is transitioning to an Ethereum-based token, and future demand will depend partly on adoption of the new platform.
My final prediction
Timeframe
Directional outlook
Next 1–7 days
Bearish to sideways
Next 2–4 weeks
Uncertain; recovery possible
#LSK #hype #CYPHB #CPIWatch #USJobData
{spot}(LSKUSDT)
{spot}(HYPEUSDT)
{spot}(CYPHBUSDT)
$LSK Lisk (LSK) Token: Recent Analysis & Future Prediction
My view: LSK is currently bearish in the short term, with a possibility of a temporary bounce. A sustained upward reversal is not yet confirmed by the technical indicators.
Recent market movement
As of October 29, 2026, available market analysis reports LSK trading around $0.166–$0.167.
Recent trend: Weak, with selling pressure.
Momentum: Bearish; the daily RSI is around 38, indicating weak momentum.
Market influence: Bitcoin's direction and broader crypto-market sentiment could influence LSK's next move.
Recent recovery: A bounce has occurred, but it does not yet establish a long-term uptrend.
Important support and resistance levels
Based on technical analysis published on October 29
Level
LSK price
Significance
Resistance 2
$0.1865
Stronger recovery target
Resistance 1
$0.1717
Breakout level to watch
Current price
~$0.167
Decision zone
Support 1
$0.1590
Important support
Support 2
$0.1322
Lower downside target
Future prediction: Up or down?
Short term (next few days)
Bearish scenario: If LSK breaks below $0.159, it could fall toward $0.150–$0.132.
Bullish scenario: If LSK breaks above $0.172 and sustains that level with strong volume, it could test $0.180–$0.187.
Neutral scenario: If neither level breaks, the price may remain range-bound.
These are conditional scenarios, not guaranteed price targets.
Medium to long term (2027 onward)
There are two important fundamental developments:
Positive: Lisk has reduced its total token supply from 400 million to 300 million LSK and plans to introduce additional token utility through its business platform.
Risk: The original Lisk Chain is scheduled to shut down on October 31, 2026. LSK is transitioning to an Ethereum-based token, and future demand will depend partly on adoption of the new platform.
My final prediction
Timeframe
Directional outlook
Next 1–7 days
Bearish to sideways
Next 2–4 weeks
Uncertain; recovery possible
#LSK #hype #CYPHB #CPIWatch #USJobData
My view: LSK is currently bearish in the short term, with a possibility of a temporary bounce. A sustained upward reversal is not yet confirmed by the technical indicators.
Recent market movement
As of October 29, 2026, available market analysis reports LSK trading around $0.166–$0.167.
Recent trend: Weak, with selling pressure.
Momentum: Bearish; the daily RSI is around 38, indicating weak momentum.
Market influence: Bitcoin's direction and broader crypto-market sentiment could influence LSK's next move.
Recent recovery: A bounce has occurred, but it does not yet establish a long-term uptrend.
Important support and resistance levels
Based on technical analysis published on October 29
Level
LSK price
Significance
Resistance 2
$0.1865
Stronger recovery target
Resistance 1
$0.1717
Breakout level to watch
Current price
~$0.167
Decision zone
Support 1
$0.1590
Important support
Support 2
$0.1322
Lower downside target
Future prediction: Up or down?
Short term (next few days)
Bearish scenario: If LSK breaks below $0.159, it could fall toward $0.150–$0.132.
Bullish scenario: If LSK breaks above $0.172 and sustains that level with strong volume, it could test $0.180–$0.187.
Neutral scenario: If neither level breaks, the price may remain range-bound.
These are conditional scenarios, not guaranteed price targets.
Medium to long term (2027 onward)
There are two important fundamental developments:
Positive: Lisk has reduced its total token supply from 400 million to 300 million LSK and plans to introduce additional token utility through its business platform.
Risk: The original Lisk Chain is scheduled to shut down on October 31, 2026. LSK is transitioning to an Ethereum-based token, and future demand will depend partly on adoption of the new platform.
My final prediction
Timeframe
Directional outlook
Next 1–7 days
Bearish to sideways
Next 2–4 weeks
Uncertain; recovery possible
#LSK #hype #CYPHB #CPIWatch #USJobData
343
·
--
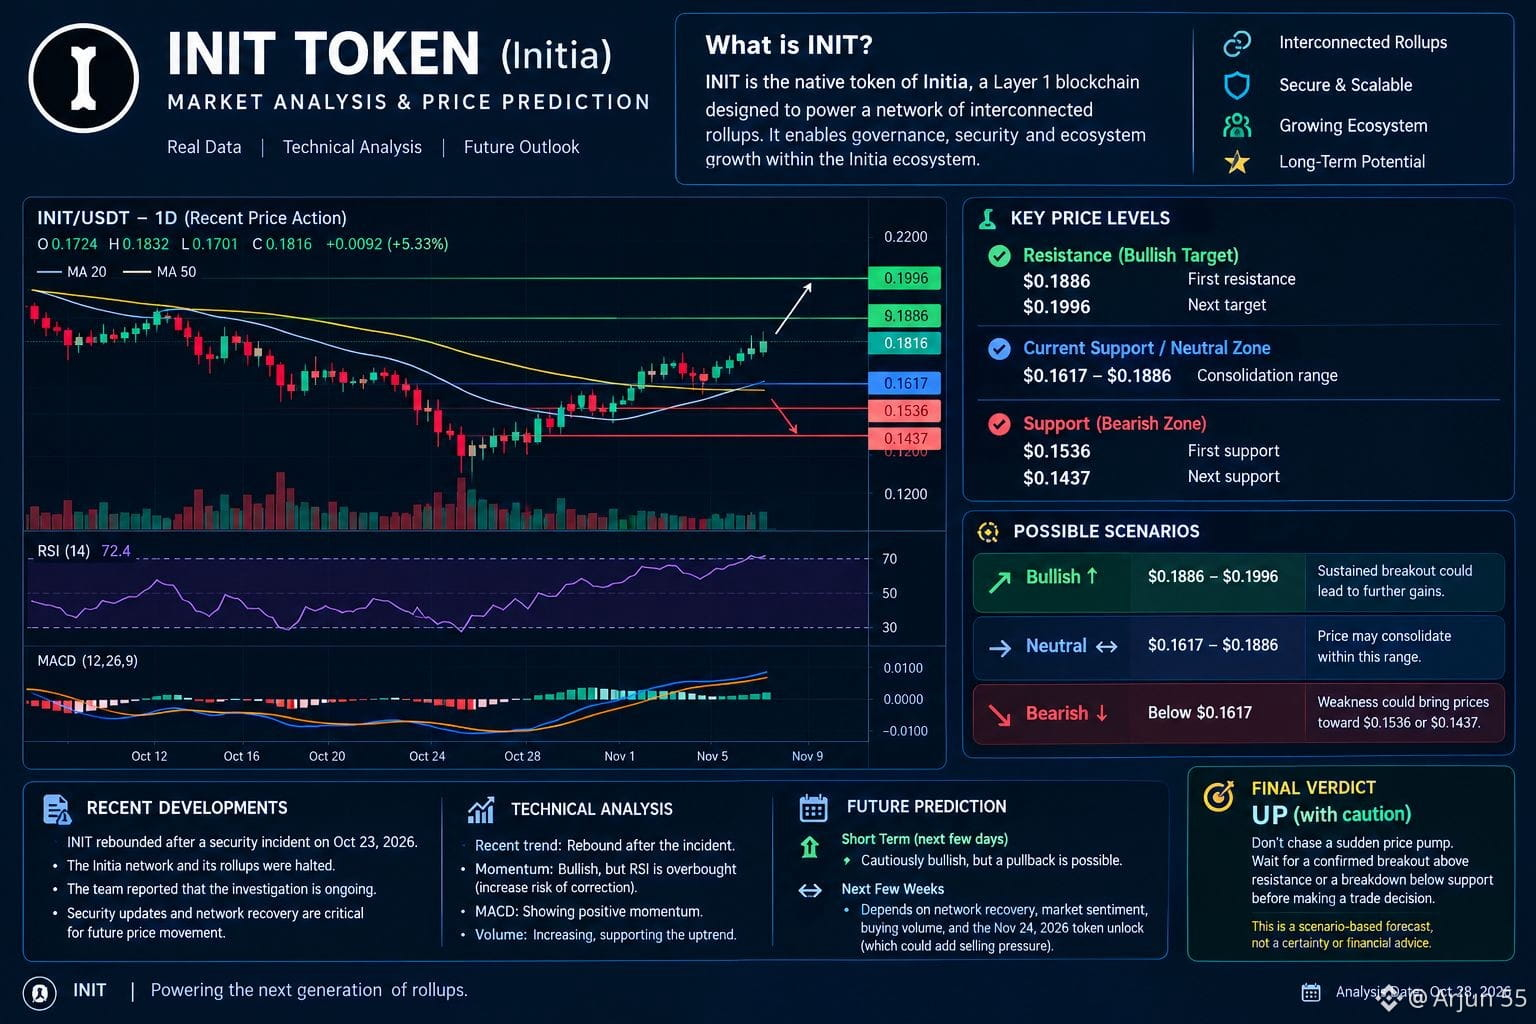
$INIT INIT Token (Ini tia) — Short-Term & Future Prediction
My view: Short-term bullish momentum, but high risk of a sharp pullback.
Recent price action shows a recovery following a serious security incident on October 23, 2026. The incident led to the Ini tia network and its roll ups being halted. The project reported that its investigation was ongoing. This makes security updates and network recovery crucial factors for the token's future price.
Recent performance and technical analysis
Recent trend: INIT has rebounded after the security incident.
Technical momentum: Indicators show bullish momentum, but the RSI has entered overbought territory, increasing the risk of a correction.
Fundamental risk: The team is auditing a security patch and preparing to restore the network. Successful recovery could support the price; delays could trigger selling.
Future price prediction
Scenario
Important price levels
Interpretation
Bullish
$0.1886–$0.1996
A sustained breakout could lead to further gains.
Neutral
$0.1617–$0.1886
Price may consolidate within this range.
Bearish
Below $0.1617
Weakness could bring prices toward $0.1536 or $0.1437.
These are technical reference levels reported on October 28, not guaranteed targets.
Final prediction: UP or DOWN?
Short term: Cautiously bullish, but a pullback is possible.
Next few weeks: Direction depends heavily on the network recovery, market sentiment, and buying volume. The next scheduled token unlock is November 24, 2026, which could introduce additional selling pressure.
My conclusion: Don't chase a sudden price pump. Watch for a confirmed breakout above resistance or a breakdown below support before making a trading decision.
This is a scenario-based forecast, not a certainty or financial advice.
#INIT #WENB #BLUR #CPIWatch #USJobData
{spot}(INITUSDT)
{spot}(WENBUSDT)
{spot}(BLURUSDT)
$INIT INIT Token (Ini tia) — Short-Term & Future Prediction
My view: Short-term bullish momentum, but high risk of a sharp pullback.
Recent price action shows a recovery following a serious security incident on October 23, 2026. The incident led to the Ini tia network and its roll ups being halted. The project reported that its investigation was ongoing. This makes security updates and network recovery crucial factors for the token's future price.
Recent performance and technical analysis
Recent trend: INIT has rebounded after the security incident.
Technical momentum: Indicators show bullish momentum, but the RSI has entered overbought territory, increasing the risk of a correction.
Fundamental risk: The team is auditing a security patch and preparing to restore the network. Successful recovery could support the price; delays could trigger selling.
Future price prediction
Scenario
Important price levels
Interpretation
Bullish
$0.1886–$0.1996
A sustained breakout could lead to further gains.
Neutral
$0.1617–$0.1886
Price may consolidate within this range.
Bearish
Below $0.1617
Weakness could bring prices toward $0.1536 or $0.1437.
These are technical reference levels reported on October 28, not guaranteed targets.
Final prediction: UP or DOWN?
Short term: Cautiously bullish, but a pullback is possible.
Next few weeks: Direction depends heavily on the network recovery, market sentiment, and buying volume. The next scheduled token unlock is November 24, 2026, which could introduce additional selling pressure.
My conclusion: Don't chase a sudden price pump. Watch for a confirmed breakout above resistance or a breakdown below support before making a trading decision.
This is a scenario-based forecast, not a certainty or financial advice.
#INIT #WENB #BLUR #CPIWatch #USJobData
My view: Short-term bullish momentum, but high risk of a sharp pullback.
Recent price action shows a recovery following a serious security incident on October 23, 2026. The incident led to the Ini tia network and its roll ups being halted. The project reported that its investigation was ongoing. This makes security updates and network recovery crucial factors for the token's future price.
Recent performance and technical analysis
Recent trend: INIT has rebounded after the security incident.
Technical momentum: Indicators show bullish momentum, but the RSI has entered overbought territory, increasing the risk of a correction.
Fundamental risk: The team is auditing a security patch and preparing to restore the network. Successful recovery could support the price; delays could trigger selling.
Future price prediction
Scenario
Important price levels
Interpretation
Bullish
$0.1886–$0.1996
A sustained breakout could lead to further gains.
Neutral
$0.1617–$0.1886
Price may consolidate within this range.
Bearish
Below $0.1617
Weakness could bring prices toward $0.1536 or $0.1437.
These are technical reference levels reported on October 28, not guaranteed targets.
Final prediction: UP or DOWN?
Short term: Cautiously bullish, but a pullback is possible.
Next few weeks: Direction depends heavily on the network recovery, market sentiment, and buying volume. The next scheduled token unlock is November 24, 2026, which could introduce additional selling pressure.
My conclusion: Don't chase a sudden price pump. Watch for a confirmed breakout above resistance or a breakdown below support before making a trading decision.
This is a scenario-based forecast, not a certainty or financial advice.
#INIT #WENB #BLUR #CPIWatch #USJobData
315
·
--
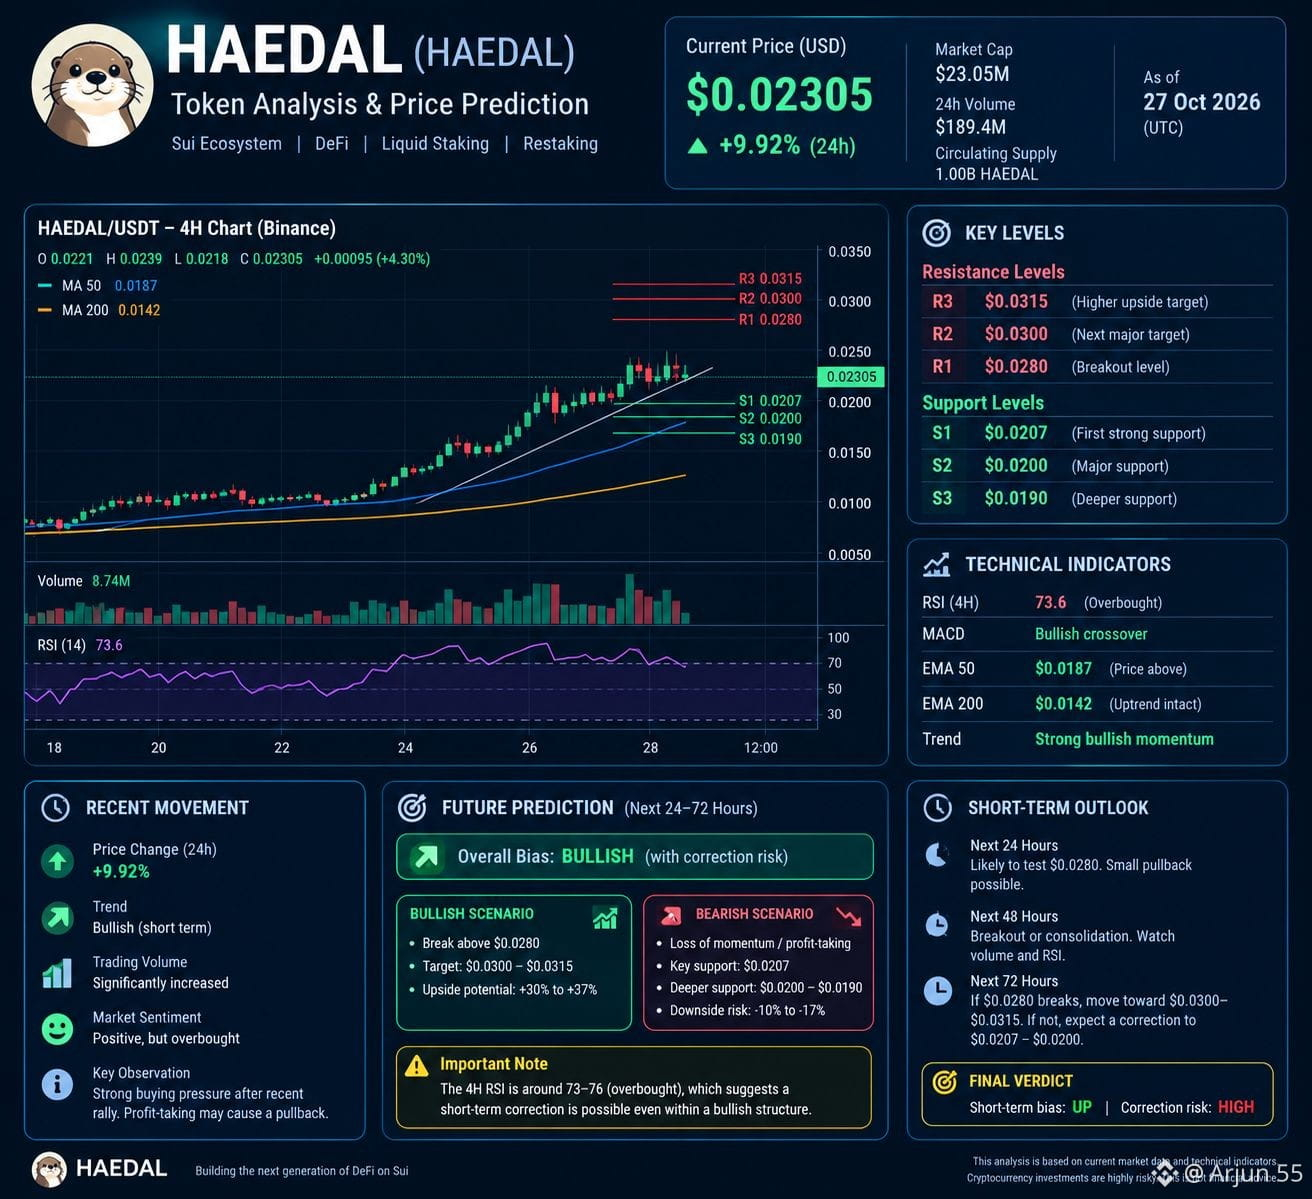
$HAEDAL HAE DAL Token — Latest Analysis
As of 27 October 2026
Hae dal Protocol
According to HAE DAL market page, the latest reported price is approximately $0.02305, up 9.92% in 24 hours. Prices vary across exchanges and updates continuously.
Recent movement
Short-term trend: Bullish.
Momentum: Strong buying activity, with a significant rise in trading volume.
Risk: After a sharp rally, profit-taking could cause a pullback.
Important support and resistance
Based on the latest technical analysis available, these are approximate levels.
Level
Price (USD)
Significance
Resistance 3
$0.0315
Higher upside target
Resistance 2
$0.0300
Next major target
Resistance 1
$0.0280
Breakout level
Support 1
$0.0207
Important support
Support 2
$0.0200
Stronger support
Support 3
$0.0190
Deeper support
Future prediction: Next 24–72 hours
My assessment: Bullish trend, but high correction risk.
Bullish scenario: A sustained break above $0.0280 could open a move toward $0.0300–$0.0315.
Bearish scenario: If the rally loses momentum, profit-taking could cause a sharp pullback. Watch whether the price holds above $0.0207.
Main warning: The 4-hour RSI is around 93, indicating extremely overbought conditions in the latest technical report. A correction is possible even while the broader trend remains bullish.
Final verdict
Short-term bias: UP Correction risk: HIGH
The price is showing strong upward momentum, but a sharp rally is not a guarantee of further gains. I would look for a confirmed breakout above $0.0280 rather than assume the price will keep rising.
This is a scenario-based forecast, not a guaranteed prediction or personalized financial advice.
#FOMCWatch #haedal #brev #cyphb #cpiwatch
{spot}(HAEDALUSDT)
{spot}(BREVUSDT)
{spot}(CYPHBUSDT)
$HAEDAL HAE DAL Token — Latest Analysis
As of 27 October 2026
Hae dal Protocol
According to HAE DAL market page, the latest reported price is approximately $0.02305, up 9.92% in 24 hours. Prices vary across exchanges and updates continuously.
Recent movement
Short-term trend: Bullish.
Momentum: Strong buying activity, with a significant rise in trading volume.
Risk: After a sharp rally, profit-taking could cause a pullback.
Important support and resistance
Based on the latest technical analysis available, these are approximate levels.
Level
Price (USD)
Significance
Resistance 3
$0.0315
Higher upside target
Resistance 2
$0.0300
Next major target
Resistance 1
$0.0280
Breakout level
Support 1
$0.0207
Important support
Support 2
$0.0200
Stronger support
Support 3
$0.0190
Deeper support
Future prediction: Next 24–72 hours
My assessment: Bullish trend, but high correction risk.
Bullish scenario: A sustained break above $0.0280 could open a move toward $0.0300–$0.0315.
Bearish scenario: If the rally loses momentum, profit-taking could cause a sharp pullback. Watch whether the price holds above $0.0207.
Main warning: The 4-hour RSI is around 93, indicating extremely overbought conditions in the latest technical report. A correction is possible even while the broader trend remains bullish.
Final verdict
Short-term bias: UP Correction risk: HIGH
The price is showing strong upward momentum, but a sharp rally is not a guarantee of further gains. I would look for a confirmed breakout above $0.0280 rather than assume the price will keep rising.
This is a scenario-based forecast, not a guaranteed prediction or personalized financial advice.
#FOMCWatch #haedal #brev #cyphb #cpiwatch
As of 27 October 2026
Hae dal Protocol
According to HAE DAL market page, the latest reported price is approximately $0.02305, up 9.92% in 24 hours. Prices vary across exchanges and updates continuously.
Recent movement
Short-term trend: Bullish.
Momentum: Strong buying activity, with a significant rise in trading volume.
Risk: After a sharp rally, profit-taking could cause a pullback.
Important support and resistance
Based on the latest technical analysis available, these are approximate levels.
Level
Price (USD)
Significance
Resistance 3
$0.0315
Higher upside target
Resistance 2
$0.0300
Next major target
Resistance 1
$0.0280
Breakout level
Support 1
$0.0207
Important support
Support 2
$0.0200
Stronger support
Support 3
$0.0190
Deeper support
Future prediction: Next 24–72 hours
My assessment: Bullish trend, but high correction risk.
Bullish scenario: A sustained break above $0.0280 could open a move toward $0.0300–$0.0315.
Bearish scenario: If the rally loses momentum, profit-taking could cause a sharp pullback. Watch whether the price holds above $0.0207.
Main warning: The 4-hour RSI is around 93, indicating extremely overbought conditions in the latest technical report. A correction is possible even while the broader trend remains bullish.
Final verdict
Short-term bias: UP Correction risk: HIGH
The price is showing strong upward momentum, but a sharp rally is not a guarantee of further gains. I would look for a confirmed breakout above $0.0280 rather than assume the price will keep rising.
This is a scenario-based forecast, not a guaranteed prediction or personalized financial advice.
#FOMCWatch #haedal #brev #cyphb #cpiwatch
278
·
--
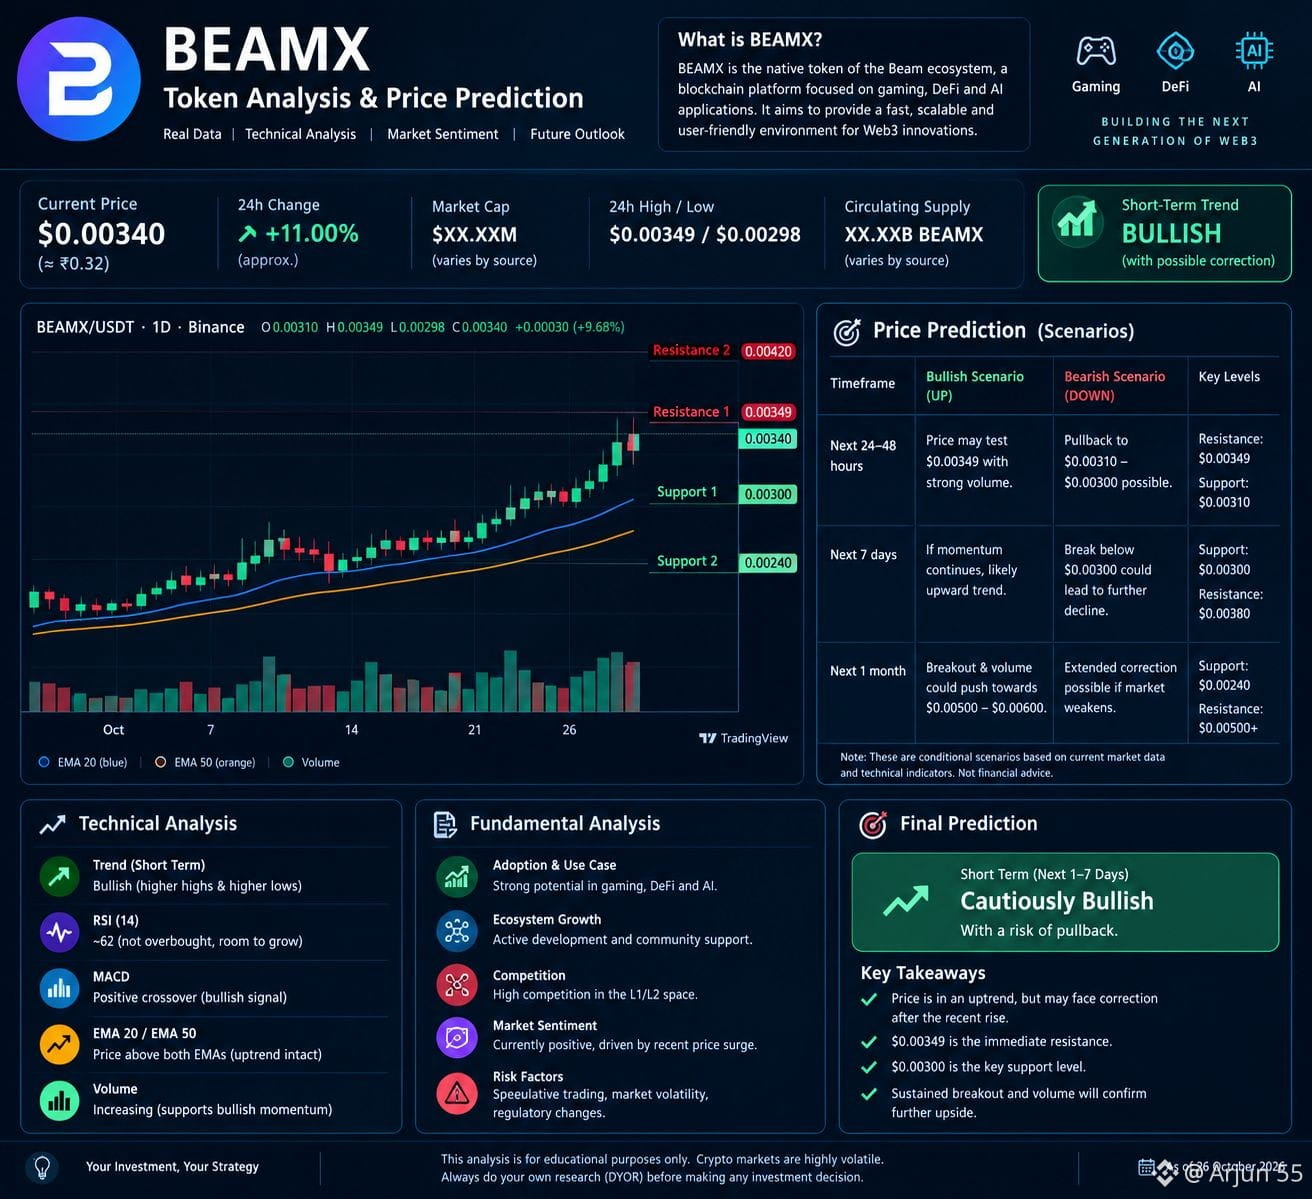
$BEAMX BEAM X Token Analysis & Prediction
Date: 26 October 2026
Current Market Situation
Current price: Approximately $0.00340 (₹0.32).
24-hour movement: Up around 11%.
Market trend: Short-term bullish, but a correction is possible after a sharp rise
Future Prediction: UP or DOWN?
Timeframe
Prediction
Key Levels
Next 24–48 hours
Bullish, but volatile
Resistance near $0.00349
Next 7 days
Neutral to bullish if momentum continues
Watch $0.00300 support
Next 1 month
Uncertain; depends on market momentum
Watch breakout and trading volume
These are conditional scenarios, not guaranteed price targets.
What Could Happen Next?
Bullish scenario (UP):
Price breaks above $0.00349 with strong volume.
The breakout holds, potentially opening the way for further gains.
Bearish scenario (DOWN):
Price falls below $0.00300 and fails to recover.
A deeper correction becomes more likely.
Fundamental Analysis
According to a recent analysis, BEAM's potential growth depends on adoption in gaming, DeFi, and AI-related applications. However, competition and speculative trading remain significant risks.
My Final Prediction
Short term: Cautiously bullish, with a risk of a pullback.
The recent price rise is encouraging, but one day's gains are not enough to confirm a sustained uptrend.
#BEAMX #chip #ERA #CPIWatch #USjobs
{spot}(BEAMXUSDT)
{spot}(CHIPUSDT)
{spot}(ERAUSDT)
$BEAMX BEAM X Token Analysis & Prediction
Date: 26 October 2026
Current Market Situation
Current price: Approximately $0.00340 (₹0.32).
24-hour movement: Up around 11%.
Market trend: Short-term bullish, but a correction is possible after a sharp rise
Future Prediction: UP or DOWN?
Timeframe
Prediction
Key Levels
Next 24–48 hours
Bullish, but volatile
Resistance near $0.00349
Next 7 days
Neutral to bullish if momentum continues
Watch $0.00300 support
Next 1 month
Uncertain; depends on market momentum
Watch breakout and trading volume
These are conditional scenarios, not guaranteed price targets.
What Could Happen Next?
Bullish scenario (UP):
Price breaks above $0.00349 with strong volume.
The breakout holds, potentially opening the way for further gains.
Bearish scenario (DOWN):
Price falls below $0.00300 and fails to recover.
A deeper correction becomes more likely.
Fundamental Analysis
According to a recent analysis, BEAM's potential growth depends on adoption in gaming, DeFi, and AI-related applications. However, competition and speculative trading remain significant risks.
My Final Prediction
Short term: Cautiously bullish, with a risk of a pullback.
The recent price rise is encouraging, but one day's gains are not enough to confirm a sustained uptrend.
#BEAMX #chip #ERA #CPIWatch #USjobs
Date: 26 October 2026
Current Market Situation
Current price: Approximately $0.00340 (₹0.32).
24-hour movement: Up around 11%.
Market trend: Short-term bullish, but a correction is possible after a sharp rise
Future Prediction: UP or DOWN?
Timeframe
Prediction
Key Levels
Next 24–48 hours
Bullish, but volatile
Resistance near $0.00349
Next 7 days
Neutral to bullish if momentum continues
Watch $0.00300 support
Next 1 month
Uncertain; depends on market momentum
Watch breakout and trading volume
These are conditional scenarios, not guaranteed price targets.
What Could Happen Next?
Bullish scenario (UP):
Price breaks above $0.00349 with strong volume.
The breakout holds, potentially opening the way for further gains.
Bearish scenario (DOWN):
Price falls below $0.00300 and fails to recover.
A deeper correction becomes more likely.
Fundamental Analysis
According to a recent analysis, BEAM's potential growth depends on adoption in gaming, DeFi, and AI-related applications. However, competition and speculative trading remain significant risks.
My Final Prediction
Short term: Cautiously bullish, with a risk of a pullback.
The recent price rise is encouraging, but one day's gains are not enough to confirm a sustained uptrend.
#BEAMX #chip #ERA #CPIWatch #USjobs
1
110
·
--
$T Threshold (T) Token — Recent Trend & Future Prediction
Recent price movement
According to recent market data, T has been trading around the $0.0045–$0.0050 range in late October 2026, although prices vary across exchanges. Its price has recently weakened, indicating selling pressure.
Technical analysis: Up or down?
Technical indicators show a possible bullish reversal, but the price is highly volatile. One analysis reports RSI near 69, suggesting strong momentum and a risk of short-term overbought conditions. Price level
Significance
$0.0045–$0.0046
Support zone
$0.0050–$0.0056
Potential recovery zone
$0.0062–$0.0066
Resistance zone
Above $0.0066
Further upside possible if the breakout holds
Future prediction
Short term (1–7 days): Volatile; a rebound is possible, but a pullback cannot be ruled out.
Bullish scenario: A sustained move above $0.0062–$0.0066 could open the way toward $0.0070.
Bearish scenario: A break below $0.0045 could expose the token to further downside.
Final verdict
My assessment: Cautiously bullish if resistance breaks; otherwise, expect volatility and possible downside. This is a conditional technical outlook, not a guaranteed prediction.
#threshold #t #QI #ENA #CPIWatch
{spot}(ENAUSDT)
{spot}(QIUSDT)
{spot}(DASHUSDT)
$T Threshold (T) Token — Recent Trend & Future Prediction
Recent price movement
According to recent market data, T has been trading around the $0.0045–$0.0050 range in late October 2026, although prices vary across exchanges. Its price has recently weakened, indicating selling pressure.
Technical analysis: Up or down?
Technical indicators show a possible bullish reversal, but the price is highly volatile. One analysis reports RSI near 69, suggesting strong momentum and a risk of short-term overbought conditions. Price level
Significance
$0.0045–$0.0046
Support zone
$0.0050–$0.0056
Potential recovery zone
$0.0062–$0.0066
Resistance zone
Above $0.0066
Further upside possible if the breakout holds
Future prediction
Short term (1–7 days): Volatile; a rebound is possible, but a pullback cannot be ruled out.
Bullish scenario: A sustained move above $0.0062–$0.0066 could open the way toward $0.0070.
Bearish scenario: A break below $0.0045 could expose the token to further downside.
Final verdict
My assessment: Cautiously bullish if resistance breaks; otherwise, expect volatility and possible downside. This is a conditional technical outlook, not a guaranteed prediction.
#threshold #t #QI #ENA #CPIWatch
Recent price movement
According to recent market data, T has been trading around the $0.0045–$0.0050 range in late October 2026, although prices vary across exchanges. Its price has recently weakened, indicating selling pressure.
Technical analysis: Up or down?
Technical indicators show a possible bullish reversal, but the price is highly volatile. One analysis reports RSI near 69, suggesting strong momentum and a risk of short-term overbought conditions. Price level
Significance
$0.0045–$0.0046
Support zone
$0.0050–$0.0056
Potential recovery zone
$0.0062–$0.0066
Resistance zone
Above $0.0066
Further upside possible if the breakout holds
Future prediction
Short term (1–7 days): Volatile; a rebound is possible, but a pullback cannot be ruled out.
Bullish scenario: A sustained move above $0.0062–$0.0066 could open the way toward $0.0070.
Bearish scenario: A break below $0.0045 could expose the token to further downside.
Final verdict
My assessment: Cautiously bullish if resistance breaks; otherwise, expect volatility and possible downside. This is a conditional technical outlook, not a guaranteed prediction.
#threshold #t #QI #ENA #CPIWatch
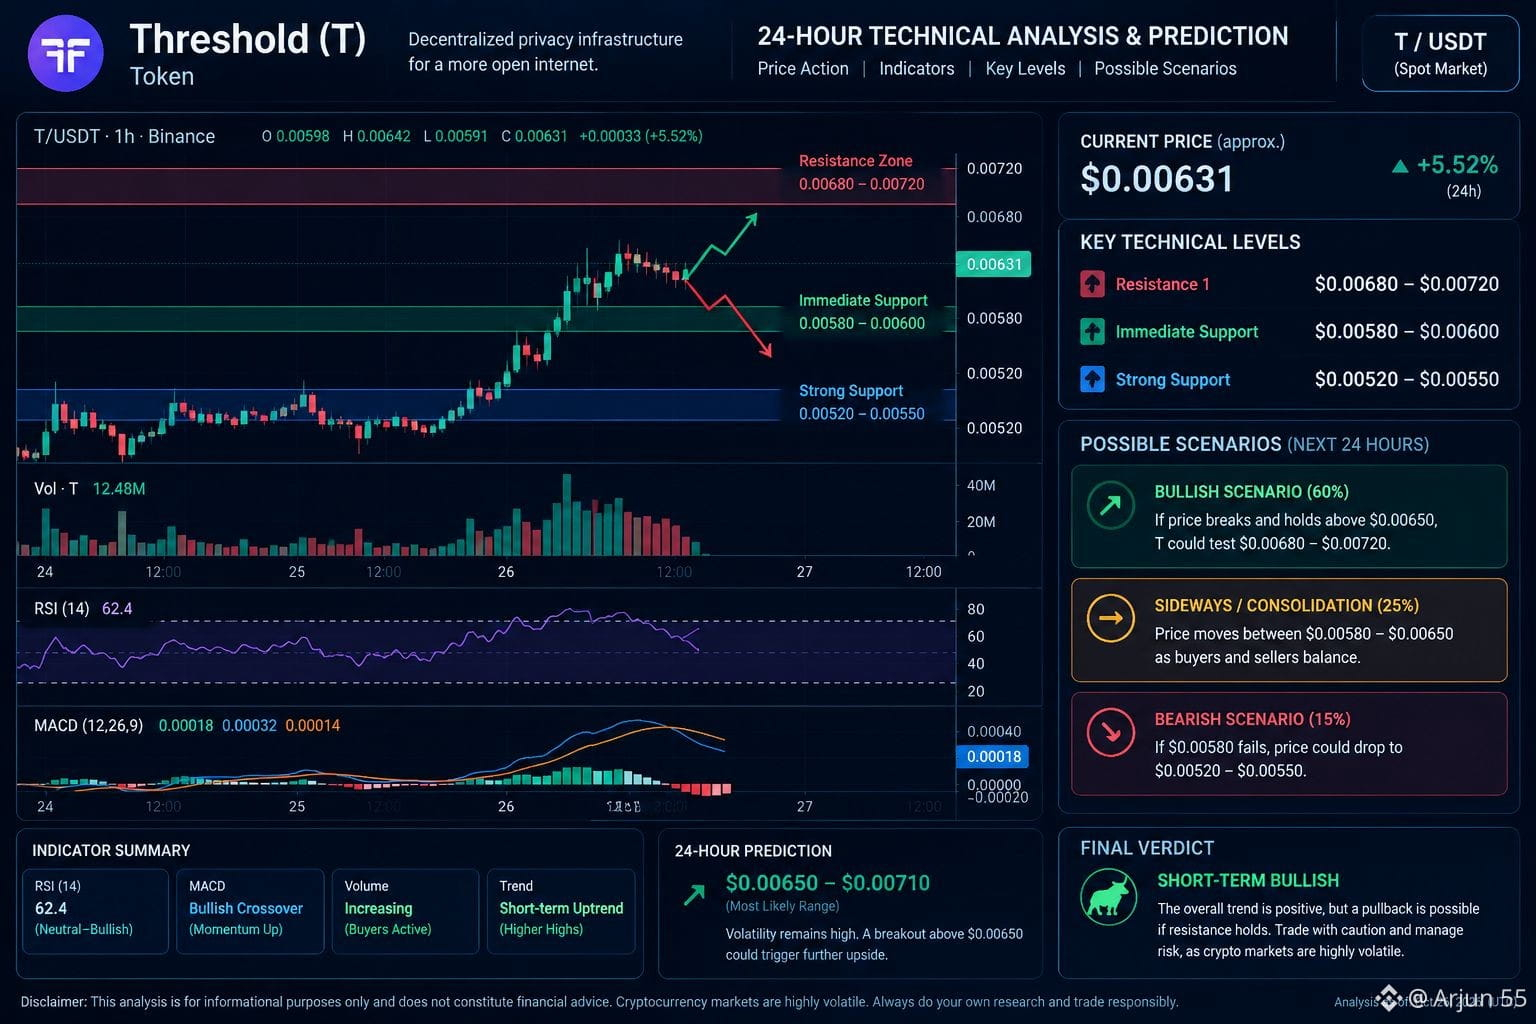
253
·
--
$ERA ERA Token — Recent Trend & Future Prediction
Token: Caldera (ERA) · Analysis date: 24 October 2026
Short verdict: Bullish momentum, but correction risk is high.
Recent market data shows ERA has risen sharply, with a reported gain of around 32% in 24 hours and 56% in 7 days. Technical indicators also lean bullish, but such a fast rally can trigger profit-taking and sudden reversals.
Key levels to watch
Resistance 2 $0.1076
Resistance 1 $0.0911
Support 1 $0.0736
Support 2 $0.0697
Technical levels reported on 24 October 2026.
Future prediction
Next 24–48 hours: Bullish if price sustains above $0.0911; a breakout could target $0.10–$0.108.
Correction scenario: Failure to hold the breakout could bring a pullback toward $0.075–$0.070.
Confirmation: Look for a strong candle close above resistance with sustained trading volume.
My view: Short-term bias is bullish, but volatility is extreme. These are conditional scenarios, not guaranteed price targets.
#ERA #BMT #Anime #CPIWatch #USJobData
{spot}(ERAUSDT)
{spot}(ANIMEUSDT)
{spot}(BMTUSDT)
$ERA ERA Token — Recent Trend & Future Prediction
Token: Caldera (ERA) · Analysis date: 24 October 2026
Short verdict: Bullish momentum, but correction risk is high.
Recent market data shows ERA has risen sharply, with a reported gain of around 32% in 24 hours and 56% in 7 days. Technical indicators also lean bullish, but such a fast rally can trigger profit-taking and sudden reversals.
Key levels to watch
Resistance 2 $0.1076
Resistance 1 $0.0911
Support 1 $0.0736
Support 2 $0.0697
Technical levels reported on 24 October 2026.
Future prediction
Next 24–48 hours: Bullish if price sustains above $0.0911; a breakout could target $0.10–$0.108.
Correction scenario: Failure to hold the breakout could bring a pullback toward $0.075–$0.070.
Confirmation: Look for a strong candle close above resistance with sustained trading volume.
My view: Short-term bias is bullish, but volatility is extreme. These are conditional scenarios, not guaranteed price targets.
#ERA #BMT #Anime #CPIWatch #USJobData
Token: Caldera (ERA) · Analysis date: 24 October 2026
Short verdict: Bullish momentum, but correction risk is high.
Recent market data shows ERA has risen sharply, with a reported gain of around 32% in 24 hours and 56% in 7 days. Technical indicators also lean bullish, but such a fast rally can trigger profit-taking and sudden reversals.
Key levels to watch
Resistance 2 $0.1076
Resistance 1 $0.0911
Support 1 $0.0736
Support 2 $0.0697
Technical levels reported on 24 October 2026.
Future prediction
Next 24–48 hours: Bullish if price sustains above $0.0911; a breakout could target $0.10–$0.108.
Correction scenario: Failure to hold the breakout could bring a pullback toward $0.075–$0.070.
Confirmation: Look for a strong candle close above resistance with sustained trading volume.
My view: Short-term bias is bullish, but volatility is extreme. These are conditional scenarios, not guaranteed price targets.
#ERA #BMT #Anime #CPIWatch #USJobData
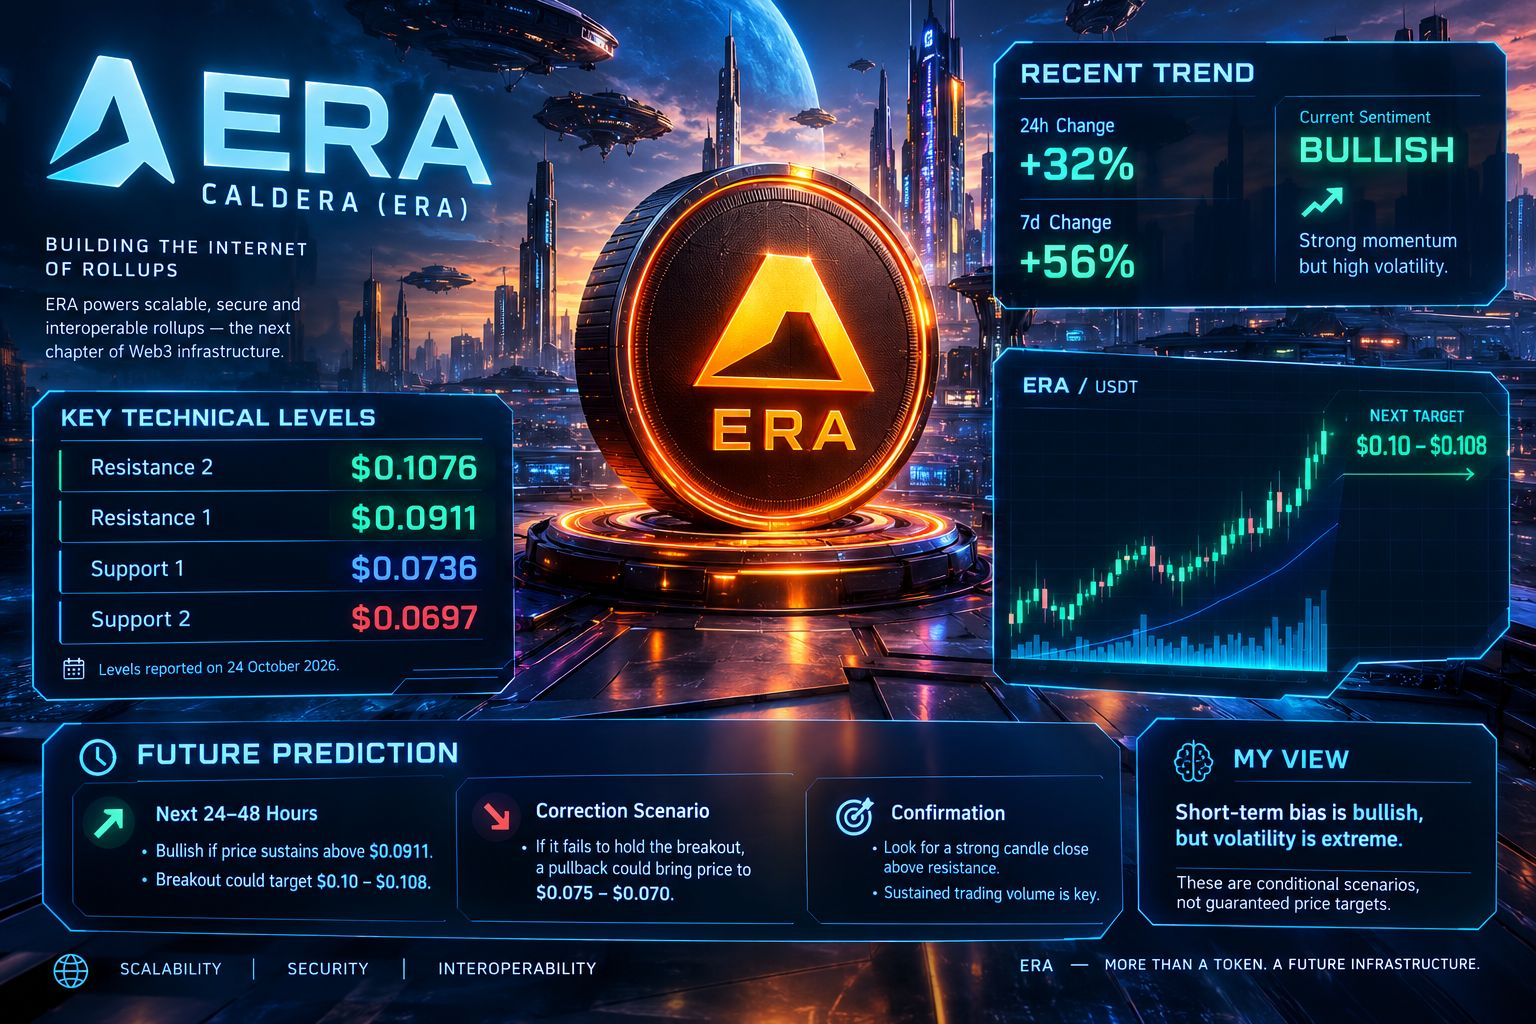
383
·
--
$REZ REZ Token — Recent Movement & Future Prediction
Analysis as of 23 October 2026 | Token: Renzo (REZ)
My view: Short-term bullish, but the medium-term trend remains uncertain. REZ has rebounded from recent lows, although it needs to break resistance to confirm a stronger uptrend.
Recent price movement
Latest reported price $0.00393
20–23 October trend
REZ dropped to around $0.00326–$0.00339 on 19–20 October, then rebounded toward $0.0040. This indicates renewed buying, but volatility remains high.
Important price levels
Resistance: $0.00401–$0.00416
A strong breakout with increasing volume could open the way toward $0.00437.
Support: $0.00380
Holding this level would support the bullish recovery.
Major downside watch: $0.00356–$0.00318
A sustained break below support could bring another decline.
Technical levels reported on 23 October 2026. These are reference levels, not guaranteed price targets.
Future prediction
Timeframe Outlook Possible scenario
Next 1–3 days Slightly bullish Retest of $0.0040–$0.00416
Next 1–2 weeks Uncertain $0.00356–$0.00437 range
Bearish scenario Risk of decline Below $0.00356 if selling pressure increases
These are conditional technical scenarios, not statistically certain forecasts.Important risk: 83.33 million REZ tokens are scheduled to unlock on 30 October 2026. This could add selling pressure, although an unlock does not automatically mean the price will fall.
Final verdict
Up: If REZ breaks and holds above $0.00401–$0.00416 with strong volume.
Down: If it loses $0.00380, particularly if it then breaks $0.00356.
Current bias: Cautiously bullish in the short term; uncertain over the next few weeks.
This is market analysis, not a guaranteed prediction or personalized financial advice.
#REZ #osmo #GTC #CPIWatch #USJobData
{spot}(REZUSDT)
{spot}(OSMOUSDT)
{spot}(GTCUSDT)
$REZ REZ Token — Recent Movement & Future Prediction
Analysis as of 23 October 2026 | Token: Renzo (REZ)
My view: Short-term bullish, but the medium-term trend remains uncertain. REZ has rebounded from recent lows, although it needs to break resistance to confirm a stronger uptrend.
Recent price movement
Latest reported price $0.00393
20–23 October trend
REZ dropped to around $0.00326–$0.00339 on 19–20 October, then rebounded toward $0.0040. This indicates renewed buying, but volatility remains high.
Important price levels
Resistance: $0.00401–$0.00416
A strong breakout with increasing volume could open the way toward $0.00437.
Support: $0.00380
Holding this level would support the bullish recovery.
Major downside watch: $0.00356–$0.00318
A sustained break below support could bring another decline.
Technical levels reported on 23 October 2026. These are reference levels, not guaranteed price targets.
Future prediction
Timeframe Outlook Possible scenario
Next 1–3 days Slightly bullish Retest of $0.0040–$0.00416
Next 1–2 weeks Uncertain $0.00356–$0.00437 range
Bearish scenario Risk of decline Below $0.00356 if selling pressure increases
These are conditional technical scenarios, not statistically certain forecasts.Important risk: 83.33 million REZ tokens are scheduled to unlock on 30 October 2026. This could add selling pressure, although an unlock does not automatically mean the price will fall.
Final verdict
Up: If REZ breaks and holds above $0.00401–$0.00416 with strong volume.
Down: If it loses $0.00380, particularly if it then breaks $0.00356.
Current bias: Cautiously bullish in the short term; uncertain over the next few weeks.
This is market analysis, not a guaranteed prediction or personalized financial advice.
#REZ #osmo #GTC #CPIWatch #USJobData
Analysis as of 23 October 2026 | Token: Renzo (REZ)
My view: Short-term bullish, but the medium-term trend remains uncertain. REZ has rebounded from recent lows, although it needs to break resistance to confirm a stronger uptrend.
Recent price movement
Latest reported price $0.00393
20–23 October trend
REZ dropped to around $0.00326–$0.00339 on 19–20 October, then rebounded toward $0.0040. This indicates renewed buying, but volatility remains high.
Important price levels
Resistance: $0.00401–$0.00416
A strong breakout with increasing volume could open the way toward $0.00437.
Support: $0.00380
Holding this level would support the bullish recovery.
Major downside watch: $0.00356–$0.00318
A sustained break below support could bring another decline.
Technical levels reported on 23 October 2026. These are reference levels, not guaranteed price targets.
Future prediction
Timeframe Outlook Possible scenario
Next 1–3 days Slightly bullish Retest of $0.0040–$0.00416
Next 1–2 weeks Uncertain $0.00356–$0.00437 range
Bearish scenario Risk of decline Below $0.00356 if selling pressure increases
These are conditional technical scenarios, not statistically certain forecasts.Important risk: 83.33 million REZ tokens are scheduled to unlock on 30 October 2026. This could add selling pressure, although an unlock does not automatically mean the price will fall.
Final verdict
Up: If REZ breaks and holds above $0.00401–$0.00416 with strong volume.
Down: If it loses $0.00380, particularly if it then breaks $0.00356.
Current bias: Cautiously bullish in the short term; uncertain over the next few weeks.
This is market analysis, not a guaranteed prediction or personalized financial advice.
#REZ #osmo #GTC #CPIWatch #USJobData
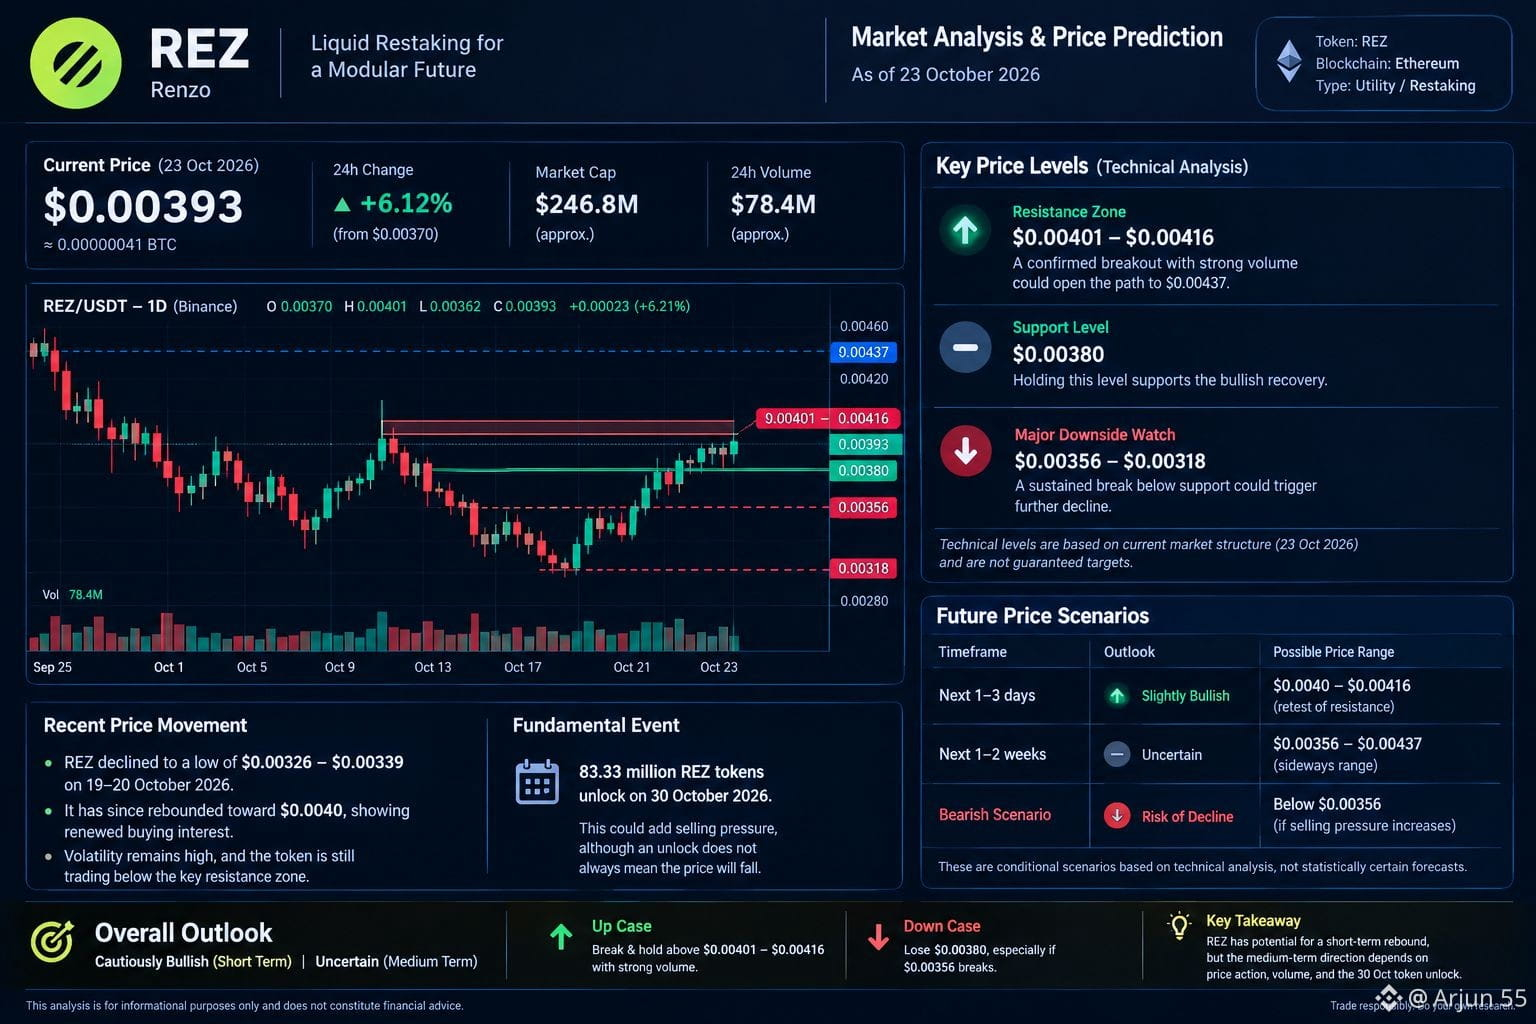
179
·
--
$SOXSB SOX SB Token: Recent Trend & Future Prediction
SOX SB is Direxion Semiconductor Bear 3X ETF tokenized Stocks, not a typical cryptocurrency. It is designed to provide leveraged inverse exposure to semiconductor stocks, so its price generally benefits when semiconductor stocks fall and suffer when they rise.
Important: SOX SB is a high-risk, leveraged product. Its price can move sharply in either direction, and daily leverage can cause returns over several days to differ significantly from what you might expect.
Recent movement and prediction
Live market data is changing quickly. currently shows approximately $51.89, up about 14.6% in 24 hours and 9.3% over 7 days. The 24-hour range is about $43.63–$52.20. These are live snapshot figures, not a guaranteed closing price.
Short-term trend
Bullish momentum, but price is near the recent high.
Upside scenario
A sustained move above $52.20 could support further gains toward $53–$55, if semiconductor stocks weaken.
Downside scenario
Rejection near $52 could lead to a pullback toward $48–$46, with $43.63 as a key recent low.
These are conditional technical levels, not statistically validated targets.
My view: The short-term bias is bullish, but after a sharp rise, a pullback is possible. Sox sb is more likely to rise when semiconductor stocks fall; a semiconductor rally could reverse its gains.
#SOXSB #BMT #DGB #CPIWatch #USJobData
{spot}(SOXSBUSDT)
{spot}(DGBUSDT)
{spot}(BMTUSDT)
$SOXSB SOX SB Token: Recent Trend & Future Prediction
SOX SB is Direxion Semiconductor Bear 3X ETF tokenized Stocks, not a typical cryptocurrency. It is designed to provide leveraged inverse exposure to semiconductor stocks, so its price generally benefits when semiconductor stocks fall and suffer when they rise.
Important: SOX SB is a high-risk, leveraged product. Its price can move sharply in either direction, and daily leverage can cause returns over several days to differ significantly from what you might expect.
Recent movement and prediction
Live market data is changing quickly. currently shows approximately $51.89, up about 14.6% in 24 hours and 9.3% over 7 days. The 24-hour range is about $43.63–$52.20. These are live snapshot figures, not a guaranteed closing price.
Short-term trend
Bullish momentum, but price is near the recent high.
Upside scenario
A sustained move above $52.20 could support further gains toward $53–$55, if semiconductor stocks weaken.
Downside scenario
Rejection near $52 could lead to a pullback toward $48–$46, with $43.63 as a key recent low.
These are conditional technical levels, not statistically validated targets.
My view: The short-term bias is bullish, but after a sharp rise, a pullback is possible. Sox sb is more likely to rise when semiconductor stocks fall; a semiconductor rally could reverse its gains.
#SOXSB #BMT #DGB #CPIWatch #USJobData
SOX SB is Direxion Semiconductor Bear 3X ETF tokenized Stocks, not a typical cryptocurrency. It is designed to provide leveraged inverse exposure to semiconductor stocks, so its price generally benefits when semiconductor stocks fall and suffer when they rise.
Important: SOX SB is a high-risk, leveraged product. Its price can move sharply in either direction, and daily leverage can cause returns over several days to differ significantly from what you might expect.
Recent movement and prediction
Live market data is changing quickly. currently shows approximately $51.89, up about 14.6% in 24 hours and 9.3% over 7 days. The 24-hour range is about $43.63–$52.20. These are live snapshot figures, not a guaranteed closing price.
Short-term trend
Bullish momentum, but price is near the recent high.
Upside scenario
A sustained move above $52.20 could support further gains toward $53–$55, if semiconductor stocks weaken.
Downside scenario
Rejection near $52 could lead to a pullback toward $48–$46, with $43.63 as a key recent low.
These are conditional technical levels, not statistically validated targets.
My view: The short-term bias is bullish, but after a sharp rise, a pullback is possible. Sox sb is more likely to rise when semiconductor stocks fall; a semiconductor rally could reverse its gains.
#SOXSB #BMT #DGB #CPIWatch #USJobData
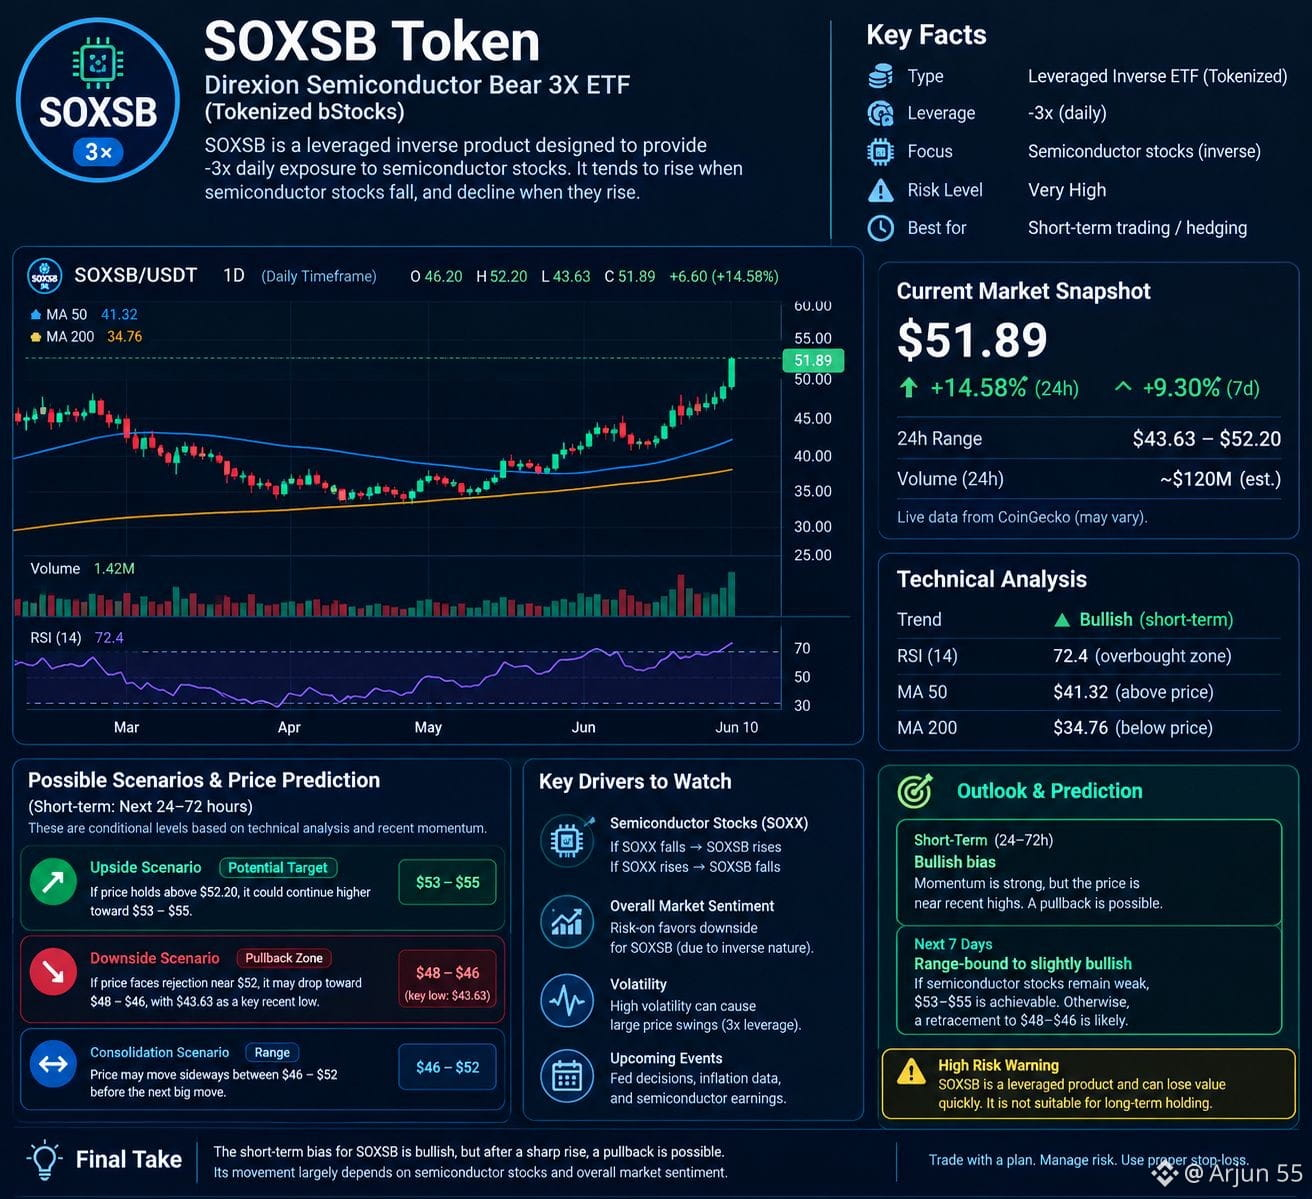
92
Войдите, чтобы посмотреть больше материала
Присоединяйтесь к пользователям криптовалют по всему миру на Binance Square
⚡️ Получайте новейшую и полезную информацию о криптоактивах.
💬 Нам доверяет крупнейшая в мире криптобиржа.
👍 Получите достоверные аналитические данные от верифицированных создателей контента.
Эл. почта/номер телефона
В тренде
HotCPIDecemberHikePriced
Просмотров: 44,961
786 обсуждают
CPI Market Watch | US CPI Rises 0.4% in October, Hotter Than 0.3% Forecast
Binance News
·Лайков: 21
·Просмотров: 36.7k
AnthropicRejectsIPODelayValuationinQuestion
Просмотров: 180,255
1,606 обсуждают
NvidiaInvestigatesAfterHuang’sAffairApology
Просмотров: 452,861
3,065 обсуждают