

#t
t
524,154 views
3,883 Discussing
Hot
Latest

·
--
$T 24h volume is 0.3x its weekly average and most traders miss the trap
When a coin drops 4.9 percent on weak volume it means nobody cares
Look at $T trading at $0.004490 right now sitting in the middle of its daily range
The 24h volume is $1.2M while the 7 day average is triple that size
That low number tells you the drop lacks real selling pressure behind it
To check this ratio on your chart just open the volume moving average and compare today to the weekly line
Never trust a price move unless the volume matches the story
What volume filter do you use before opening a chart
#T #TradingTips
$T 24h volume is 0.3x its weekly average and most traders miss the trap
When a coin drops 4.9 percent on weak volume it means nobody cares
Look at $T trading at $0.004490 right now sitting in the middle of its daily range
The 24h volume is $1.2M while the 7 day average is triple that size
That low number tells you the drop lacks real selling pressure behind it
To check this ratio on your chart just open the volume moving average and compare today to the weekly line
Never trust a price move unless the volume matches the story
What volume filter do you use before opening a chart
#T #TradingTips
When a coin drops 4.9 percent on weak volume it means nobody cares
Look at $T trading at $0.004490 right now sitting in the middle of its daily range
The 24h volume is $1.2M while the 7 day average is triple that size
That low number tells you the drop lacks real selling pressure behind it
To check this ratio on your chart just open the volume moving average and compare today to the weekly line
Never trust a price move unless the volume matches the story
What volume filter do you use before opening a chart
#T #TradingTips
2
·
--
$T is sitting at $0.004620 today and I am walking away 📉
Volume is only 0.8x the seven day average right now
This drop is sitting 41.6 percent below the recent highs
I need to see an hourly close and hold above $0.005300 before getting interested
Or a clean pullback that holds $0.004590 and actually bounces
Markets keep running without you sometimes and a bad entry costs more than a missed move 🛑
Chasing $T here or waiting for 0.004590
#T #RiskManagement
$T is sitting at $0.004620 today and I am walking away 📉
Volume is only 0.8x the seven day average right now
This drop is sitting 41.6 percent below the recent highs
I need to see an hourly close and hold above $0.005300 before getting interested
Or a clean pullback that holds $0.004590 and actually bounces
Markets keep running without you sometimes and a bad entry costs more than a missed move 🛑
Chasing $T here or waiting for 0.004590
#T #RiskManagement
Volume is only 0.8x the seven day average right now
This drop is sitting 41.6 percent below the recent highs
I need to see an hourly close and hold above $0.005300 before getting interested
Or a clean pullback that holds $0.004590 and actually bounces
Markets keep running without you sometimes and a bad entry costs more than a missed move 🛑
Chasing $T here or waiting for 0.004590
#T #RiskManagement
7

·
--
$DODO +2.90% | $T +2.75% | $RNDR +2.58%
#DODO nudged to $0.0245, up +2.90% on $1.1 M volume. The modest lift hints the PMM model is still attracting traders, though the bump is modest.
#T rose to $0.00486000, gaining +2.75% with $2.6 M changing hands. Its activity outpaces many peers, suggesting a brief rally on the lower‑cap side.
#RNDR climbed to $7.03, up +2.58% on $1.6 M volume. The GPU‑render token is keeping steady momentum as developers explore on‑chain rendering.
👀 Watch whether the stronger volume on T can sustain its price edge, potentially spilling over to the other gainers.
#Write2Earn #Binance
$DODO +2.90% | $T +2.75% | $RNDR +2.58%
#DODO nudged to $0.0245, up +2.90% on $1.1 M volume. The modest lift hints the PMM model is still attracting traders, though the bump is modest.
#T rose to $0.00486000, gaining +2.75% with $2.6 M changing hands. Its activity outpaces many peers, suggesting a brief rally on the lower‑cap side.
#RNDR climbed to $7.03, up +2.58% on $1.6 M volume. The GPU‑render token is keeping steady momentum as developers explore on‑chain rendering.
👀 Watch whether the stronger volume on T can sustain its price edge, potentially spilling over to the other gainers.
#Write2Earn #Binance
#DODO nudged to $0.0245, up +2.90% on $1.1 M volume. The modest lift hints the PMM model is still attracting traders, though the bump is modest.
#T rose to $0.00486000, gaining +2.75% with $2.6 M changing hands. Its activity outpaces many peers, suggesting a brief rally on the lower‑cap side.
#RNDR climbed to $7.03, up +2.58% on $1.6 M volume. The GPU‑render token is keeping steady momentum as developers explore on‑chain rendering.
👀 Watch whether the stronger volume on T can sustain its price edge, potentially spilling over to the other gainers.
#Write2Earn #Binance
15

·
--
$T +2.33% | $AAOIB +1.84% | $币安人生 +1.76%
#T nudged up to $0.00484, gaining +2.33% on $2.6 M of volume. The modest climb suggests some buying interest, though the price is still low‑priced.
#AAOIB ticked higher to $80.59, up +1.84% with $1.7 M traded. Momentum is gentle, and the mid‑range price may attract short‑term speculators.
#币安人生 rose to $0.5365, climbing +1.76% on $1.9 M of volume. It’s moving in step with the other two, hinting at a broader sector lift 👀.
Watch the relative volume ratios; if the larger $2.6 M for T holds, it could signal stronger support than the other two.
#Write2Earn #Binance
$T +2.33% | $AAOIB +1.84% | $币安人生 +1.76%
#T nudged up to $0.00484, gaining +2.33% on $2.6 M of volume. The modest climb suggests some buying interest, though the price is still low‑priced.
#AAOIB ticked higher to $80.59, up +1.84% with $1.7 M traded. Momentum is gentle, and the mid‑range price may attract short‑term speculators.
#币安人生 rose to $0.5365, climbing +1.76% on $1.9 M of volume. It’s moving in step with the other two, hinting at a broader sector lift 👀.
Watch the relative volume ratios; if the larger $2.6 M for T holds, it could signal stronger support than the other two.
#Write2Earn #Binance
#T nudged up to $0.00484, gaining +2.33% on $2.6 M of volume. The modest climb suggests some buying interest, though the price is still low‑priced.
#AAOIB ticked higher to $80.59, up +1.84% with $1.7 M traded. Momentum is gentle, and the mid‑range price may attract short‑term speculators.
#币安人生 rose to $0.5365, climbing +1.76% on $1.9 M of volume. It’s moving in step with the other two, hinting at a broader sector lift 👀.
Watch the relative volume ratios; if the larger $2.6 M for T holds, it could signal stronger support than the other two.
#Write2Earn #Binance
22
·
--
$T +3.63% | $COCOS +3.44% | $SOXSB +3.44%
#T is holding at $0.00485000, climbing +3.63% with $2.5 M changing hands.
#COCOS sits at $1.75, nudging +3.44% on a modest $1.5 M of volume.
#SOXSB reaches $42.44, also up +3.44% backed by a solid $6.6 M trade flow. 📈
The synchronized rise across these three suggests a brief bullish pulse, but the modest volumes for T and COCOS mean the move could be fragile.
#Write2Earn #Binance
$T +3.63% | $COCOS +3.44% | $SOXSB +3.44%
#T is holding at $0.00485000, climbing +3.63% with $2.5 M changing hands.
#COCOS sits at $1.75, nudging +3.44% on a modest $1.5 M of volume.
#SOXSB reaches $42.44, also up +3.44% backed by a solid $6.6 M trade flow. 📈
The synchronized rise across these three suggests a brief bullish pulse, but the modest volumes for T and COCOS mean the move could be fragile.
#Write2Earn #Binance
#T is holding at $0.00485000, climbing +3.63% with $2.5 M changing hands.
#COCOS sits at $1.75, nudging +3.44% on a modest $1.5 M of volume.
#SOXSB reaches $42.44, also up +3.44% backed by a solid $6.6 M trade flow. 📈
The synchronized rise across these three suggests a brief bullish pulse, but the modest volumes for T and COCOS mean the move could be fragile.
#Write2Earn #Binance
2

·
--
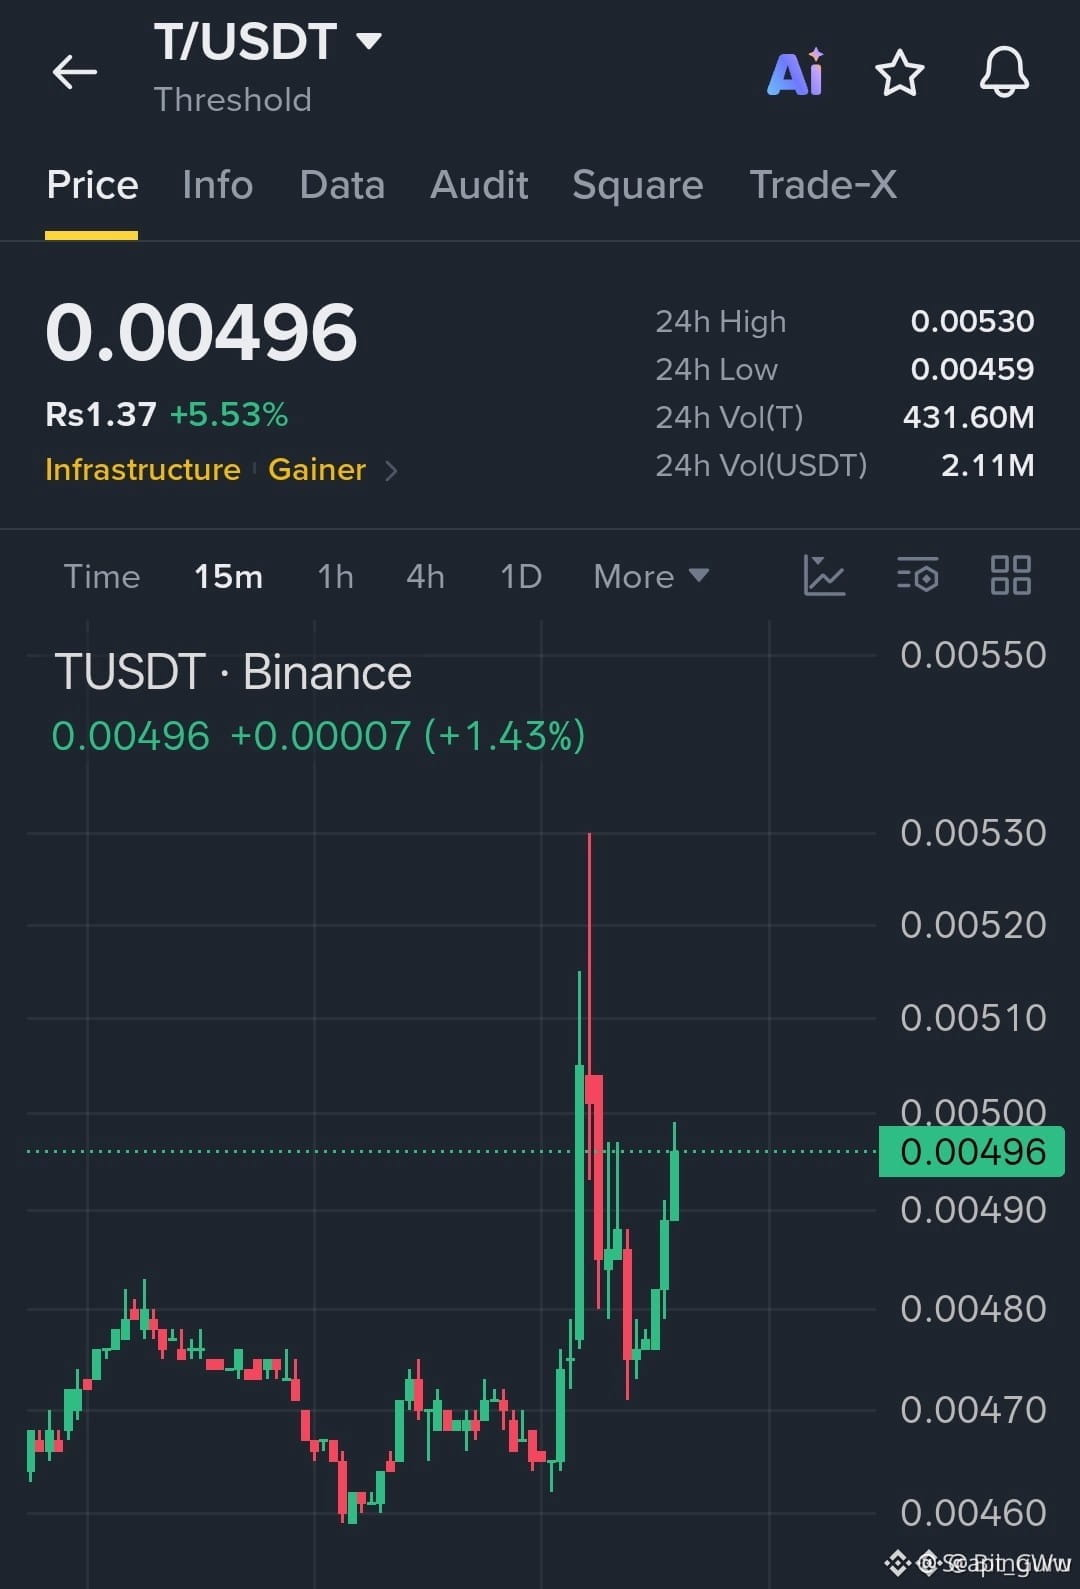
🚀 $T ROCKETING 5%— WILL BULLS CRACK $0.00510? 🟢
Entry: 0.00490-0.00496 ⚡
Target: 0.00505 🚀
Target: 0.00515 🚀
Target: 0.00530 🚀
Stop Loss: 0.00482 ⚠️
📊 The 5% surge ignited a fresh buying wave, swallowing the last liquidity pocket near 0.00490. 🦈 Smart money is now stacking orders, and the order block is holding firm as sellers scramble for footing. ⚡ Volume on the 1H chart is punching above its weight, signaling a bullish thrust that could punch through the 0.00510 barrier.
💡 Each target stacks a clean risk‑reward ladder, with the first aim at 0.00505 and the next milestones guiding the trade toward a potential 0.00530 climax. 📌 Keep eyes on the 0.00482 stop; a break there would flip the narrative to a rapid liquidity sweep. 🤔 Are you riding this momentum or waiting for the next liquidity trap? 👇
⚠️ Not financial advice. Always manage your risk. 🛡️
🏷️ #T #LongSetup #Breakout #Crypto
🚀 ⚡
🚀 $T ROCKETING 5%— WILL BULLS CRACK $0.00510? 🟢
Entry: 0.00490-0.00496 ⚡
Target: 0.00505 🚀
Target: 0.00515 🚀
Target: 0.00530 🚀
Stop Loss: 0.00482 ⚠️
📊 The 5% surge ignited a fresh buying wave, swallowing the last liquidity pocket near 0.00490. 🦈 Smart money is now stacking orders, and the order block is holding firm as sellers scramble for footing. ⚡ Volume on the 1H chart is punching above its weight, signaling a bullish thrust that could punch through the 0.00510 barrier.
💡 Each target stacks a clean risk‑reward ladder, with the first aim at 0.00505 and the next milestones guiding the trade toward a potential 0.00530 climax. 📌 Keep eyes on the 0.00482 stop; a break there would flip the narrative to a rapid liquidity sweep. 🤔 Are you riding this momentum or waiting for the next liquidity trap? 👇
⚠️ Not financial advice. Always manage your risk. 🛡️
🏷️ #T #LongSetup #Breakout #Crypto
🚀 ⚡
Entry: 0.00490-0.00496 ⚡
Target: 0.00505 🚀
Target: 0.00515 🚀
Target: 0.00530 🚀
Stop Loss: 0.00482 ⚠️
📊 The 5% surge ignited a fresh buying wave, swallowing the last liquidity pocket near 0.00490. 🦈 Smart money is now stacking orders, and the order block is holding firm as sellers scramble for footing. ⚡ Volume on the 1H chart is punching above its weight, signaling a bullish thrust that could punch through the 0.00510 barrier.
💡 Each target stacks a clean risk‑reward ladder, with the first aim at 0.00505 and the next milestones guiding the trade toward a potential 0.00530 climax. 📌 Keep eyes on the 0.00482 stop; a break there would flip the narrative to a rapid liquidity sweep. 🤔 Are you riding this momentum or waiting for the next liquidity trap? 👇
⚠️ Not financial advice. Always manage your risk. 🛡️
🏷️ #T #LongSetup #Breakout #Crypto
🚀 ⚡
31

·
--
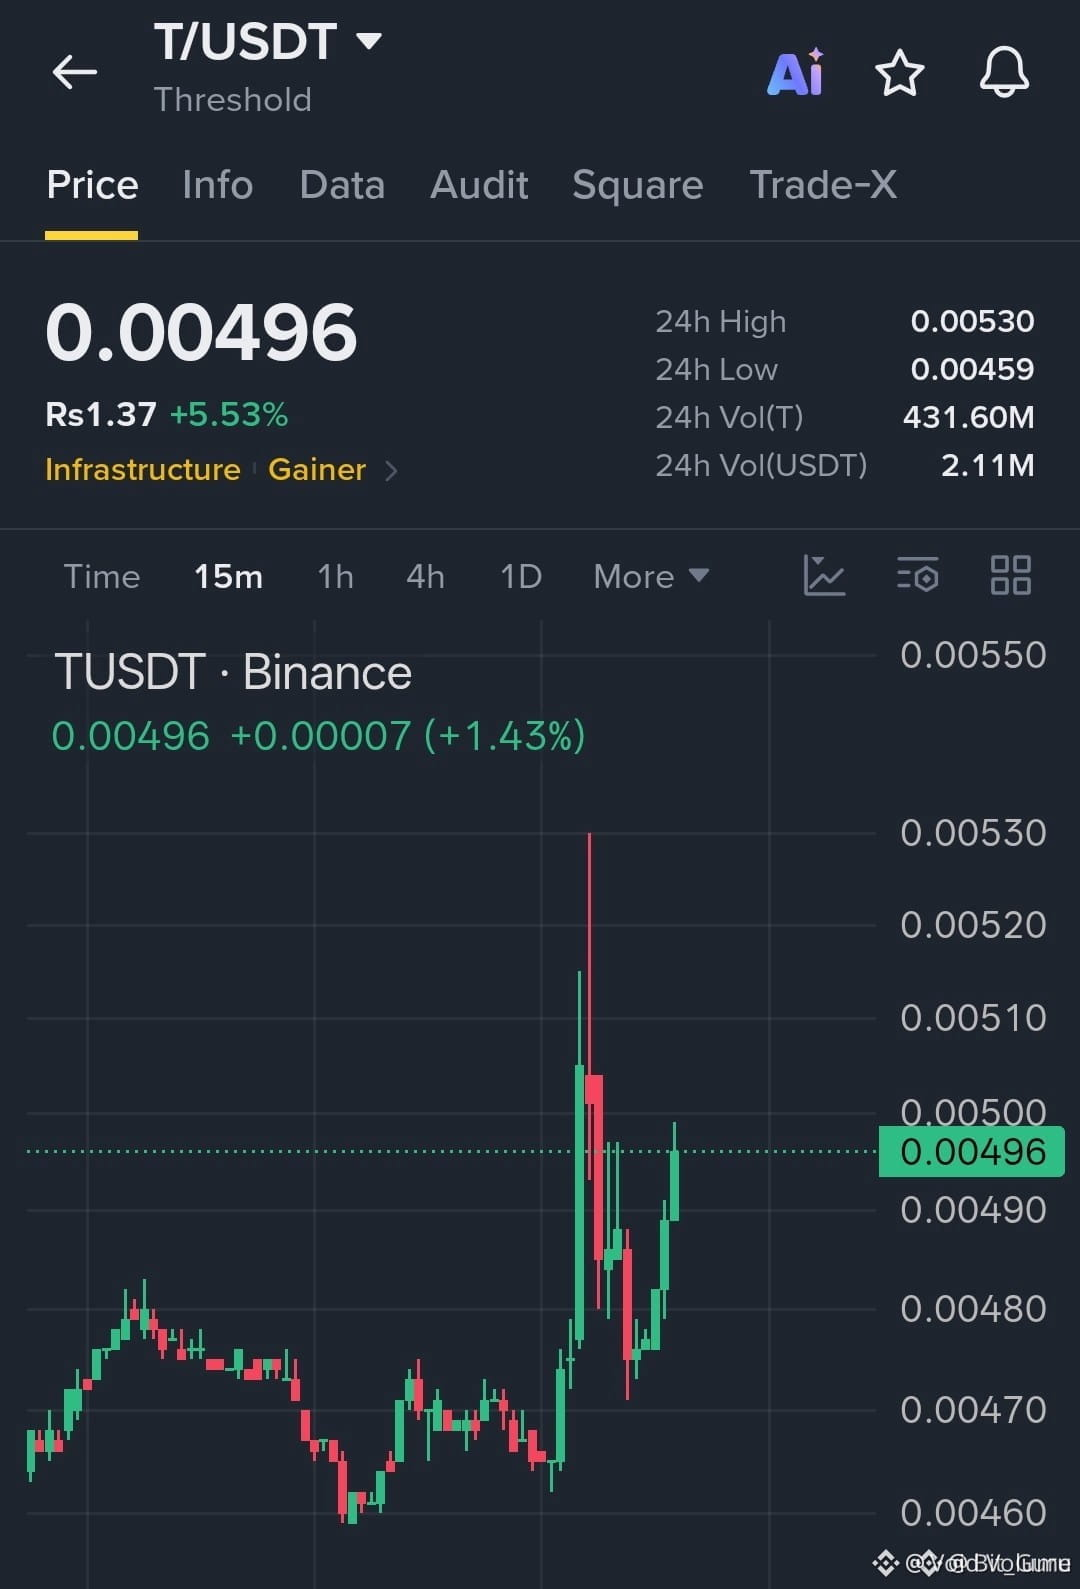
🚀 $T SURGES 5%—CAN BULLS BREAK $0.00510? 📈
Entry: 0.00490‑0.00496 ⚡
Target: 0.00530 🚀
Stop Loss: 0.00482 ⚠️
📊 The 0.00490‑0.00496 zone marks a fresh demand block that absorbed three aggressive sell‑offs on the 4H chart, signaling smart‑money accumulation. 🌊 Volume spikes align with a bullish order‑block retest, and the price is now eyeing the next liquidity pool near $0.00510. 💡 A clean break would unlock a cascade of stops above the recent swing high, feeding the upside thrust.
💬 Do you see the next liquidity sweep materializing above $0.00510, or will the market pull back into the demand zone? 👇
⚠️ Not financial advice. Always manage your risk. 🛡️
🏷️ #T #LongSetup #Breakout #SmartMoney #Crypto
🔥 💎
🚀 $T SURGES 5%—CAN BULLS BREAK $0.00510? 📈
Entry: 0.00490‑0.00496 ⚡
Target: 0.00530 🚀
Stop Loss: 0.00482 ⚠️
📊 The 0.00490‑0.00496 zone marks a fresh demand block that absorbed three aggressive sell‑offs on the 4H chart, signaling smart‑money accumulation. 🌊 Volume spikes align with a bullish order‑block retest, and the price is now eyeing the next liquidity pool near $0.00510. 💡 A clean break would unlock a cascade of stops above the recent swing high, feeding the upside thrust.
💬 Do you see the next liquidity sweep materializing above $0.00510, or will the market pull back into the demand zone? 👇
⚠️ Not financial advice. Always manage your risk. 🛡️
🏷️ #T #LongSetup #Breakout #SmartMoney #Crypto
🔥 💎
Entry: 0.00490‑0.00496 ⚡
Target: 0.00530 🚀
Stop Loss: 0.00482 ⚠️
📊 The 0.00490‑0.00496 zone marks a fresh demand block that absorbed three aggressive sell‑offs on the 4H chart, signaling smart‑money accumulation. 🌊 Volume spikes align with a bullish order‑block retest, and the price is now eyeing the next liquidity pool near $0.00510. 💡 A clean break would unlock a cascade of stops above the recent swing high, feeding the upside thrust.
💬 Do you see the next liquidity sweep materializing above $0.00510, or will the market pull back into the demand zone? 👇
⚠️ Not financial advice. Always manage your risk. 🛡️
🏷️ #T #LongSetup #Breakout #SmartMoney #Crypto
🔥 💎
3

Anyone else get it, fam!
$T hit a new high! It broke through the 24-hour high.
Current price: 0.00477. The previous high of 0.004704 is now behind us.
When things are going well, protecting your profits is harder than chasing gains. Do you think this move was driven by big money or retail investors?
#T
Just chatting—whether you win or lose, you have to own it yourself.
Anyone else get it, fam!
$T hit a new high! It broke through the 24-hour high.
Current price: 0.00477. The previous high of 0.004704 is now behind us.
When things are going well, protecting your profits is harder than chasing gains. Do you think this move was driven by big money or retail investors?
#T
Just chatting—whether you win or lose, you have to own it yourself.
$T hit a new high! It broke through the 24-hour high.
Current price: 0.00477. The previous high of 0.004704 is now behind us.
When things are going well, protecting your profits is harder than chasing gains. Do you think this move was driven by big money or retail investors?
#T
Just chatting—whether you win or lose, you have to own it yourself.
25

·
--
🔻 $T SHORT 🔻
Entry: 0.00469587 – 0.00472413
SL: 0.00484570
TP1: 0.00459369
TP2: 0.00451614
TP3: 0.00441921
📈 Technical Outlook:
$T is showing bearish pressure after losing strength near a key technical zone. The setup is supported by EMA trend is bearish, RSI supports bearish momentum, volume confirms stronger pressure. As long as price stays below the entry area, sellers may continue pushing toward the listed downside targets.
#T #Crypto #BinanceSquare #Trading
🔻 $T SHORT 🔻
Entry: 0.00469587 – 0.00472413
SL: 0.00484570
TP1: 0.00459369
TP2: 0.00451614
TP3: 0.00441921
📈 Technical Outlook:
$T is showing bearish pressure after losing strength near a key technical zone. The setup is supported by EMA trend is bearish, RSI supports bearish momentum, volume confirms stronger pressure. As long as price stays below the entry area, sellers may continue pushing toward the listed downside targets.
#T #Crypto #BinanceSquare #Trading
Entry: 0.00469587 – 0.00472413
SL: 0.00484570
TP1: 0.00459369
TP2: 0.00451614
TP3: 0.00441921
📈 Technical Outlook:
$T is showing bearish pressure after losing strength near a key technical zone. The setup is supported by EMA trend is bearish, RSI supports bearish momentum, volume confirms stronger pressure. As long as price stays below the entry area, sellers may continue pushing toward the listed downside targets.
#T #Crypto #BinanceSquare #Trading

6

·
--
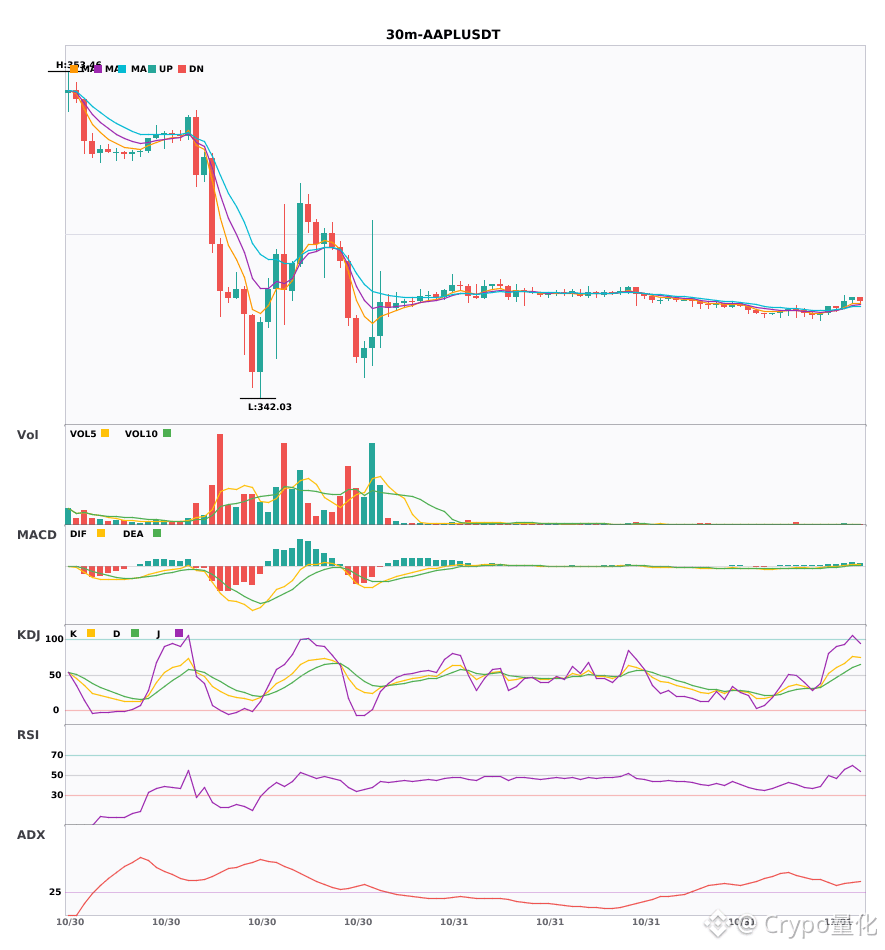
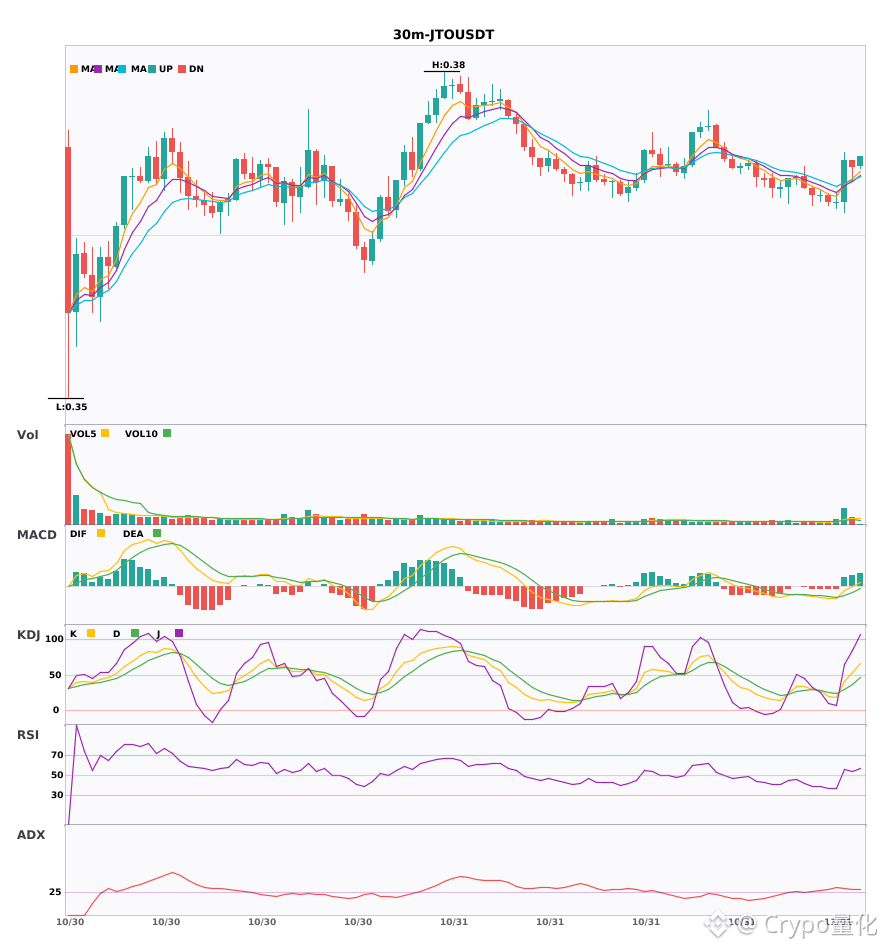
$AAPL / $JTO / $T 30-minute timeframe bullish bias, short-term confluence opportunity 🔥
════════════════════
🔴 $AAPL 30-minute bullish signal
⚠️ Technical analysis: ADX(36) indicates a clear trending market | MACD DIF crossed above the zero line, turning the trend bullish | EMA5 > EMA8 > EMA13, bullish alignment | KDJ is running strong, with bulls in control (K: 66.3, D: 52.9) | Volume increased (2.1x)
════════════════════
🔴 $JTO 30-minute bullish signal
⚠️ Technical analysis: ADX(32) indicates a clear trending market | MACD DIF crossed above the zero line, turning the trend bullish | Moving averages are converging and building momentum; a direction is likely to emerge soon | Volume surged (3.7x)
════════════════════
🔴 $T 30-minute bullish signal
⚠️ Technical analysis: ADX(31) indicates a clear trending market | MACD DIF crossed above the zero line, turning the trend bullish | EMA5 > EMA8 > EMA13, bullish alignment | KDJ is running strong, with bulls in control (K: 55.0, D: 50.7) | Volume surged (4.7x)
════════════════════
🔔 Follow for first-hand market movement alerts 🔔
#技术分析 #AAPL #JTO #T
📌 When trading, pay attention to whether the candlestick pattern matches
$AAPL / $JTO / $T 30-minute timeframe bullish bias, short-term confluence opportunity 🔥
════════════════════
🔴 $AAPL 30-minute bullish signal
⚠️ Technical analysis: ADX(36) indicates a clear trending market | MACD DIF crossed above the zero line, turning the trend bullish | EMA5 > EMA8 > EMA13, bullish alignment | KDJ is running strong, with bulls in control (K: 66.3, D: 52.9) | Volume increased (2.1x)
════════════════════
🔴 $JTO 30-minute bullish signal
⚠️ Technical analysis: ADX(32) indicates a clear trending market | MACD DIF crossed above the zero line, turning the trend bullish | Moving averages are converging and building momentum; a direction is likely to emerge soon | Volume surged (3.7x)
════════════════════
🔴 $T 30-minute bullish signal
⚠️ Technical analysis: ADX(31) indicates a clear trending market | MACD DIF crossed above the zero line, turning the trend bullish | EMA5 > EMA8 > EMA13, bullish alignment | KDJ is running strong, with bulls in control (K: 55.0, D: 50.7) | Volume surged (4.7x)
════════════════════
🔔 Follow for first-hand market movement alerts 🔔
#技术分析 #AAPL #JTO #T
📌 When trading, pay attention to whether the candlestick pattern matches
════════════════════
🔴 $AAPL 30-minute bullish signal
⚠️ Technical analysis: ADX(36) indicates a clear trending market | MACD DIF crossed above the zero line, turning the trend bullish | EMA5 > EMA8 > EMA13, bullish alignment | KDJ is running strong, with bulls in control (K: 66.3, D: 52.9) | Volume increased (2.1x)
════════════════════
🔴 $JTO 30-minute bullish signal
⚠️ Technical analysis: ADX(32) indicates a clear trending market | MACD DIF crossed above the zero line, turning the trend bullish | Moving averages are converging and building momentum; a direction is likely to emerge soon | Volume surged (3.7x)
════════════════════
🔴 $T 30-minute bullish signal
⚠️ Technical analysis: ADX(31) indicates a clear trending market | MACD DIF crossed above the zero line, turning the trend bullish | EMA5 > EMA8 > EMA13, bullish alignment | KDJ is running strong, with bulls in control (K: 55.0, D: 50.7) | Volume surged (4.7x)
════════════════════
🔔 Follow for first-hand market movement alerts 🔔
#技术分析 #AAPL #JTO #T
📌 When trading, pay attention to whether the candlestick pattern matches
1

Two 30-minute bullish signals appeared simultaneously: $T / $BR
📈 $T | 30-minute bullish signal
━━━━━━━━━━━━━━━━━━
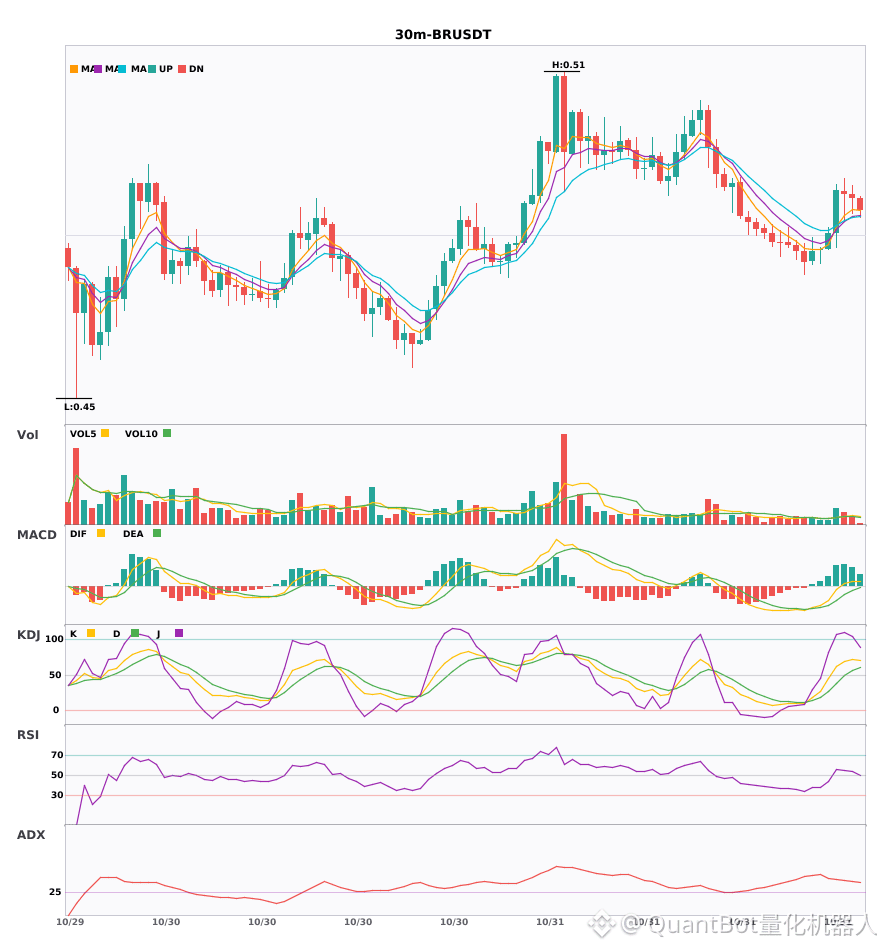
Technical analysis: ADX(31): clear trending market | MACD DIF broke above zero, trend turning bullish | EMA5 > EMA8 > EMA13: bullish alignment | KDJ showing strength, bulls in control (K at 55.0, D at 50.7) | Volume surge (4.7x)
Price change: 0.3700%
📈 $BR | 30-minute bullish signal
━━━━━━━━━━━━━━━━━━
Technical analysis: ADX(42): clear trending market | MACD DIF broke above zero, trend turning bullish | Moving averages converging and building momentum, direction about to be chosen | Volume increased (2.3x)
Price change: -0.1200%
━━━━━━━━━━━━━━━━━━
#技术分析 #T #BR
📌 The above is for reference only and does not constitute investment advice
Two 30-minute bullish signals appeared simultaneously: $T / $BR
📈 $T | 30-minute bullish signal
━━━━━━━━━━━━━━━━━━
Technical analysis: ADX(31): clear trending market | MACD DIF broke above zero, trend turning bullish | EMA5 > EMA8 > EMA13: bullish alignment | KDJ showing strength, bulls in control (K at 55.0, D at 50.7) | Volume surge (4.7x)
Price change: 0.3700%
📈 $BR | 30-minute bullish signal
━━━━━━━━━━━━━━━━━━
Technical analysis: ADX(42): clear trending market | MACD DIF broke above zero, trend turning bullish | Moving averages converging and building momentum, direction about to be chosen | Volume increased (2.3x)
Price change: -0.1200%
━━━━━━━━━━━━━━━━━━
#技术分析 #T #BR
📌 The above is for reference only and does not constitute investment advice
📈 $T | 30-minute bullish signal
━━━━━━━━━━━━━━━━━━
Technical analysis: ADX(31): clear trending market | MACD DIF broke above zero, trend turning bullish | EMA5 > EMA8 > EMA13: bullish alignment | KDJ showing strength, bulls in control (K at 55.0, D at 50.7) | Volume surge (4.7x)
Price change: 0.3700%
📈 $BR | 30-minute bullish signal
━━━━━━━━━━━━━━━━━━
Technical analysis: ADX(42): clear trending market | MACD DIF broke above zero, trend turning bullish | Moving averages converging and building momentum, direction about to be chosen | Volume increased (2.3x)
Price change: -0.1200%
━━━━━━━━━━━━━━━━━━
#技术分析 #T #BR
📌 The above is for reference only and does not constitute investment advice
30
·
--
$T / $BR 30-minute technical indicators are strengthening simultaneously. Which has greater explosive potential? 🔥
════════════════════
🔴 $T 30-minute bullish signal
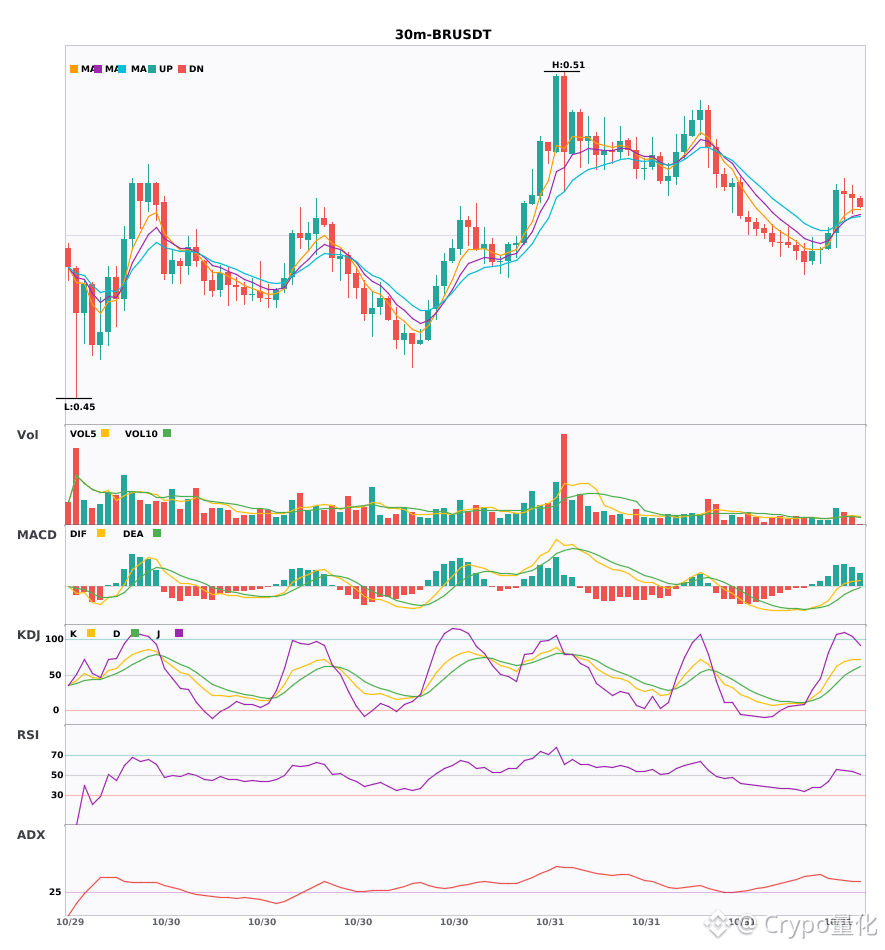
⚠️Technical analysis: ADX(31) Clear trending market | MACD DIF breaks above the zero line, trend turns bullish | EMA5 > EMA8 > EMA13 bullish alignment | KDJ running strong, bulls in control (K=55.0 D=50.7) | Volume surge (4.7x)
════════════════════
🔴 $BR 30-minute bullish signal
⚠️Technical analysis: ADX(42) Clear trending market | MACD DIF breaks above the zero line, trend turns bullish | Moving averages are converging, building momentum and about to choose a direction | Volume increases (2.3x)
════════════════════
🔔 Follow for the latest market movements 🔔
#技术分析 #T #BR
📌 When trading, pay attention to whether the candlestick patterns confirm
$T / $BR 30-minute technical indicators are strengthening simultaneously. Which has greater explosive potential? 🔥
════════════════════
🔴 $T 30-minute bullish signal
⚠️Technical analysis: ADX(31) Clear trending market | MACD DIF breaks above the zero line, trend turns bullish | EMA5 > EMA8 > EMA13 bullish alignment | KDJ running strong, bulls in control (K=55.0 D=50.7) | Volume surge (4.7x)
════════════════════
🔴 $BR 30-minute bullish signal
⚠️Technical analysis: ADX(42) Clear trending market | MACD DIF breaks above the zero line, trend turns bullish | Moving averages are converging, building momentum and about to choose a direction | Volume increases (2.3x)
════════════════════
🔔 Follow for the latest market movements 🔔
#技术分析 #T #BR
📌 When trading, pay attention to whether the candlestick patterns confirm
════════════════════
🔴 $T 30-minute bullish signal
⚠️Technical analysis: ADX(31) Clear trending market | MACD DIF breaks above the zero line, trend turns bullish | EMA5 > EMA8 > EMA13 bullish alignment | KDJ running strong, bulls in control (K=55.0 D=50.7) | Volume surge (4.7x)
════════════════════
🔴 $BR 30-minute bullish signal
⚠️Technical analysis: ADX(42) Clear trending market | MACD DIF breaks above the zero line, trend turns bullish | Moving averages are converging, building momentum and about to choose a direction | Volume increases (2.3x)
════════════════════
🔔 Follow for the latest market movements 🔔
#技术分析 #T #BR
📌 When trading, pay attention to whether the candlestick patterns confirm
27

·
--
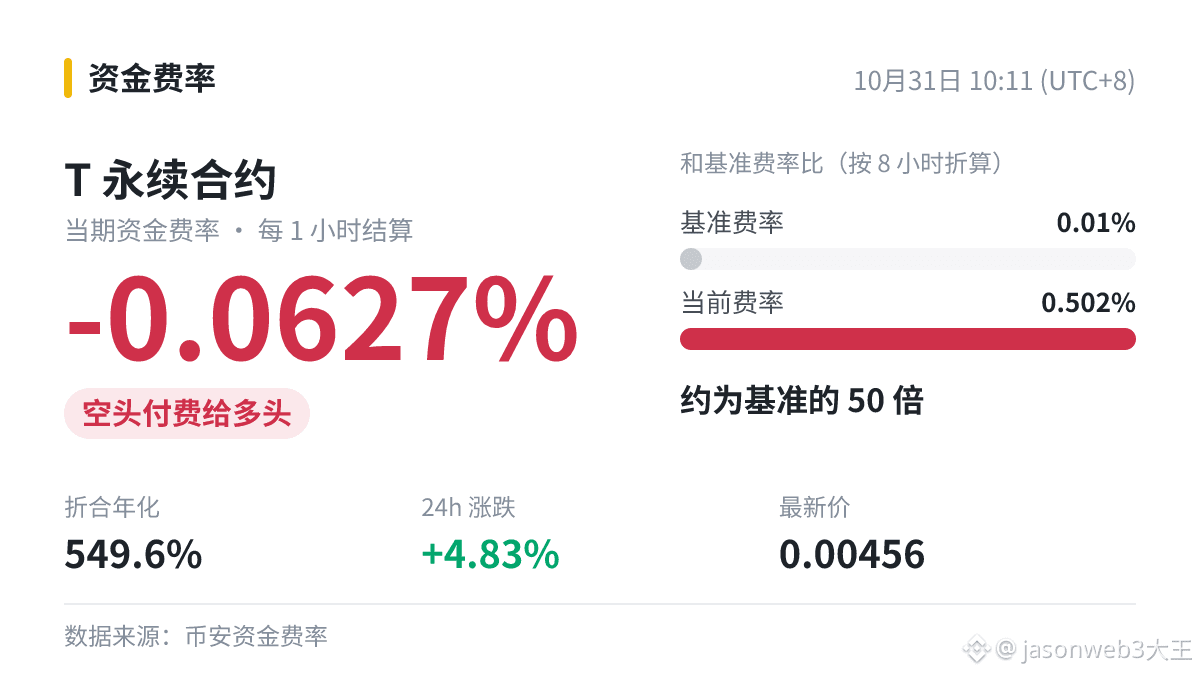
🗒️ $T Current funding rate: -0.0627% (settled every 1 hour). Shorts pay. Simply annualized based on this period, it’s approximately 549.6%.
[Glossary] What is a funding rate?
Funding fees are calculated by multiplying the notional value of a position by the rate: for a position with a notional value of 10,000 U, a rate of 0.01% means a fee of 1 U for each period.
The rate only indicates an imbalance between supply and demand in the futures market; it does not indicate the strength of spot buying.
The same reading can mean very different things under different market conditions, so don’t blindly apply a single rule of thumb.
#T
🗒️ $T Current funding rate: -0.0627% (settled every 1 hour). Shorts pay. Simply annualized based on this period, it’s approximately 549.6%.
[Glossary] What is a funding rate?
Funding fees are calculated by multiplying the notional value of a position by the rate: for a position with a notional value of 10,000 U, a rate of 0.01% means a fee of 1 U for each period.
The rate only indicates an imbalance between supply and demand in the futures market; it does not indicate the strength of spot buying.
The same reading can mean very different things under different market conditions, so don’t blindly apply a single rule of thumb.
#T
[Glossary] What is a funding rate?
Funding fees are calculated by multiplying the notional value of a position by the rate: for a position with a notional value of 10,000 U, a rate of 0.01% means a fee of 1 U for each period.
The rate only indicates an imbalance between supply and demand in the futures market; it does not indicate the strength of spot buying.
The same reading can mean very different things under different market conditions, so don’t blindly apply a single rule of thumb.
#T
41

·
--
$T Shorts are paying funding, with a rate of -0.0627% and an annualized rate of about 549.6%; 24h +4.57%.
In other words: so many people are short that they’re lining up, and the “toll” has even gone negative 🚇
No matter how large the liquidation amount is, it’s all in the past. What matters is how positions build up from here. Follow me for a few laughs while we watch the charts.
#T
$T Shorts are paying funding, with a rate of -0.0627% and an annualized rate of about 549.6%; 24h +4.57%.
In other words: so many people are short that they’re lining up, and the “toll” has even gone negative 🚇
No matter how large the liquidation amount is, it’s all in the past. What matters is how positions build up from here. Follow me for a few laughs while we watch the charts.
#T
In other words: so many people are short that they’re lining up, and the “toll” has even gone negative 🚇
No matter how large the liquidation amount is, it’s all in the past. What matters is how positions build up from here. Follow me for a few laughs while we watch the charts.
#T
42

·
--
$T Current funding rate: -0.0627% (settled every 1 hour); shorts pay.
Folks, what exactly is a funding rate? Here's the short version:
This money is settled between traders; it is not a fee charged by the exchange.
Funding rates for small-cap coins tend to fluctuate more. A high rate at one point doesn't necessarily indicate a trend, while extreme rates are less common for major coins.
Extreme readings often come with bigger price swings. In these situations, it's better to reduce your position rather than make a big bet.
#T
I may not be right, so don't take this as advice.
$T Current funding rate: -0.0627% (settled every 1 hour); shorts pay.
Folks, what exactly is a funding rate? Here's the short version:
This money is settled between traders; it is not a fee charged by the exchange.
Funding rates for small-cap coins tend to fluctuate more. A high rate at one point doesn't necessarily indicate a trend, while extreme rates are less common for major coins.
Extreme readings often come with bigger price swings. In these situations, it's better to reduce your position rather than make a big bet.
#T
I may not be right, so don't take this as advice.
Folks, what exactly is a funding rate? Here's the short version:
This money is settled between traders; it is not a fee charged by the exchange.
Funding rates for small-cap coins tend to fluctuate more. A high rate at one point doesn't necessarily indicate a trend, while extreme rates are less common for major coins.
Extreme readings often come with bigger price swings. In these situations, it's better to reduce your position rather than make a big bet.
#T
I may not be right, so don't take this as advice.
1


·
--
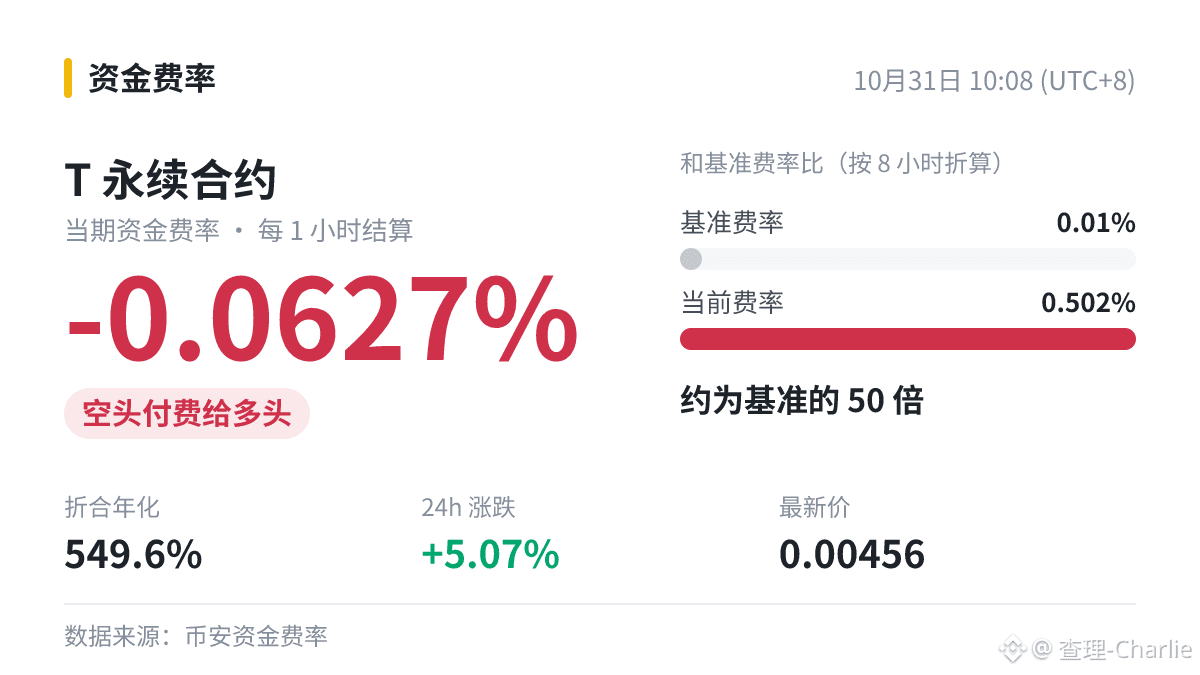
$T Funding rate: -0.0627% | Annualized: 549.6% | Current price: 0.00456
When the funding rate is extreme, opening a position in the same direction means piling into the most crowded trade. Think carefully before opening a position.
#T
$T Funding rate: -0.0627% | Annualized: 549.6% | Current price: 0.00456
When the funding rate is extreme, opening a position in the same direction means piling into the most crowded trade. Think carefully before opening a position.
#T
When the funding rate is extreme, opening a position in the same direction means piling into the most crowded trade. Think carefully before opening a position.
#T
20

·
--
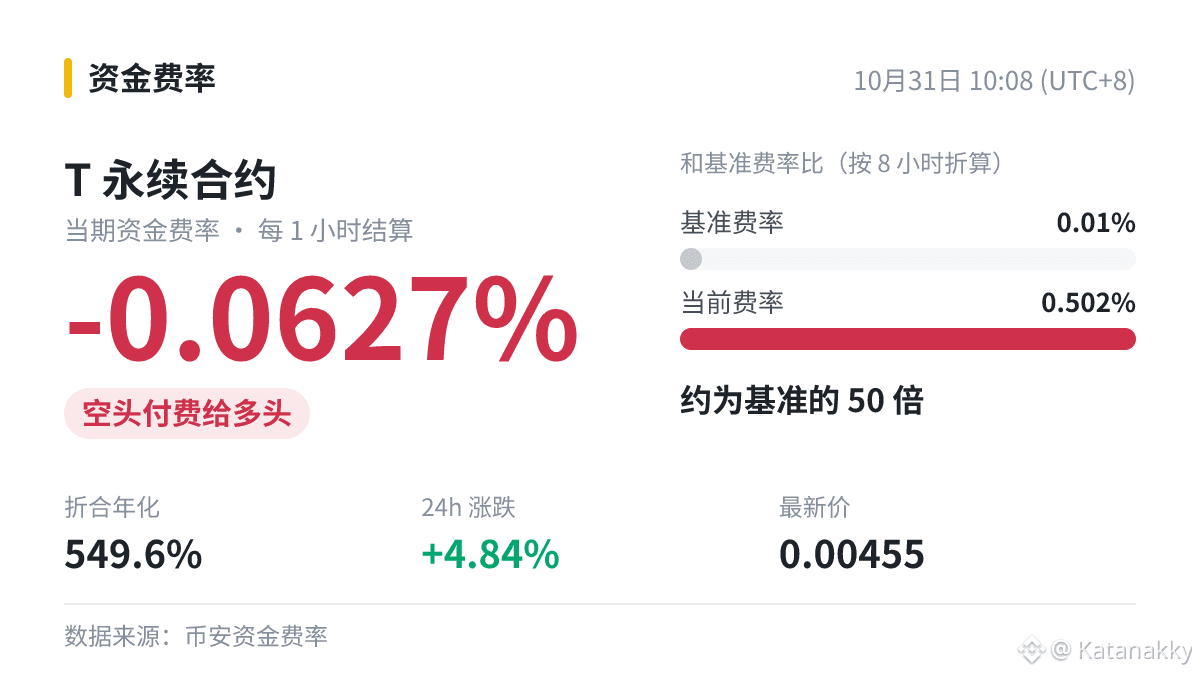
$T Shorts are paying, with a funding rate of -0.0627%.
Sentiment is picking up, but the money hasn’t followed. This kind of buzz often doesn’t last long.
#T
I can’t guarantee I’m right. Make your own decision.
$T Shorts are paying, with a funding rate of -0.0627%.
Sentiment is picking up, but the money hasn’t followed. This kind of buzz often doesn’t last long.
#T
I can’t guarantee I’m right. Make your own decision.
Sentiment is picking up, but the money hasn’t followed. This kind of buzz often doesn’t last long.
#T
I can’t guarantee I’m right. Make your own decision.
27

·
--
$T Funding rate dropped to -0.0627%🧊
Funding rates often return to normal as prices pull back. Until then, the crowded side should be more cautious with its positions. How long do you think this move can continue?
#T
$T Funding rate dropped to -0.0627%🧊
Funding rates often return to normal as prices pull back. Until then, the crowded side should be more cautious with its positions. How long do you think this move can continue?
#T
Funding rates often return to normal as prices pull back. Until then, the crowded side should be more cautious with its positions. How long do you think this move can continue?
#T
48

·
--
Don't scroll away—this unusual move may be related to your positions!
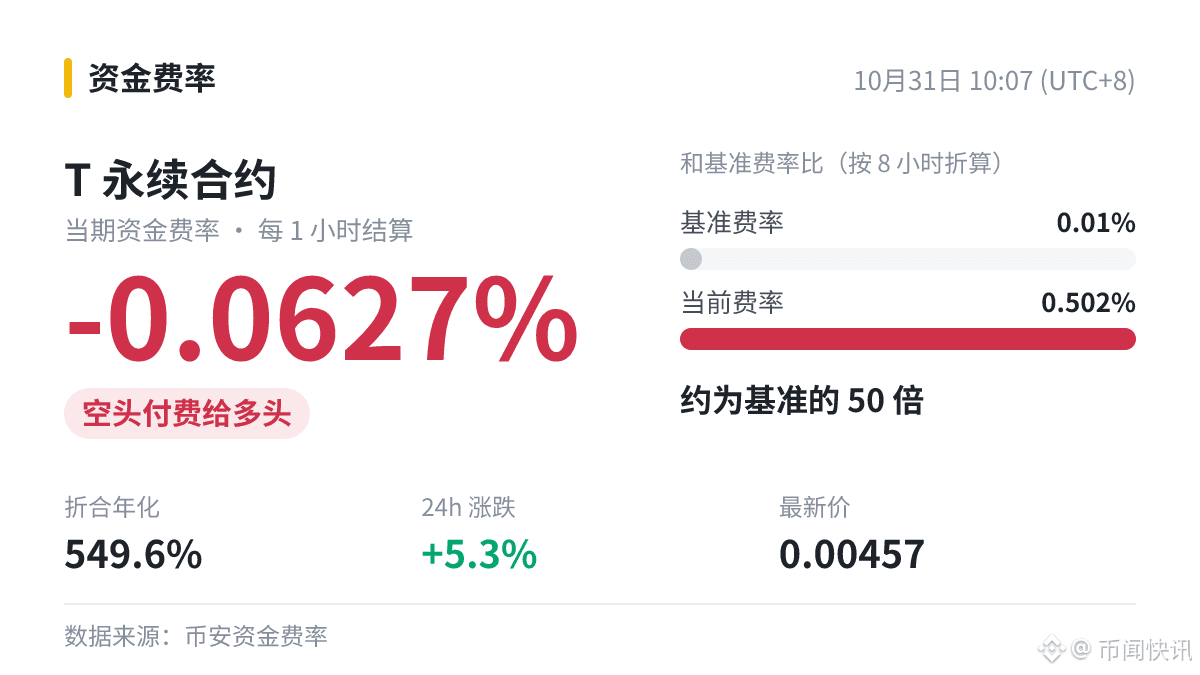
$T Funding rate: -0.0627% (shorts pay, approximately 549.6% annualized)!
No matter how wild the market gets, set your stop-loss first.
#T
Don't scroll away—this unusual move may be related to your positions!
$T Funding rate: -0.0627% (shorts pay, approximately 549.6% annualized)!
No matter how wild the market gets, set your stop-loss first.
#T
$T Funding rate: -0.0627% (shorts pay, approximately 549.6% annualized)!
No matter how wild the market gets, set your stop-loss first.
#T
13

·
--
🐋 $T Funding rate -0.0511% (shorts pay, approximately 447.2% annualized).
Shorts are piling in. Opening a position in the same direction when the funding rate is extreme means joining the most crowded trade—think carefully before entering.
#T
🐋 $T Funding rate -0.0511% (shorts pay, approximately 447.2% annualized).
Shorts are piling in. Opening a position in the same direction when the funding rate is extreme means joining the most crowded trade—think carefully before entering.
#T
Shorts are piling in. Opening a position in the same direction when the funding rate is extreme means joining the most crowded trade—think carefully before entering.
#T
66
Log in to explore more content
Join global crypto users on Binance Square
⚡️ Get latest and useful information about crypto.
💬 Trusted by the world’s largest crypto exchange.
👍 Discover real insights from verified creators.
Email / Phone number
Trending Topics
1
#WithdrawalsBack: 15 networks live
126 views
14 Discussing
2
#BinanceUpdatesProofofReservesAddresses
29,176 views
692 Discussing
3
#BinanceToResumePhaseOneOfWithdrawals
60,885 views
965 Discussing
4
#BinanceHadAlreadyCovered$6BofHackLoss
4,570 views
93 Discussing
5
#FBIConfirmsNorthKoreaIsResponsibleForBinanceCryptoHack
28,970 views
108 Discussing
6
#BinanceSAFUFundTransferCompleted7499BTC
133,612 views
1,811 Discussing
7
#CZDismissesClaimsBinanceHackWasPredicted
23,600 views
400 Discussing
8
#BinanceRecovery90% of stolen assets
264,726 views
255 Discussing
9
#B14gReportsUnauthorizedTransferOfAbout97MCORE
8,590 views
149 Discussing
10
#USSpotETHETFsPost23StraightDaysOfNetOutflows
7,762 views
125 Discussing