Binance Square
CRYPTO KING 44
26 Публикации

CRYPTO KING 44

4 подписок(и/а)
4 подписчиков(а)
14 понравилось
Посты
·
--
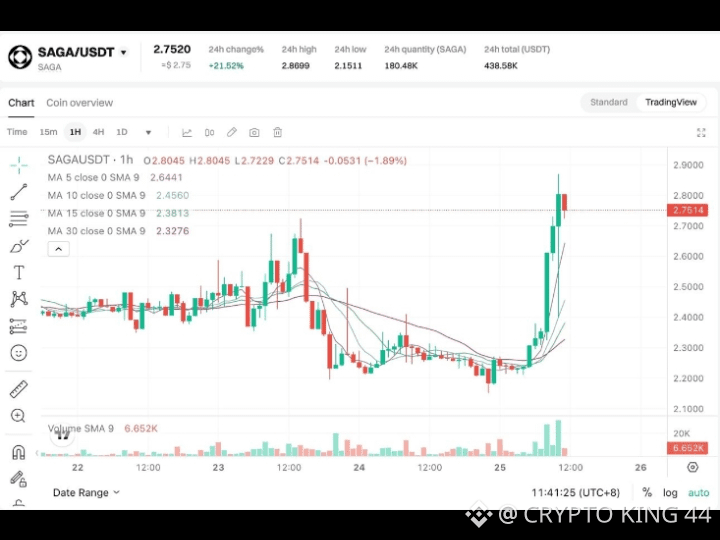
$SAGA SAGA/USDC — Latest Analysis Current price: around $0.014. Recent data shows SAGA under selling pressure, with daily technical signals largely bearish. � Investing.com +1 📉 Key levels Support: $0.0135 → $0.0130 Resistance: $0.0142 → $0.0145 Major resistance: ~$0.0150–$0.0153 Bullish only if: price breaks and holds above $0.0145–$0.0150 Bearish if: $0.0135 breaks → possible move toward $0.0130 or lower. � CoinMarketCap +1 🔎 My view Short term: Bearish/weak. RSI is below 50 and most moving averages remain above price, indicating sellers still have control. � Investing.com Trading idea: Don't chase a long at the current level. A stronger setup would be a confirmed breakout above $0.0145–$0.0150, while losing $0.0135 increases downside risk. *Not financial advice; SAGA is highly volatile.* {future}(SAGAUSDT) #US10YTreasuryYieldHitsHighestSinceNov2023 #IranSaysReadyToEscalateWarWithUS #USContinuingJoblessClaims1.774M #AppleDebutsFoldablePhone
$SAGA SAGA/USDC — Latest Analysis
Current price: around $0.014. Recent data shows SAGA under selling pressure, with daily technical signals largely bearish. �
Investing.com +1
📉 Key levels
Support: $0.0135 → $0.0130
Resistance: $0.0142 → $0.0145
Major resistance: ~$0.0150–$0.0153
Bullish only if: price breaks and holds above $0.0145–$0.0150
Bearish if: $0.0135 breaks → possible move toward $0.0130 or lower. �
CoinMarketCap +1
🔎 My view
Short term: Bearish/weak.
RSI is below 50 and most moving averages remain above price, indicating sellers still have control. �
Investing.com
Trading idea: Don't chase a long at the current level. A stronger setup would be a confirmed breakout above $0.0145–$0.0150, while losing $0.0135 increases downside risk.
*Not financial advice; SAGA is highly volatile.*
#US10YTreasuryYieldHitsHighestSinceNov2023 #IranSaysReadyToEscalateWarWithUS #USContinuingJoblessClaims1.774M #AppleDebutsFoldablePhone
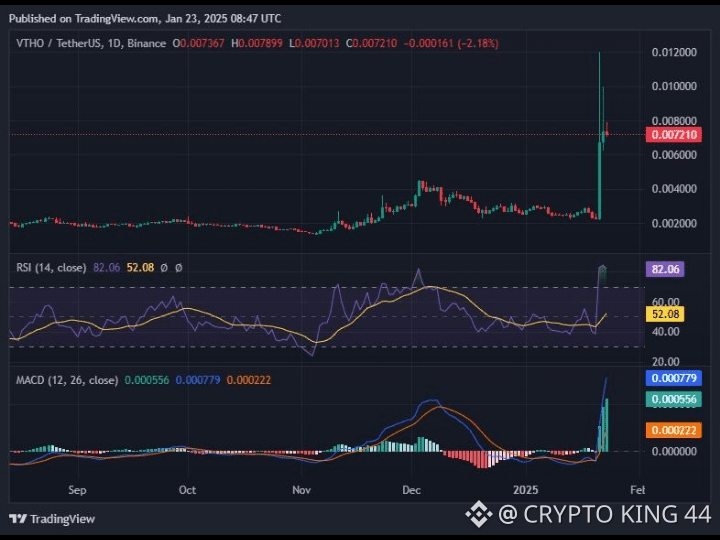
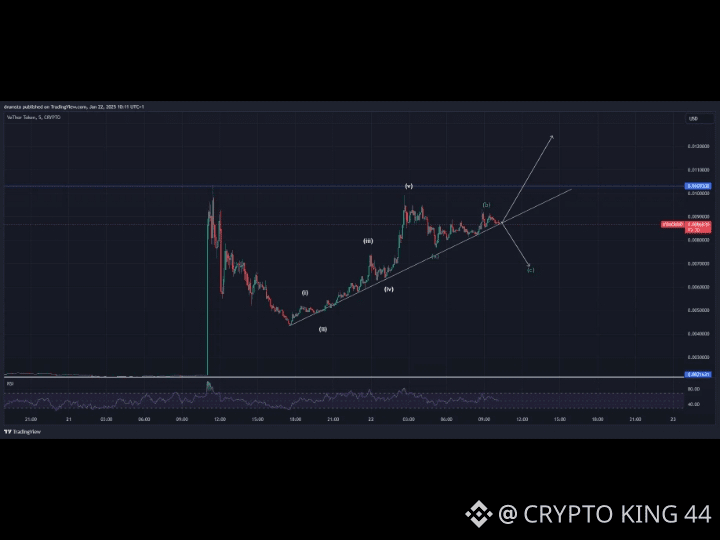
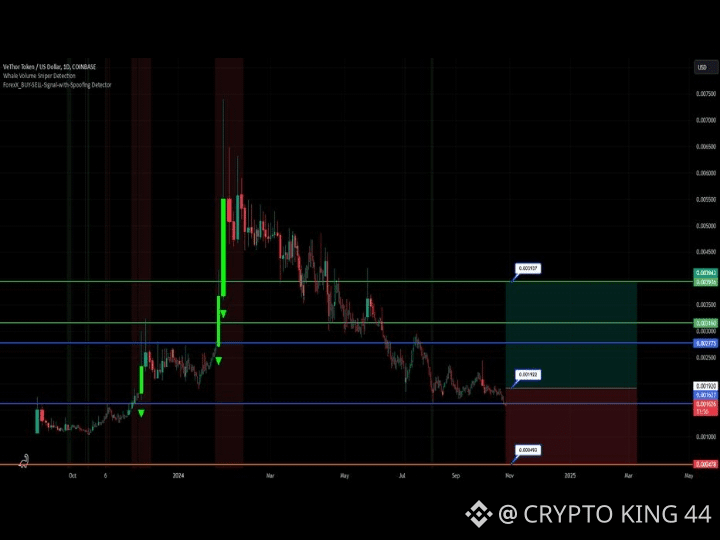
$VTHO VTHO/USDC — Latest Technical View VeThor (VTHO) is the gas/utility token of the VeChain ecosystem. For VTHO/USDC, I’d treat the setup as high-volatility and confirmation-dependent rather than chase a move. 📊 Current technical outlook Bias: Neutral → cautiously bullish only if resistance breaks with volume Key resistance: watch the most recent swing high on your exchange chart. Key support: the latest higher-low / consolidation floor. Bullish trigger: daily candle closes above resistance + increasing volume. Bearish trigger: loss of the latest daily support, especially with strong selling volume. Momentum: VTHO historically makes very sharp percentage moves, so false breakouts are common. A previous VTHO/USDC analysis showed the importance of volume and momentum confirmation; VTHO has also demonstrated large spikes followed by rapid retracements. 🎯 Trading scenarios 🟢 Bull case If VTHO breaks its recent resistance and holds it as support, the next move can be substantially higher. I would look for volume expansion + a successful retest before entering. 🔴 Bear case If support fails, avoid assuming the first dip is a buy. VTHO can retrace aggressively after failed breakouts. 🟡 Best setup Rather than entering in the middle of the range, wait for either: Breakout → retest → long, or Support sweep → recovery → long. ⚠️ Important: I couldn't verify a reliable live VTHO/USDC quote from the freshest indexed sources, so I don't want to invent a current price or exact entry/TP levels. If you send me a VTHO/USDC screenshot from your exchange (15m, 1H or 4H), I can mark the exact entry, stop-loss, TP1/TP2/TP3 and bullish/bearish levels on it. {spot}(VTHOUSDT) #BankOfAmericaGroupPilotsUSBDCStablecoin #USADPWeeklyEmploymentRises12000 #IranSaysReadyToEscalateWarWithUS
$VTHO VTHO/USDC — Latest Technical View
VeThor (VTHO) is the gas/utility token of the VeChain ecosystem. For VTHO/USDC, I’d treat the setup as high-volatility and confirmation-dependent rather than chase a move.
📊 Current technical outlook
Bias: Neutral → cautiously bullish only if resistance breaks with volume
Key resistance: watch the most recent swing high on your exchange chart.
Key support: the latest higher-low / consolidation floor.
Bullish trigger: daily candle closes above resistance + increasing volume.
Bearish trigger: loss of the latest daily support, especially with strong selling volume.
Momentum: VTHO historically makes very sharp percentage moves, so false breakouts are common.
A previous VTHO/USDC analysis showed the importance of volume and momentum confirmation; VTHO has also demonstrated large spikes followed by rapid retracements.
🎯 Trading scenarios
🟢 Bull case If VTHO breaks its recent resistance and holds it as support, the next move can be substantially higher. I would look for volume expansion + a successful retest before entering.
🔴 Bear case If support fails, avoid assuming the first dip is a buy. VTHO can retrace aggressively after failed breakouts.
🟡 Best setup Rather than entering in the middle of the range, wait for either:
Breakout → retest → long, or
Support sweep → recovery → long.
⚠️ Important: I couldn't verify a reliable live VTHO/USDC quote from the freshest indexed sources, so I don't want to invent a current price or exact entry/TP levels. If you send me a VTHO/USDC screenshot from your exchange (15m, 1H or 4H), I can mark the exact entry, stop-loss, TP1/TP2/TP3 and bullish/bearish levels on it.
#BankOfAmericaGroupPilotsUSBDCStablecoin #USADPWeeklyEmploymentRises12000 #IranSaysReadyToEscalateWarWithUS
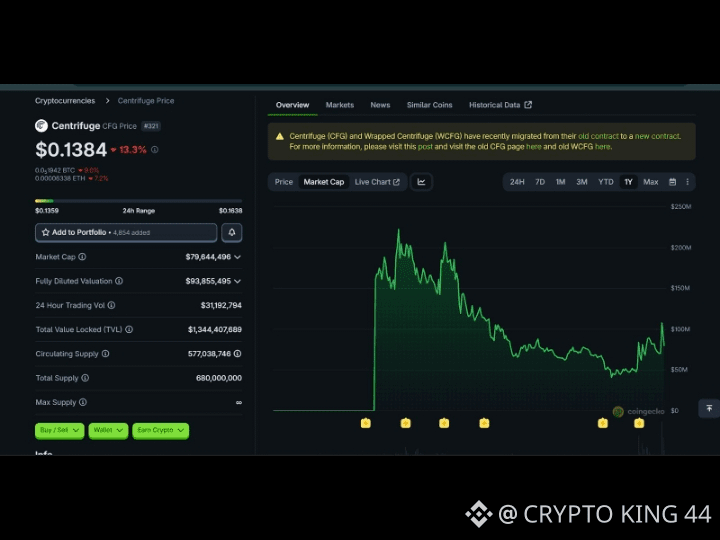
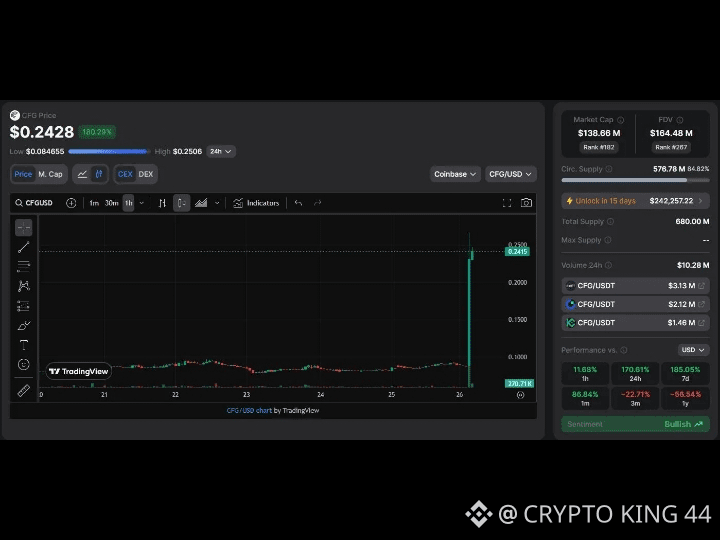
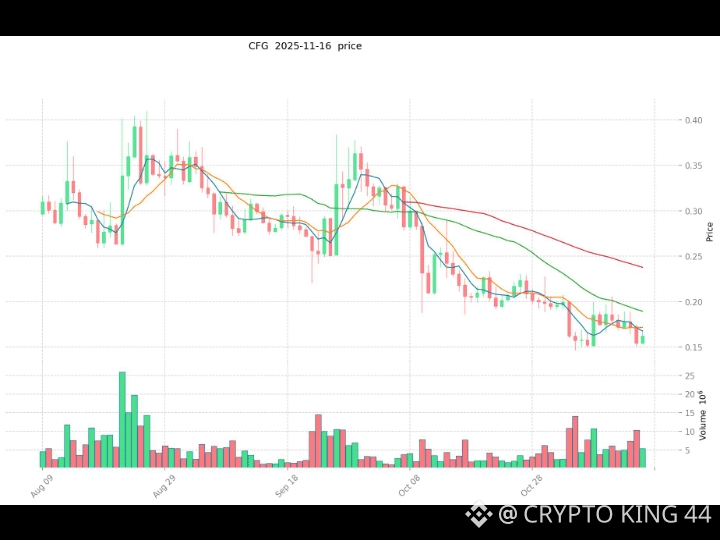
$CFG CFG/USDC — latest analysis Centrifuge (CFG) is currently trading around the $0.10–$0.11 USDC area. The latest CMC analysis had CFG at about $0.108, up 6.26% over 24h, with the move attributed mainly to renewed interest in the RWA (real-world assets) sector. � CoinMarketCap 📊 Technical picture Immediate support: $0.100 Major support: $0.095 First resistance: $0.120 Next resistance: $0.135–$0.140 Stronger resistance: $0.150 Bullish trigger: sustained daily close above $0.120 Bearish trigger: loss of $0.095 Recent price action shows a sharp pullback from roughly $0.158–$0.16 in late August to around $0.10–$0.11 in early September. � Investing.com Canada +1 🔥 My view Short term: cautiously bullish above $0.10. If CFG holds $0.10–$0.095 and breaks $0.12, I would look for: $0.12 → $0.135 → $0.15 A clean break above $0.15 would substantially improve the structure and could reopen the $0.18–$0.20 zone. Conversely, a daily close below $0.095 would weaken the setup and could send CFG toward $0.085–$0.09. The RWA narrative is an important catalyst, but the recent rally has not yet established a clear long-term uptrend. CMC's latest analysis similarly identifies $0.10 as the key level to hold and $0.12 as the near-term resistance. � CoinMarketCap Risk/reward: 🟢 Attractive above $0.10, but still high risk because CFG remains a relatively small-cap token. Trading bias: 0.095–0.100 support → 0.120 breakout → 0.135–0.150 targets This is market analysis, not financial advice. �  CoinMarketCap +1 {future}(CFGUSDT) #RussiaUkraineTradeStrikesKushnerWitkoffToKyiv #RussiaUkraine72-hourCeasefire
$CFG CFG/USDC — latest analysis
Centrifuge (CFG) is currently trading around the $0.10–$0.11 USDC area. The latest CMC analysis had CFG at about $0.108, up 6.26% over 24h, with the move attributed mainly to renewed interest in the RWA (real-world assets) sector. �
CoinMarketCap
📊 Technical picture
Immediate support: $0.100
Major support: $0.095
First resistance: $0.120
Next resistance: $0.135–$0.140
Stronger resistance: $0.150
Bullish trigger: sustained daily close above $0.120
Bearish trigger: loss of $0.095
Recent price action shows a sharp pullback from roughly $0.158–$0.16 in late August to around $0.10–$0.11 in early September. �
Investing.com Canada +1
🔥 My view
Short term: cautiously bullish above $0.10.
If CFG holds $0.10–$0.095 and breaks $0.12, I would look for:
$0.12 → $0.135 → $0.15
A clean break above $0.15 would substantially improve the structure and could reopen the $0.18–$0.20 zone.
Conversely, a daily close below $0.095 would weaken the setup and could send CFG toward $0.085–$0.09.
The RWA narrative is an important catalyst, but the recent rally has not yet established a clear long-term uptrend. CMC's latest analysis similarly identifies $0.10 as the key level to hold and $0.12 as the near-term resistance. �
CoinMarketCap
Risk/reward: 🟢 Attractive above $0.10, but still high risk because CFG remains a relatively small-cap token.
Trading bias: 0.095–0.100 support → 0.120 breakout → 0.135–0.150 targets
This is market analysis, not financial advice. � 
CoinMarketCap +1
#RussiaUkraineTradeStrikesKushnerWitkoffToKyiv #RussiaUkraine72-hourCeasefire
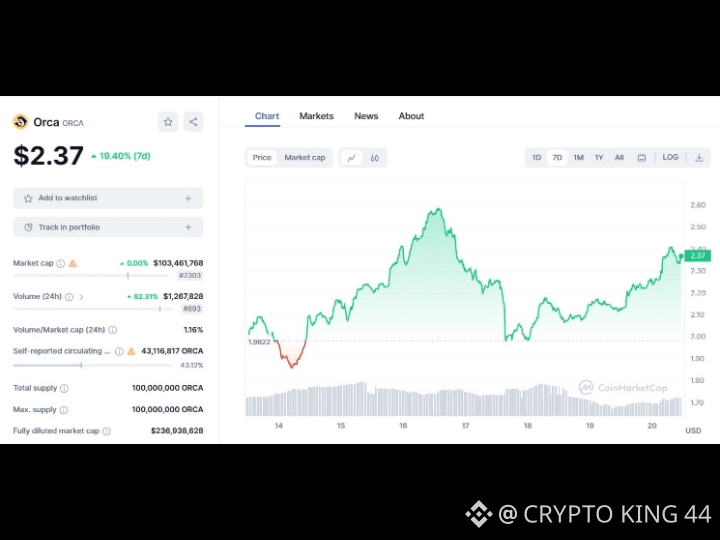
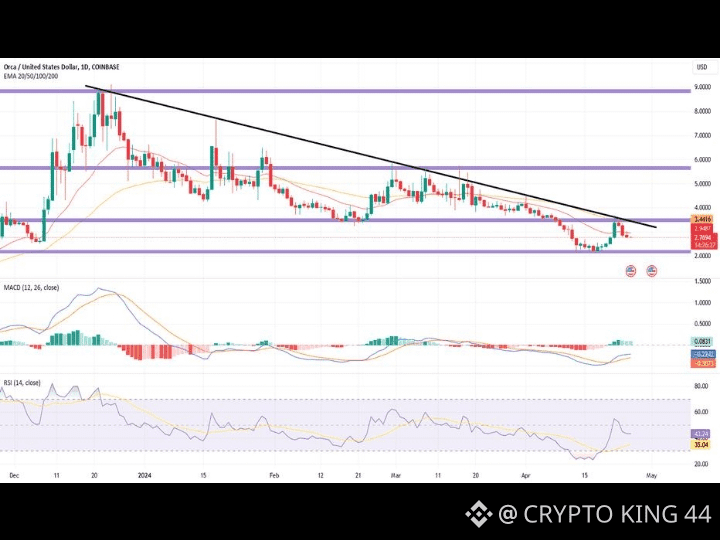
$ORCA ORCA/USDC — Latest Analysis Current setup: ORCA is showing strong bullish momentum. Current market data puts ORCA around $1.5–$1.7, with the exact quote varying by venue. CoinGecko reports a 24h range of roughly $1.30–$1.73, with volume surging dramatically. � CoinGecko 📈 Key levels Level Zone Meaning 🔴 Resistance 3 $2.17 Major upside target 🔴 Resistance 2 $1.93 Next breakout target 🔴 Resistance 1 $1.72–1.73 Immediate resistance 🟢 Support 1 $1.45–1.50 Important short-term hold 🟢 Support 2 $1.25–1.30 Deeper pullback support 🟢 Support 3 ~$1.06 Major structural support Recent analysis identifies $1.45 as short-term support and $1.72 as resistance, with a break above $1.72 potentially opening $1.93 and then $2.17. � CoinLore 🔥 Bullish scenario If ORCA/USDC closes convincingly above $1.72–$1.73 with strong volume, the next areas I'd watch are: $1.93 → $2.17 That would represent approximately +12% to +28% from $1.72. The momentum is notable: ORCA has gained roughly 31% over the last 7 days, while 24h volume has risen sharply. � CoinGecko ⚠️ Bearish scenario After such a rapid move, a pullback would not be surprising. Lose $1.45 → momentum weakens. Lose $1.25–1.30 → bullish structure becomes much less attractive. A break toward $1.06 would indicate a substantially deeper correction. 🎯 My read Short-term bias: 🟢 Bullish, but chasing is risky. The cleanest setup is either: A) breakout and successful retest of $1.72, or B) pullback toward $1.45–1.50 followed by bullish reversal. I would be cautious about entering after a vertical candle without confirmation. ORCA's recent volume expansion and its connection to growing activity around Orca's Solana liquidity/RWA ecosystem are positive catalysts, but crypto volatility remains very high. Orca has also been expanding into tokenized real-world assets, including a marketplace for regulated tokenized assets launched in May. � coindesk.com **Not financial advice — levels can change quickly in crypto.** {spot}(ORCAUSDT) #LululemonTumbles20%OnWeakGuidance
$ORCA ORCA/USDC — Latest Analysis
Current setup: ORCA is showing strong bullish momentum. Current market data puts ORCA around $1.5–$1.7, with the exact quote varying by venue. CoinGecko reports a 24h range of roughly $1.30–$1.73, with volume surging dramatically. �
CoinGecko
📈 Key levels
Level
Zone
Meaning
🔴 Resistance 3
$2.17
Major upside target
🔴 Resistance 2
$1.93
Next breakout target
🔴 Resistance 1
$1.72–1.73
Immediate resistance
🟢 Support 1
$1.45–1.50
Important short-term hold
🟢 Support 2
$1.25–1.30
Deeper pullback support
🟢 Support 3
~$1.06
Major structural support
Recent analysis identifies $1.45 as short-term support and $1.72 as resistance, with a break above $1.72 potentially opening $1.93 and then $2.17. �
CoinLore
🔥 Bullish scenario
If ORCA/USDC closes convincingly above $1.72–$1.73 with strong volume, the next areas I'd watch are:
$1.93 → $2.17
That would represent approximately +12% to +28% from $1.72.
The momentum is notable: ORCA has gained roughly 31% over the last 7 days, while 24h volume has risen sharply. �
CoinGecko
⚠️ Bearish scenario
After such a rapid move, a pullback would not be surprising.
Lose $1.45 → momentum weakens.
Lose $1.25–1.30 → bullish structure becomes much less attractive.
A break toward $1.06 would indicate a substantially deeper correction.
🎯 My read
Short-term bias: 🟢 Bullish, but chasing is risky.
The cleanest setup is either:
A) breakout and successful retest of $1.72, or
B) pullback toward $1.45–1.50 followed by bullish reversal.
I would be cautious about entering after a vertical candle without confirmation. ORCA's recent volume expansion and its connection to growing activity around Orca's Solana liquidity/RWA ecosystem are positive catalysts, but crypto volatility remains very high. Orca has also been expanding into tokenized real-world assets, including a marketplace for regulated tokenized assets launched in May. �
coindesk.com
**Not financial advice — levels can change quickly in crypto.**
#LululemonTumbles20%OnWeakGuidance
$ORCA ORCA/USDC — Latest Analysis Current setup: ORCA is showing strong bullish momentum. Current market data puts ORCA around $1.5–$1.7, with the exact quote varying by venue. CoinGecko reports a 24h range of roughly $1.30–$1.73, with volume surging dramatically. � CoinGecko 📈 Key levels Level Zone Meaning 🔴 Resistance 3 $2.17 Major upside target 🔴 Resistance 2 $1.93 Next breakout target 🔴 Resistance 1 $1.72–1.73 Immediate resistance 🟢 Support 1 $1.45–1.50 Important short-term hold 🟢 Support 2 $1.25–1.30 Deeper pullback support 🟢 Support 3 ~$1.06 Major structural support Recent analysis identifies $1.45 as short-term support and $1.72 as resistance, with a break above $1.72 potentially opening $1.93 and then $2.17. � CoinLore 🔥 Bullish scenario If ORCA/USDC closes convincingly above $1.72–$1.73 with strong volume, the next areas I'd watch are: $1.93 → $2.17 That would represent approximately +12% to +28% from $1.72. The momentum is notable: ORCA has gained roughly 31% over the last 7 days, while 24h volume has risen sharply. � CoinGecko ⚠️ Bearish scenario After such a rapid move, a pullback would not be surprising. Lose $1.45 → momentum weakens. Lose $1.25–1.30 → bullish structure becomes much less attractive. A break toward $1.06 would indicate a substantially deeper correction. 🎯 My read Short-term bias: 🟢 Bullish, but chasing is risky. The cleanest setup is either: A) breakout and successful retest of $1.72, or B) pullback toward $1.45–1.50 followed by bullish reversal. I would be cautious about entering after a vertical candle without confirmation. ORCA's recent volume expansion and its connection to growing activity around Orca's Solana liquidity/RWA ecosystem are positive catalysts, but crypto volatility remains very high. Orca has also been expanding into tokenized real-world assets, including a marketplace for regulated tokenized assets launched in May. � coindesk.com **Not financial advice — levels can change quickly in crypto.** {spot}(ORCAUSDT) #ORCAToken
$ORCA ORCA/USDC — Latest Analysis
Current setup: ORCA is showing strong bullish momentum. Current market data puts ORCA around $1.5–$1.7, with the exact quote varying by venue. CoinGecko reports a 24h range of roughly $1.30–$1.73, with volume surging dramatically. �
CoinGecko
📈 Key levels
Level
Zone
Meaning
🔴 Resistance 3
$2.17
Major upside target
🔴 Resistance 2
$1.93
Next breakout target
🔴 Resistance 1
$1.72–1.73
Immediate resistance
🟢 Support 1
$1.45–1.50
Important short-term hold
🟢 Support 2
$1.25–1.30
Deeper pullback support
🟢 Support 3
~$1.06
Major structural support
Recent analysis identifies $1.45 as short-term support and $1.72 as resistance, with a break above $1.72 potentially opening $1.93 and then $2.17. �
CoinLore
🔥 Bullish scenario
If ORCA/USDC closes convincingly above $1.72–$1.73 with strong volume, the next areas I'd watch are:
$1.93 → $2.17
That would represent approximately +12% to +28% from $1.72.
The momentum is notable: ORCA has gained roughly 31% over the last 7 days, while 24h volume has risen sharply. �
CoinGecko
⚠️ Bearish scenario
After such a rapid move, a pullback would not be surprising.
Lose $1.45 → momentum weakens.
Lose $1.25–1.30 → bullish structure becomes much less attractive.
A break toward $1.06 would indicate a substantially deeper correction.
🎯 My read
Short-term bias: 🟢 Bullish, but chasing is risky.
The cleanest setup is either:
A) breakout and successful retest of $1.72, or
B) pullback toward $1.45–1.50 followed by bullish reversal.
I would be cautious about entering after a vertical candle without confirmation. ORCA's recent volume expansion and its connection to growing activity around Orca's Solana liquidity/RWA ecosystem are positive catalysts, but crypto volatility remains very high. Orca has also been expanding into tokenized real-world assets, including a marketplace for regulated tokenized assets launched in May. �
coindesk.com
**Not financial advice — levels can change quickly in crypto.**
#ORCAToken
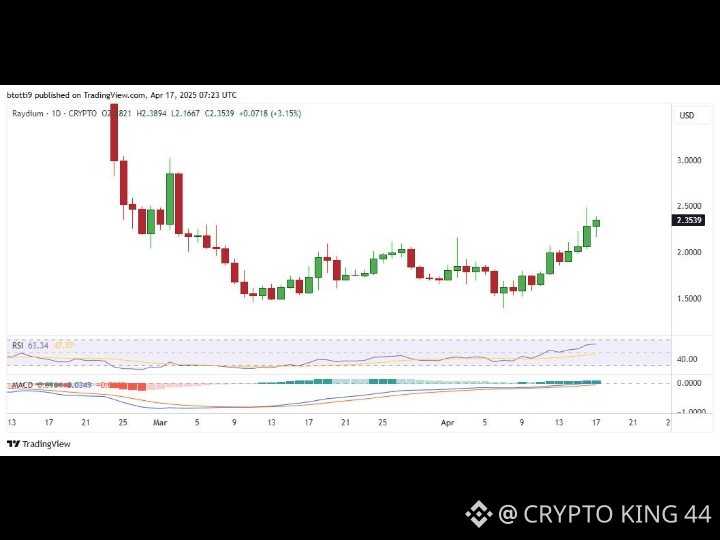
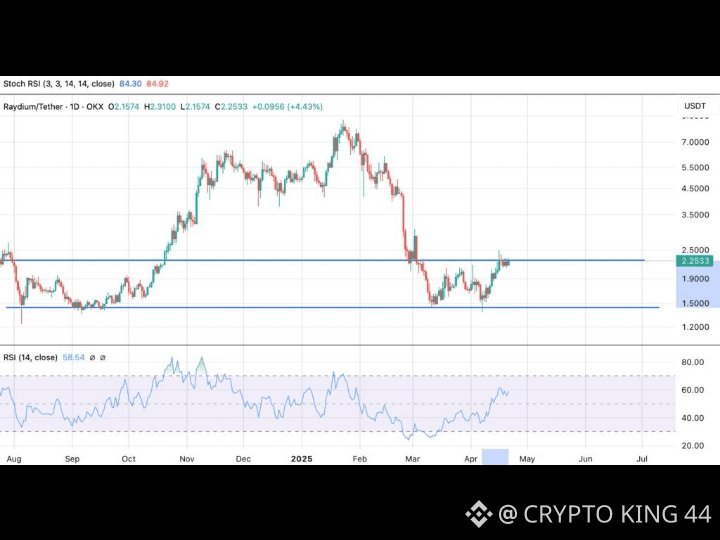
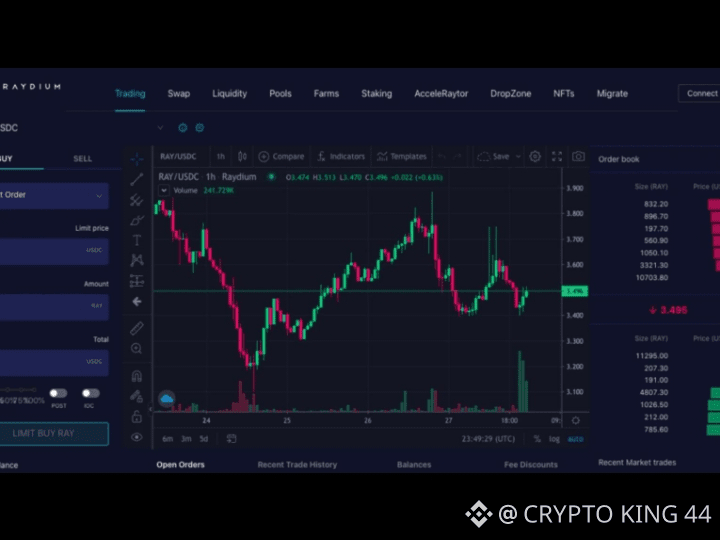
$RAY RAY/USDC — Latest Analysis 📊 Updated: September 6, 2026 The RAY/USDC pair on Raydium is showing a strong bullish move. The latest pair-specific data I found has RAY around $0.91 USDC, up about 10.4% over 24h, with roughly $4.48M TVL and $449K 24h volume in that pool. � WhatToFarm 🔥 Technical picture Level Zone Importance Resistance 1 $0.92–$0.95 Immediate breakout area Resistance 2 $1.00 Major psychological level Resistance 3 $1.15–$1.20 Strong upside target Support 1 $0.90 Current breakout area Support 2 $0.85–$0.82 Important pullback zone Support 3 $0.77–$0.80 Major structural support RAY has moved from around $0.62–$0.65 in mid-August to above $0.90, so the short-term trend has clearly improved. Historical data also shows consecutive advances from approximately $0.80 on Sept. 2 to $0.83 on Sept. 3, $0.82 on Sept. 4, and about $0.91 on Sept. 5. � CoinGecko +1 📈 Bullish scenario If RAY holds $0.90 and breaks $0.95 with strong volume: $0.95 → $1.00 → $1.15 → $1.20 A clean break above $1.20 would significantly strengthen the medium-term bullish structure. ⚠️ Bearish scenario If the current rally fails and RAY loses $0.90, I would watch: $0.85 → $0.82 → $0.78–$0.80 A sustained move below $0.78 would weaken the bullish setup considerably. 🎯 My view Short term: 🟢 Bullish, but extended. The important thing now is not to chase a vertical candle. A pullback that holds around $0.85–$0.90 would be healthier than immediately continuing higher. One caution: prices vary considerably between venues/pools right now. For example, the Raydium RAY/USDC pool was reported around $0.91, while Binance's RAY/USD data was showing a much higher intraday price, so check the exact exchange/pool before placing an order. � Investing.com Canada +1 Key level to watch: $0.90. Above it → bullish continuation remains favored. Below it → expect a possible retest of $0.85–$0.82. *This is technical analysis, not financial advice.* {spot}(RAYUSDT) #ZECHitsANewAllTimeHigh #ZECHitsANewAllTimeHigh #USAugustJobGrowthNearlyTriplesForecast
$RAY RAY/USDC — Latest Analysis 📊
Updated: September 6, 2026
The RAY/USDC pair on Raydium is showing a strong bullish move. The latest pair-specific data I found has RAY around $0.91 USDC, up about 10.4% over 24h, with roughly $4.48M TVL and $449K 24h volume in that pool. �
WhatToFarm
🔥 Technical picture
Level
Zone
Importance
Resistance 1
$0.92–$0.95
Immediate breakout area
Resistance 2
$1.00
Major psychological level
Resistance 3
$1.15–$1.20
Strong upside target
Support 1
$0.90
Current breakout area
Support 2
$0.85–$0.82
Important pullback zone
Support 3
$0.77–$0.80
Major structural support
RAY has moved from around $0.62–$0.65 in mid-August to above $0.90, so the short-term trend has clearly improved. Historical data also shows consecutive advances from approximately $0.80 on Sept. 2 to $0.83 on Sept. 3, $0.82 on Sept. 4, and about $0.91 on Sept. 5. �
CoinGecko +1
📈 Bullish scenario
If RAY holds $0.90 and breaks $0.95 with strong volume:
$0.95 → $1.00 → $1.15 → $1.20
A clean break above $1.20 would significantly strengthen the medium-term bullish structure.
⚠️ Bearish scenario
If the current rally fails and RAY loses $0.90, I would watch:
$0.85 → $0.82 → $0.78–$0.80
A sustained move below $0.78 would weaken the bullish setup considerably.
🎯 My view
Short term: 🟢 Bullish, but extended.
The important thing now is not to chase a vertical candle. A pullback that holds around $0.85–$0.90 would be healthier than immediately continuing higher.
One caution: prices vary considerably between venues/pools right now. For example, the Raydium RAY/USDC pool was reported around $0.91, while Binance's RAY/USD data was showing a much higher intraday price, so check the exact exchange/pool before placing an order. �
Investing.com Canada +1
Key level to watch: $0.90.
Above it → bullish continuation remains favored.
Below it → expect a possible retest of $0.85–$0.82.
*This is technical analysis, not financial advice.*
#ZECHitsANewAllTimeHigh #ZECHitsANewAllTimeHigh #USAugustJobGrowthNearlyTriplesForecast
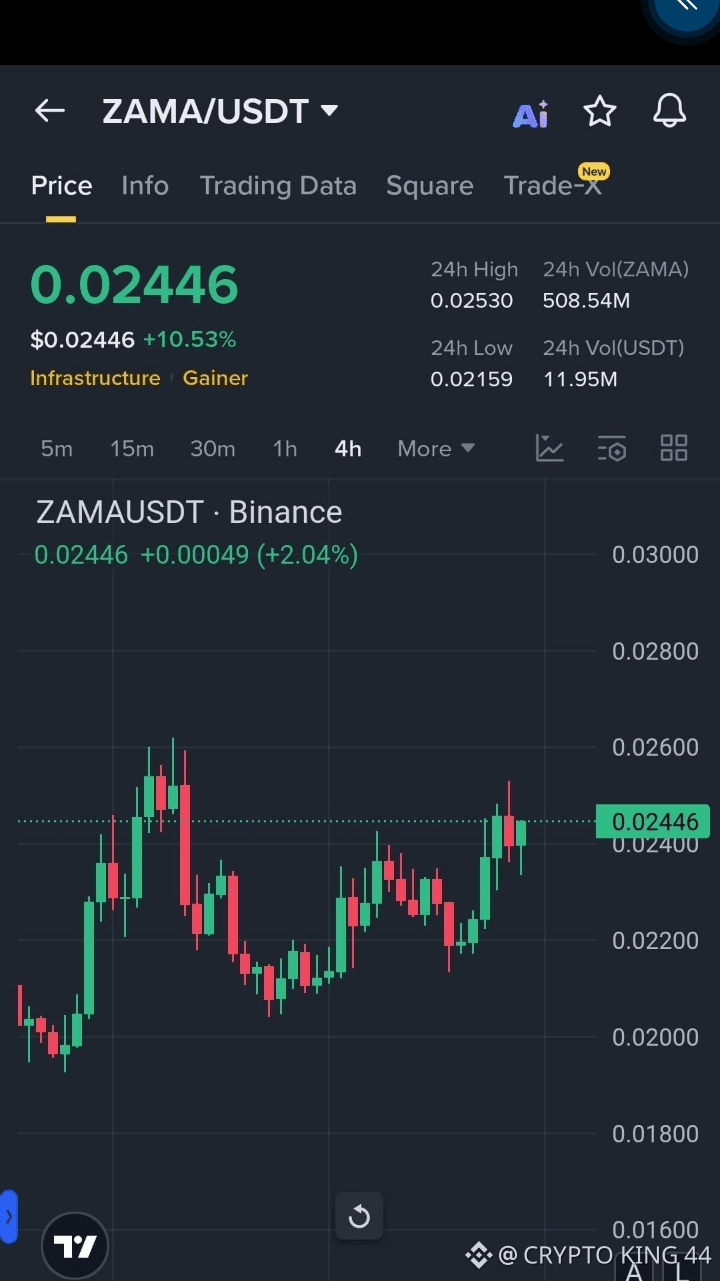
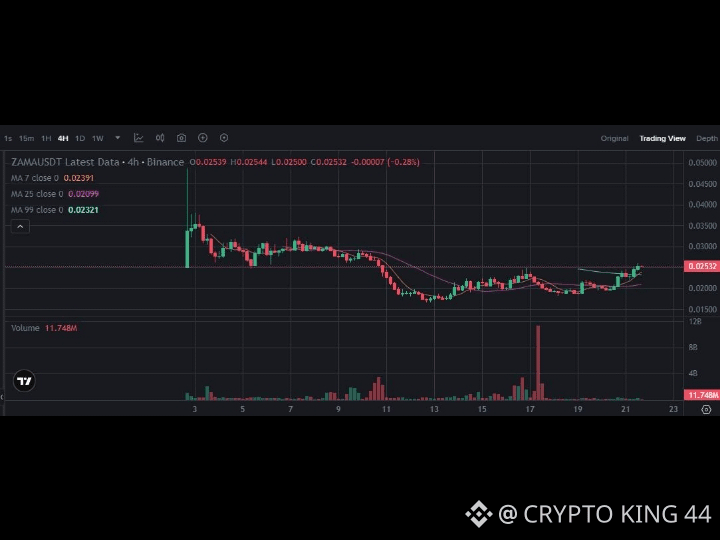
$ZAMA 📊 ZAMA/USDC — Latest Technical Analysis Latest market check: Binance is showing ZAMA/USDC around $0.05170, down about 1.26% on its latest quote. The quoted market cap is about $163M, with fully diluted valuation around $578M. � Binance There is significant exchange-to-exchange price variation at the moment: other major trackers are showing ZAMA around $0.052–$0.062, so the exact level on your exchange matters. � CoinMarketCap +2 📈 Key levels for ZAMA/USDC Zone Level View 🔴 Major resistance $0.066–0.067 Previous ATH area 🔴 Resistance $0.060–0.062 Breakout zone 🟡 Pivot $0.054–0.055 Needs to reclaim 🟢 Support $0.049–0.050 Important 🟢 Strong support $0.045–0.046 Next downside zone 🔵 Major support $0.040–0.042 Bigger correction area ZAMA's recent all-time high is approximately $0.066–$0.067, depending on the exchange/data source. � Bybit +1 🐂 Bullish setup If ZAMA/USDC holds $0.049–$0.050 and reclaims $0.055, I'd watch: $0.060 → $0.062 → $0.066–0.067 A decisive close above $0.067 would be a major bullish breakout and could put price discovery back in play. 🐻 Bearish setup If $0.049 breaks with strong volume, the next areas I'd watch are: $0.045 → $0.042 → $0.040 A sustained move below $0.040 would significantly damage the current bullish structure. 🎯 My view Short-term bias: cautiously bullish, but volatile. The important battle is $0.050–$0.055. Above $0.055, momentum can strengthen toward $0.060+. Below $0.049, I would become much more defensive. Zama's underlying thesis is its use of fully homomorphic encryption (FHE) for confidential blockchain computation, but ZAMA remains a highly volatile, relatively early-stage crypto asset. Supply/dilution and adoption are important risks. Not financial advice. Crypto prices can move very quickly, and the ZAMA/USDC quote on your particular exchange may differ from the figures above. {spot}(ZAMAUSDT) #ZEC'sMarketCapSurpassedDOGE #BitcoinETFsBiggestDailyInflowSinceJanuary #USAugustJobGrowthNearlyTriplesForecast #USAugustNonfarmPayrollsDueToday
$ZAMA 📊 ZAMA/USDC — Latest Technical Analysis
Latest market check: Binance is showing ZAMA/USDC around $0.05170, down about 1.26% on its latest quote. The quoted market cap is about $163M, with fully diluted valuation around $578M. �
Binance
There is significant exchange-to-exchange price variation at the moment: other major trackers are showing ZAMA around $0.052–$0.062, so the exact level on your exchange matters. �
CoinMarketCap +2
📈 Key levels for ZAMA/USDC
Zone
Level
View
🔴 Major resistance
$0.066–0.067
Previous ATH area
🔴 Resistance
$0.060–0.062
Breakout zone
🟡 Pivot
$0.054–0.055
Needs to reclaim
🟢 Support
$0.049–0.050
Important
🟢 Strong support
$0.045–0.046
Next downside zone
🔵 Major support
$0.040–0.042
Bigger correction area
ZAMA's recent all-time high is approximately $0.066–$0.067, depending on the exchange/data source. �
Bybit +1
🐂 Bullish setup
If ZAMA/USDC holds $0.049–$0.050 and reclaims $0.055, I'd watch:
$0.060 → $0.062 → $0.066–0.067
A decisive close above $0.067 would be a major bullish breakout and could put price discovery back in play.
🐻 Bearish setup
If $0.049 breaks with strong volume, the next areas I'd watch are:
$0.045 → $0.042 → $0.040
A sustained move below $0.040 would significantly damage the current bullish structure.
🎯 My view
Short-term bias: cautiously bullish, but volatile.
The important battle is $0.050–$0.055. Above $0.055, momentum can strengthen toward $0.060+. Below $0.049, I would become much more defensive.
Zama's underlying thesis is its use of fully homomorphic encryption (FHE) for confidential blockchain computation, but ZAMA remains a highly volatile, relatively early-stage crypto asset. Supply/dilution and adoption are important risks.
Not financial advice. Crypto prices can move very quickly, and the ZAMA/USDC quote on your particular exchange may differ from the figures above.
#ZEC'sMarketCapSurpassedDOGE #BitcoinETFsBiggestDailyInflowSinceJanuary #USAugustJobGrowthNearlyTriplesForecast #USAugustNonfarmPayrollsDueToday
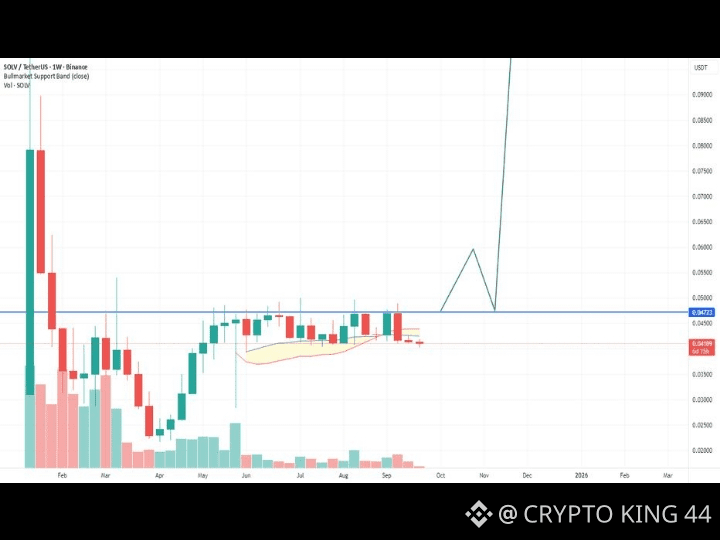
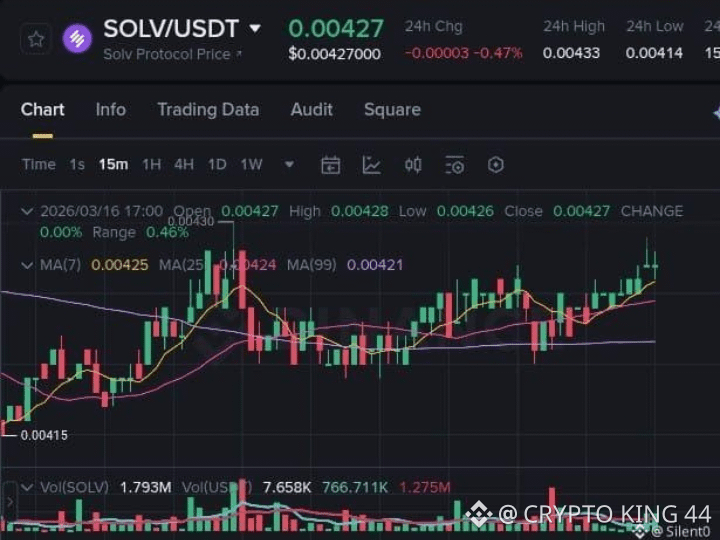
$SOLV SOLV/USDC — Latest Analysis Current price: around $0.00332 USDC, with SOLV recently up about 8.9% in 24h. CoinDesk currently lists the Binance SOLV/USDC pair at $0.003320. � CoinDesk 📊 Technical view Short-term: 🟢 Bullish 24h range: roughly $0.0029–$0.0036. � Investing.com India +1 Immediate resistance: $0.0036 Breakout target: $0.0040–$0.0042 Next resistance: $0.0045–$0.0050 Support: $0.0030–$0.0031 Major support: $0.0027–$0.0028 Critical floor: around $0.00215–$0.0022, near the recent August low. � CoinGecko 🔥 My setup Bullish scenario: If SOLV holds $0.0030–$0.0031 and breaks $0.0036 with strong volume, the next likely zone is $0.0040, followed by $0.0045–$0.0050. Bearish scenario: A rejection around $0.0036 followed by a loss of $0.0030 could send SOLV back toward $0.0027–$0.0028. Losing ~$0.0022 would significantly weaken the structure. SOLV has recovered substantially from its August all-time-low area, but it remains far below its January 2025 ATH of about $0.20, so this is still a highly speculative/high-volatility setup. � CoinGecko ⚠️ Risk: Solv Protocol recently suffered a reported $2.7M exploit related to a smart-contract flaw, which adds fundamental risk even if the chart is improving. � CoinGecko Overall: Bullish above $0.0030 → breakout watch at $0.0036 → $0.0040/$0.0045 possible. Below $0.0030, I'd become cautious. If you give me your entry price, I can calculate exact TP1 / TP2 / TP3 + stop-loss levels for SOLVUSDC. {spot}(SOLVUSDT) #ZECHitsANewAllTimeHigh #BitcoinETFsBiggestDailyInflowSinceJanuary #USAugustJobGrowthNearlyTriplesForecast #USAugustNonfarmPayrollsDueToday #BitcoinEthereumHitMultiMonthHighs
$SOLV SOLV/USDC — Latest Analysis
Current price: around $0.00332 USDC, with SOLV recently up about 8.9% in 24h. CoinDesk currently lists the Binance SOLV/USDC pair at $0.003320. �
CoinDesk
📊 Technical view
Short-term: 🟢 Bullish
24h range: roughly $0.0029–$0.0036. �
Investing.com India +1
Immediate resistance: $0.0036
Breakout target: $0.0040–$0.0042
Next resistance: $0.0045–$0.0050
Support: $0.0030–$0.0031
Major support: $0.0027–$0.0028
Critical floor: around $0.00215–$0.0022, near the recent August low. �
CoinGecko
🔥 My setup
Bullish scenario:
If SOLV holds $0.0030–$0.0031 and breaks $0.0036 with strong volume, the next likely zone is $0.0040, followed by $0.0045–$0.0050.
Bearish scenario:
A rejection around $0.0036 followed by a loss of $0.0030 could send SOLV back toward $0.0027–$0.0028. Losing ~$0.0022 would significantly weaken the structure.
SOLV has recovered substantially from its August all-time-low area, but it remains far below its January 2025 ATH of about $0.20, so this is still a highly speculative/high-volatility setup. �
CoinGecko
⚠️ Risk: Solv Protocol recently suffered a reported $2.7M exploit related to a smart-contract flaw, which adds fundamental risk even if the chart is improving. �
CoinGecko
Overall: Bullish above $0.0030 → breakout watch at $0.0036 → $0.0040/$0.0045 possible. Below $0.0030, I'd become cautious.
If you give me your entry price, I can calculate exact TP1 / TP2 / TP3 + stop-loss levels for SOLVUSDC.
#ZECHitsANewAllTimeHigh #BitcoinETFsBiggestDailyInflowSinceJanuary #USAugustJobGrowthNearlyTriplesForecast #USAugustNonfarmPayrollsDueToday #BitcoinEthereumHitMultiMonthHighs
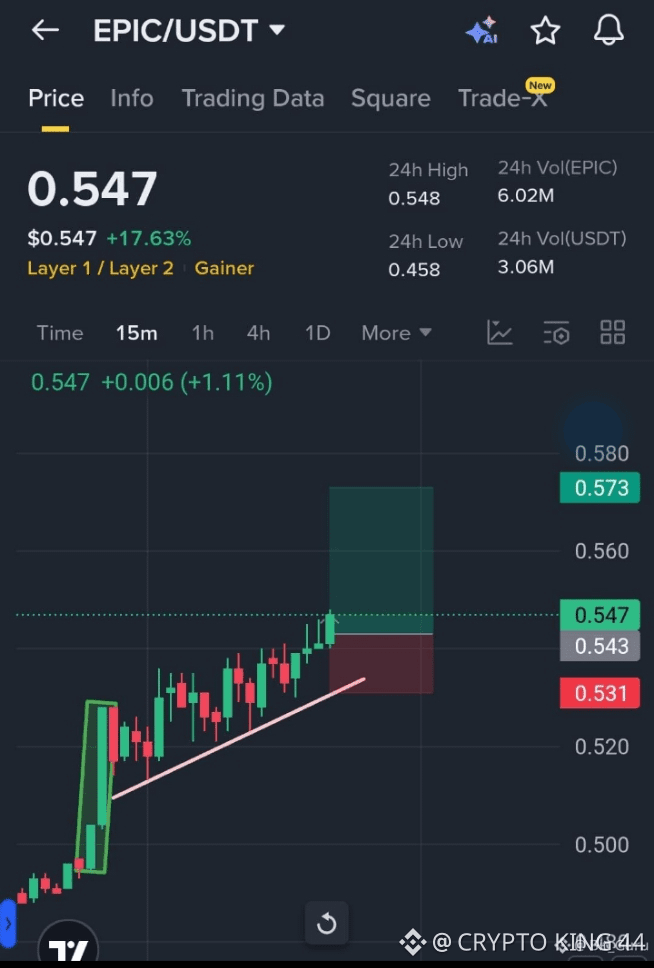
$EPIC 📊 EPIC/USD latest analysis Current price: around $0.40. CoinMarketCap reports EPIC up about 11.2% over 24 hours, with 24h volume around $16.3M, a substantial increase in trading activity. � CoinMarketCap Technical bias: 🟢 Bullish, but extended RSI: ~59–61 → bullish momentum without being extremely overbought. � Investing.com Canada +1 MACD: bullish. ADX: ~26 → trend has reasonable strength. Moving averages: price is above the 20, 50, 100 and 200-day averages, which is a constructive medium-term signal. � Investing.com Canada Volume: the recent breakout was accompanied by a major volume increase, making the move more convincing. � CoinMarketCap 🎯 Important levels Level Interpretation $0.45 🔴 Major near-term resistance $0.40–0.42 Current breakout/decision zone $0.38 🟢 Important support $0.35–0.36 Stronger support / breakout base $0.33 🔴 Bearish warning if lost CoinMarketCap's latest analysis specifically identifies $0.38 as the level EPIC needs to hold and $0.45 as the next important resistance. A move below $0.33 would weaken the bullish setup. � CoinMarketCap 🔮 My scenario Bullish: If EPIC holds $0.38–$0.40 and volume remains strong, a test of $0.45 is reasonable. A clean breakout above $0.45 could open the way toward higher resistance levels. Neutral: A pullback toward $0.35–$0.38 followed by consolidation would be healthy after the recent sharp rise. Bearish: Losing $0.35, particularly on heavy volume, would suggest the breakout is failing; below $0.33 the short-term bullish structure becomes much weaker. Overall: Bullish 7/10, but I would avoid chasing a large green candle. Waiting for either a successful retest around $0.38–$0.40 or a confirmed breakout above $0.45 gives a cleaner risk/reward setup. This is technical analysis, not financial advice. EPIC is a highly volatile crypto asset. {spot}(EPICUSDT) #ZECHitsANewAllTimeHigh #BitcoinETFsBiggestDailyInflowSinceJanuary #AdobeSharesFall3%OnCEOTransition #USAugustNonfarmPayrollsDueToday #USAugustAvgHourlyEarningsRise3.1%
$EPIC 📊 EPIC/USD latest analysis
Current price: around $0.40. CoinMarketCap reports EPIC up about 11.2% over 24 hours, with 24h volume around $16.3M, a substantial increase in trading activity. �
CoinMarketCap
Technical bias: 🟢 Bullish, but extended
RSI: ~59–61 → bullish momentum without being extremely overbought. �
Investing.com Canada +1
MACD: bullish.
ADX: ~26 → trend has reasonable strength.
Moving averages: price is above the 20, 50, 100 and 200-day averages, which is a constructive medium-term signal. �
Investing.com Canada
Volume: the recent breakout was accompanied by a major volume increase, making the move more convincing. �
CoinMarketCap
🎯 Important levels
Level
Interpretation
$0.45
🔴 Major near-term resistance
$0.40–0.42
Current breakout/decision zone
$0.38
🟢 Important support
$0.35–0.36
Stronger support / breakout base
$0.33
🔴 Bearish warning if lost
CoinMarketCap's latest analysis specifically identifies $0.38 as the level EPIC needs to hold and $0.45 as the next important resistance. A move below $0.33 would weaken the bullish setup. �
CoinMarketCap
🔮 My scenario
Bullish: If EPIC holds $0.38–$0.40 and volume remains strong, a test of $0.45 is reasonable. A clean breakout above $0.45 could open the way toward higher resistance levels.
Neutral: A pullback toward $0.35–$0.38 followed by consolidation would be healthy after the recent sharp rise.
Bearish: Losing $0.35, particularly on heavy volume, would suggest the breakout is failing; below $0.33 the short-term bullish structure becomes much weaker.
Overall: Bullish 7/10, but I would avoid chasing a large green candle. Waiting for either a successful retest around $0.38–$0.40 or a confirmed breakout above $0.45 gives a cleaner risk/reward setup.
This is technical analysis, not financial advice. EPIC is a highly volatile crypto asset.
#ZECHitsANewAllTimeHigh #BitcoinETFsBiggestDailyInflowSinceJanuary #AdobeSharesFall3%OnCEOTransition #USAugustNonfarmPayrollsDueToday #USAugustAvgHourlyEarningsRise3.1%
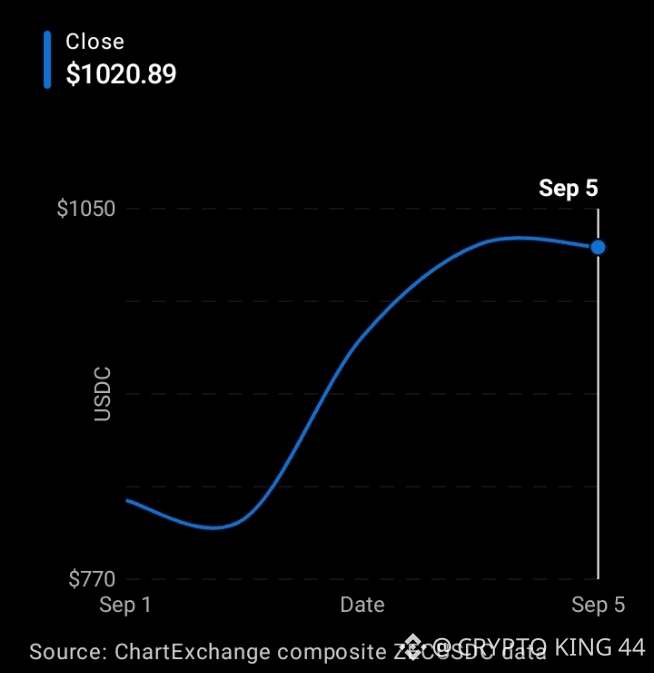
$ZEC ZECUSDC — recent daily price Daily closing prices from the latest available ZEC/USDC composite data. Close $1020.89 Source: ChartExchange composite ZECUSDC data 📈 Technical view Trend: Strongly bullish. ZEC gained roughly 25% from Sep 1 to Sep 5, with a particularly powerful breakout on Sep 3–4. � ChartExchange Resistance: $1,050 is the immediate key ceiling; ZEC reached $1,050 on Sep 4. A clean breakout could open $1,100–$1,150 psychologically/technically. Support: First area $1,000–$997, followed by $950–$953. Losing $950 would weaken the short-term structure considerably. Momentum: ZEC is extremely extended after the recent surge. TradingView shows approximately +7.27% over 1 week and +68.45% over 1 month for ZECUSDC. � TradingView Fundamental catalyst: ZEC recently broke above $1,000 for the first time in a decade, while reported spot-ETF inflows and institutional interest have strengthened the bullish narrative. � CoinMarketCap 🎯 My scenario map Bullish: Hold $1,000 → reclaim $1,050 → $1,100 / $1,150 Neutral: Consolidate between $950–$1,050 Bearish: Lose $950 → possible retracement toward $900–$930 Bias: 🟢 Bullish, but high-risk/overextended. I would be more comfortable with a confirmed breakout above $1,050 or a controlled pullback that holds $950–$1,000 than chasing a vertical candle here. This is market analysis, not financial advice. Crypto can move sharply in either direction. � ChartExchange +1 Open the live ZECUSDC chart on TradingView⁠� {spot}(ZECUSDT) #LululemonTumbles20%OnWeakGuidance #USAugustJobGrowthNearlyTriplesForecast #USAugustAvgHourlyEarningsRise3.1% #BitcoinETFsBiggestDailyInflowSinceJanuary
$ZEC ZECUSDC — recent daily price
Daily closing prices from the latest available ZEC/USDC composite data.
Close
$1020.89
Source: ChartExchange composite ZECUSDC data
📈 Technical view
Trend: Strongly bullish. ZEC gained roughly 25% from Sep 1 to Sep 5, with a particularly powerful breakout on Sep 3–4. �
ChartExchange
Resistance: $1,050 is the immediate key ceiling; ZEC reached $1,050 on Sep 4. A clean breakout could open $1,100–$1,150 psychologically/technically.
Support: First area $1,000–$997, followed by $950–$953. Losing $950 would weaken the short-term structure considerably.
Momentum: ZEC is extremely extended after the recent surge. TradingView shows approximately +7.27% over 1 week and +68.45% over 1 month for ZECUSDC. �
TradingView
Fundamental catalyst: ZEC recently broke above $1,000 for the first time in a decade, while reported spot-ETF inflows and institutional interest have strengthened the bullish narrative. �
CoinMarketCap
🎯 My scenario map
Bullish: Hold $1,000 → reclaim $1,050 → $1,100 / $1,150
Neutral: Consolidate between $950–$1,050
Bearish: Lose $950 → possible retracement toward $900–$930
Bias: 🟢 Bullish, but high-risk/overextended. I would be more comfortable with a confirmed breakout above $1,050 or a controlled pullback that holds $950–$1,000 than chasing a vertical candle here.
This is market analysis, not financial advice. Crypto can move sharply in either direction. �
ChartExchange +1
Open the live ZECUSDC chart on TradingView⁠�
#LululemonTumbles20%OnWeakGuidance #USAugustJobGrowthNearlyTriplesForecast #USAugustAvgHourlyEarningsRise3.1% #BitcoinETFsBiggestDailyInflowSinceJanuary
nice post
nice post
KHAN CRYPTO 444
·
--
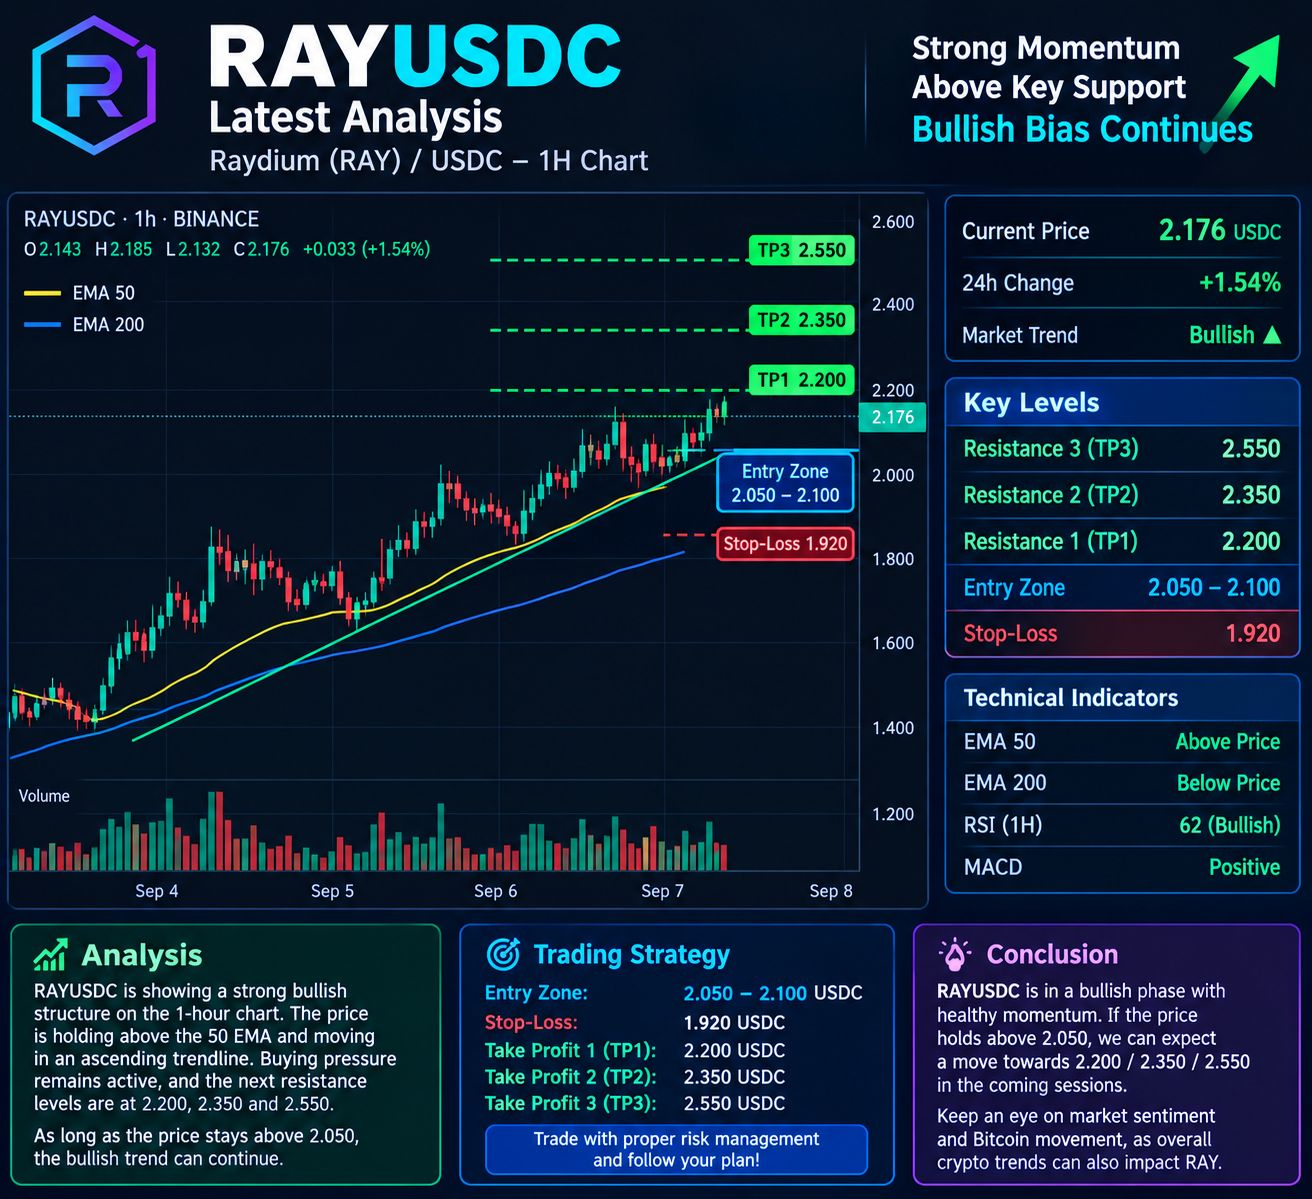
$RAY RAYUSDC — Latest Analysis
Current market: RAY has recently shown strong upward momentum, with price around $0.95 and a recent high near $0.97. �
Investing.com UK +1
Trend: 🟢 Bullish, but extended
Resistance: $1.00–$1.01
Breakout target: $1.10–$1.15
Next target: $1.30
Support: $0.90, then $0.80
A sustained break above $1.01 could open the way toward the $1.30 area. �
CoinLore
Trade idea:
🟢 Buy zone: $0.90–$0.93 on a pullback
🛑 Stop-loss: $0.86
🎯 TP1: $1.01
🎯 TP2: $1.10–$1.15
🎯 TP3: $1.30
⚠️ Risk: RAY has already moved sharply higher over the last few sessions, so chasing the price after a large candle can be risky. Wait for confirmation or a pullback.
*Levels are technical scenarios, not guaranteed targets. Crypto can move rapidly.*

#ZECHitsANewAllTimeHigh #BitcoinETFsBiggestDailyInflowSinceJanuary #LululemonTumbles20%OnWeakGuidance #USAugustAvgHourlyEarningsRise3.1% #BitcoinEthereumHitMultiMonthHighs
nice post
nice post
KHAN CRYPTO 444
·
--
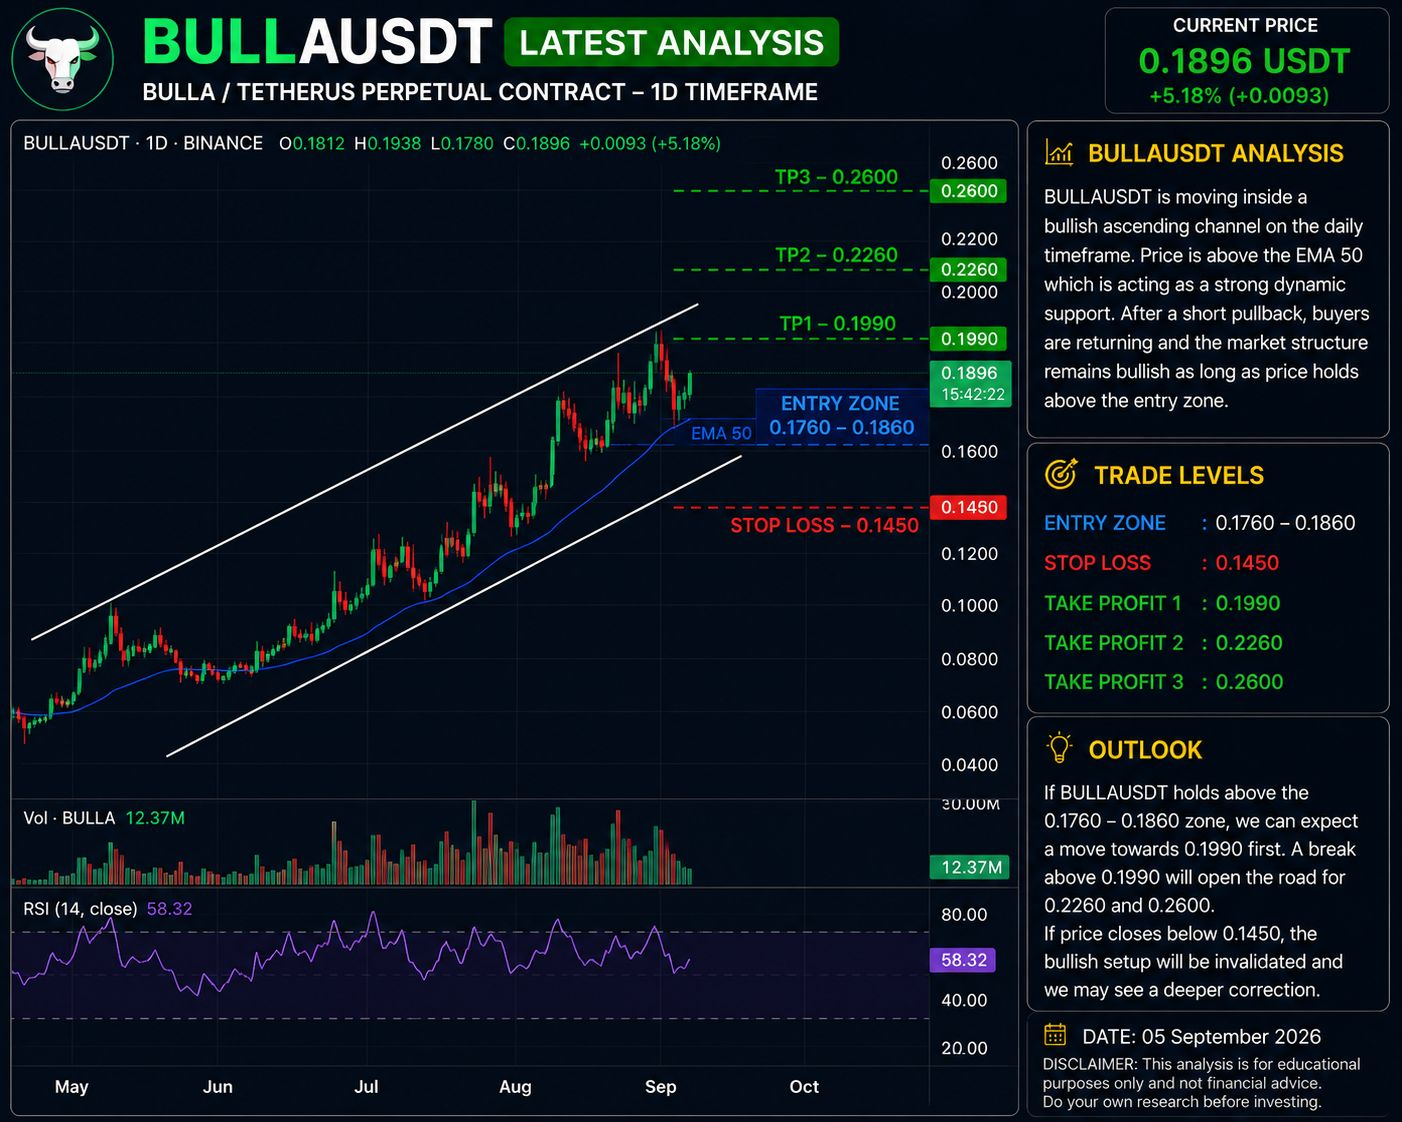
$BULLA BULLAUSDT Latest Analysis — 5 September 2026
Current price: around $0.028–$0.035, depending on market/feed. TradingView shows BULLAUSDT around $0.0284, while Binance perpetual data is around $0.0345. �
TradingView +1
📊 Technical outlook
🟢 Trend: Bullish but highly volatile
📈 7-day move: about +68% on CoinGecko's BULLA feed. �
CoinGecko
🔥 Resistance: $0.035–$0.039
🟢 Support: $0.029–$0.030
🎯 Upside targets: $0.040 → $0.045 → $0.050
🛑 Bearish invalidation: sustained break below ~$0.029
Trade idea: Wait for a pullback/retest of support rather than chasing a large green candle. BULLA is a small-cap, highly volatile token, so position size and stop-loss are important.
Educational analysis only—not financial advice. �
CoinGecko +1

#USWeeklyInitialJoblessClaimsRiseTo206000 #BitcoinETFsBiggestDailyInflowSinceJanuary #USAugustJobGrowthNearlyTriplesForecast #USAugustJobGrowthNearlyTriplesForecast
nice post
nice post
KHAN CRYPTO 444
·
--
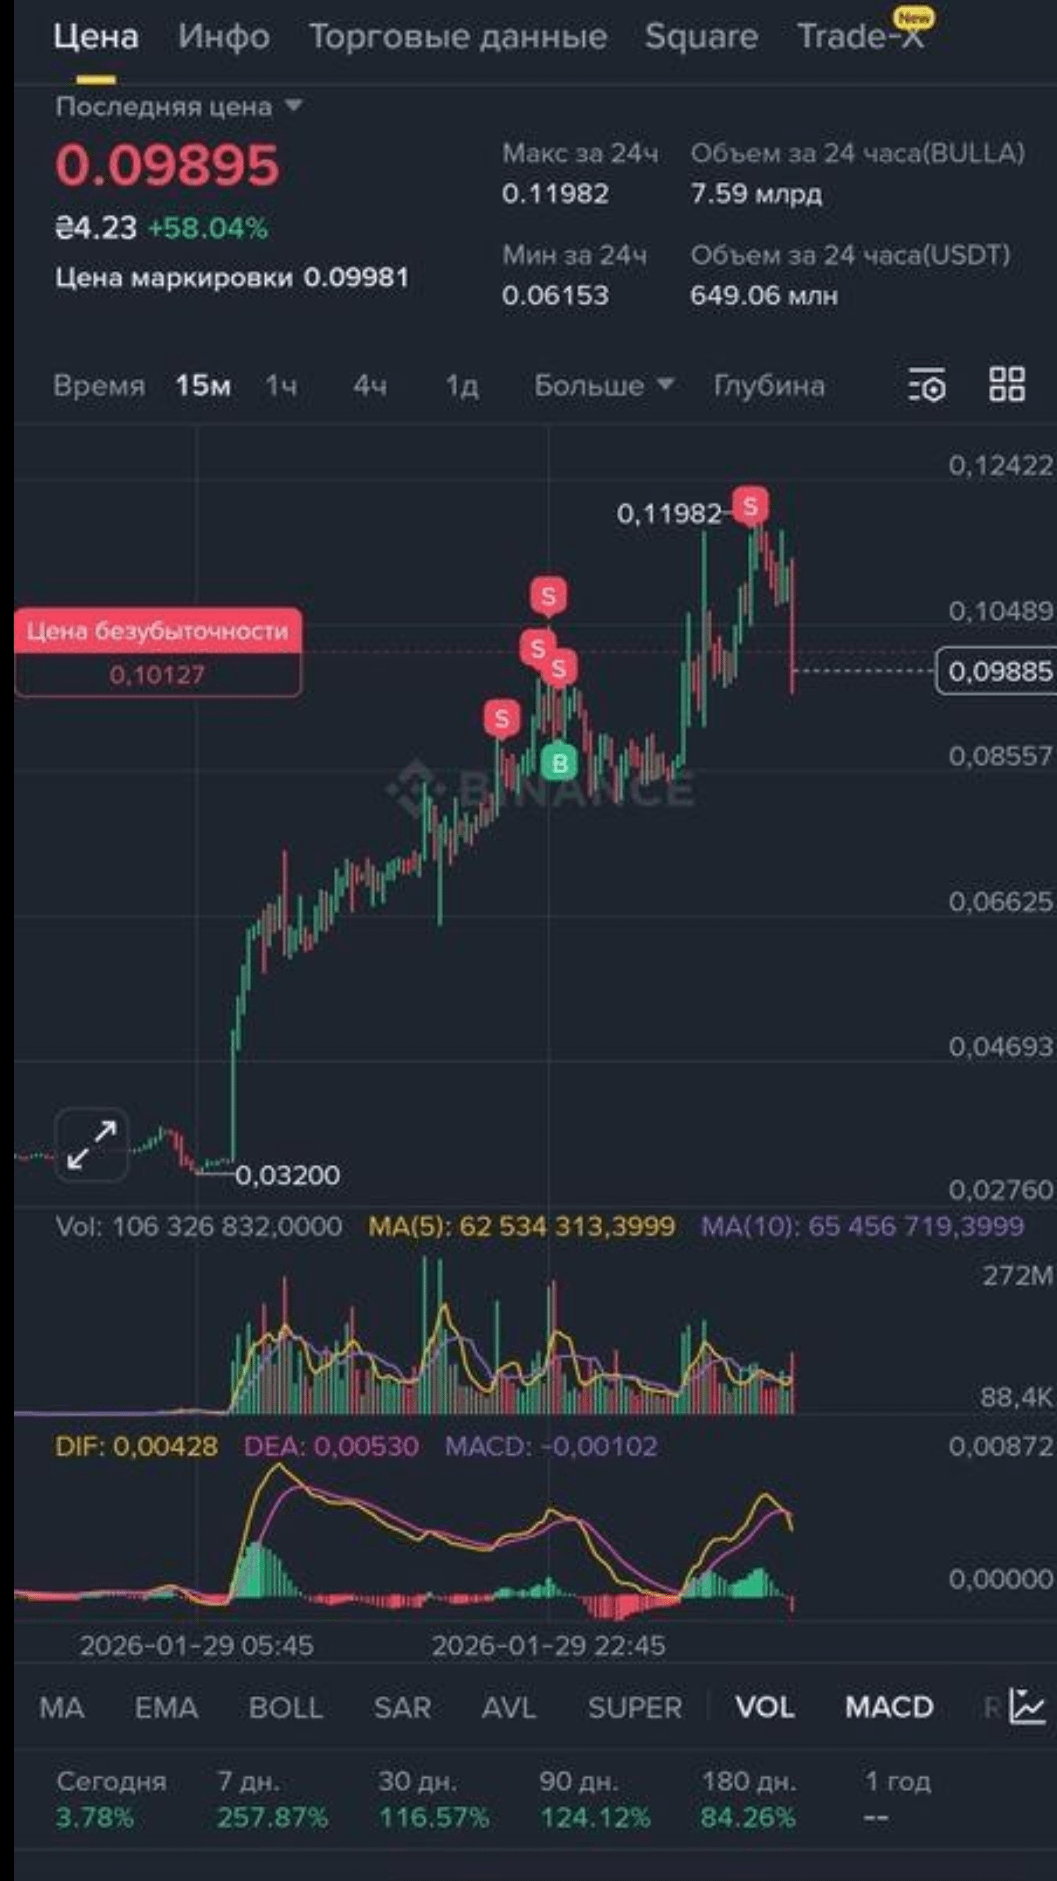
$BULLA BULLAUSDT Latest Analysis — 5 September 2026
Current price: around $0.028–$0.035, depending on market/feed. TradingView shows BULLAUSDT around $0.0284, while Binance perpetual data is around $0.0345. �
TradingView +1
📊 Technical outlook
🟢 Trend: Bullish but highly volatile
📈 7-day move: about +68% on CoinGecko's BULLA feed. �
CoinGecko
🔥 Resistance: $0.035–$0.039
🟢 Support: $0.029–$0.030
🎯 Upside targets: $0.040 → $0.045 → $0.050
🛑 Bearish invalidation: sustained break below ~$0.029
Trade idea: Wait for a pullback/retest of support rather than chasing a large green candle. BULLA is a small-cap, highly volatile token, so position size and stop-loss are important.
Educational analysis only—not financial advice. �
CoinGecko +1

#USWeeklyInitialJoblessClaimsRiseTo206000 #BitcoinETFsBiggestDailyInflowSinceJanuary #USAugustJobGrowthNearlyTriplesForecast #USAugustJobGrowthNearlyTriplesForecast
nice post
nice post
KHAN CRYPTO 444
·
--
$BULLA BULLAUSDT Latest Analysis — 5 September 2026
Current price: around $0.028–$0.035, depending on market/feed. TradingView shows BULLAUSDT around $0.0284, while Binance perpetual data is around $0.0345. �
TradingView +1
📊 Technical outlook
🟢 Trend: Bullish but highly volatile
📈 7-day move: about +68% on CoinGecko's BULLA feed. �
CoinGecko
🔥 Resistance: $0.035–$0.039
🟢 Support: $0.029–$0.030
🎯 Upside targets: $0.040 → $0.045 → $0.050
🛑 Bearish invalidation: sustained break below ~$0.029
Trade idea: Wait for a pullback/retest of support rather than chasing a large green candle. BULLA is a small-cap, highly volatile token, so position size and stop-loss are important.
Educational analysis only—not financial advice. �
CoinGecko +1

#USWeeklyInitialJoblessClaimsRiseTo206000 #BitcoinETFsBiggestDailyInflowSinceJanuary #USAugustJobGrowthNearlyTriplesForecast #USAugustJobGrowthNearlyTriplesForecast
nice post
nice post
KHAN CRYPTO 444
·
--
$BULLA BULLAUSDT Latest Analysis — 5 September 2026
Current price: around $0.028–$0.035, depending on market/feed. TradingView shows BULLAUSDT around $0.0284, while Binance perpetual data is around $0.0345. �
TradingView +1
📊 Technical outlook
🟢 Trend: Bullish but highly volatile
📈 7-day move: about +68% on CoinGecko's BULLA feed. �
CoinGecko
🔥 Resistance: $0.035–$0.039
🟢 Support: $0.029–$0.030
🎯 Upside targets: $0.040 → $0.045 → $0.050
🛑 Bearish invalidation: sustained break below ~$0.029
Trade idea: Wait for a pullback/retest of support rather than chasing a large green candle. BULLA is a small-cap, highly volatile token, so position size and stop-loss are important.
Educational analysis only—not financial advice. �
CoinGecko +1

#USWeeklyInitialJoblessClaimsRiseTo206000 #BitcoinETFsBiggestDailyInflowSinceJanuary #USAugustJobGrowthNearlyTriplesForecast #USAugustJobGrowthNearlyTriplesForecast
nice post
nice post
KHAN CRYPTO 444
·
--
$BULLA BULLAUSDT Latest Analysis — 5 September 2026
Current price: around $0.028–$0.035, depending on market/feed. TradingView shows BULLAUSDT around $0.0284, while Binance perpetual data is around $0.0345. �
TradingView +1
📊 Technical outlook
🟢 Trend: Bullish but highly volatile
📈 7-day move: about +68% on CoinGecko's BULLA feed. �
CoinGecko
🔥 Resistance: $0.035–$0.039
🟢 Support: $0.029–$0.030
🎯 Upside targets: $0.040 → $0.045 → $0.050
🛑 Bearish invalidation: sustained break below ~$0.029
Trade idea: Wait for a pullback/retest of support rather than chasing a large green candle. BULLA is a small-cap, highly volatile token, so position size and stop-loss are important.
Educational analysis only—not financial advice. �
CoinGecko +1

#USWeeklyInitialJoblessClaimsRiseTo206000 #BitcoinETFsBiggestDailyInflowSinceJanuary #USAugustJobGrowthNearlyTriplesForecast #USAugustJobGrowthNearlyTriplesForecast
nice post
nice post
KHAN CRYPTO 444
·
--
good
nice post
nice post
KHAN CRYPTO 444
·
--
$BULLA BULLAUSDT Latest Analysis — 5 September 2026
Current price: around $0.028–$0.035, depending on market/feed. TradingView shows BULLAUSDT around $0.0284, while Binance perpetual data is around $0.0345. �
TradingView +1
📊 Technical outlook
🟢 Trend: Bullish but highly volatile
📈 7-day move: about +68% on CoinGecko's BULLA feed. �
CoinGecko
🔥 Resistance: $0.035–$0.039
🟢 Support: $0.029–$0.030
🎯 Upside targets: $0.040 → $0.045 → $0.050
🛑 Bearish invalidation: sustained break below ~$0.029
Trade idea: Wait for a pullback/retest of support rather than chasing a large green candle. BULLA is a small-cap, highly volatile token, so position size and stop-loss are important.
Educational analysis only—not financial advice. �
CoinGecko +1

#USWeeklyInitialJoblessClaimsRiseTo206000 #BitcoinETFsBiggestDailyInflowSinceJanuary #USAugustJobGrowthNearlyTriplesForecast #USAugustJobGrowthNearlyTriplesForecast
$ARB 📊 ARB/USDC — Latest Analysis Current zone: ~$0.177–$0.180 USDC. A live Binance Futures snapshot has ARB/USDC around $0.1768, up roughly 34% over 24h, with elevated volatility. � Quantiva Live +1 🔥 Technical picture Bias: Bullish, but highly volatile Momentum: Strong — ARB has accelerated sharply after trading near the $0.07 area earlier in the recovery. Immediate resistance: $0.184–$0.185 Next resistance: $0.20 Major upside zone: $0.225–$0.23; a published technical framework places R3 around $0.2267. � Dappradar First support: $0.158–$0.160 Major support: $0.14–$0.145 Deeper support: $0.12–$0.125 🟢 Bullish scenario If ARB breaks $0.185 and holds it on a 4H/daily basis: $0.185 → $0.20 → $0.225 → $0.25 A breakout accompanied by strong volume would make the continuation setup considerably stronger. 🔴 Bearish scenario After such a rapid rally, a pullback is very possible. Losing $0.158–$0.160 would weaken the short-term structure and could send ARB toward $0.14, with $0.12–$0.125 becoming important below that. ⚠️ Important The current move is already very extended: the live snapshot shows an ATR around 33.7% on the 15-minute timeframe, so volatility/risk is unusually high. � Quantiva Live My read: 🟢 Bullish above $0.16, but I would be cautious about chasing a vertical candle. The key battle right now is $0.184–$0.185. This is technical analysis, not financial advice. {spot}(ARBUSDT) #ZECHitsANewAllTimeHigh #BitcoinETFsBiggestDailyInflowSinceJanuary #USAugustAvgHourlyEarningsRise3.1% #BitcoinEthereumHitMultiMonthHighs #AdobeSharesFall3%OnCEOTransition
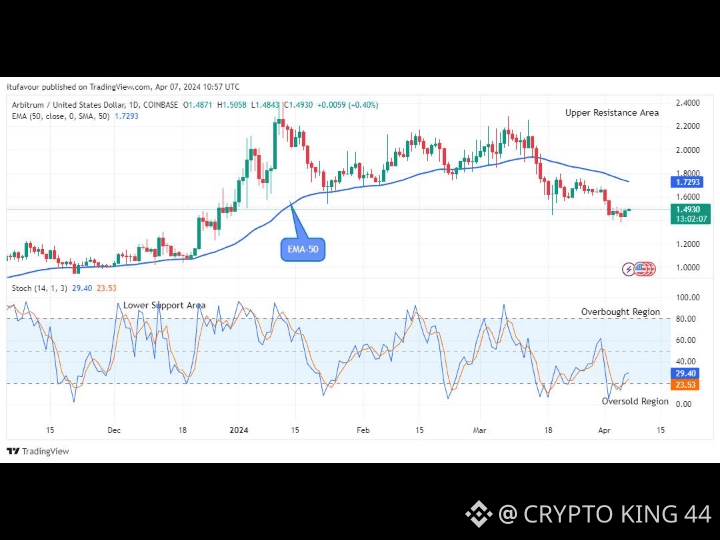
$ARB 📊 ARB/USDC — Latest Analysis
Current zone: ~$0.177–$0.180 USDC. A live Binance Futures snapshot has ARB/USDC around $0.1768, up roughly 34% over 24h, with elevated volatility. �
Quantiva Live +1
🔥 Technical picture
Bias: Bullish, but highly volatile
Momentum: Strong — ARB has accelerated sharply after trading near the $0.07 area earlier in the recovery.
Immediate resistance: $0.184–$0.185
Next resistance: $0.20
Major upside zone: $0.225–$0.23; a published technical framework places R3 around $0.2267. �
Dappradar
First support: $0.158–$0.160
Major support: $0.14–$0.145
Deeper support: $0.12–$0.125
🟢 Bullish scenario
If ARB breaks $0.185 and holds it on a 4H/daily basis:
$0.185 → $0.20 → $0.225 → $0.25
A breakout accompanied by strong volume would make the continuation setup considerably stronger.
🔴 Bearish scenario
After such a rapid rally, a pullback is very possible. Losing $0.158–$0.160 would weaken the short-term structure and could send ARB toward $0.14, with $0.12–$0.125 becoming important below that.
⚠️ Important
The current move is already very extended: the live snapshot shows an ATR around 33.7% on the 15-minute timeframe, so volatility/risk is unusually high. �
Quantiva Live
My read: 🟢 Bullish above $0.16, but I would be cautious about chasing a vertical candle. The key battle right now is $0.184–$0.185.
This is technical analysis, not financial advice.
#ZECHitsANewAllTimeHigh #BitcoinETFsBiggestDailyInflowSinceJanuary #USAugustAvgHourlyEarningsRise3.1% #BitcoinEthereumHitMultiMonthHighs #AdobeSharesFall3%OnCEOTransition
nice post
nice post
KHAN CRYPTO 444
·
--
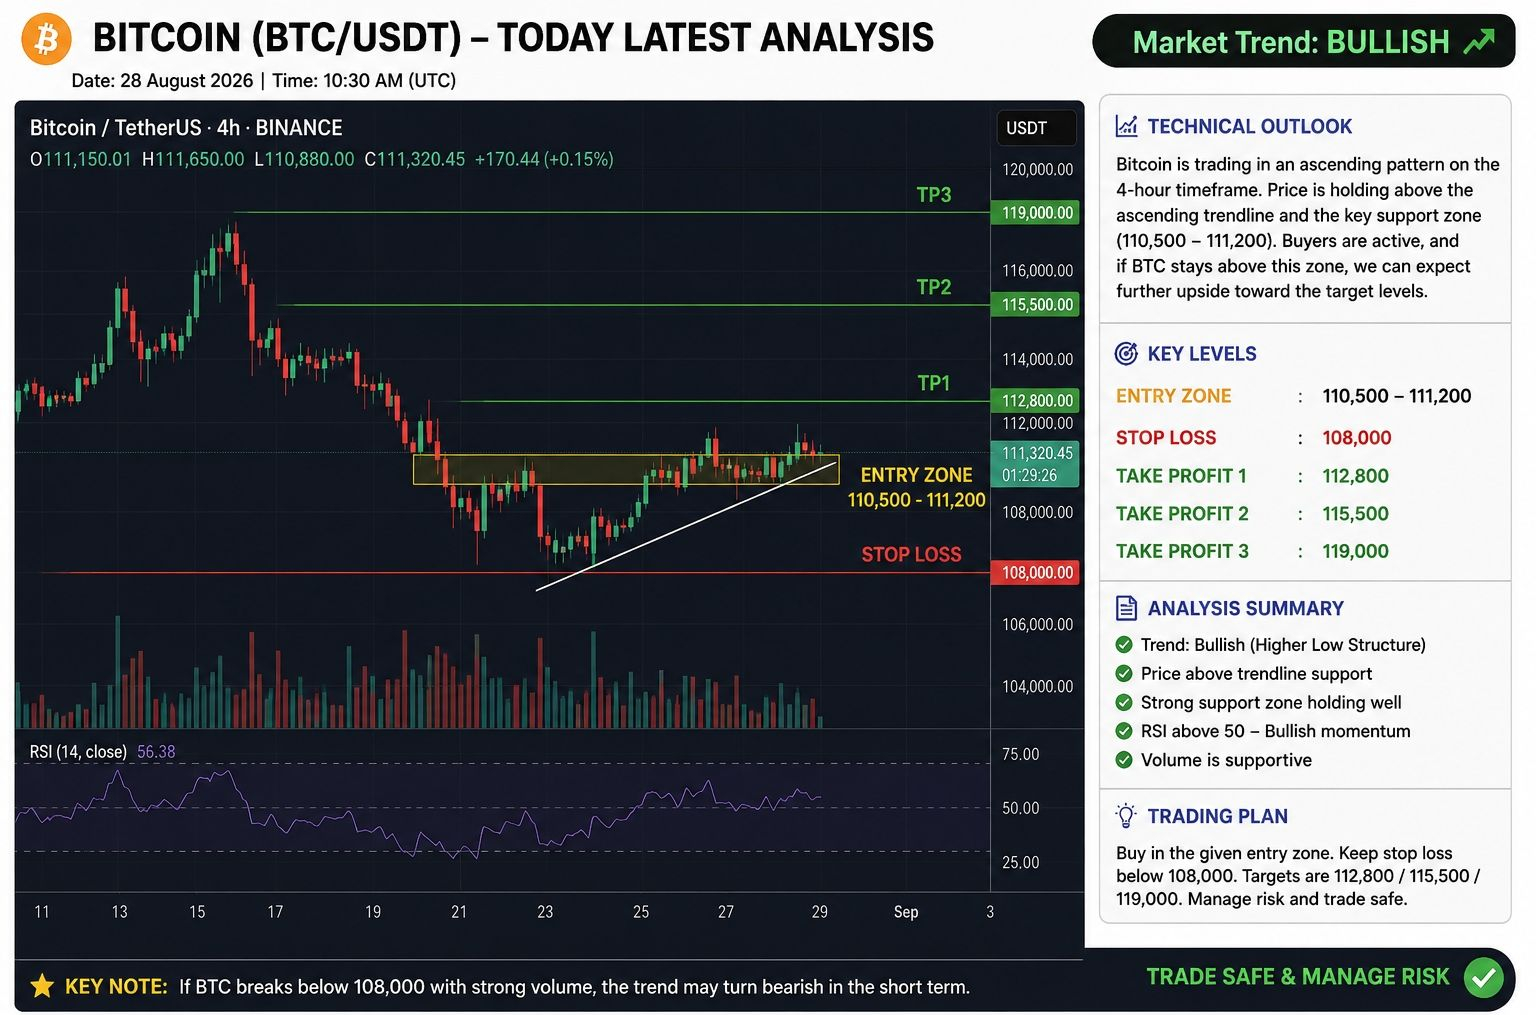
$BTC Bitcoin (BTC/USDT) — Today’s Latest Analysis
Bitcoin is trading around $79.5K–$79.6K today, after pulling back from the recent $81.4K area. �
StatMuse +1
Market view: Neutral → Bullish if $80K is reclaimed
🟢 Support: $78,600–$79,000
🟡 Key resistance: $80,000–$81,400
🚀 Breakout target: $82,800 → $85,000 → $90,000
🔻 Bearish trigger: sustained break below $78,600
📊 Bitcoin recently broke above several major moving averages, but $82,793 remains an important resistance zone. �
Reuters
⚠️ The recent U.S. jobs data triggered selling pressure, so volatility can remain high. �
Barron's
Trade idea: Wait for BTC to reclaim $80,000–$81,400 with strong volume before considering a breakout long. If price loses $78,600, expect a deeper correction.
Educational analysis only — crypto is highly volatile. Manage risk carefully.

#ZECHitsANewAllTimeHigh #LululemonTumbles20%OnWeakGuidance #USWeeklyInitialJoblessClaimsRiseTo206000 #USAugustAvgHourlyEarningsRise3.1% #USAugustJobGrowthNearlyTriplesForecast
Войдите, чтобы посмотреть больше материала
Присоединяйтесь к пользователям криптовалют по всему миру на Binance Square
⚡️ Получайте новейшую и полезную информацию о криптоактивах.
💬 Нам доверяет крупнейшая в мире криптобиржа.
👍 Получите достоверные аналитические данные от верифицированных создателей контента.
Эл. почта/номер телефона
Структура веб-страницы
Настройки cookie
Правила и условия платформы