
Sohail03293148063
1.2k Публикации

Sohail03293148063
Отправить жалобу
Заблокировать пользователя
88 подписок(и/а)
82 подписчиков(а)
1.2K понравилось
Посты
Все
Цитирования
$AGPU
{future}(AGPUUSDT)
#AGPUUSDT
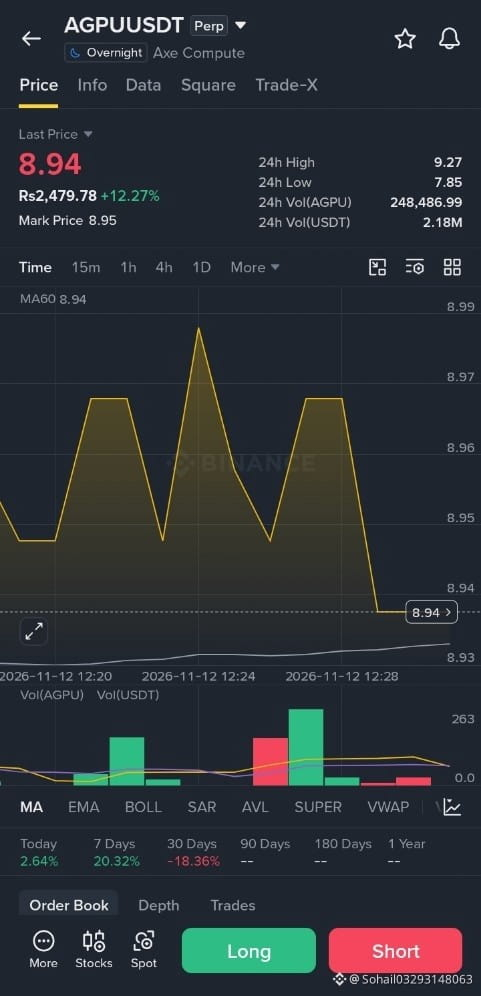
1. Current Market Action: AGPU/USDT perpetual futures are trading around $7.60 to $8.73 following a recent bounce from a local low of $5.91.
2. Chart Structure: The price shows a short-term recovery rally after a steep drop of nearly 48% from its September all-time high of $14.54.
3. Key Support & Stop-Loss: Immediate support sits near $7.35–$7.60, making a stop-loss below $7.15 essential to protect against a broader bearish trend.
4. Bullish Trade Targets: If buying momentum holds above $7.70 on Binance Futures, upside targets sit at $8.80 (recent resistance) and $9.30 (200-day moving average).
5. Risk Factor: Because AGPU trades primarily as a derivatives contract with elevated funding rates, expect sharp volatility and use low leverage.
#PythAddsNYSERealTimeDataToMarketplace
#CanNvidiaEarningsEaseMarketConcerns?
#MSCIRemovalMayCurbStrategy’sBitcoinBuying
#CoreWeaveJumps10%On168%RevenueGrowth
$AGPU
#AGPUUSDT
1. Current Market Action: AGPU/USDT perpetual futures are trading around $7.60 to $8.73 following a recent bounce from a local low of $5.91.
2. Chart Structure: The price shows a short-term recovery rally after a steep drop of nearly 48% from its September all-time high of $14.54.
3. Key Support & Stop-Loss: Immediate support sits near $7.35–$7.60, making a stop-loss below $7.15 essential to protect against a broader bearish trend.
4. Bullish Trade Targets: If buying momentum holds above $7.70 on Binance Futures, upside targets sit at $8.80 (recent resistance) and $9.30 (200-day moving average).
5. Risk Factor: Because AGPU trades primarily as a derivatives contract with elevated funding rates, expect sharp volatility and use low leverage.
#PythAddsNYSERealTimeDataToMarketplace
#CanNvidiaEarningsEaseMarketConcerns?
#MSCIRemovalMayCurbStrategy’sBitcoinBuying
#CoreWeaveJumps10%On168%RevenueGrowth
#AGPUUSDT
1. Current Market Action: AGPU/USDT perpetual futures are trading around $7.60 to $8.73 following a recent bounce from a local low of $5.91.
2. Chart Structure: The price shows a short-term recovery rally after a steep drop of nearly 48% from its September all-time high of $14.54.
3. Key Support & Stop-Loss: Immediate support sits near $7.35–$7.60, making a stop-loss below $7.15 essential to protect against a broader bearish trend.
4. Bullish Trade Targets: If buying momentum holds above $7.70 on Binance Futures, upside targets sit at $8.80 (recent resistance) and $9.30 (200-day moving average).
5. Risk Factor: Because AGPU trades primarily as a derivatives contract with elevated funding rates, expect sharp volatility and use low leverage.
#PythAddsNYSERealTimeDataToMarketplace
#CanNvidiaEarningsEaseMarketConcerns?
#MSCIRemovalMayCurbStrategy’sBitcoinBuying
#CoreWeaveJumps10%On168%RevenueGrowth
55
$RUM
{future}(RUMUSDT)
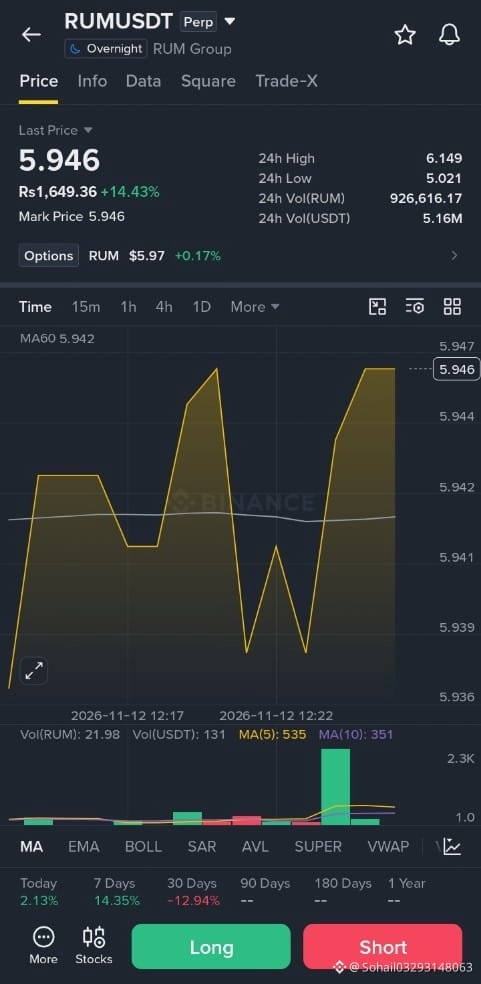
#RUMUSDT Here is a 5-line summary of the current trade targets and technical analysis for RUM Group Inc. (NASDAQ: RUM), traded as RUMUSD on select platforms:
1. Current Price Action: The stock recently bounced near $5.91 after trading near the lower end of its 52-week range ($4.62 to $10.60).
2. Short-Term Trade Targets: Immediate resistance sits at $5.98 (20-day moving average) and $6.71 (200-day moving average), with a swing target near the recent monthly high of $7.60.
3. Long-Term Analyst Targets: Wall Street analysts hold a consensus Buy rating with a 12-month price target range of $15.00 to $25.00 (averaging around $21.33 to $23.50).
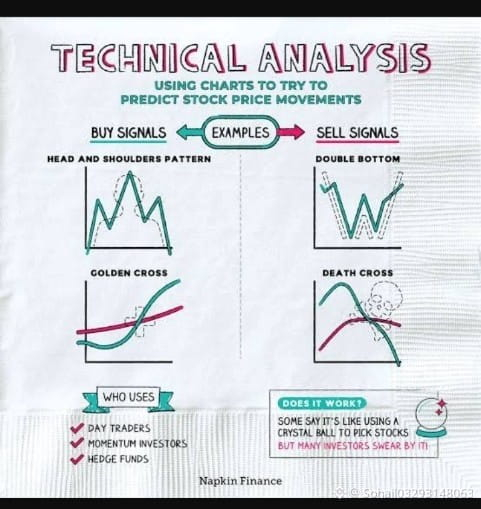
4. Technical Indicators: Oversold oscillator readings (Stochastics at 6.46 and RSI near 30) are sparking a short-term bounce, though the broader medium- and long-term trends remain bearish.
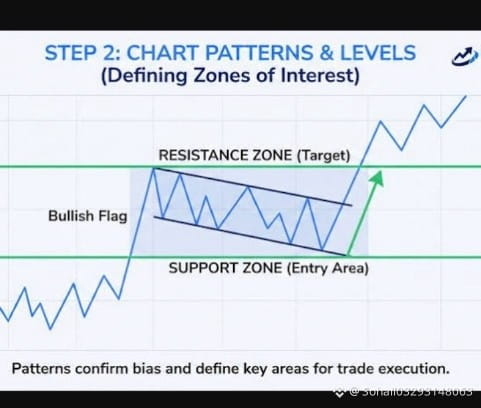
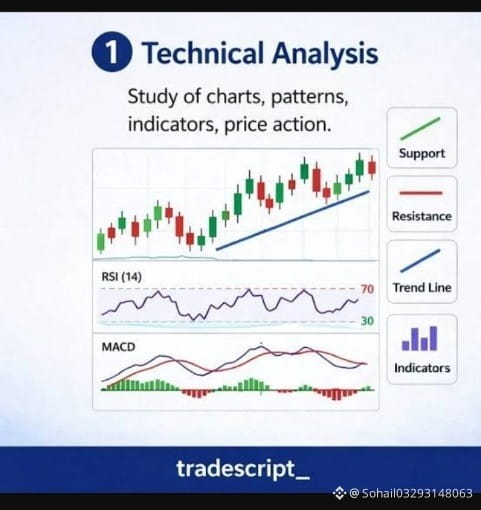
5. Key Risk & Visual Takeaway: High daily volatility (7.28% ATR) and heavy short interest (28.26%) mean traders should watch for a clean breakout above resistance before entering, as shown in the support-and-resistance chart guides above.
#CanNvidiaEarningsEaseMarketConcerns?
#PythAddsNYSERealTimeDataToMarketplace
#MSCIRemovalMayCurbStrategy’sBitcoinBuying
#AnthropicRejectsIPODelayValuationinQuestion
$RUM
#RUMUSDT Here is a 5-line summary of the current trade targets and technical analysis for RUM Group Inc. (NASDAQ: RUM), traded as RUMUSD on select platforms:
1. Current Price Action: The stock recently bounced near $5.91 after trading near the lower end of its 52-week range ($4.62 to $10.60).
2. Short-Term Trade Targets: Immediate resistance sits at $5.98 (20-day moving average) and $6.71 (200-day moving average), with a swing target near the recent monthly high of $7.60.
3. Long-Term Analyst Targets: Wall Street analysts hold a consensus Buy rating with a 12-month price target range of $15.00 to $25.00 (averaging around $21.33 to $23.50).
4. Technical Indicators: Oversold oscillator readings (Stochastics at 6.46 and RSI near 30) are sparking a short-term bounce, though the broader medium- and long-term trends remain bearish.
5. Key Risk & Visual Takeaway: High daily volatility (7.28% ATR) and heavy short interest (28.26%) mean traders should watch for a clean breakout above resistance before entering, as shown in the support-and-resistance chart guides above.
#CanNvidiaEarningsEaseMarketConcerns?
#PythAddsNYSERealTimeDataToMarketplace
#MSCIRemovalMayCurbStrategy’sBitcoinBuying
#AnthropicRejectsIPODelayValuationinQuestion
#RUMUSDT Here is a 5-line summary of the current trade targets and technical analysis for RUM Group Inc. (NASDAQ: RUM), traded as RUMUSD on select platforms:
1. Current Price Action: The stock recently bounced near $5.91 after trading near the lower end of its 52-week range ($4.62 to $10.60).
2. Short-Term Trade Targets: Immediate resistance sits at $5.98 (20-day moving average) and $6.71 (200-day moving average), with a swing target near the recent monthly high of $7.60.
3. Long-Term Analyst Targets: Wall Street analysts hold a consensus Buy rating with a 12-month price target range of $15.00 to $25.00 (averaging around $21.33 to $23.50).
4. Technical Indicators: Oversold oscillator readings (Stochastics at 6.46 and RSI near 30) are sparking a short-term bounce, though the broader medium- and long-term trends remain bearish.
5. Key Risk & Visual Takeaway: High daily volatility (7.28% ATR) and heavy short interest (28.26%) mean traders should watch for a clean breakout above resistance before entering, as shown in the support-and-resistance chart guides above.
#CanNvidiaEarningsEaseMarketConcerns?
#PythAddsNYSERealTimeDataToMarketplace
#MSCIRemovalMayCurbStrategy’sBitcoinBuying
#AnthropicRejectsIPODelayValuationinQuestion
77
$DJT
{future}(DJTUSDT)
#DJTUSDT
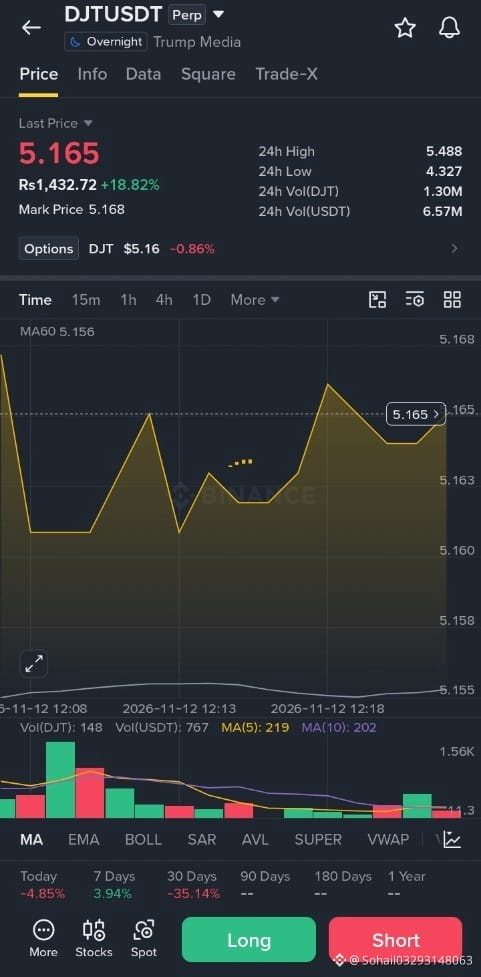
1. Current Market Price: The tokenized DJT/USDT perpetual contract is trading around $5.15 to $5.19 following a sharp 18% to 19% intraday rebound from its recent lows.
2. Overall Trend & Sentiment: Despite the short-term bounce, the broader trend remains bearish near the bottom of its 52-week range ($3.80 to $17.09), with market sentiment sitting in the "Fear" zone.
3. Key Support & Stop-Loss: Immediate support sits at $4.32 (recent 24-hour low) and $3.80 (major 52-week low), making a strict stop-loss below $4.30 critical for active long trades.
4. Successful Trade Targets: Immediate upside targets sit at $5.48 (24-hour high) and $5.60, while a confirmed breakout above $6.40 opens the path toward $7.20.
5. Chart & Visual Note: Live trading charts are unavailable directly in this chat, so you can view the real-time candlestick setup and technical indicators on TradingView or CoinGlass.
#TradFiForBeginners
#PythAddsNYSERealTimeDataToMarketplace
#CanNvidiaEarningsEaseMarketConcerns?
#MSCIRemovalMayCurbStrategy’sBitcoinBuying
$DJT
#DJTUSDT
1. Current Market Price: The tokenized DJT/USDT perpetual contract is trading around $5.15 to $5.19 following a sharp 18% to 19% intraday rebound from its recent lows.
2. Overall Trend & Sentiment: Despite the short-term bounce, the broader trend remains bearish near the bottom of its 52-week range ($3.80 to $17.09), with market sentiment sitting in the "Fear" zone.
3. Key Support & Stop-Loss: Immediate support sits at $4.32 (recent 24-hour low) and $3.80 (major 52-week low), making a strict stop-loss below $4.30 critical for active long trades.
4. Successful Trade Targets: Immediate upside targets sit at $5.48 (24-hour high) and $5.60, while a confirmed breakout above $6.40 opens the path toward $7.20.
5. Chart & Visual Note: Live trading charts are unavailable directly in this chat, so you can view the real-time candlestick setup and technical indicators on TradingView or CoinGlass.
#TradFiForBeginners
#PythAddsNYSERealTimeDataToMarketplace
#CanNvidiaEarningsEaseMarketConcerns?
#MSCIRemovalMayCurbStrategy’sBitcoinBuying
#DJTUSDT
1. Current Market Price: The tokenized DJT/USDT perpetual contract is trading around $5.15 to $5.19 following a sharp 18% to 19% intraday rebound from its recent lows.
2. Overall Trend & Sentiment: Despite the short-term bounce, the broader trend remains bearish near the bottom of its 52-week range ($3.80 to $17.09), with market sentiment sitting in the "Fear" zone.
3. Key Support & Stop-Loss: Immediate support sits at $4.32 (recent 24-hour low) and $3.80 (major 52-week low), making a strict stop-loss below $4.30 critical for active long trades.
4. Successful Trade Targets: Immediate upside targets sit at $5.48 (24-hour high) and $5.60, while a confirmed breakout above $6.40 opens the path toward $7.20.
5. Chart & Visual Note: Live trading charts are unavailable directly in this chat, so you can view the real-time candlestick setup and technical indicators on TradingView or CoinGlass.
#TradFiForBeginners
#PythAddsNYSERealTimeDataToMarketplace
#CanNvidiaEarningsEaseMarketConcerns?
#MSCIRemovalMayCurbStrategy’sBitcoinBuying
1
102
$KORU
{future}(KORUUSDT)
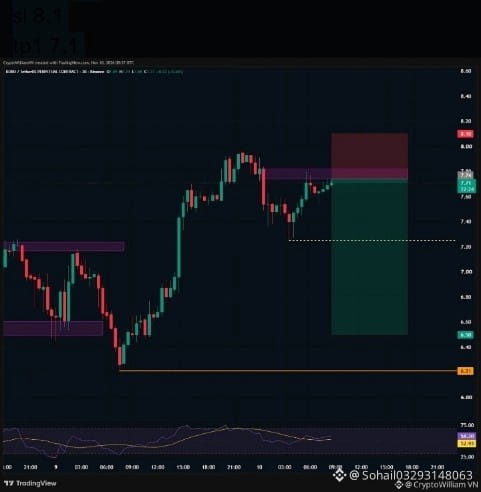
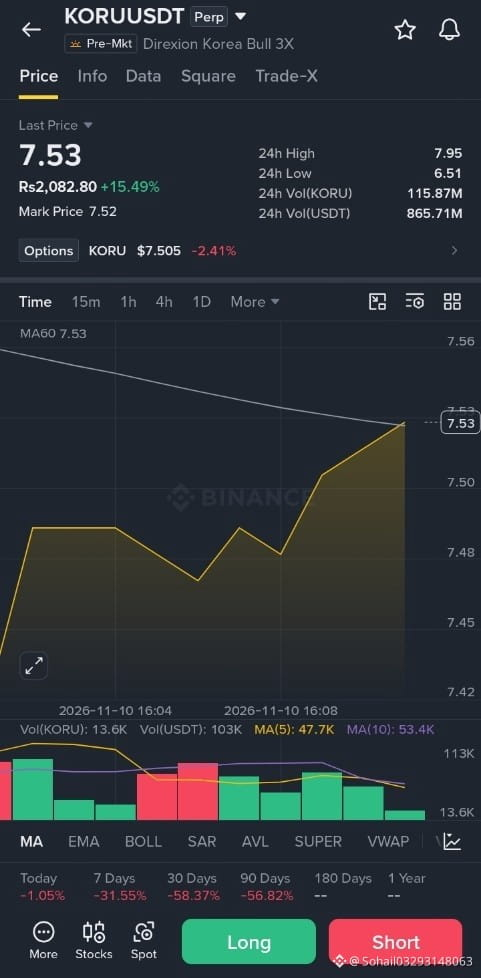
$KORU looks ready to dump again, selling momentum is building up fast
entry 7.7
sl 8.1
tp1 7.1
tp2 6.5
#AIChipSlumpNasdaq
#BitcoinFiveWeeklyLosses
#US-IranTalksFuelStrongStockMarketRebound
#CanNvidiaEarningsEaseMarketConcerns?
#AnthropicRejectsIPODelayValuationinQuestion
$KORU
$KORU looks ready to dump again, selling momentum is building up fast
entry 7.7
sl 8.1
tp1 7.1
tp2 6.5
#AIChipSlumpNasdaq
#BitcoinFiveWeeklyLosses
#US-IranTalksFuelStrongStockMarketRebound
#CanNvidiaEarningsEaseMarketConcerns?
#AnthropicRejectsIPODelayValuationinQuestion
$KORU looks ready to dump again, selling momentum is building up fast
entry 7.7
sl 8.1
tp1 7.1
tp2 6.5
#AIChipSlumpNasdaq
#BitcoinFiveWeeklyLosses
#US-IranTalksFuelStrongStockMarketRebound
#CanNvidiaEarningsEaseMarketConcerns?
#AnthropicRejectsIPODelayValuationinQuestion
429
$MVLL
{future}(MVLLUSDT)
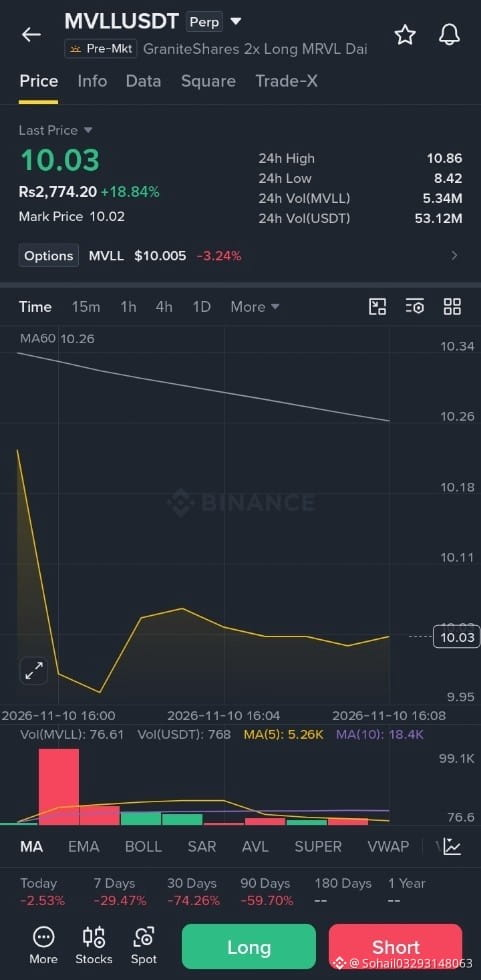
1. Current Trend: The MVLLUSDT Perpetual Chart on TradingView shows a sharp pullback from recent highs, consolidating near the $8.70–$10.35 range.
2. Support Zone: Buyers are defending critical near-term support around $7.94–$8.91, where recent 24-hour lows formed on Binance Futures.
3. Bullish Targets: Holding above $8.91 opens a recovery path toward $10.86 first, followed by major resistance at $17.88.
4. Bearish Targets: Losing the $7.94 floor invalidates the bounce and exposes the chart to deeper downside momentum.
5. Risk Management: High leverage volatility on CoinGlass MVLL Futures makes tight stop-losses below $7.90 essential before chasing breakouts.
#AIChipSlumpNasdaq
#BitcoinFiveWeeklyLosses
#US-IranTalksFuelStrongStockMarketRebound
#CanNvidiaEarningsEaseMarketConcerns?
#NvidiaInvestigatesAfterHuang’sAffairApology
$MVLL
1. Current Trend: The MVLLUSDT Perpetual Chart on TradingView shows a sharp pullback from recent highs, consolidating near the $8.70–$10.35 range.
2. Support Zone: Buyers are defending critical near-term support around $7.94–$8.91, where recent 24-hour lows formed on Binance Futures.
3. Bullish Targets: Holding above $8.91 opens a recovery path toward $10.86 first, followed by major resistance at $17.88.
4. Bearish Targets: Losing the $7.94 floor invalidates the bounce and exposes the chart to deeper downside momentum.
5. Risk Management: High leverage volatility on CoinGlass MVLL Futures makes tight stop-losses below $7.90 essential before chasing breakouts.
#AIChipSlumpNasdaq
#BitcoinFiveWeeklyLosses
#US-IranTalksFuelStrongStockMarketRebound
#CanNvidiaEarningsEaseMarketConcerns?
#NvidiaInvestigatesAfterHuang’sAffairApology
1. Current Trend: The MVLLUSDT Perpetual Chart on TradingView shows a sharp pullback from recent highs, consolidating near the $8.70–$10.35 range.
2. Support Zone: Buyers are defending critical near-term support around $7.94–$8.91, where recent 24-hour lows formed on Binance Futures.
3. Bullish Targets: Holding above $8.91 opens a recovery path toward $10.86 first, followed by major resistance at $17.88.
4. Bearish Targets: Losing the $7.94 floor invalidates the bounce and exposes the chart to deeper downside momentum.
5. Risk Management: High leverage volatility on CoinGlass MVLL Futures makes tight stop-losses below $7.90 essential before chasing breakouts.
#AIChipSlumpNasdaq
#BitcoinFiveWeeklyLosses
#US-IranTalksFuelStrongStockMarketRebound
#CanNvidiaEarningsEaseMarketConcerns?
#NvidiaInvestigatesAfterHuang’sAffairApology
1
160
$PIEVERSE
{alpha}(560x0e63b9c287e32a05e6b9ab8ee8df88a2760225a9)
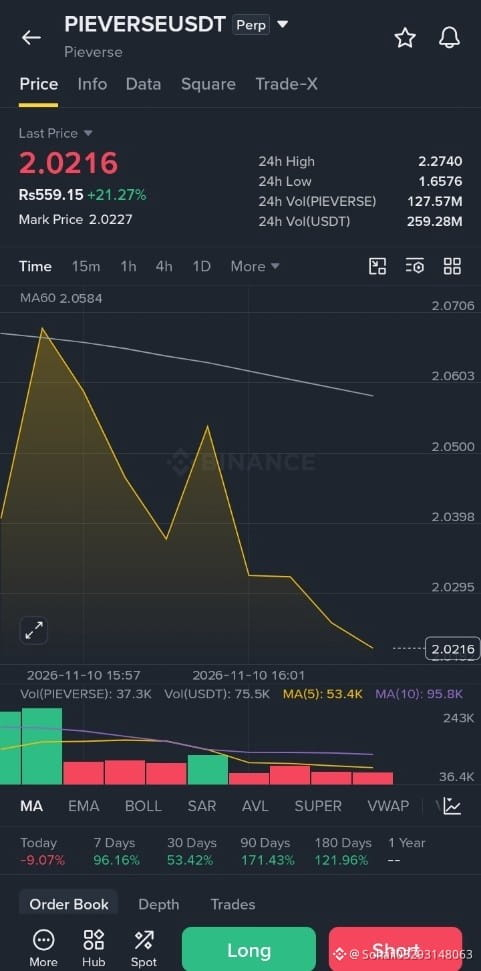
PIEVERSEUSDT recently broke out into a strong bullish rally, hitting a record high near $2.22–$2.23 before stabilizing around $2.04–$2.12.
Bullish Breakout: Price surged past prior resistance around $1.80–$1.88 on heavy volume, turning that zone into new support.
Current Price Action: The token is trading near $2.10 on Binance Futures after testing a 24-hour high of $2.27.
Upside Targets: Holding above $2.00 opens the path toward retesting $2.23 and pushing into price discovery at $2.40–$2.50.
Key Support & Risk: Immediate support sits at $1.80, while a drop below $1.60 signals deeper profit-taking.
Chart Outlook: Track real-time candlesticks and RSI momentum on TradingView to spot overbought pullbacks before entering.
#AIChipSlumpNasdaq
#BitcoinFiveWeeklyLosses
#US-IranTalksFuelStrongStockMarketRebound
#CanNvidiaEarningsEaseMarketConcerns?
#AnthropicRejectsIPODelayValuationinQuestion
$PIEVERSE
PIEVERSEUSDT recently broke out into a strong bullish rally, hitting a record high near $2.22–$2.23 before stabilizing around $2.04–$2.12.
Bullish Breakout: Price surged past prior resistance around $1.80–$1.88 on heavy volume, turning that zone into new support.
Current Price Action: The token is trading near $2.10 on Binance Futures after testing a 24-hour high of $2.27.
Upside Targets: Holding above $2.00 opens the path toward retesting $2.23 and pushing into price discovery at $2.40–$2.50.
Key Support & Risk: Immediate support sits at $1.80, while a drop below $1.60 signals deeper profit-taking.
Chart Outlook: Track real-time candlesticks and RSI momentum on TradingView to spot overbought pullbacks before entering.
#AIChipSlumpNasdaq
#BitcoinFiveWeeklyLosses
#US-IranTalksFuelStrongStockMarketRebound
#CanNvidiaEarningsEaseMarketConcerns?
#AnthropicRejectsIPODelayValuationinQuestion
PIEVERSEUSDT recently broke out into a strong bullish rally, hitting a record high near $2.22–$2.23 before stabilizing around $2.04–$2.12.
Bullish Breakout: Price surged past prior resistance around $1.80–$1.88 on heavy volume, turning that zone into new support.
Current Price Action: The token is trading near $2.10 on Binance Futures after testing a 24-hour high of $2.27.
Upside Targets: Holding above $2.00 opens the path toward retesting $2.23 and pushing into price discovery at $2.40–$2.50.
Key Support & Risk: Immediate support sits at $1.80, while a drop below $1.60 signals deeper profit-taking.
Chart Outlook: Track real-time candlesticks and RSI momentum on TradingView to spot overbought pullbacks before entering.
#AIChipSlumpNasdaq
#BitcoinFiveWeeklyLosses
#US-IranTalksFuelStrongStockMarketRebound
#CanNvidiaEarningsEaseMarketConcerns?
#AnthropicRejectsIPODelayValuationinQuestion
1
387
$ARIA
{alpha}(560x5d3a12c42e5372b2cc3264ab3cdcf660a1555238)
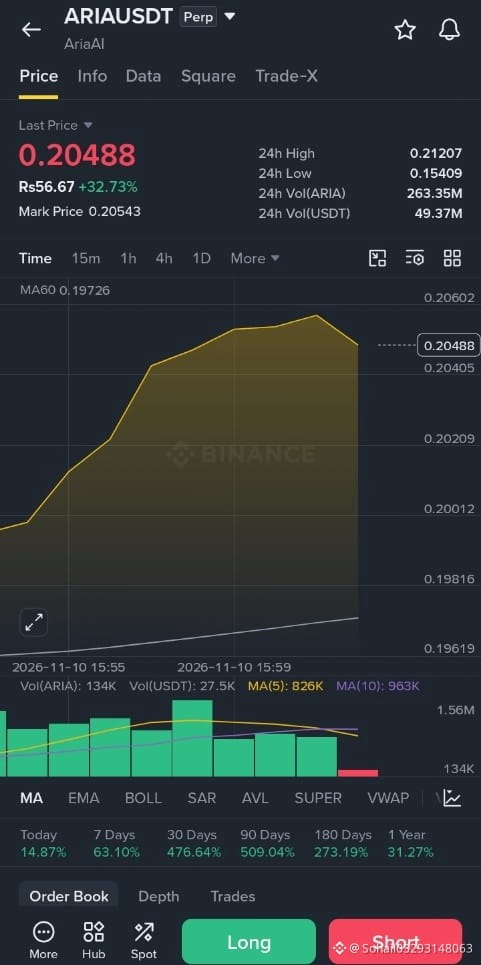
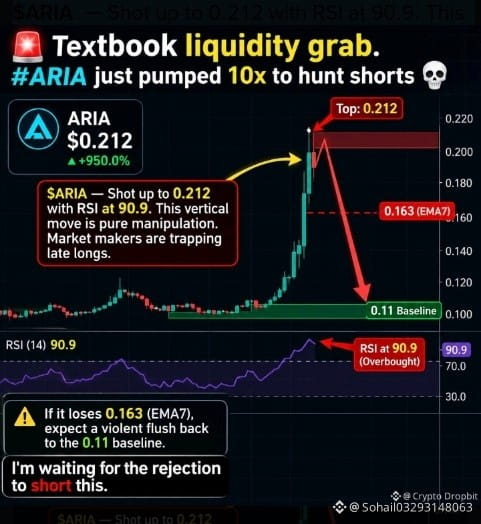
🚨 Textbook liquidity grab. #ARIA just pumped 10x to hunt shorts 💀
$ARIA — Shot up to 0.212 with RSI at 90.9. This vertical move is pure manipulation. Market makers are trapping late longs.
If it loses 0.163 (EMA7), expect a violent flush back to the 0.11 baseline. I'm waiting for the rejection to short this.
#BitcoinFiveWeeklyLosses
#AIChipSlumpNasdaq
#US-IranTalksFuelStrongStockMarketRebound
#CanNvidiaEarningsEaseMarketConcerns?
#AnthropicRejectsIPODelayValuationinQuestion
$ARIA
🚨 Textbook liquidity grab. #ARIA just pumped 10x to hunt shorts 💀
$ARIA — Shot up to 0.212 with RSI at 90.9. This vertical move is pure manipulation. Market makers are trapping late longs.
If it loses 0.163 (EMA7), expect a violent flush back to the 0.11 baseline. I'm waiting for the rejection to short this.
#BitcoinFiveWeeklyLosses
#AIChipSlumpNasdaq
#US-IranTalksFuelStrongStockMarketRebound
#CanNvidiaEarningsEaseMarketConcerns?
#AnthropicRejectsIPODelayValuationinQuestion
🚨 Textbook liquidity grab. #ARIA just pumped 10x to hunt shorts 💀
$ARIA — Shot up to 0.212 with RSI at 90.9. This vertical move is pure manipulation. Market makers are trapping late longs.
If it loses 0.163 (EMA7), expect a violent flush back to the 0.11 baseline. I'm waiting for the rejection to short this.
#BitcoinFiveWeeklyLosses
#AIChipSlumpNasdaq
#US-IranTalksFuelStrongStockMarketRebound
#CanNvidiaEarningsEaseMarketConcerns?
#AnthropicRejectsIPODelayValuationinQuestion
70
$INIT
{future}(INITUSDT)
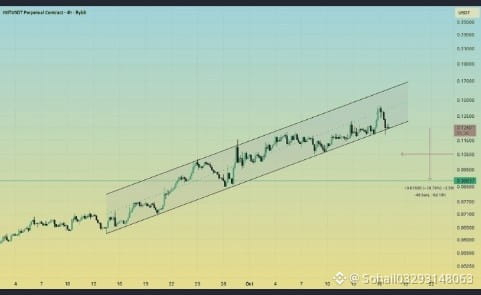
The image shows an ascending (rising) parallel channel on a price chart (such as a cryptocurrency perpetual contract like INITUSDT or a similar asset on TradingView), illustrating a series of higher highs and higher lows moving within an upward trendline and resistance channel.
Key Technical Observations
Channel Structure: The price is moving within a well-defined parallel upward channel, demonstrating bullish progression over the shown timeframe.
Current Position: The price appears to be testing or nearing the upper boundary/resistance of the channel, or experiencing a minor pullback toward the middle/support area.
Key Levels to Watch:
Support: The lower trendline of the channel or prior horizontal swing lows act as dynamic support.
Resistance: The upper parallel trendline where selling pressure or profit-taking often occurs.
Breakout / Breakdown Risk: A clean break above the upper channel resistance could signal a continuation or acceleration of the uptrend, whereas a drop below the lower channel support would indicate a trend reversal or deeper correction.
#AIChipSlumpNasdaq
#BitcoinFiveWeeklyLosses
#US-IranTalksFuelStrongStockMarketRebound
#CanNvidiaEarningsEaseMarketConcerns?
$INIT
The image shows an ascending (rising) parallel channel on a price chart (such as a cryptocurrency perpetual contract like INITUSDT or a similar asset on TradingView), illustrating a series of higher highs and higher lows moving within an upward trendline and resistance channel.
Key Technical Observations
Channel Structure: The price is moving within a well-defined parallel upward channel, demonstrating bullish progression over the shown timeframe.
Current Position: The price appears to be testing or nearing the upper boundary/resistance of the channel, or experiencing a minor pullback toward the middle/support area.
Key Levels to Watch:
Support: The lower trendline of the channel or prior horizontal swing lows act as dynamic support.
Resistance: The upper parallel trendline where selling pressure or profit-taking often occurs.
Breakout / Breakdown Risk: A clean break above the upper channel resistance could signal a continuation or acceleration of the uptrend, whereas a drop below the lower channel support would indicate a trend reversal or deeper correction.
#AIChipSlumpNasdaq
#BitcoinFiveWeeklyLosses
#US-IranTalksFuelStrongStockMarketRebound
#CanNvidiaEarningsEaseMarketConcerns?
The image shows an ascending (rising) parallel channel on a price chart (such as a cryptocurrency perpetual contract like INITUSDT or a similar asset on TradingView), illustrating a series of higher highs and higher lows moving within an upward trendline and resistance channel.
Key Technical Observations
Channel Structure: The price is moving within a well-defined parallel upward channel, demonstrating bullish progression over the shown timeframe.
Current Position: The price appears to be testing or nearing the upper boundary/resistance of the channel, or experiencing a minor pullback toward the middle/support area.
Key Levels to Watch:
Support: The lower trendline of the channel or prior horizontal swing lows act as dynamic support.
Resistance: The upper parallel trendline where selling pressure or profit-taking often occurs.
Breakout / Breakdown Risk: A clean break above the upper channel resistance could signal a continuation or acceleration of the uptrend, whereas a drop below the lower channel support would indicate a trend reversal or deeper correction.
#AIChipSlumpNasdaq
#BitcoinFiveWeeklyLosses
#US-IranTalksFuelStrongStockMarketRebound
#CanNvidiaEarningsEaseMarketConcerns?
223
$MELI
{future}(MELIUSDT)
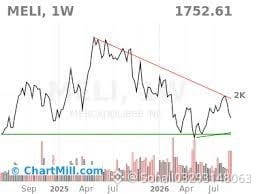
Asset Trend: MELI/USDT is in a strong short-term bearish trend, trading around $1,625 after breaking below major moving averages.
Entry Setup: A highly successful short trade was triggered upon the clear breakdown of the key psychological support level at $1,700.
Indicator Signals: The 14-day RSI dropped into extremely oversold territory (~27–30), confirming intense selling pressure.
Profit Target: The bearish momentum directly hit the primary downside targets, bottoming out near the strong $1,502–$1,510 support floor.
Next Outlook: Traders are now waiting for volume consolidation at current lows before initiating any potential reversal long setups.
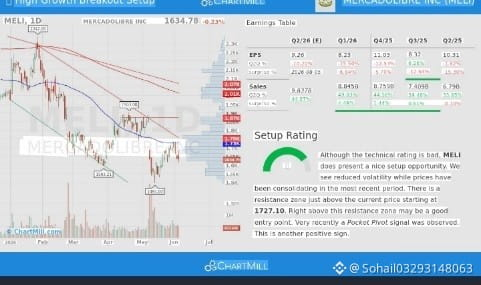
MercadoLibre Inc. (NASDAQ: MELI) is displayed in a daily technical and fundamental stock analysis chart from ChartMill showing a high-growth breakout setup.
Key Details from the Image & Data
• Current Price & Trend: The stock is trading around 1,634.78 (-0.23%), consolidating after a pullback from earlier highs near 2,342.00.
• Resistance & Setup: A resistance zone is identified right above the current price starting at 1,727.10, with a recent pocket pivot signal and reduced volatility pointing to a potential breakout setup (rated 8/10 on ChartMill).
• Earnings & Revenue Context:
• Q2/25–Q3/25 show strong top-line sales expansion (e.g., Q2/26 estimated revenue around $9.83B or Q2/26 actual metrics reflecting rapid growth) alongside ongoing investments in credit and ecosystem expansion.
• Growth ratings for MELI on ChartMill historically rank high (8–9 out of 10) due to substantial year-over-year revenue growth.
#TradFiForBeginners
#HKSFCPlansToRestrictCryptoAndExchangeTerms
#WillUS-IranTensionsBoostSafe-HavenDemand?
#WillAnthropicListOnTime
#CPITestsDecemberRateOutlook
$MELI
Asset Trend: MELI/USDT is in a strong short-term bearish trend, trading around $1,625 after breaking below major moving averages.
Entry Setup: A highly successful short trade was triggered upon the clear breakdown of the key psychological support level at $1,700.
Indicator Signals: The 14-day RSI dropped into extremely oversold territory (~27–30), confirming intense selling pressure.
Profit Target: The bearish momentum directly hit the primary downside targets, bottoming out near the strong $1,502–$1,510 support floor.
Next Outlook: Traders are now waiting for volume consolidation at current lows before initiating any potential reversal long setups.
MercadoLibre Inc. (NASDAQ: MELI) is displayed in a daily technical and fundamental stock analysis chart from ChartMill showing a high-growth breakout setup.
Key Details from the Image & Data
• Current Price & Trend: The stock is trading around 1,634.78 (-0.23%), consolidating after a pullback from earlier highs near 2,342.00.
• Resistance & Setup: A resistance zone is identified right above the current price starting at 1,727.10, with a recent pocket pivot signal and reduced volatility pointing to a potential breakout setup (rated 8/10 on ChartMill).
• Earnings & Revenue Context:
• Q2/25–Q3/25 show strong top-line sales expansion (e.g., Q2/26 estimated revenue around $9.83B or Q2/26 actual metrics reflecting rapid growth) alongside ongoing investments in credit and ecosystem expansion.
• Growth ratings for MELI on ChartMill historically rank high (8–9 out of 10) due to substantial year-over-year revenue growth.
#TradFiForBeginners
#HKSFCPlansToRestrictCryptoAndExchangeTerms
#WillUS-IranTensionsBoostSafe-HavenDemand?
#WillAnthropicListOnTime
#CPITestsDecemberRateOutlook
Asset Trend: MELI/USDT is in a strong short-term bearish trend, trading around $1,625 after breaking below major moving averages.
Entry Setup: A highly successful short trade was triggered upon the clear breakdown of the key psychological support level at $1,700.
Indicator Signals: The 14-day RSI dropped into extremely oversold territory (~27–30), confirming intense selling pressure.
Profit Target: The bearish momentum directly hit the primary downside targets, bottoming out near the strong $1,502–$1,510 support floor.
Next Outlook: Traders are now waiting for volume consolidation at current lows before initiating any potential reversal long setups.
MercadoLibre Inc. (NASDAQ: MELI) is displayed in a daily technical and fundamental stock analysis chart from ChartMill showing a high-growth breakout setup.
Key Details from the Image & Data
• Current Price & Trend: The stock is trading around 1,634.78 (-0.23%), consolidating after a pullback from earlier highs near 2,342.00.
• Resistance & Setup: A resistance zone is identified right above the current price starting at 1,727.10, with a recent pocket pivot signal and reduced volatility pointing to a potential breakout setup (rated 8/10 on ChartMill).
• Earnings & Revenue Context:
• Q2/25–Q3/25 show strong top-line sales expansion (e.g., Q2/26 estimated revenue around $9.83B or Q2/26 actual metrics reflecting rapid growth) alongside ongoing investments in credit and ecosystem expansion.
• Growth ratings for MELI on ChartMill historically rank high (8–9 out of 10) due to substantial year-over-year revenue growth.
#TradFiForBeginners
#HKSFCPlansToRestrictCryptoAndExchangeTerms
#WillUS-IranTensionsBoostSafe-HavenDemand?
#WillAnthropicListOnTime
#CPITestsDecemberRateOutlook
90
$PREDICT
{future}(PREDICTUSDT)
airdrop snapshot is done, it was at 7:59 morning. If you had 200+ points you will get it, no need to claim, it will come auto in your Alpha account, just wait for announcement.
$PREDICT still no launch date. If you didn't choose plan yet, last date is 11/26, if you don't choose it will auto lock for 1 year.
No new airdrop right now so don't do extra trades just for points, fees will eat your money. Spot competition S10 also ended, next season not announced yet.
And $KOR listing is just rumor, Binance didn't say anything, don't buy on rumor.
One thing, if anyone DM you for claim link, it's scam. Only check in Binance app.
How many points you had at snapshot?
#ALPHA 🔥 #BinanceAlpha
#TradFiForBeginners
#WillUS-IranTensionsBoostSafe-HavenDemand?
#newcrypto
$PREDICT
airdrop snapshot is done, it was at 7:59 morning. If you had 200+ points you will get it, no need to claim, it will come auto in your Alpha account, just wait for announcement.
$PREDICT still no launch date. If you didn't choose plan yet, last date is 11/26, if you don't choose it will auto lock for 1 year.
No new airdrop right now so don't do extra trades just for points, fees will eat your money. Spot competition S10 also ended, next season not announced yet.
And $KOR listing is just rumor, Binance didn't say anything, don't buy on rumor.
One thing, if anyone DM you for claim link, it's scam. Only check in Binance app.
How many points you had at snapshot?
#ALPHA 🔥 #BinanceAlpha
#TradFiForBeginners
#WillUS-IranTensionsBoostSafe-HavenDemand?
#newcrypto
airdrop snapshot is done, it was at 7:59 morning. If you had 200+ points you will get it, no need to claim, it will come auto in your Alpha account, just wait for announcement.
$PREDICT still no launch date. If you didn't choose plan yet, last date is 11/26, if you don't choose it will auto lock for 1 year.
No new airdrop right now so don't do extra trades just for points, fees will eat your money. Spot competition S10 also ended, next season not announced yet.
And $KOR listing is just rumor, Binance didn't say anything, don't buy on rumor.
One thing, if anyone DM you for claim link, it's scam. Only check in Binance app.
How many points you had at snapshot?
#ALPHA 🔥 #BinanceAlpha
#TradFiForBeginners
#WillUS-IranTensionsBoostSafe-HavenDemand?
#newcrypto
44
$EDGE
{alpha}(560x70f2eadf1ca1969ff42b0c78e9da519e8937cbaf)
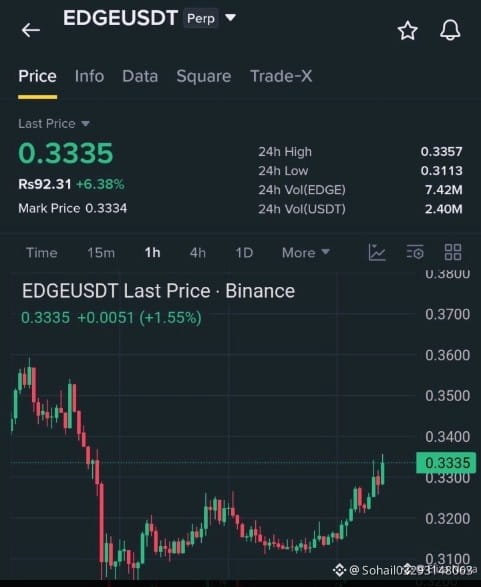
is holding above its short-term trend levels, keeping the bullish outlook in focus. Buyers may have room to push higher if the current strength continues.
🟢 Entry: $0.3300–$0.3340
🎯 TP1: $0.3400
🎯 TP2: $0.3470
🎯 TP3: $0.3520
🛑 SL: $0.3210
The upside looks interesting, but patience is important here. A better entry is always worth waiting for.
Also keeping eyes on $KOMA
{alpha}(560xd5eaaac47bd1993d661bc087e15dfb079a7f3c19)
& $AIOT
{alpha}(560x55ad16bd573b3365f43a9daeb0cc66a73821b4a5)
.
Take Trade here 👇🏻
#TradFiForBeginners
#HKSFCPlansToRestrictCryptoAndExchangeTerms #JobsReportRaisesHikeOdds
#HKSFCToExpandRestrictedTitlesList
#CPITestsDecemberRateOutlook
$EDGE
is holding above its short-term trend levels, keeping the bullish outlook in focus. Buyers may have room to push higher if the current strength continues.
🟢 Entry: $0.3300–$0.3340
🎯 TP1: $0.3400
🎯 TP2: $0.3470
🎯 TP3: $0.3520
🛑 SL: $0.3210
The upside looks interesting, but patience is important here. A better entry is always worth waiting for.
Also keeping eyes on $KOMA
& $AIOT
.
Take Trade here 👇🏻
#TradFiForBeginners
#HKSFCPlansToRestrictCryptoAndExchangeTerms #JobsReportRaisesHikeOdds
#HKSFCToExpandRestrictedTitlesList
#CPITestsDecemberRateOutlook
is holding above its short-term trend levels, keeping the bullish outlook in focus. Buyers may have room to push higher if the current strength continues.
🟢 Entry: $0.3300–$0.3340
🎯 TP1: $0.3400
🎯 TP2: $0.3470
🎯 TP3: $0.3520
🛑 SL: $0.3210
The upside looks interesting, but patience is important here. A better entry is always worth waiting for.
Also keeping eyes on $KOMA
& $AIOT
.
Take Trade here 👇🏻
#TradFiForBeginners
#HKSFCPlansToRestrictCryptoAndExchangeTerms #JobsReportRaisesHikeOdds
#HKSFCToExpandRestrictedTitlesList
#CPITestsDecemberRateOutlook
1
993
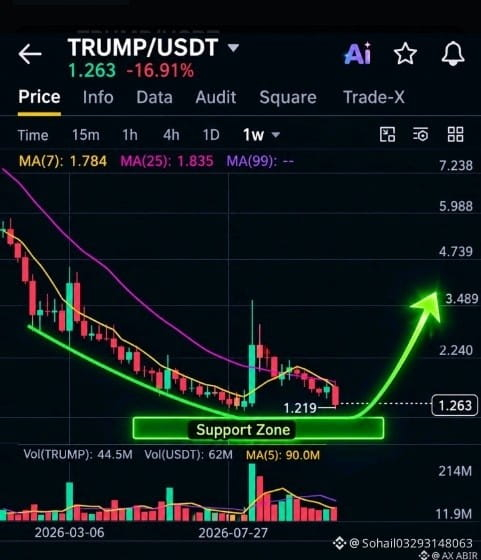
🚀 Is $TRUMP
{future}(TRUMPUSDT)
Ready for a Bounce?
Selling pressure appears to be fading, while buyers are showing renewed interest.
📈 Watch for a potential recovery, but always confirm the trend before entering.
⚠️ Trade carefully and manage your risk!
#TRUMP #TRUMPUSDT #cryptotrading #Binance #BTC
$ETH $BTC
{future}(BTCUSDT)
{future}(ETHUSDT)
🚀 Is $TRUMP
Ready for a Bounce?
Selling pressure appears to be fading, while buyers are showing renewed interest.
📈 Watch for a potential recovery, but always confirm the trend before entering.
⚠️ Trade carefully and manage your risk!
#TRUMP #TRUMPUSDT #cryptotrading #Binance #BTC
$ETH $BTC
Ready for a Bounce?
Selling pressure appears to be fading, while buyers are showing renewed interest.
📈 Watch for a potential recovery, but always confirm the trend before entering.
⚠️ Trade carefully and manage your risk!
#TRUMP #TRUMPUSDT #cryptotrading #Binance #BTC
$ETH $BTC
63
$MET
{future}(METUSDT)
Everyone is looking at the sky for a meteor...
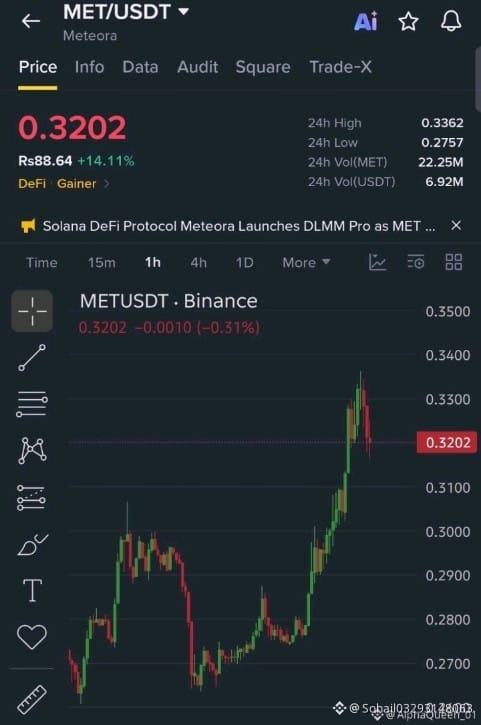
While $MET is already crashing UP on the chart. ☄️
Solana DeFi star Meteora just launched DLMM Pro, and $MET is up +14.11% in 24h, now at $0.3202.
From $0.2757 low to $0.3362 high — that's not a pump, that's a launchpad.
Meteors don't come twice. Did you catch this one?
#MET #Meteora #Solana #DeFi #Crypto
$MET
Everyone is looking at the sky for a meteor...
While $MET is already crashing UP on the chart. ☄️
Solana DeFi star Meteora just launched DLMM Pro, and $MET is up +14.11% in 24h, now at $0.3202.
From $0.2757 low to $0.3362 high — that's not a pump, that's a launchpad.
Meteors don't come twice. Did you catch this one?
#MET #Meteora #Solana #DeFi #Crypto
Everyone is looking at the sky for a meteor...
While $MET is already crashing UP on the chart. ☄️
Solana DeFi star Meteora just launched DLMM Pro, and $MET is up +14.11% in 24h, now at $0.3202.
From $0.2757 low to $0.3362 high — that's not a pump, that's a launchpad.
Meteors don't come twice. Did you catch this one?
#MET #Meteora #Solana #DeFi #Crypto
1
76
$CYPH
{future}(CYPHUSDT)
| LONG SETUP
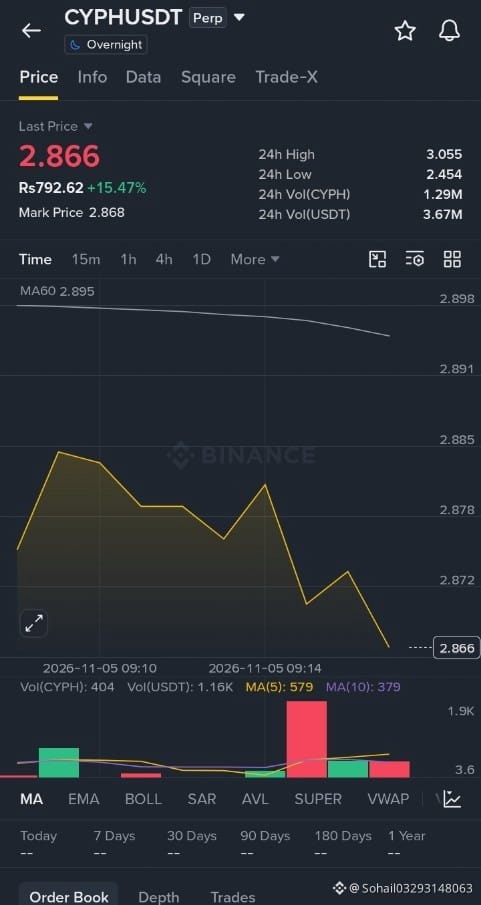
💰 Entry: $2.774
🎯 Target1: $2.79342
🎯 Target2: $2.81561
🎯 Target3: $2.84335
🎯 Target4: $2.87941
🎯 Target5: $2.91825
🛡 STOP: $2.63530
#USClearsSingleStockPerpetualFutures
#TRUMPFalls18.1%In24HoursToRecordLow
#USOctoberNFP-AreRateCutsStillPossible
#USMidterms-WhatAreMarketsExpecting?
#Binance98PercentReplenished
$CYPH
| LONG SETUP
💰 Entry: $2.774
🎯 Target1: $2.79342
🎯 Target2: $2.81561
🎯 Target3: $2.84335
🎯 Target4: $2.87941
🎯 Target5: $2.91825
🛡 STOP: $2.63530
#USClearsSingleStockPerpetualFutures
#TRUMPFalls18.1%In24HoursToRecordLow
#USOctoberNFP-AreRateCutsStillPossible
#USMidterms-WhatAreMarketsExpecting?
#Binance98PercentReplenished
| LONG SETUP
💰 Entry: $2.774
🎯 Target1: $2.79342
🎯 Target2: $2.81561
🎯 Target3: $2.84335
🎯 Target4: $2.87941
🎯 Target5: $2.91825
🛡 STOP: $2.63530
#USClearsSingleStockPerpetualFutures
#TRUMPFalls18.1%In24HoursToRecordLow
#USOctoberNFP-AreRateCutsStillPossible
#USMidterms-WhatAreMarketsExpecting?
#Binance98PercentReplenished
56
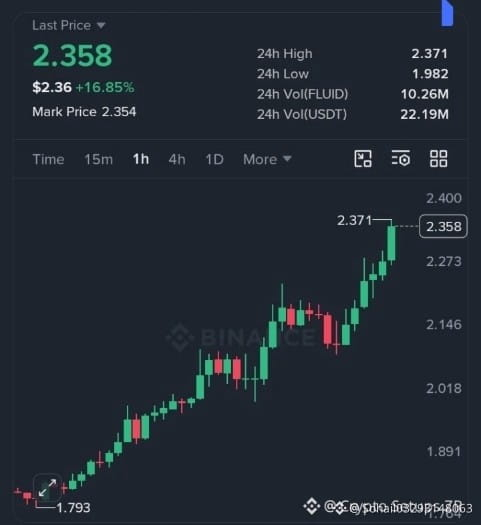
#clanker delivered, #idol delivered..🟢‼️Now $FLUID runner is in full expansion💥 2.18 entry already printing +75% profit🟢Next target 🎯 2.50 incoming? Call it below👇
{alpha}(10x6f40d4a6237c257fff2db00fa0510deeecd303eb)
$IDOL
{alpha}(560x3b4de3c7855c03bb9f50ea252cd2c9fa1125ab07)
$CLANKER
{alpha}(84530x1bc0c42215582d5a085795f4badbac3ff36d1bcb)
#USOctoberNFP-AreRateCutsStillPossible #USMidterms-WhatAreMarketsExpecting? #BTCRebounds80K
#clanker delivered, #idol delivered..🟢‼️Now $FLUID runner is in full expansion💥 2.18 entry already printing +75% profit🟢Next target 🎯 2.50 incoming? Call it below👇
$IDOL
$CLANKER
#USOctoberNFP-AreRateCutsStillPossible #USMidterms-WhatAreMarketsExpecting? #BTCRebounds80K
$IDOL
$CLANKER
#USOctoberNFP-AreRateCutsStillPossible #USMidterms-WhatAreMarketsExpecting? #BTCRebounds80K
1
1
1k
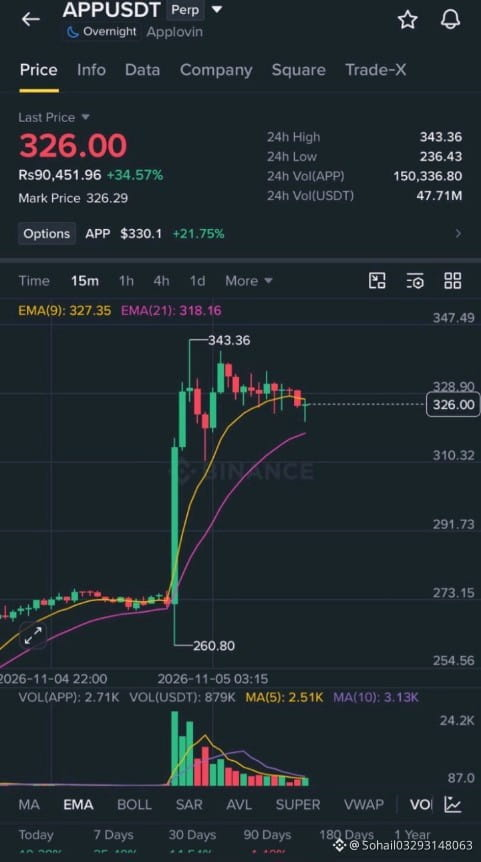
$APP
{future}(APPUSDT)
big long now
Tp 395
Sl 300
Trade long now guys from here 👇🏻👇🏻👇🏻
#TRUMPFalls18.1%In24HoursToRecordLow
#USOctoberNFP-AreRateCutsStillPossible
#USMidterms-WhatAreMarketsExpecting?
#BTCRebounds80K
#BinanceReopensWithdrawalsForMoreAssets
$APP
big long now
Tp 395
Sl 300
Trade long now guys from here 👇🏻👇🏻👇🏻
#TRUMPFalls18.1%In24HoursToRecordLow
#USOctoberNFP-AreRateCutsStillPossible
#USMidterms-WhatAreMarketsExpecting?
#BTCRebounds80K
#BinanceReopensWithdrawalsForMoreAssets
big long now
Tp 395
Sl 300
Trade long now guys from here 👇🏻👇🏻👇🏻
#TRUMPFalls18.1%In24HoursToRecordLow
#USOctoberNFP-AreRateCutsStillPossible
#USMidterms-WhatAreMarketsExpecting?
#BTCRebounds80K
#BinanceReopensWithdrawalsForMoreAssets
131
$ELSA
{alpha}(84530x29cc30f9d113b356ce408667aa6433589cecbdca)
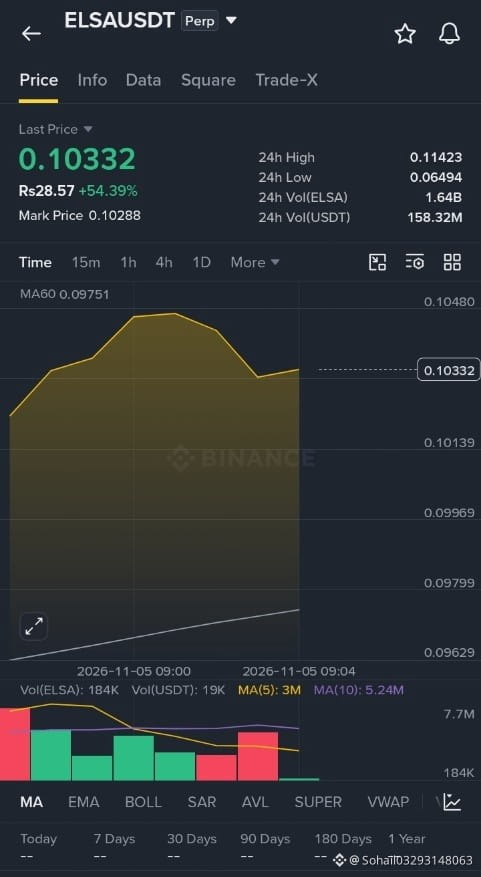
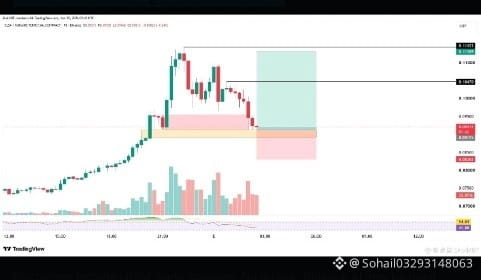
just stepped back a little, and honestly this is the part I was waiting for 👀
I'm opening a LONG on $ELSA right now.
TP: $0.104 / $0.113
Invalidation: $0.083 👇🏻
ELSAUSDT
Perp
0.105
+56.81%
$ELSA is in a strong bullish momentum, and the price has been pushing up with real power. Now it came down a little bit into the demand zone, right where the imbalance is sitting. In a trend like this, that kind of pullback is normal, and it gives buyers a fresh place to step in.
Because the trend is still continuing, I expect one more bullish move from here, and it can reach the recent high. The market already showed us who is in control, and now it is just giving us a better price to join 💯
I'm with the buyers on this on
#BinanceReopensWithdrawalsForMoreAssets
#BTCRebounds80K
#Binance98PercentReplenished
#USMidterms-WhatAreMarketsExpecting?
#USOctoberNFP-AreRateCutsStillPossible
$ELSA
just stepped back a little, and honestly this is the part I was waiting for 👀
I'm opening a LONG on $ELSA right now.
TP: $0.104 / $0.113
Invalidation: $0.083 👇🏻
ELSAUSDT
Perp
0.105
+56.81%
$ELSA is in a strong bullish momentum, and the price has been pushing up with real power. Now it came down a little bit into the demand zone, right where the imbalance is sitting. In a trend like this, that kind of pullback is normal, and it gives buyers a fresh place to step in.
Because the trend is still continuing, I expect one more bullish move from here, and it can reach the recent high. The market already showed us who is in control, and now it is just giving us a better price to join 💯
I'm with the buyers on this on
#BinanceReopensWithdrawalsForMoreAssets
#BTCRebounds80K
#Binance98PercentReplenished
#USMidterms-WhatAreMarketsExpecting?
#USOctoberNFP-AreRateCutsStillPossible
just stepped back a little, and honestly this is the part I was waiting for 👀
I'm opening a LONG on $ELSA right now.
TP: $0.104 / $0.113
Invalidation: $0.083 👇🏻
ELSAUSDT
Perp
0.105
+56.81%
$ELSA is in a strong bullish momentum, and the price has been pushing up with real power. Now it came down a little bit into the demand zone, right where the imbalance is sitting. In a trend like this, that kind of pullback is normal, and it gives buyers a fresh place to step in.
Because the trend is still continuing, I expect one more bullish move from here, and it can reach the recent high. The market already showed us who is in control, and now it is just giving us a better price to join 💯
I'm with the buyers on this on
#BinanceReopensWithdrawalsForMoreAssets
#BTCRebounds80K
#Binance98PercentReplenished
#USMidterms-WhatAreMarketsExpecting?
#USOctoberNFP-AreRateCutsStillPossible
1
2
492
·
--
Рост
$LUMIA
{future}(LUMIAUSDT)
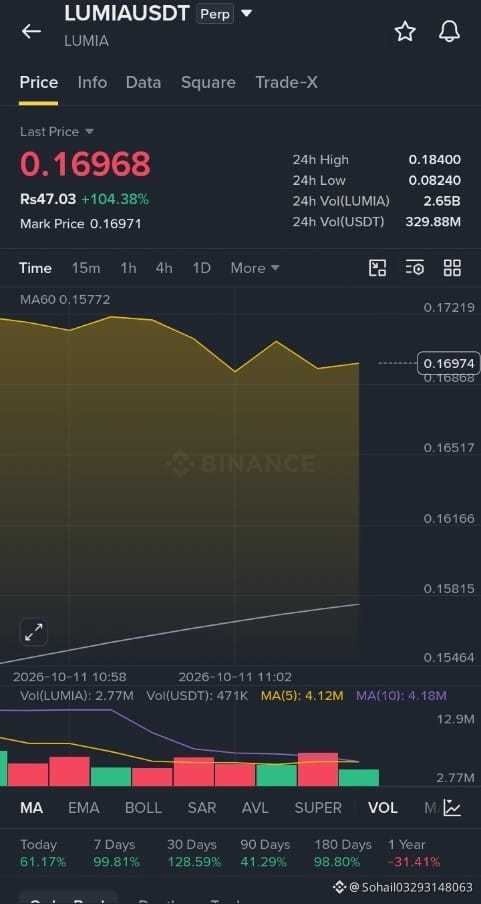
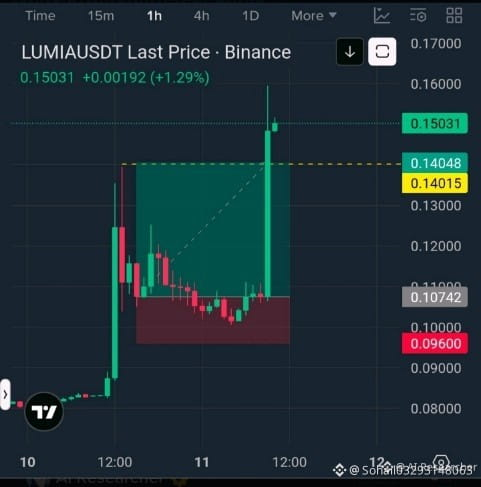
This actually feels a little unfair 😭
Yesterday I shared the $LUMIA long almost from the bottom, when most people were still unsure whether that dump was the end or just a trap.
We took the setup, stayed patient, and then $LUMIA finally exploded.
From our area, the move gave us roughly 50%+ and pushed straight through the target zone.
And the best part is seeing people from the community come back with their own profits. That’s the part that makes all the waiting worth it. ❤️
I know some of you closed earlier, some held longer, some made a little, some made a lot but we were there before the move became obvious.
That’s what matters to me.
Yesterday we bought the fear. Today we’re looking at the result.
#LUMIAUSDT
#XRPLedgerPatchesXRPCreationBug
#STRKRisesAbout20%In24Hours
#TetherFreezesUSDTLinkedToLedgerTheft
#CFTCMovesToFoldEventContractsIntoSwapsRules
$LUMIA
This actually feels a little unfair 😭
Yesterday I shared the $LUMIA long almost from the bottom, when most people were still unsure whether that dump was the end or just a trap.
We took the setup, stayed patient, and then $LUMIA finally exploded.
From our area, the move gave us roughly 50%+ and pushed straight through the target zone.
And the best part is seeing people from the community come back with their own profits. That’s the part that makes all the waiting worth it. ❤️
I know some of you closed earlier, some held longer, some made a little, some made a lot but we were there before the move became obvious.
That’s what matters to me.
Yesterday we bought the fear. Today we’re looking at the result.
#LUMIAUSDT
#XRPLedgerPatchesXRPCreationBug
#STRKRisesAbout20%In24Hours
#TetherFreezesUSDTLinkedToLedgerTheft
#CFTCMovesToFoldEventContractsIntoSwapsRules
This actually feels a little unfair 😭
Yesterday I shared the $LUMIA long almost from the bottom, when most people were still unsure whether that dump was the end or just a trap.
We took the setup, stayed patient, and then $LUMIA finally exploded.
From our area, the move gave us roughly 50%+ and pushed straight through the target zone.
And the best part is seeing people from the community come back with their own profits. That’s the part that makes all the waiting worth it. ❤️
I know some of you closed earlier, some held longer, some made a little, some made a lot but we were there before the move became obvious.
That’s what matters to me.
Yesterday we bought the fear. Today we’re looking at the result.
#LUMIAUSDT
#XRPLedgerPatchesXRPCreationBug
#STRKRisesAbout20%In24Hours
#TetherFreezesUSDTLinkedToLedgerTheft
#CFTCMovesToFoldEventContractsIntoSwapsRules
1
126
$RAY
{spot}(RAYUSDT)
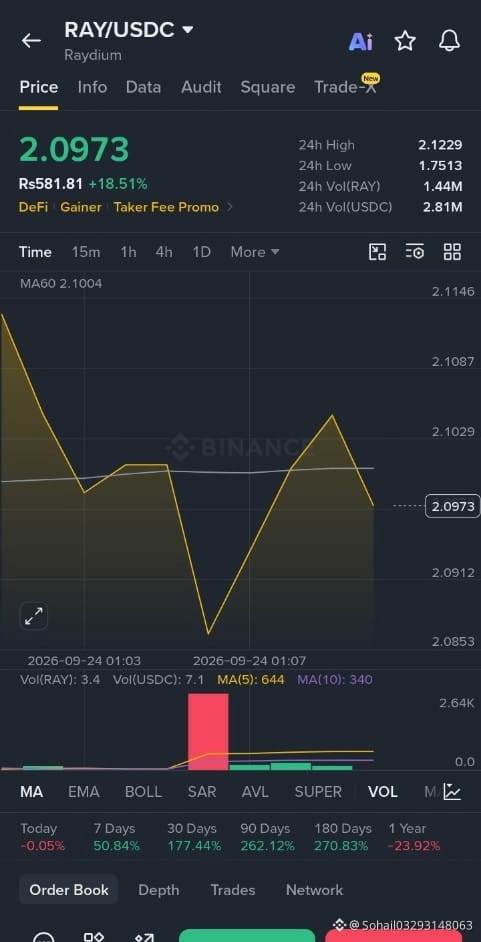
#RAY LONG — Breakout Momentum Targets Higher
Trade Setup: LONG
Entry: 1.9851
Target: 2.2085
SL: 1.8713
RAY is holding above the breakout area with strong bullish momentum on the 1H chart.
If the entry zone holds, the marked upside target at 2.2085 comes into focus.
Take a trade on RAY 👇
$FORM
{future}(FORMUSDT)
#CardanoJoinsX402PaymentStandard
#21SharesLaunchesEuropesFirstZcashETP
#DollarIndexReclaims101
#AIStocksWhatNext
$RAY
#RAY LONG — Breakout Momentum Targets Higher
Trade Setup: LONG
Entry: 1.9851
Target: 2.2085
SL: 1.8713
RAY is holding above the breakout area with strong bullish momentum on the 1H chart.
If the entry zone holds, the marked upside target at 2.2085 comes into focus.
Take a trade on RAY 👇
$FORM
#CardanoJoinsX402PaymentStandard
#21SharesLaunchesEuropesFirstZcashETP
#DollarIndexReclaims101
#AIStocksWhatNext
#RAY LONG — Breakout Momentum Targets Higher
Trade Setup: LONG
Entry: 1.9851
Target: 2.2085
SL: 1.8713
RAY is holding above the breakout area with strong bullish momentum on the 1H chart.
If the entry zone holds, the marked upside target at 2.2085 comes into focus.
Take a trade on RAY 👇
$FORM
#CardanoJoinsX402PaymentStandard
#21SharesLaunchesEuropesFirstZcashETP
#DollarIndexReclaims101
#AIStocksWhatNext
60
$NIL
{future}(NILUSDT)
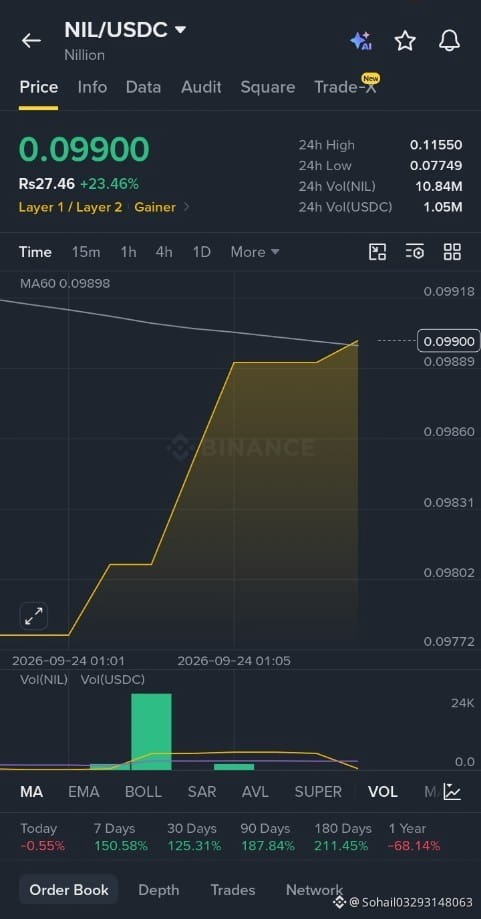
#NIL LONG SETUP ... NEXT TARGET 0.1100
NIL is bouncing strongly after its recent correction. Bulls are attempting to reclaim 0.10, opening the door for another rally.
Entry: 0.0980–0.1000
TP1: 0.1030
TP2: 0.1060
Next Price: 0.1080
Final Target: 0.1100
SL: 0.09050
A sustained breakout above 0.10 could accelerate bullish momentum toward our final target.
Trade on $NIL
#CardanoJoinsX402PaymentStandard
#DollarIndexReclaims101
#BCHJumps28%OnCMEFuturesListing
#AIStocksWhatNext
$NIL
#NIL LONG SETUP ... NEXT TARGET 0.1100
NIL is bouncing strongly after its recent correction. Bulls are attempting to reclaim 0.10, opening the door for another rally.
Entry: 0.0980–0.1000
TP1: 0.1030
TP2: 0.1060
Next Price: 0.1080
Final Target: 0.1100
SL: 0.09050
A sustained breakout above 0.10 could accelerate bullish momentum toward our final target.
Trade on $NIL
#CardanoJoinsX402PaymentStandard
#DollarIndexReclaims101
#BCHJumps28%OnCMEFuturesListing
#AIStocksWhatNext
#NIL LONG SETUP ... NEXT TARGET 0.1100
NIL is bouncing strongly after its recent correction. Bulls are attempting to reclaim 0.10, opening the door for another rally.
Entry: 0.0980–0.1000
TP1: 0.1030
TP2: 0.1060
Next Price: 0.1080
Final Target: 0.1100
SL: 0.09050
A sustained breakout above 0.10 could accelerate bullish momentum toward our final target.
Trade on $NIL
#CardanoJoinsX402PaymentStandard
#DollarIndexReclaims101
#BCHJumps28%OnCMEFuturesListing
#AIStocksWhatNext
91
Войдите, чтобы посмотреть больше материала
Присоединяйтесь к пользователям криптовалют по всему миру на Binance Square
⚡️ Получайте новейшую и полезную информацию о криптоактивах.
💬 Нам доверяет крупнейшая в мире криптобиржа.
👍 Получите достоверные аналитические данные от верифицированных создателей контента.
Эл. почта/номер телефона
В тренде
HuangRisksOusterOverReportedAffairWithSubordinate
Просмотров: 35,208
563 обсуждают
Nvidia Board Meets to Decide Jensen Huang's Future as Crisis Deepens
Binance News
·Лайков: 28
·Просмотров: 33.9k
AnthropicRejectsIPODelayValuationinQuestion
Просмотров: 482,149
3,994 обсуждают
CoreWeaveJumps10%On168%RevenueGrowth
Просмотров: 71,220
927 обсуждают