
Honest Treader
6 Публикации

Honest Treader
Отправить жалобу
Заблокировать пользователя
Открытая сделка
3 г
0 подписок(и/а)
1 подписчиков(а)
0 понравилось
Посты
Портфель
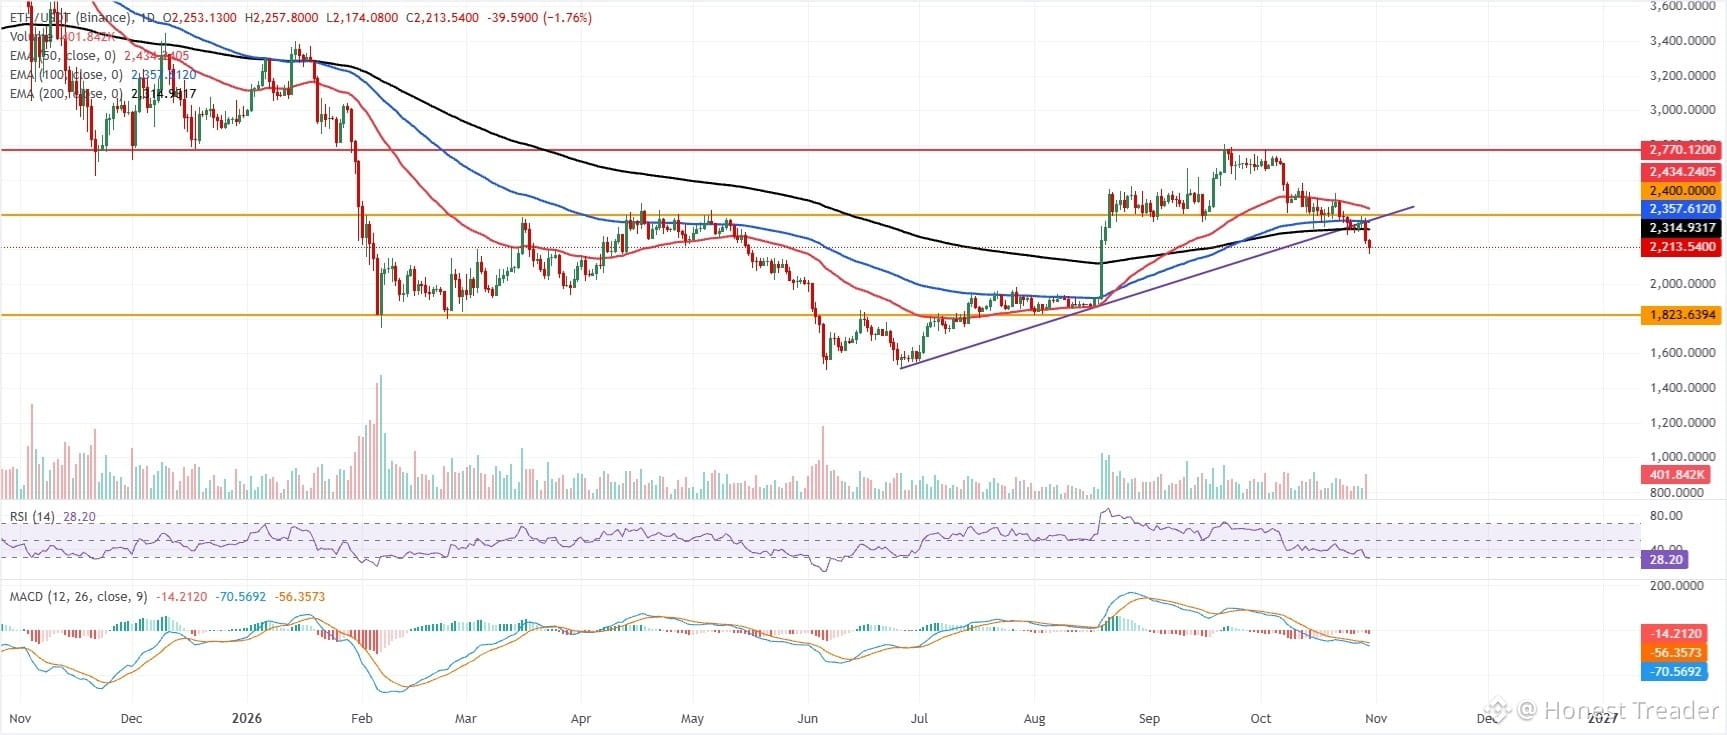
$ETH 1st pic: ETH/USDT ka lamba chart - Nov 2025 se Oct 2026 tak. Price $3,400 se gir ke $1,500 tak gaya, phir $2,770 tak recover hua, aur ab phir $2,213 ke around weak hai. RSI 28.20 hai matlab oversold. • 2nd pic: ETH ka live tracker - price $2,064.50, 24h me +5.12% up, market cap $249B. • 3rd pic: ETH intraday graph - price $2,309.7, up +0.88%.
{spot}(ETHUSDT)
#CanNvidia’sDataCenterGrowthContinue? #LedgerHardwareImplantReportsExtendToDubai #ETH🔥🔥🔥🔥🔥🔥
$ETH 1st pic: ETH/USDT ka lamba chart - Nov 2025 se Oct 2026 tak. Price $3,400 se gir ke $1,500 tak gaya, phir $2,770 tak recover hua, aur ab phir $2,213 ke around weak hai. RSI 28.20 hai matlab oversold. • 2nd pic: ETH ka live tracker - price $2,064.50, 24h me +5.12% up, market cap $249B. • 3rd pic: ETH intraday graph - price $2,309.7, up +0.88%.
#CanNvidia’sDataCenterGrowthContinue? #LedgerHardwareImplantReportsExtendToDubai #ETH🔥🔥🔥🔥🔥🔥
#CanNvidia’sDataCenterGrowthContinue? #LedgerHardwareImplantReportsExtendToDubai #ETH🔥🔥🔥🔥🔥🔥
51
$MEME #Memecoins🤑🤑
{spot}(MEMEUSDT)
Short Latest Analysis: Crypto Meme Coins - Nov 2026
Market Mood: Fear + Rotation, Not Full Meme Season
Sentiment is in Fear zone around 37, and most meme coins are down over the last 7 days. Money is rotating fast into very short-lived pumps instead of holding blue-chip memes.
What’s Hot Right Now:
• MemeCore / FLOKI: MemeCore is the biggest of the new trending batch at ∼$1.88B market cap, while FLOKI remains the veteran name traders still watch. • MowCat: Top 24h mover, up 53.9% in a day, but it hit its all-time low just 2 months ago - classic high-volatility pump. • PEPE: Showed early-November rebound + whale activity, with strong liquidity on Ethereum. Still the main momentum play among old memes. • Solana memes: Meme activity alone lifted Solana active addresses 38% to 31.3M in one week in early November.
Big Caps - Still King:
As of late Oct: DOGE ∼$12.2B, SHIB ∼$2.85B, PEPE ∼$2.07B, BONK ∼$267M, FLOKI ∼$224M. DOGE stays #1, but its ETF (BWOW) closed/liquidated on Oct 22 - a bearish signal for institutional hype.
Social Take:
On socials, traders are split - hype for quick 2x-10x on mid-caps ($10M-$100M cap) vs warnings about rug-pulls, influencer pumps, and AI coins outperforming memes into 2027-28.
Quick Verdict
Short-term: Trade only, don't marry. Watch PEPE, MemeCore, FLOKI for momentum.
Long-term: Avoid chasing low-cap new launches. High risk, fast rotation.
Strategy: Small size, tight stop-loss, take profit fast. Only money you can afford to lose.
#AnthropicIPOTestsInvestorAppetiteForAI #HuangReportedlyConsidersReturnToNvidia #CryptoSelloffTriggersMultipleWhaleLiquidations #WillFOMCMinutesReinforceRateHikeExpectations?
$MEME #Memecoins🤑🤑
Short Latest Analysis: Crypto Meme Coins - Nov 2026
Market Mood: Fear + Rotation, Not Full Meme Season
Sentiment is in Fear zone around 37, and most meme coins are down over the last 7 days. Money is rotating fast into very short-lived pumps instead of holding blue-chip memes.
What’s Hot Right Now:
• MemeCore / FLOKI: MemeCore is the biggest of the new trending batch at ∼$1.88B market cap, while FLOKI remains the veteran name traders still watch. • MowCat: Top 24h mover, up 53.9% in a day, but it hit its all-time low just 2 months ago - classic high-volatility pump. • PEPE: Showed early-November rebound + whale activity, with strong liquidity on Ethereum. Still the main momentum play among old memes. • Solana memes: Meme activity alone lifted Solana active addresses 38% to 31.3M in one week in early November.
Big Caps - Still King:
As of late Oct: DOGE ∼$12.2B, SHIB ∼$2.85B, PEPE ∼$2.07B, BONK ∼$267M, FLOKI ∼$224M. DOGE stays #1, but its ETF (BWOW) closed/liquidated on Oct 22 - a bearish signal for institutional hype.
Social Take:
On socials, traders are split - hype for quick 2x-10x on mid-caps ($10M-$100M cap) vs warnings about rug-pulls, influencer pumps, and AI coins outperforming memes into 2027-28.
Quick Verdict
Short-term: Trade only, don't marry. Watch PEPE, MemeCore, FLOKI for momentum.
Long-term: Avoid chasing low-cap new launches. High risk, fast rotation.
Strategy: Small size, tight stop-loss, take profit fast. Only money you can afford to lose.
#AnthropicIPOTestsInvestorAppetiteForAI #HuangReportedlyConsidersReturnToNvidia #CryptoSelloffTriggersMultipleWhaleLiquidations #WillFOMCMinutesReinforceRateHikeExpectations?
Short Latest Analysis: Crypto Meme Coins - Nov 2026
Market Mood: Fear + Rotation, Not Full Meme Season
Sentiment is in Fear zone around 37, and most meme coins are down over the last 7 days. Money is rotating fast into very short-lived pumps instead of holding blue-chip memes.
What’s Hot Right Now:
• MemeCore / FLOKI: MemeCore is the biggest of the new trending batch at ∼$1.88B market cap, while FLOKI remains the veteran name traders still watch. • MowCat: Top 24h mover, up 53.9% in a day, but it hit its all-time low just 2 months ago - classic high-volatility pump. • PEPE: Showed early-November rebound + whale activity, with strong liquidity on Ethereum. Still the main momentum play among old memes. • Solana memes: Meme activity alone lifted Solana active addresses 38% to 31.3M in one week in early November.
Big Caps - Still King:
As of late Oct: DOGE ∼$12.2B, SHIB ∼$2.85B, PEPE ∼$2.07B, BONK ∼$267M, FLOKI ∼$224M. DOGE stays #1, but its ETF (BWOW) closed/liquidated on Oct 22 - a bearish signal for institutional hype.
Social Take:
On socials, traders are split - hype for quick 2x-10x on mid-caps ($10M-$100M cap) vs warnings about rug-pulls, influencer pumps, and AI coins outperforming memes into 2027-28.
Quick Verdict
Short-term: Trade only, don't marry. Watch PEPE, MemeCore, FLOKI for momentum.
Long-term: Avoid chasing low-cap new launches. High risk, fast rotation.
Strategy: Small size, tight stop-loss, take profit fast. Only money you can afford to lose.
#AnthropicIPOTestsInvestorAppetiteForAI #HuangReportedlyConsidersReturnToNvidia #CryptoSelloffTriggersMultipleWhaleLiquidations #WillFOMCMinutesReinforceRateHikeExpectations?
382
·
--
Рост
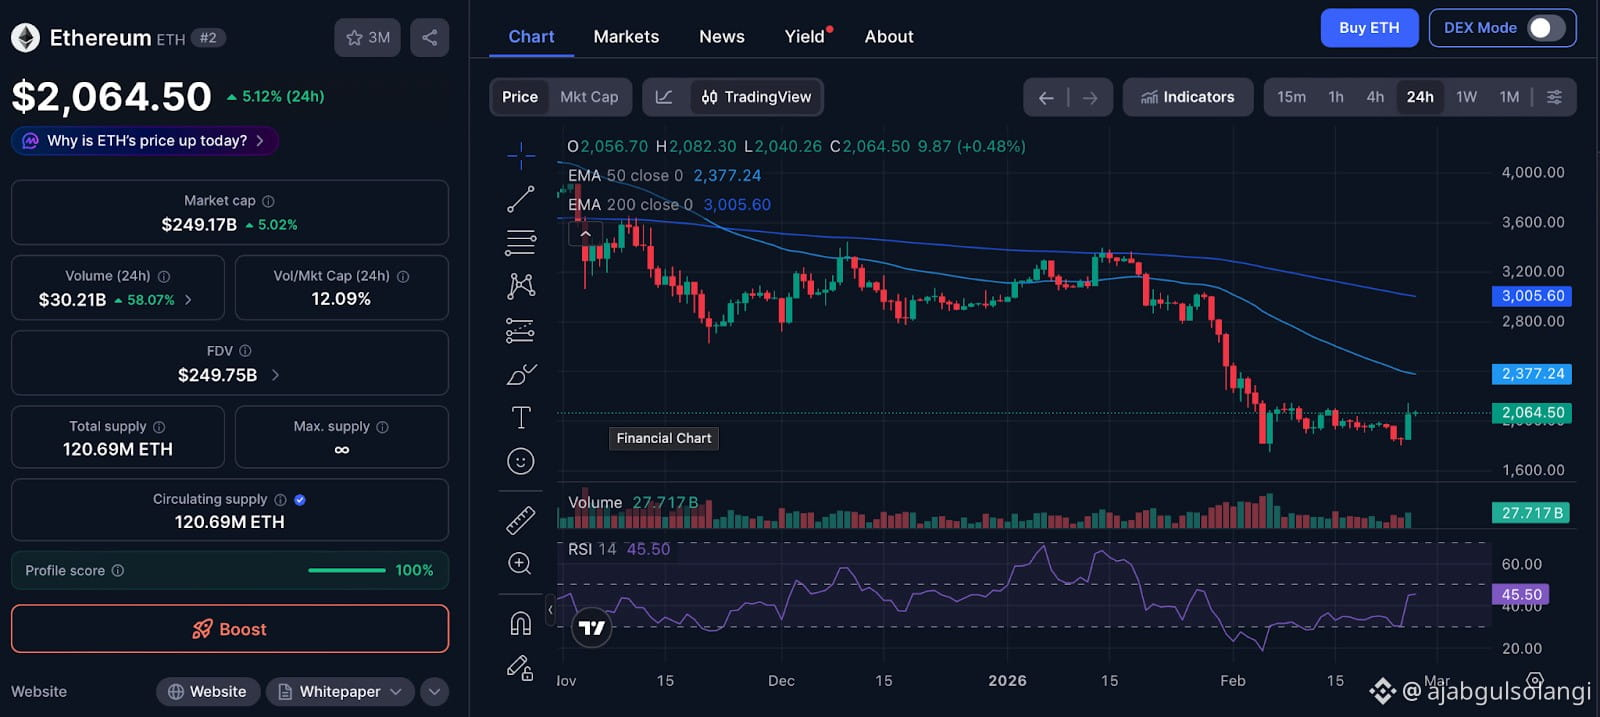
$ETH Current picture: ETH is in a sharp downtrend in November. It fell from around $2,275 on Nov 1 to around $1,822 on Nov 16, down about -24% in 1 month and -39% year-to-date.
What happened:
• Early November saw a brief bounce above $2,400 on Nov 4, but sellers took control again. • The drop accelerated after Nov 8, with ETH breaking below $2,100, then $2,000, then $1,900, hitting lows near $1,711-$1,729 on Nov 14-15. • Momentum is still weak and oversold. Daily RSI was around 29.9 on Nov 12, with MACD still negative, meaning bounces so far have not repaired the trend.
Key levels to watch:
• Support: $1,820 - $1,900, then $1,760 • Resistance: $1,955 - $2,000, then $2,200 - $2,320
Analysts flagged the $2,200-$2,320 zone as the decider: holding it would allow a rebuild toward $2,500-$2,800, losing it opens $1,820-$2,000. ETH has now lost it, so the bias stays bearish until it reclaims $2,000.
Short-term view: Bearish / oversold bounce possible, but not a confirmed reversal. A hold above $1,900 could give a bounce to $1,955-$2,000, while a break below $1,833 would expose deeper downside.
{spot}(ETHUSDT)
#CryptoSelloffTriggersMultipleWhaleLiquidations #About64000BitcoinMiningMachinesReportedlyHijacked #BitcoinActiveSupplyInProfitDropsBelow45%
$ETH Current picture: ETH is in a sharp downtrend in November. It fell from around $2,275 on Nov 1 to around $1,822 on Nov 16, down about -24% in 1 month and -39% year-to-date.
What happened:
• Early November saw a brief bounce above $2,400 on Nov 4, but sellers took control again. • The drop accelerated after Nov 8, with ETH breaking below $2,100, then $2,000, then $1,900, hitting lows near $1,711-$1,729 on Nov 14-15. • Momentum is still weak and oversold. Daily RSI was around 29.9 on Nov 12, with MACD still negative, meaning bounces so far have not repaired the trend.
Key levels to watch:
• Support: $1,820 - $1,900, then $1,760 • Resistance: $1,955 - $2,000, then $2,200 - $2,320
Analysts flagged the $2,200-$2,320 zone as the decider: holding it would allow a rebuild toward $2,500-$2,800, losing it opens $1,820-$2,000. ETH has now lost it, so the bias stays bearish until it reclaims $2,000.
Short-term view: Bearish / oversold bounce possible, but not a confirmed reversal. A hold above $1,900 could give a bounce to $1,955-$2,000, while a break below $1,833 would expose deeper downside.
#CryptoSelloffTriggersMultipleWhaleLiquidations #About64000BitcoinMiningMachinesReportedlyHijacked #BitcoinActiveSupplyInProfitDropsBelow45%
What happened:
• Early November saw a brief bounce above $2,400 on Nov 4, but sellers took control again. • The drop accelerated after Nov 8, with ETH breaking below $2,100, then $2,000, then $1,900, hitting lows near $1,711-$1,729 on Nov 14-15. • Momentum is still weak and oversold. Daily RSI was around 29.9 on Nov 12, with MACD still negative, meaning bounces so far have not repaired the trend.
Key levels to watch:
• Support: $1,820 - $1,900, then $1,760 • Resistance: $1,955 - $2,000, then $2,200 - $2,320
Analysts flagged the $2,200-$2,320 zone as the decider: holding it would allow a rebuild toward $2,500-$2,800, losing it opens $1,820-$2,000. ETH has now lost it, so the bias stays bearish until it reclaims $2,000.
Short-term view: Bearish / oversold bounce possible, but not a confirmed reversal. A hold above $1,900 could give a bounce to $1,955-$2,000, while a break below $1,833 would expose deeper downside.
#CryptoSelloffTriggersMultipleWhaleLiquidations #About64000BitcoinMiningMachinesReportedlyHijacked #BitcoinActiveSupplyInProfitDropsBelow45%
111
#$PEPE
Price: ~$0.00000389
Market Cap: ~$1.61B | Trend: Bearish short-term
What happened:
• Down ∼7-9% in 24h and ∼19-25% in 5 days, extending the memecoin sell-off. • Broke its daily uptrend with a close under $0.00000429, confirming a double-top pattern. • RSI around 38, MACD still negative, stochastic oversold - weak momentum, but bounce possible.
Levels to watch:
• Support: $0.00000369 - $0.00000370 (Nov 14-15 low) • Resistance: $0.00000429 - $0.00000440 (breakdown level) • Risk: If $0.00000369 breaks, next drop toward $0.00000350.
Short-term bias: Bearish below $0.00000429. Only a daily close back above that level flips it neutral. Don't chase longs here, wait for hold at support or reclaim.
{spot}(PEPEUSDT)
#BitcoinActiveSupplyInProfitDropsBelow45% #KavaSaysAbnormalActivityLimitedToKavaLend #WhatWillDriveCryptoandStocks’NextRebound? #BitcoinActiveSupplyInProfitDropsBelow45% #BitcoinActiveSupplyInProfitDropsBelow45%
#$PEPE
Price: ~$0.00000389
Market Cap: ~$1.61B | Trend: Bearish short-term
What happened:
• Down ∼7-9% in 24h and ∼19-25% in 5 days, extending the memecoin sell-off. • Broke its daily uptrend with a close under $0.00000429, confirming a double-top pattern. • RSI around 38, MACD still negative, stochastic oversold - weak momentum, but bounce possible.
Levels to watch:
• Support: $0.00000369 - $0.00000370 (Nov 14-15 low) • Resistance: $0.00000429 - $0.00000440 (breakdown level) • Risk: If $0.00000369 breaks, next drop toward $0.00000350.
Short-term bias: Bearish below $0.00000429. Only a daily close back above that level flips it neutral. Don't chase longs here, wait for hold at support or reclaim.
#BitcoinActiveSupplyInProfitDropsBelow45% #KavaSaysAbnormalActivityLimitedToKavaLend #WhatWillDriveCryptoandStocks’NextRebound? #BitcoinActiveSupplyInProfitDropsBelow45% #BitcoinActiveSupplyInProfitDropsBelow45%
Price: ~$0.00000389
Market Cap: ~$1.61B | Trend: Bearish short-term
What happened:
• Down ∼7-9% in 24h and ∼19-25% in 5 days, extending the memecoin sell-off. • Broke its daily uptrend with a close under $0.00000429, confirming a double-top pattern. • RSI around 38, MACD still negative, stochastic oversold - weak momentum, but bounce possible.
Levels to watch:
• Support: $0.00000369 - $0.00000370 (Nov 14-15 low) • Resistance: $0.00000429 - $0.00000440 (breakdown level) • Risk: If $0.00000369 breaks, next drop toward $0.00000350.
Short-term bias: Bearish below $0.00000429. Only a daily close back above that level flips it neutral. Don't chase longs here, wait for hold at support or reclaim.
#BitcoinActiveSupplyInProfitDropsBelow45% #KavaSaysAbnormalActivityLimitedToKavaLend #WhatWillDriveCryptoandStocks’NextRebound? #BitcoinActiveSupplyInProfitDropsBelow45% #BitcoinActiveSupplyInProfitDropsBelow45%

96
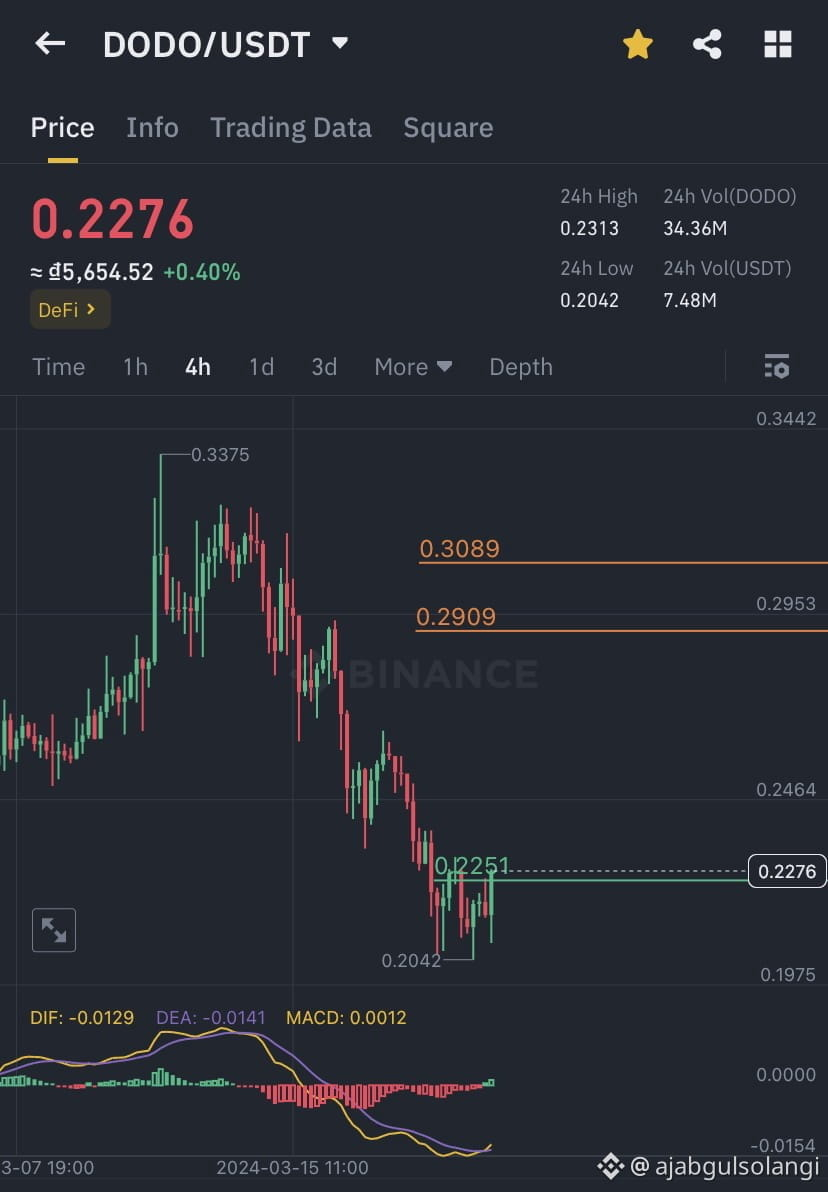
$DODO
(DODO) - Short Analysis - 15 Nov 2026
Price: ~$0.0321 - $0.0325
Trend: Strong short-term bounce, against a weak market.
What happened:
• Up ∼8.4% in 24h and ∼49% in 7 days as of Nov 14, while the total crypto market was down ∼3% in 24h. • Up 38.44% in 5 sessions, 51.65% in 1 month, and 63.92% YTD. • 24h volume spiked 124% to $43.57M, higher than its ∼$32.5M market cap, showing heavy speculation / rotation, not quiet accumulation.
Why: No confirmed project catalyst found. The move looks driven mainly by increased trading activity / bullish short-term signals, while overall sentiment is Extreme Fear (15).
{spot}(DODOUSDT)
#CryptoSelloffTriggersMultipleWhaleLiquidations #USSpotXRPETFsSeeLargestWeeklyOutflowIn8Months #BitcoinActiveSupplyInProfitDropsBelow45% #WillFOMCMinutesReinforceRateHikeExpectations?
$DODO
(DODO) - Short Analysis - 15 Nov 2026
Price: ~$0.0321 - $0.0325
Trend: Strong short-term bounce, against a weak market.
What happened:
• Up ∼8.4% in 24h and ∼49% in 7 days as of Nov 14, while the total crypto market was down ∼3% in 24h. • Up 38.44% in 5 sessions, 51.65% in 1 month, and 63.92% YTD. • 24h volume spiked 124% to $43.57M, higher than its ∼$32.5M market cap, showing heavy speculation / rotation, not quiet accumulation.
Why: No confirmed project catalyst found. The move looks driven mainly by increased trading activity / bullish short-term signals, while overall sentiment is Extreme Fear (15).
#CryptoSelloffTriggersMultipleWhaleLiquidations #USSpotXRPETFsSeeLargestWeeklyOutflowIn8Months #BitcoinActiveSupplyInProfitDropsBelow45% #WillFOMCMinutesReinforceRateHikeExpectations?
(DODO) - Short Analysis - 15 Nov 2026
Price: ~$0.0321 - $0.0325
Trend: Strong short-term bounce, against a weak market.
What happened:
• Up ∼8.4% in 24h and ∼49% in 7 days as of Nov 14, while the total crypto market was down ∼3% in 24h. • Up 38.44% in 5 sessions, 51.65% in 1 month, and 63.92% YTD. • 24h volume spiked 124% to $43.57M, higher than its ∼$32.5M market cap, showing heavy speculation / rotation, not quiet accumulation.
Why: No confirmed project catalyst found. The move looks driven mainly by increased trading activity / bullish short-term signals, while overall sentiment is Extreme Fear (15).
#CryptoSelloffTriggersMultipleWhaleLiquidations #USSpotXRPETFsSeeLargestWeeklyOutflowIn8Months #BitcoinActiveSupplyInProfitDropsBelow45% #WillFOMCMinutesReinforceRateHikeExpectations?
193
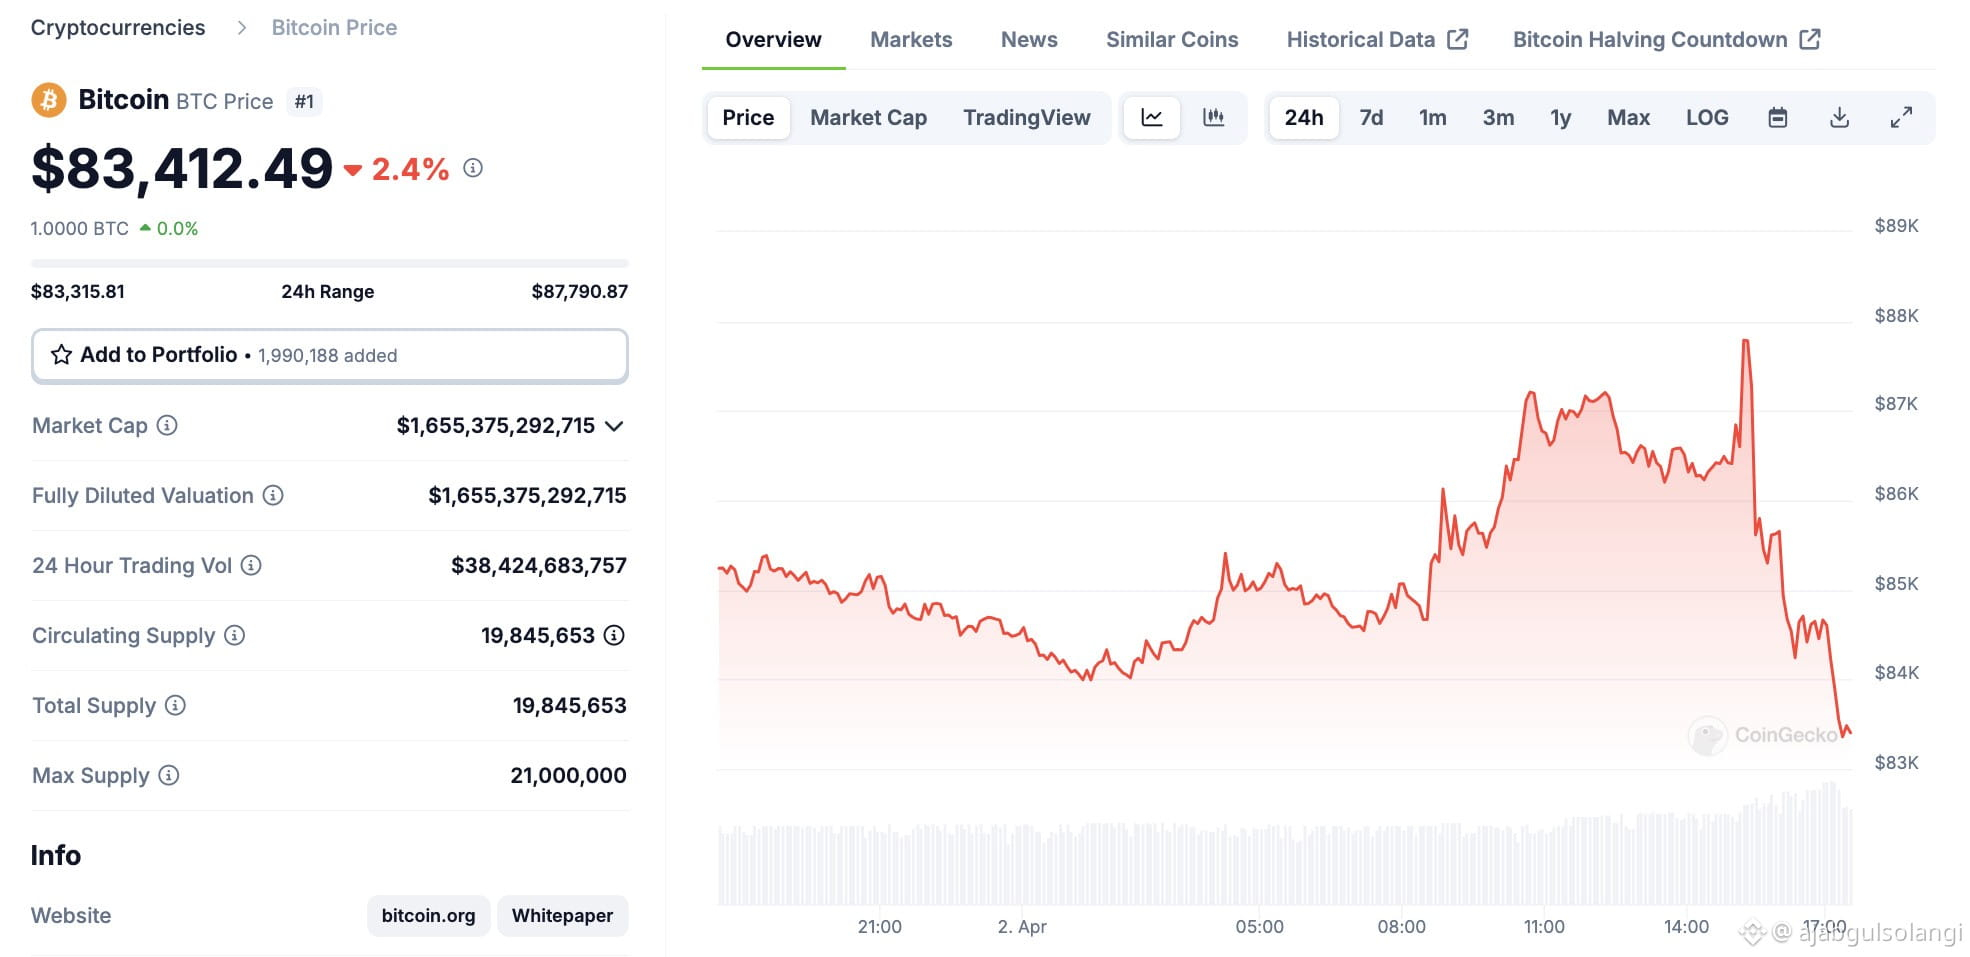
#$BTC is in a sharp correction phase. It's trading around $64,575, down -1.3% today and down -11.23% in the last 5 sessions.
What happened:
• BTC fell to $62,000 - $65,000 on Nov 14, its weakest since August 2026 • It's down more than 20% since early October after breaking below the key $70,000 level • It even slipped below its 200-week average around $67,800 - $68,000, a level traders watch closely
Key Levels to Watch:
• Support: $62,000 - $60,000, then $57,700 (2026 low) • Resistance: $68,000 - $70,000 - BTC needs to reclaim this to turn bullish again
Short-term view: Bearish / cautious. Sellers are still in control, and analysts warn a weak weekly close could open a move back below $60,000. For long-term holders, this zone is being
#CryptoSelloffTriggersMultipleWhaleLiquidations #WORPTLetsTouristsConvertCryptoToThaiBaht
#BitcoinActiveSupplyInProfitDropsBelow45% #KavaSaysAbnormalActivityLimitedToKavaLend
{spot}(BTCUSDT)
called a "deep value zone" after returning to earlier yearly lows.
#$BTC is in a sharp correction phase. It's trading around $64,575, down -1.3% today and down -11.23% in the last 5 sessions.
What happened:
• BTC fell to $62,000 - $65,000 on Nov 14, its weakest since August 2026 • It's down more than 20% since early October after breaking below the key $70,000 level • It even slipped below its 200-week average around $67,800 - $68,000, a level traders watch closely
Key Levels to Watch:
• Support: $62,000 - $60,000, then $57,700 (2026 low) • Resistance: $68,000 - $70,000 - BTC needs to reclaim this to turn bullish again
Short-term view: Bearish / cautious. Sellers are still in control, and analysts warn a weak weekly close could open a move back below $60,000. For long-term holders, this zone is being
#CryptoSelloffTriggersMultipleWhaleLiquidations #WORPTLetsTouristsConvertCryptoToThaiBaht
#BitcoinActiveSupplyInProfitDropsBelow45% #KavaSaysAbnormalActivityLimitedToKavaLend
called a "deep value zone" after returning to earlier yearly lows.
What happened:
• BTC fell to $62,000 - $65,000 on Nov 14, its weakest since August 2026 • It's down more than 20% since early October after breaking below the key $70,000 level • It even slipped below its 200-week average around $67,800 - $68,000, a level traders watch closely
Key Levels to Watch:
• Support: $62,000 - $60,000, then $57,700 (2026 low) • Resistance: $68,000 - $70,000 - BTC needs to reclaim this to turn bullish again
Short-term view: Bearish / cautious. Sellers are still in control, and analysts warn a weak weekly close could open a move back below $60,000. For long-term holders, this zone is being
#CryptoSelloffTriggersMultipleWhaleLiquidations #WORPTLetsTouristsConvertCryptoToThaiBaht
#BitcoinActiveSupplyInProfitDropsBelow45% #KavaSaysAbnormalActivityLimitedToKavaLend
called a "deep value zone" after returning to earlier yearly lows.
112
Войдите, чтобы посмотреть больше материала
Присоединяйтесь к пользователям криптовалют по всему миру на Binance Square
⚡️ Получайте новейшую и полезную информацию о криптоактивах.
💬 Нам доверяет крупнейшая в мире криптобиржа.
👍 Получите достоверные аналитические данные от верифицированных создателей контента.
Эл. почта/номер телефона
В тренде
NvidiaBeatsEstimatesWith$130BQ4Outlook
Просмотров: 5,875
96 обсуждают
Nvidia Beats With $115.8 Billion in Revenue, Guides to $130 Billion and Adds $150 Billion Buyback
Binance News
·Лайков: 28
·Просмотров: 35.3k
AnthropicIPOPriceCouldExceed$80
Просмотров: 10,958
97 обсуждают
CanNvidia’sDataCenterGrowthContinue?
Просмотров: 29,467
445 обсуждают