
Sadaf shahbaz
2.7k Публикации

Sadaf shahbaz
Отправить жалобу
Заблокировать пользователя
Crypto Trader & Market Analyst | Daily market insights, price action & smart money concepts | Education over hype
Открытая сделка

Владелец XRP
Случайный трейдер
2.2 г
25 подписок(и/а)
412 подписчиков(а)
2.6K+ понравилось
Посты
Портфель
Все
Цитирования
·
--
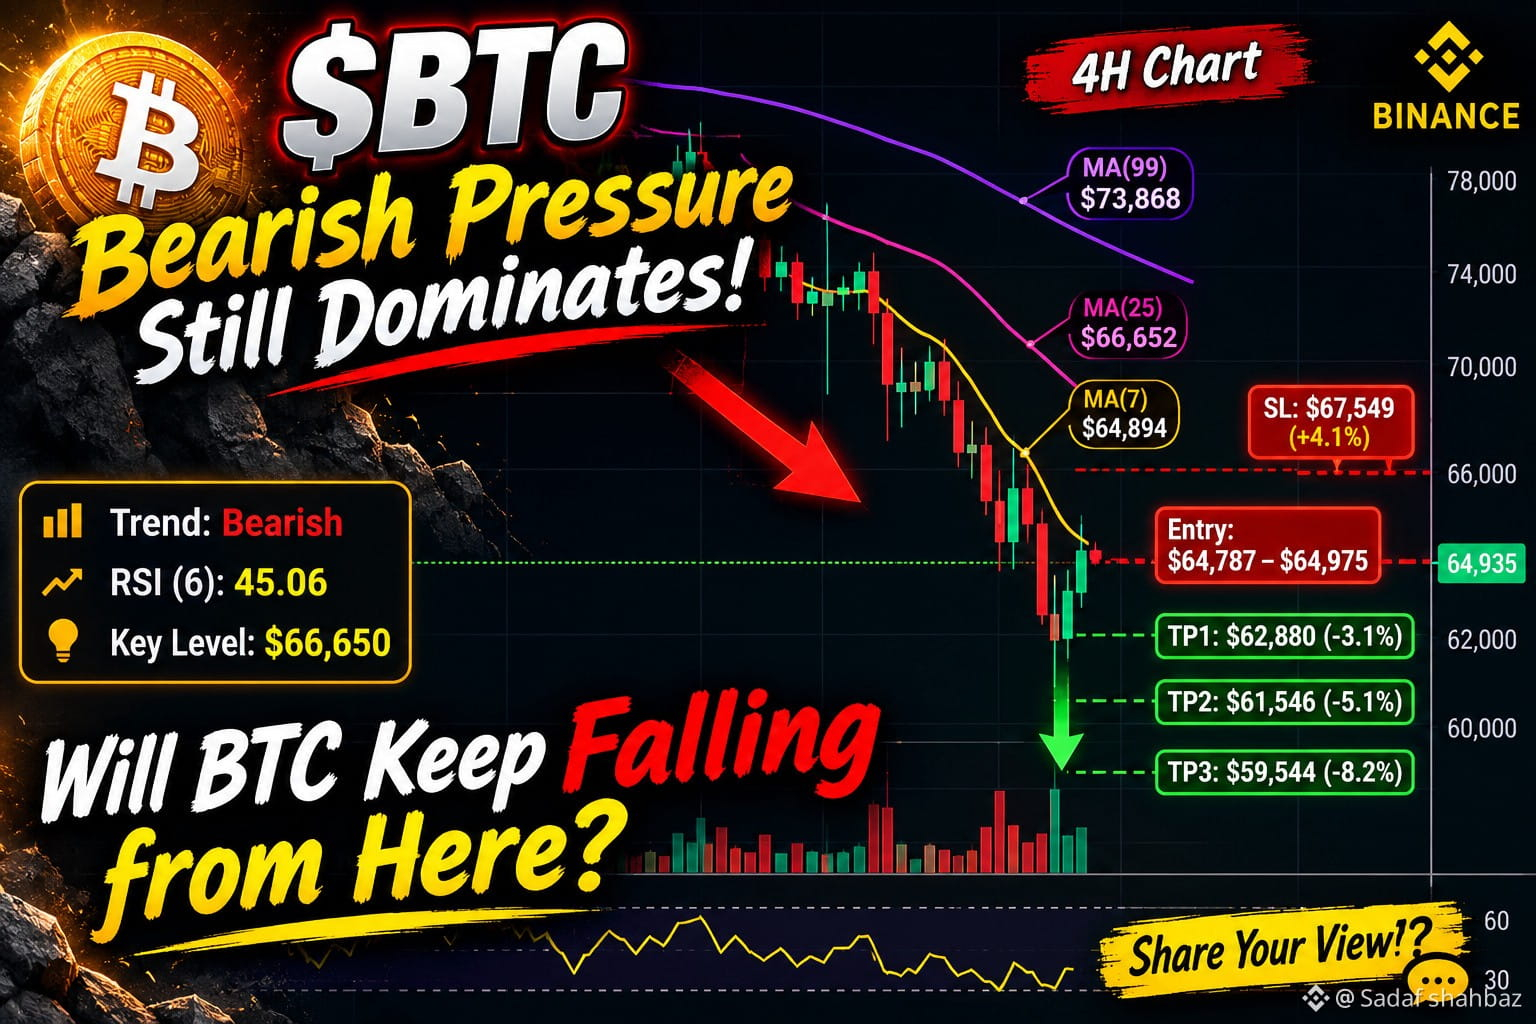
🔴 $BTC — Bearish Pressure Still Dominates! 📉
Bitcoin is trading around $64,935, and the 4H chart still shows a bearish structure. Price remains below MA25 ($66,652) and MA99 ($73,868), while MA7 ($64,894) is acting as near-term resistance/support.
$BTC recently bounced from $62,006, but the recovery hasn't confirmed a trend reversal yet. RSI(6) is around 45, showing that buyers are attempting to regain momentum.
🎯 My Short Setup:
- Entry: $64,787 – $64,975
- TP1: $62,880
- TP2: $61,546
- TP3: $59,544
- Stop Loss: $67,549
My Strategy: I'm watching for rejection around the current resistance zone. A breakdown could open the door to lower levels, but a strong reclaim of $66,650 would weaken the bearish setup.
⚠️ Moderate conviction — keep position size small and manage risk carefully.
What's your view? Will $BTC revisit $62K or recover toward $67K first?
#BTC #CryptoAnalysis #BinanceSquare #TradingStrategy
🔴 $BTC — Bearish Pressure Still Dominates! 📉
Bitcoin is trading around $64,935, and the 4H chart still shows a bearish structure. Price remains below MA25 ($66,652) and MA99 ($73,868), while MA7 ($64,894) is acting as near-term resistance/support.
$BTC recently bounced from $62,006, but the recovery hasn't confirmed a trend reversal yet. RSI(6) is around 45, showing that buyers are attempting to regain momentum.
🎯 My Short Setup:
- Entry: $64,787 – $64,975
- TP1: $62,880
- TP2: $61,546
- TP3: $59,544
- Stop Loss: $67,549
My Strategy: I'm watching for rejection around the current resistance zone. A breakdown could open the door to lower levels, but a strong reclaim of $66,650 would weaken the bearish setup.
⚠️ Moderate conviction — keep position size small and manage risk carefully.
What's your view? Will $BTC revisit $62K or recover toward $67K first?
#BTC #CryptoAnalysis #BinanceSquare #TradingStrategy
Bitcoin is trading around $64,935, and the 4H chart still shows a bearish structure. Price remains below MA25 ($66,652) and MA99 ($73,868), while MA7 ($64,894) is acting as near-term resistance/support.
$BTC recently bounced from $62,006, but the recovery hasn't confirmed a trend reversal yet. RSI(6) is around 45, showing that buyers are attempting to regain momentum.
🎯 My Short Setup:
- Entry: $64,787 – $64,975
- TP1: $62,880
- TP2: $61,546
- TP3: $59,544
- Stop Loss: $67,549
My Strategy: I'm watching for rejection around the current resistance zone. A breakdown could open the door to lower levels, but a strong reclaim of $66,650 would weaken the bearish setup.
⚠️ Moderate conviction — keep position size small and manage risk carefully.
What's your view? Will $BTC revisit $62K or recover toward $67K first?
#BTC #CryptoAnalysis #BinanceSquare #TradingStrategy
15
·
--
🟢 $ARIA IS BACK WITH STRONG BULLISH MOMENTUM! 🚀
ARIA is trading around $0.25629(+31.69%), showing impressive strength on the 4H chart.
Buyers are pushing the price higher, with ARIA holding comfortably above MA(7), MA(25), and MA(99). However, RSI is near 79, suggesting the market may be overheated in the short term.
🎯 Key Levels to Watch:
- Resistance: $0.2658
- Next upside zone: $0.2775
- Major target zone: $0.3238
- Support: $0.2179–$0.2087
The trend remains bullish, but after such a strong rally, some profit-taking or a healthy pullback wouldn't be surprising. A confirmed breakout above resistance could bring another wave of buying pressure.
🔥 My strategy: Watch for confirmation rather than chasing green candles!
💬 Your opinion: Can $ARIA break above $0.2658 and move toward $0.30, or are we about to see a correction?
#ARIA #Crypto #BinanceSquare #BinancePick
🟢 $ARIA IS BACK WITH STRONG BULLISH MOMENTUM! 🚀
ARIA is trading around $0.25629(+31.69%), showing impressive strength on the 4H chart.
Buyers are pushing the price higher, with ARIA holding comfortably above MA(7), MA(25), and MA(99). However, RSI is near 79, suggesting the market may be overheated in the short term.
🎯 Key Levels to Watch:
- Resistance: $0.2658
- Next upside zone: $0.2775
- Major target zone: $0.3238
- Support: $0.2179–$0.2087
The trend remains bullish, but after such a strong rally, some profit-taking or a healthy pullback wouldn't be surprising. A confirmed breakout above resistance could bring another wave of buying pressure.
🔥 My strategy: Watch for confirmation rather than chasing green candles!
💬 Your opinion: Can $ARIA break above $0.2658 and move toward $0.30, or are we about to see a correction?
#ARIA #Crypto #BinanceSquare #BinancePick
ARIA is trading around $0.25629(+31.69%), showing impressive strength on the 4H chart.
Buyers are pushing the price higher, with ARIA holding comfortably above MA(7), MA(25), and MA(99). However, RSI is near 79, suggesting the market may be overheated in the short term.
🎯 Key Levels to Watch:
- Resistance: $0.2658
- Next upside zone: $0.2775
- Major target zone: $0.3238
- Support: $0.2179–$0.2087
The trend remains bullish, but after such a strong rally, some profit-taking or a healthy pullback wouldn't be surprising. A confirmed breakout above resistance could bring another wave of buying pressure.
🔥 My strategy: Watch for confirmation rather than chasing green candles!
💬 Your opinion: Can $ARIA break above $0.2658 and move toward $0.30, or are we about to see a correction?
#ARIA #Crypto #BinanceSquare #BinancePick
80
·
--
🚀 $EVAA : Can It Break $3 or Face a Sharp Correction? 🔥
$EVAA is showing explosive bullish momentum!
Currently trading at $2.3241 (+110.25%), EVAA has surged toward its 24H high of $2.3960, supported by a massive volume spike.
📊 What I'm Watching:
- Strong bullish trend on the 4H chart.
- Price trading well above MA(7), MA(25) and MA(99).
- RSI(6) at 82.40 — extremely overbought.
- $2.3960 is the immediate resistance to watch.
🎯 My View: A breakout could open the door toward $3, but after such a massive rally, a healthy pullback is also possible.
Can $EVAA reach $3, or will profit-taking trigger a correction toward $1?
What's your prediction? 👇
#EVAA #cryptotrading #BinanceSquareTalks #BullishMomentum
🚀 $EVAA : Can It Break $3 or Face a Sharp Correction? 🔥
$EVAA is showing explosive bullish momentum!
Currently trading at $2.3241 (+110.25%), EVAA has surged toward its 24H high of $2.3960, supported by a massive volume spike.
📊 What I'm Watching:
- Strong bullish trend on the 4H chart.
- Price trading well above MA(7), MA(25) and MA(99).
- RSI(6) at 82.40 — extremely overbought.
- $2.3960 is the immediate resistance to watch.
🎯 My View: A breakout could open the door toward $3, but after such a massive rally, a healthy pullback is also possible.
Can $EVAA reach $3, or will profit-taking trigger a correction toward $1?
What's your prediction? 👇
#EVAA #cryptotrading #BinanceSquareTalks #BullishMomentum
$EVAA is showing explosive bullish momentum!
Currently trading at $2.3241 (+110.25%), EVAA has surged toward its 24H high of $2.3960, supported by a massive volume spike.
📊 What I'm Watching:
- Strong bullish trend on the 4H chart.
- Price trading well above MA(7), MA(25) and MA(99).
- RSI(6) at 82.40 — extremely overbought.
- $2.3960 is the immediate resistance to watch.
🎯 My View: A breakout could open the door toward $3, but after such a massive rally, a healthy pullback is also possible.
Can $EVAA reach $3, or will profit-taking trigger a correction toward $1?
What's your prediction? 👇
#EVAA #cryptotrading #BinanceSquareTalks #BullishMomentum

241
·
--
Рост
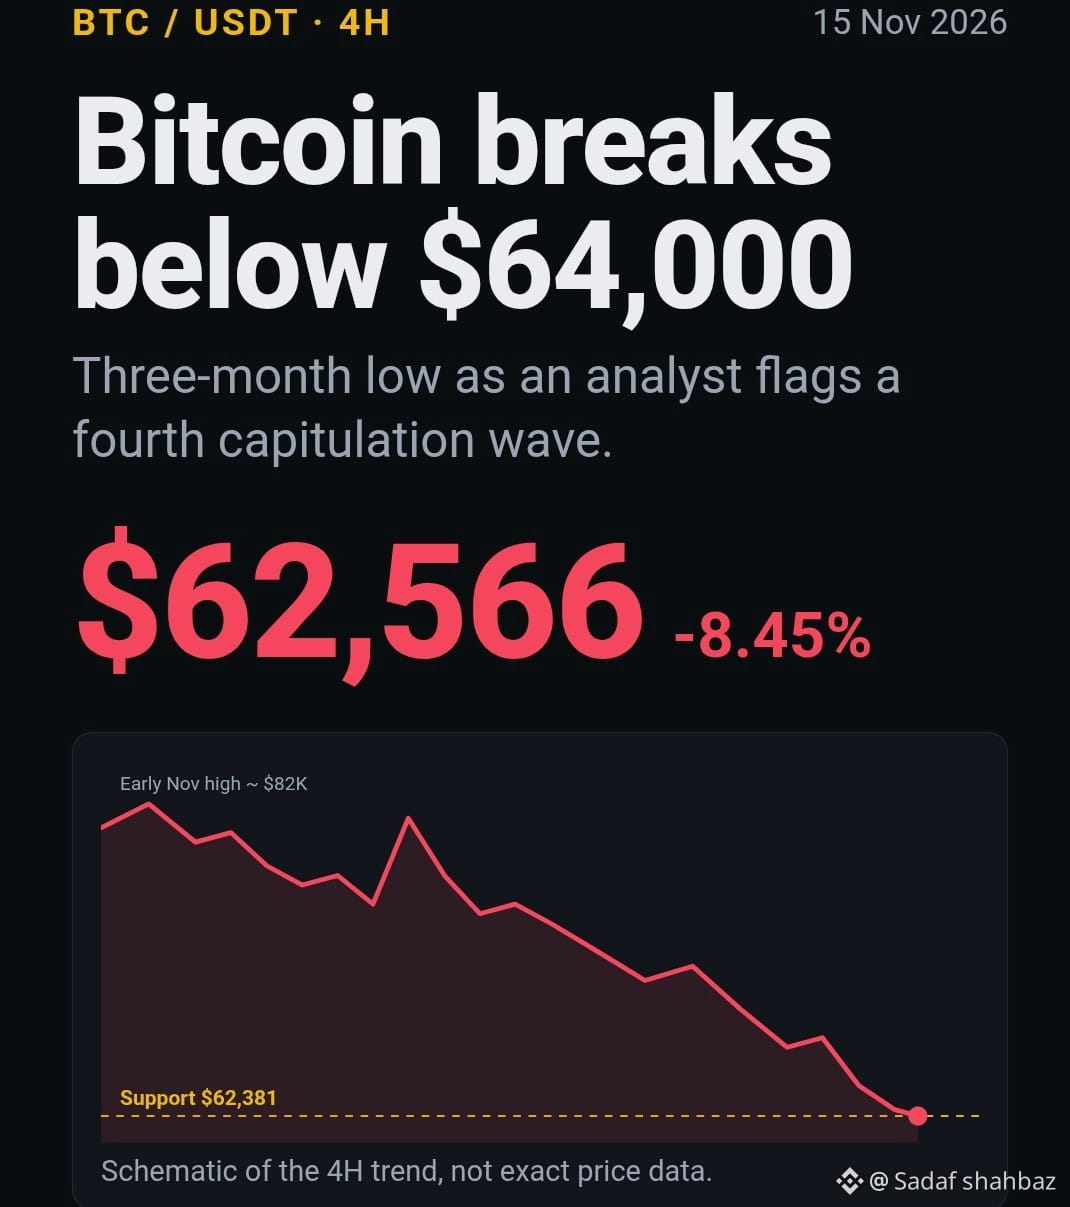
Bitcoin Slides Below $64,000 to a Three-Month Low as Analyst Flags Fourth Capitulation Wave
$BTC trades near $62,566, down roughly 8.5% on the day, as momentum indicators reach historically extreme oversold readings.
Market Snapshot
Metric
Value
Last price (BTC/USDT)
$62,565.99
24h change
-8.45%
24h high / low
$68,403.79 / $62,381.00
24h volume
~35,800 BTC (~$2.35B)
Bitcoin broke decisively below $64,000 in a sharp, high-volume decline, extending a drawdown that began after the early-November rejection near $82,000 on the 4-hour chart.
Technical Picture
Trend structure. Price sits below all three tracked moving averages: the 7-period at $65,626, the 25-period at $70,083 and the 99-period at $75,166. All three are sloping lower, which confirms a persistent bearish trend rather than a transient pullback.
Momentum. The 6-period RSI has dropped to 7.22, deep in oversold territory and far below the conventional 30 threshold. Readings this low have historically coincided with exhaustion in selling pressure and tactical rebounds. They are not, on their own, a reversal signal.
Volume. Expanding volume on large red candles points to forced liquidation and panic selling, the hallmark of capitulation-style price action.
What a "Capitulation Wave" Means
Capitulation describes a phase in which investors, often recent buyers holding unrealized losses, sell regardless of price. Such episodes have frequently clustered near local lows, as supply shifts from weak hands to higher-conviction holders. History also shows that markets can extend lower after an initial flush, and that a single capitulation event does not confirm a durable bottom.
Key Levels
Support: $62,381 (session low), then $61,400 and the psychological $60,000 zone.
Resistance: $65,600 (MA7), followed by $68,400 and $70,000.
A 4-hour close back above $65,600 would be the first sign that sellers are losing control. A sustained break below $62,381 would open the path toward $60,000.
#BTC
Bitcoin Slides Below $64,000 to a Three-Month Low as Analyst Flags Fourth Capitulation Wave
$BTC trades near $62,566, down roughly 8.5% on the day, as momentum indicators reach historically extreme oversold readings.
Market Snapshot
Metric
Value
Last price (BTC/USDT)
$62,565.99
24h change
-8.45%
24h high / low
$68,403.79 / $62,381.00
24h volume
~35,800 BTC (~$2.35B)
Bitcoin broke decisively below $64,000 in a sharp, high-volume decline, extending a drawdown that began after the early-November rejection near $82,000 on the 4-hour chart.
Technical Picture
Trend structure. Price sits below all three tracked moving averages: the 7-period at $65,626, the 25-period at $70,083 and the 99-period at $75,166. All three are sloping lower, which confirms a persistent bearish trend rather than a transient pullback.
Momentum. The 6-period RSI has dropped to 7.22, deep in oversold territory and far below the conventional 30 threshold. Readings this low have historically coincided with exhaustion in selling pressure and tactical rebounds. They are not, on their own, a reversal signal.
Volume. Expanding volume on large red candles points to forced liquidation and panic selling, the hallmark of capitulation-style price action.
What a "Capitulation Wave" Means
Capitulation describes a phase in which investors, often recent buyers holding unrealized losses, sell regardless of price. Such episodes have frequently clustered near local lows, as supply shifts from weak hands to higher-conviction holders. History also shows that markets can extend lower after an initial flush, and that a single capitulation event does not confirm a durable bottom.
Key Levels
Support: $62,381 (session low), then $61,400 and the psychological $60,000 zone.
Resistance: $65,600 (MA7), followed by $68,400 and $70,000.
A 4-hour close back above $65,600 would be the first sign that sellers are losing control. A sustained break below $62,381 would open the path toward $60,000.
#BTC
$BTC trades near $62,566, down roughly 8.5% on the day, as momentum indicators reach historically extreme oversold readings.
Market Snapshot
Metric
Value
Last price (BTC/USDT)
$62,565.99
24h change
-8.45%
24h high / low
$68,403.79 / $62,381.00
24h volume
~35,800 BTC (~$2.35B)
Bitcoin broke decisively below $64,000 in a sharp, high-volume decline, extending a drawdown that began after the early-November rejection near $82,000 on the 4-hour chart.
Technical Picture
Trend structure. Price sits below all three tracked moving averages: the 7-period at $65,626, the 25-period at $70,083 and the 99-period at $75,166. All three are sloping lower, which confirms a persistent bearish trend rather than a transient pullback.
Momentum. The 6-period RSI has dropped to 7.22, deep in oversold territory and far below the conventional 30 threshold. Readings this low have historically coincided with exhaustion in selling pressure and tactical rebounds. They are not, on their own, a reversal signal.
Volume. Expanding volume on large red candles points to forced liquidation and panic selling, the hallmark of capitulation-style price action.
What a "Capitulation Wave" Means
Capitulation describes a phase in which investors, often recent buyers holding unrealized losses, sell regardless of price. Such episodes have frequently clustered near local lows, as supply shifts from weak hands to higher-conviction holders. History also shows that markets can extend lower after an initial flush, and that a single capitulation event does not confirm a durable bottom.
Key Levels
Support: $62,381 (session low), then $61,400 and the psychological $60,000 zone.
Resistance: $65,600 (MA7), followed by $68,400 and $70,000.
A 4-hour close back above $65,600 would be the first sign that sellers are losing control. A sustained break below $62,381 would open the path toward $60,000.
#BTC
91
·
--
🚀 $AKE (AKEDO) IS MAKING A MASSIVE MOVE! 🔥
AKE is attracting serious market attention! Currently trading around $0.012221 (+71.93%), buyers have pushed the price sharply higher with a major volume spike.
📊 What I'm Watching:
- Strong bullish momentum on the 4H chart.
- Price has moved well above MA25 and MA99.
- RSI(6) is around 84 — seriously overheated.
- Recent upper wick near $0.01695 shows strong selling pressure.
Can $AKE push toward $0.016 again, or will profit-taking take control? 👀🚀
#AKE #AKEDO #crypto #Binance
🚀 $AKE (AKEDO) IS MAKING A MASSIVE MOVE! 🔥
AKE is attracting serious market attention! Currently trading around $0.012221 (+71.93%), buyers have pushed the price sharply higher with a major volume spike.
📊 What I'm Watching:
- Strong bullish momentum on the 4H chart.
- Price has moved well above MA25 and MA99.
- RSI(6) is around 84 — seriously overheated.
- Recent upper wick near $0.01695 shows strong selling pressure.
Can $AKE push toward $0.016 again, or will profit-taking take control? 👀🚀
#AKE #AKEDO #crypto #Binance
AKE is attracting serious market attention! Currently trading around $0.012221 (+71.93%), buyers have pushed the price sharply higher with a major volume spike.
📊 What I'm Watching:
- Strong bullish momentum on the 4H chart.
- Price has moved well above MA25 and MA99.
- RSI(6) is around 84 — seriously overheated.
- Recent upper wick near $0.01695 shows strong selling pressure.
Can $AKE push toward $0.016 again, or will profit-taking take control? 👀🚀
#AKE #AKEDO #crypto #Binance

307
·
--
🚨 $AKE — SHORT OPPORTUNITY AFTER THE MASSIVE PUMP?
$AKE has surged over 93% in 24 hours, but the 4H chart is showing signs of overheating.
📉 Price: $0.01299
🔥 24H High: $0.01811
⚠️ RSI(6): 97.11 — Extremely Overbought
📊 A massive-volume candle with a long upper wick suggests possible selling pressure.
My strategy: I'm watching for bearish confirmation before considering a small SHORT position. If buyers fail to defend the current support, a deeper pullback could follow.
Don't chase the pump. Wait for confirmation and manage risk carefully.
👇 What do you think? Is $AKE ready for another leg up, or is a major correction coming?
#AKE #Binance #cryptotrading #ShortSetup
🚨 $AKE — SHORT OPPORTUNITY AFTER THE MASSIVE PUMP?
$AKE has surged over 93% in 24 hours, but the 4H chart is showing signs of overheating.
📉 Price: $0.01299
🔥 24H High: $0.01811
⚠️ RSI(6): 97.11 — Extremely Overbought
📊 A massive-volume candle with a long upper wick suggests possible selling pressure.
My strategy: I'm watching for bearish confirmation before considering a small SHORT position. If buyers fail to defend the current support, a deeper pullback could follow.
Don't chase the pump. Wait for confirmation and manage risk carefully.
👇 What do you think? Is $AKE ready for another leg up, or is a major correction coming?
#AKE #Binance #cryptotrading #ShortSetup
$AKE has surged over 93% in 24 hours, but the 4H chart is showing signs of overheating.
📉 Price: $0.01299
🔥 24H High: $0.01811
⚠️ RSI(6): 97.11 — Extremely Overbought
📊 A massive-volume candle with a long upper wick suggests possible selling pressure.
My strategy: I'm watching for bearish confirmation before considering a small SHORT position. If buyers fail to defend the current support, a deeper pullback could follow.
Don't chase the pump. Wait for confirmation and manage risk carefully.
👇 What do you think? Is $AKE ready for another leg up, or is a major correction coming?
#AKE #Binance #cryptotrading #ShortSetup

1
493
·
--
🚀 $BARD — EXPLOSIVE MOMENTUM! BUYERS ARE IN CONTROL! 🔥
$BARD is making another powerful move! The 4H chart shows a massive breakout, with price surging to $0.1727 (+104.14%) and testing the $0.1751 resistance zone.
📊 What I'm Watching:
- Current Price: $0.1727
- 24H High: $0.1751
- 24H Volume: $23.15M
- MA(7): $0.1331
- MA(25): $0.1032
- RSI(6): 92.13
🔥 Buyers are showing serious strength, and the breakout momentum is impressive. I would prefer looking for LONG opportunities on a healthy pullback rather than rushing into a SHORT against this strong momentum.
My question: Is $BARD preparing for another leg up, or will we see a pullback first? 👀🚀
#BARD #Crypto #Binance #trading
🚀 $BARD — EXPLOSIVE MOMENTUM! BUYERS ARE IN CONTROL! 🔥
$BARD is making another powerful move! The 4H chart shows a massive breakout, with price surging to $0.1727 (+104.14%) and testing the $0.1751 resistance zone.
📊 What I'm Watching:
- Current Price: $0.1727
- 24H High: $0.1751
- 24H Volume: $23.15M
- MA(7): $0.1331
- MA(25): $0.1032
- RSI(6): 92.13
🔥 Buyers are showing serious strength, and the breakout momentum is impressive. I would prefer looking for LONG opportunities on a healthy pullback rather than rushing into a SHORT against this strong momentum.
My question: Is $BARD preparing for another leg up, or will we see a pullback first? 👀🚀
#BARD #Crypto #Binance #trading
$BARD is making another powerful move! The 4H chart shows a massive breakout, with price surging to $0.1727 (+104.14%) and testing the $0.1751 resistance zone.
📊 What I'm Watching:
- Current Price: $0.1727
- 24H High: $0.1751
- 24H Volume: $23.15M
- MA(7): $0.1331
- MA(25): $0.1032
- RSI(6): 92.13
🔥 Buyers are showing serious strength, and the breakout momentum is impressive. I would prefer looking for LONG opportunities on a healthy pullback rather than rushing into a SHORT against this strong momentum.
My question: Is $BARD preparing for another leg up, or will we see a pullback first? 👀🚀
#BARD #Crypto #Binance #trading

246
·
--
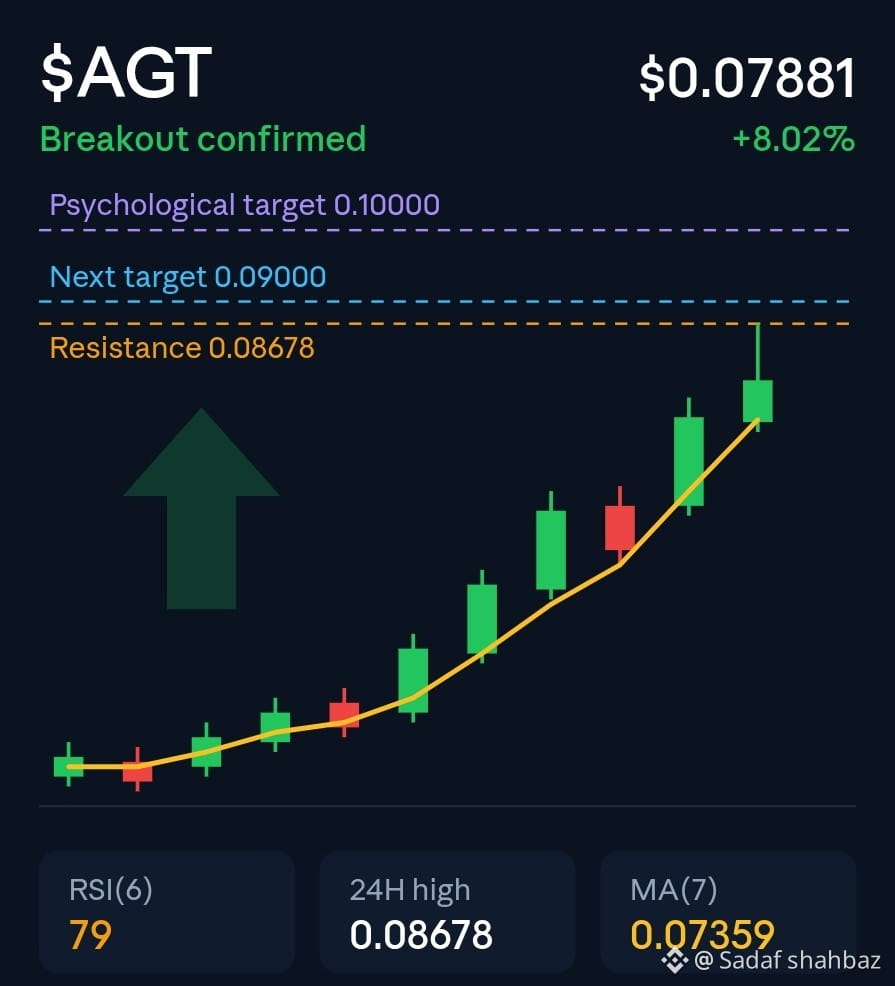
🚀🔥 $AGT — BREAKOUT CONFIRMED! IS $0.10 NEXT?
$AGT is showing incredible bullish momentum! After a massive rally from the $0.0227 zone, buyers have pushed the price to $0.07881 (+8.02%), breaking above major resistance with powerful volume.
📊 What the Chart Shows (4H):
- 💰 Current Price: $0.07881
- 📈 24H High: $0.08678
- 🟢 MA(7): $0.07359
- 🔥 Strong volume supporting the breakout
- ⚡ RSI(6): 79 — momentum is strong but overheated.
🎯 Key Levels to Watch:
- Resistance: $0.08678
- Next Target: $0.09000
- Psychological Target: $0.10000
My view: Bulls are clearly in control, but a short-term pullback is possible after such a powerful rally. If buyers defend the breakout zone and break the recent high, $0.10 could become the next major target! 🚀
👀 Can $AGT reach $0.10 tonight, or will sellers step in first?
Are you HOLDING or TAKING PROFIT?
#AGT #Binance #Crypto #BullishMomentum
🚀🔥 $AGT — BREAKOUT CONFIRMED! IS $0.10 NEXT?
$AGT is showing incredible bullish momentum! After a massive rally from the $0.0227 zone, buyers have pushed the price to $0.07881 (+8.02%), breaking above major resistance with powerful volume.
📊 What the Chart Shows (4H):
- 💰 Current Price: $0.07881
- 📈 24H High: $0.08678
- 🟢 MA(7): $0.07359
- 🔥 Strong volume supporting the breakout
- ⚡ RSI(6): 79 — momentum is strong but overheated.
🎯 Key Levels to Watch:
- Resistance: $0.08678
- Next Target: $0.09000
- Psychological Target: $0.10000
My view: Bulls are clearly in control, but a short-term pullback is possible after such a powerful rally. If buyers defend the breakout zone and break the recent high, $0.10 could become the next major target! 🚀
👀 Can $AGT reach $0.10 tonight, or will sellers step in first?
Are you HOLDING or TAKING PROFIT?
#AGT #Binance #Crypto #BullishMomentum
$AGT is showing incredible bullish momentum! After a massive rally from the $0.0227 zone, buyers have pushed the price to $0.07881 (+8.02%), breaking above major resistance with powerful volume.
📊 What the Chart Shows (4H):
- 💰 Current Price: $0.07881
- 📈 24H High: $0.08678
- 🟢 MA(7): $0.07359
- 🔥 Strong volume supporting the breakout
- ⚡ RSI(6): 79 — momentum is strong but overheated.
🎯 Key Levels to Watch:
- Resistance: $0.08678
- Next Target: $0.09000
- Psychological Target: $0.10000
My view: Bulls are clearly in control, but a short-term pullback is possible after such a powerful rally. If buyers defend the breakout zone and break the recent high, $0.10 could become the next major target! 🚀
👀 Can $AGT reach $0.10 tonight, or will sellers step in first?
Are you HOLDING or TAKING PROFIT?
#AGT #Binance #Crypto #BullishMomentum
446
·
--
🚨 $AGT — THE PUMP MAY BE LOSING STEAM!
After an explosive rally of over 200%, $AGT is now trading around $0.06959 (+27.66%).
Buyers pushed the price close to $0.080, but repeated rejection around $0.077–$0.080 suggests selling pressure is building.
📉 My Strategy: BEARISH / SHORT
- Entry Zone: $0.0695–$0.0700
- TP: $0.02535
- SL: $0.08915
If $AGT loses the $0.070 area, a deeper correction could follow. However, this is an aggressive short setup, not a guaranteed reversal.
🔥 Sometimes the biggest dumps start when everyone is still celebrating the pump!
Are you SHORTING AGT or expecting another breakout?
#AGT #CryptoTrading #Binance #Altcoins #dyor
🚨 $AGT — THE PUMP MAY BE LOSING STEAM!
After an explosive rally of over 200%, $AGT is now trading around $0.06959 (+27.66%).
Buyers pushed the price close to $0.080, but repeated rejection around $0.077–$0.080 suggests selling pressure is building.
📉 My Strategy: BEARISH / SHORT
- Entry Zone: $0.0695–$0.0700
- TP: $0.02535
- SL: $0.08915
If $AGT loses the $0.070 area, a deeper correction could follow. However, this is an aggressive short setup, not a guaranteed reversal.
🔥 Sometimes the biggest dumps start when everyone is still celebrating the pump!
Are you SHORTING AGT or expecting another breakout?
#AGT #CryptoTrading #Binance #Altcoins #dyor
After an explosive rally of over 200%, $AGT is now trading around $0.06959 (+27.66%).
Buyers pushed the price close to $0.080, but repeated rejection around $0.077–$0.080 suggests selling pressure is building.
📉 My Strategy: BEARISH / SHORT
- Entry Zone: $0.0695–$0.0700
- TP: $0.02535
- SL: $0.08915
If $AGT loses the $0.070 area, a deeper correction could follow. However, this is an aggressive short setup, not a guaranteed reversal.
🔥 Sometimes the biggest dumps start when everyone is still celebrating the pump!
Are you SHORTING AGT or expecting another breakout?
#AGT #CryptoTrading #Binance #Altcoins #dyor

1
366
·
--
🚀 $CROSS — BULLISH COIN TO WATCH TODAY! 🔥
$CROSS is showing strong bullish momentum, trading around $0.11137 (+4.69%) on the 4H chart.
📊 What I'm Watching:
- 🔥 Price holding above MA(7), MA(25) & MA(99).
- 📈 Strong volume spike signals increased buying interest.
- 🎯 Key Resistance: $0.11441
- 🟢 Support Zone: $0.1070–$0.1047
⚠️ RSI is around 83.7, so a short-term pullback is possible. A clean breakout above $0.11441 could open the door for another bullish move.
Are you BUYING $CROSS or waiting for a pullback? 👀🚀
#CROSS #Crypto #Binance #BullishMomentum
🚀 $CROSS — BULLISH COIN TO WATCH TODAY! 🔥
$CROSS is showing strong bullish momentum, trading around $0.11137 (+4.69%) on the 4H chart.
📊 What I'm Watching:
- 🔥 Price holding above MA(7), MA(25) & MA(99).
- 📈 Strong volume spike signals increased buying interest.
- 🎯 Key Resistance: $0.11441
- 🟢 Support Zone: $0.1070–$0.1047
⚠️ RSI is around 83.7, so a short-term pullback is possible. A clean breakout above $0.11441 could open the door for another bullish move.
Are you BUYING $CROSS or waiting for a pullback? 👀🚀
#CROSS #Crypto #Binance #BullishMomentum
$CROSS is showing strong bullish momentum, trading around $0.11137 (+4.69%) on the 4H chart.
📊 What I'm Watching:
- 🔥 Price holding above MA(7), MA(25) & MA(99).
- 📈 Strong volume spike signals increased buying interest.
- 🎯 Key Resistance: $0.11441
- 🟢 Support Zone: $0.1070–$0.1047
⚠️ RSI is around 83.7, so a short-term pullback is possible. A clean breakout above $0.11441 could open the door for another bullish move.
Are you BUYING $CROSS or waiting for a pullback? 👀🚀
#CROSS #Crypto #Binance #BullishMomentum

166
·
--
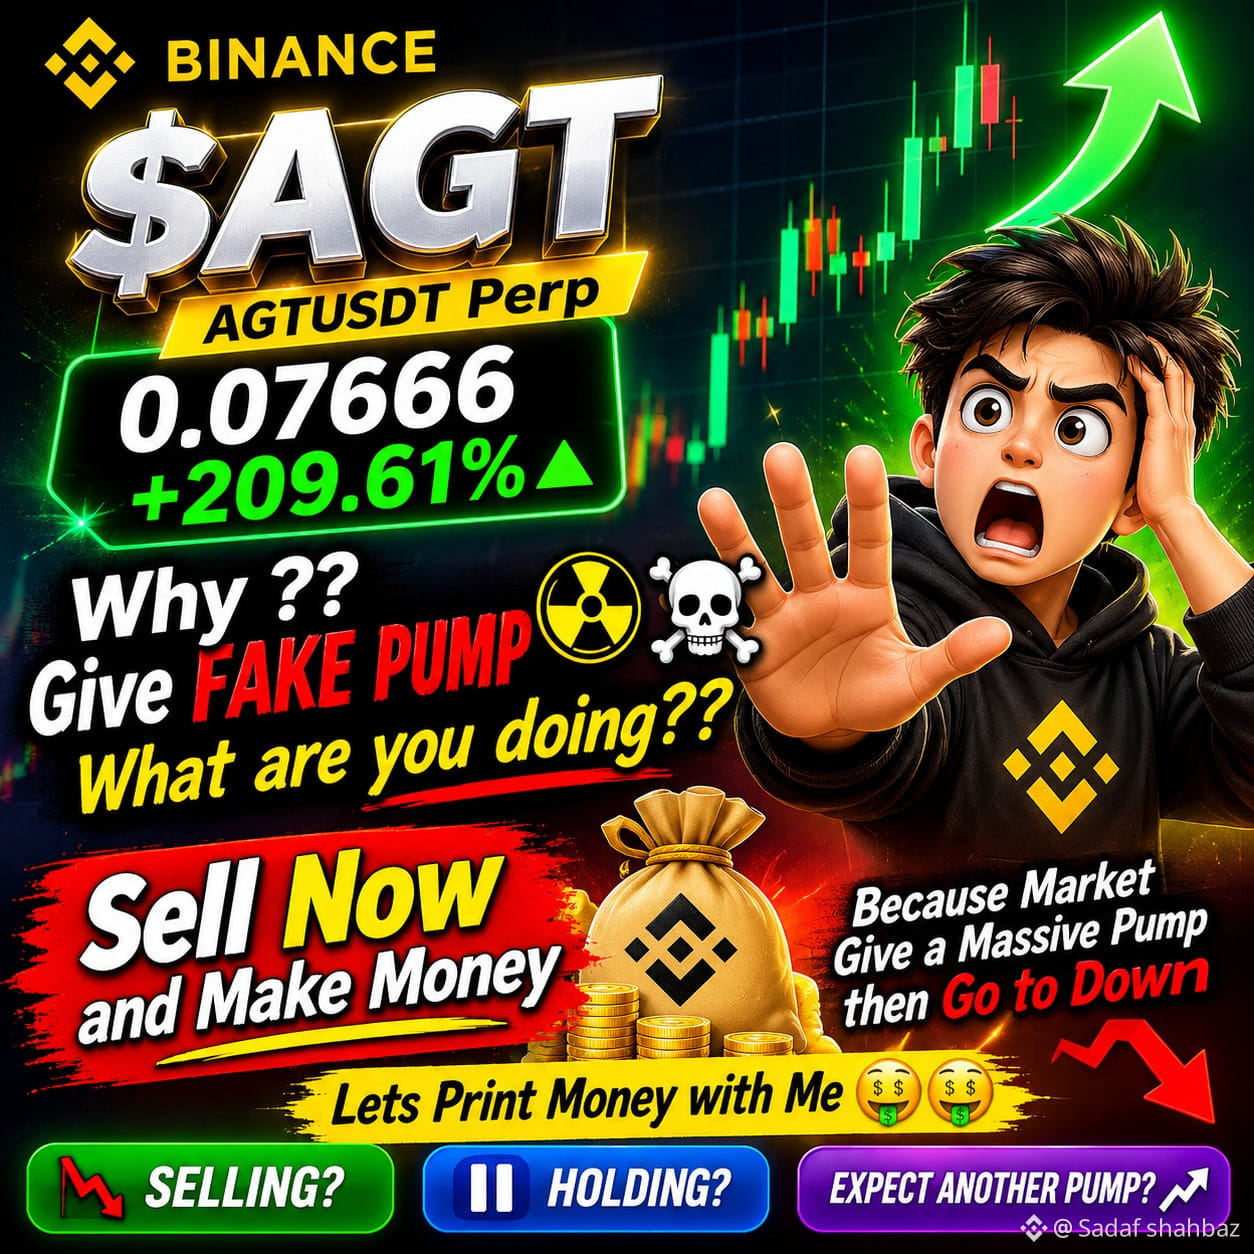
⚠️ $AGT — IS THIS A FAKE PUMP? ☢️☠️
$AGT is trading at $0.07666, up +209.61%! 🚀
After such a massive pump, profit-taking pressure could hit at any moment. Smart traders should watch carefully instead of blindly chasing green candles.
💰 Secure profits. Manage risk. Don't become exit liquidity!
Are you SELLING, HOLDING, or expecting another leg up? 👀
$AGT #AGT #cryptotrading #BİNANCE #dyor
⚠️ $AGT — IS THIS A FAKE PUMP? ☢️☠️
$AGT is trading at $0.07666, up +209.61%! 🚀
After such a massive pump, profit-taking pressure could hit at any moment. Smart traders should watch carefully instead of blindly chasing green candles.
💰 Secure profits. Manage risk. Don't become exit liquidity!
Are you SELLING, HOLDING, or expecting another leg up? 👀
$AGT #AGT #cryptotrading #BİNANCE #dyor
$AGT is trading at $0.07666, up +209.61%! 🚀
After such a massive pump, profit-taking pressure could hit at any moment. Smart traders should watch carefully instead of blindly chasing green candles.
💰 Secure profits. Manage risk. Don't become exit liquidity!
Are you SELLING, HOLDING, or expecting another leg up? 👀
$AGT #AGT #cryptotrading #BİNANCE #dyor
376
·
--
💵 Strong Dollar Puts Bitcoin Under Pressure: What Traders Should Watch 📉
A firmer US dollar and lingering monetary policy uncertainty are weighing on Bitcoin and the wider crypto market, as investors lean toward safer assets.
🏦 Why the Dollar Matters
In uncertain conditions, capital tends to flow into the US dollar. Interest rate expectations, inflation data, and central bank signals all shape its direction. A stronger dollar tightens global liquidity, which typically weighs on risk assets like crypto.
⚠️ What's Pressuring Bitcoin
🔴 Policy uncertainty: Delayed rate cuts or a hawkish tone reduce the appeal of risk assets.
🟠 Risk-off sentiment: Investors may rotate from volatile assets into cash or dollars.
🟡 Leverage unwinds: Liquidations can amplify price swings.
Historically, a strong dollar has often coincided with Bitcoin weakness, but the relationship isn't fixed. Institutional demand, regulation, and market dynamics also play a role.
🔍 Key Indicators to Watch
🏛️ Central bank decisions and policy statements
📊 Inflation and employment data
💲 US Dollar Index (DXY)
📈 Bitcoin support and resistance levels
🔄 Trading volume and market sentiment
🛡️ Managing Volatility
🟢 Size positions to what you can afford to lose
🟢 Use dollar-cost averaging (DCA) to smooth entry prices
🟢 Diversify across assets
🟢 Set stop-loss levels in advance
🟢 Avoid emotion-driven decisions
🎯 Bottom Line
The strong dollar and policy uncertainty make for a challenging backdrop, but discipline and a clear strategy remain your best tools. Track market trends and charts on Binance, and always do your own research. 🚀
$BTC $USDT
💵 Strong Dollar Puts Bitcoin Under Pressure: What Traders Should Watch 📉
A firmer US dollar and lingering monetary policy uncertainty are weighing on Bitcoin and the wider crypto market, as investors lean toward safer assets.
🏦 Why the Dollar Matters
In uncertain conditions, capital tends to flow into the US dollar. Interest rate expectations, inflation data, and central bank signals all shape its direction. A stronger dollar tightens global liquidity, which typically weighs on risk assets like crypto.
⚠️ What's Pressuring Bitcoin
🔴 Policy uncertainty: Delayed rate cuts or a hawkish tone reduce the appeal of risk assets.
🟠 Risk-off sentiment: Investors may rotate from volatile assets into cash or dollars.
🟡 Leverage unwinds: Liquidations can amplify price swings.
Historically, a strong dollar has often coincided with Bitcoin weakness, but the relationship isn't fixed. Institutional demand, regulation, and market dynamics also play a role.
🔍 Key Indicators to Watch
🏛️ Central bank decisions and policy statements
📊 Inflation and employment data
💲 US Dollar Index (DXY)
📈 Bitcoin support and resistance levels
🔄 Trading volume and market sentiment
🛡️ Managing Volatility
🟢 Size positions to what you can afford to lose
🟢 Use dollar-cost averaging (DCA) to smooth entry prices
🟢 Diversify across assets
🟢 Set stop-loss levels in advance
🟢 Avoid emotion-driven decisions
🎯 Bottom Line
The strong dollar and policy uncertainty make for a challenging backdrop, but discipline and a clear strategy remain your best tools. Track market trends and charts on Binance, and always do your own research. 🚀
$BTC $USDT
A firmer US dollar and lingering monetary policy uncertainty are weighing on Bitcoin and the wider crypto market, as investors lean toward safer assets.
🏦 Why the Dollar Matters
In uncertain conditions, capital tends to flow into the US dollar. Interest rate expectations, inflation data, and central bank signals all shape its direction. A stronger dollar tightens global liquidity, which typically weighs on risk assets like crypto.
⚠️ What's Pressuring Bitcoin
🔴 Policy uncertainty: Delayed rate cuts or a hawkish tone reduce the appeal of risk assets.
🟠 Risk-off sentiment: Investors may rotate from volatile assets into cash or dollars.
🟡 Leverage unwinds: Liquidations can amplify price swings.
Historically, a strong dollar has often coincided with Bitcoin weakness, but the relationship isn't fixed. Institutional demand, regulation, and market dynamics also play a role.
🔍 Key Indicators to Watch
🏛️ Central bank decisions and policy statements
📊 Inflation and employment data
💲 US Dollar Index (DXY)
📈 Bitcoin support and resistance levels
🔄 Trading volume and market sentiment
🛡️ Managing Volatility
🟢 Size positions to what you can afford to lose
🟢 Use dollar-cost averaging (DCA) to smooth entry prices
🟢 Diversify across assets
🟢 Set stop-loss levels in advance
🟢 Avoid emotion-driven decisions
🎯 Bottom Line
The strong dollar and policy uncertainty make for a challenging backdrop, but discipline and a clear strategy remain your best tools. Track market trends and charts on Binance, and always do your own research. 🚀
$BTC $USDT

76
·
--
🚀 Can $XRP Reach $2? Meta AI Predicts an Interesting Outcome!
#xrp is gaining attention as investors watch for its next major move. Could $2 be the next big milestone?
Several factors could support a rally, including institutional interest, ETF demand, Ripple ecosystem growth, and a stronger overall crypto market.
However, XRP needs strong buying pressure and a confirmed breakout above key resistance levels. Nothing is guaranteed in crypto!
🔥 My Take: $2 is a realistic level to watch if bullish momentum returns.
💬 The Big Question: If $XRP reaches $2, could $3–$5 be the next target, or will sellers stop the rally?
Are you BUYING, HOLDING, or WAITING?
#XRP #Ripple #MetaAI #CryptoPrediction
🚀 Can $XRP Reach $2? Meta AI Predicts an Interesting Outcome!
#xrp is gaining attention as investors watch for its next major move. Could $2 be the next big milestone?
Several factors could support a rally, including institutional interest, ETF demand, Ripple ecosystem growth, and a stronger overall crypto market.
However, XRP needs strong buying pressure and a confirmed breakout above key resistance levels. Nothing is guaranteed in crypto!
🔥 My Take: $2 is a realistic level to watch if bullish momentum returns.
💬 The Big Question: If $XRP reaches $2, could $3–$5 be the next target, or will sellers stop the rally?
Are you BUYING, HOLDING, or WAITING?
#XRP #Ripple #MetaAI #CryptoPrediction
#xrp is gaining attention as investors watch for its next major move. Could $2 be the next big milestone?
Several factors could support a rally, including institutional interest, ETF demand, Ripple ecosystem growth, and a stronger overall crypto market.
However, XRP needs strong buying pressure and a confirmed breakout above key resistance levels. Nothing is guaranteed in crypto!
🔥 My Take: $2 is a realistic level to watch if bullish momentum returns.
💬 The Big Question: If $XRP reaches $2, could $3–$5 be the next target, or will sellers stop the rally?
Are you BUYING, HOLDING, or WAITING?
#XRP #Ripple #MetaAI #CryptoPrediction

195
·
--
$XRP Price Prediction: Can XRP Reach $5 by 2030?
$XRP is trading around $1.30–$1.40, well below its July 2025 high of about $3.65. Market sentiment is also cautious, with the Fear & Greed reading at 39 on November 8. So can it hit $5 by 2030?
Why It Could
ETF demand: Spot $XRP ETFs have attracted roughly $1.4 billion since launching in November 2025.
Real use case: Ripple keeps expanding bank and cross-border payment partnerships.
Market cycles: Four years is enough time for a full bull run.
Why It Might Not
Heavy math: $5 means roughly a $300B market cap and a gain of about 270%+ from today's price.
Supply pressure: Tokens released from escrow can weigh on price.
Weak momentum: XRP has struggled to hold key levels recently.
The Verdict
$5 by 2030 is possible, but it's a bull-cycle scenario, not a base case. It would likely need strong ETF inflows, real payment adoption and a hot crypto market all at once.
#xrp #BinanceReopensWithdrawalsForMoreAssets
$XRP Price Prediction: Can XRP Reach $5 by 2030?
$XRP is trading around $1.30–$1.40, well below its July 2025 high of about $3.65. Market sentiment is also cautious, with the Fear & Greed reading at 39 on November 8. So can it hit $5 by 2030?
Why It Could
ETF demand: Spot $XRP ETFs have attracted roughly $1.4 billion since launching in November 2025.
Real use case: Ripple keeps expanding bank and cross-border payment partnerships.
Market cycles: Four years is enough time for a full bull run.
Why It Might Not
Heavy math: $5 means roughly a $300B market cap and a gain of about 270%+ from today's price.
Supply pressure: Tokens released from escrow can weigh on price.
Weak momentum: XRP has struggled to hold key levels recently.
The Verdict
$5 by 2030 is possible, but it's a bull-cycle scenario, not a base case. It would likely need strong ETF inflows, real payment adoption and a hot crypto market all at once.
#xrp #BinanceReopensWithdrawalsForMoreAssets
$XRP is trading around $1.30–$1.40, well below its July 2025 high of about $3.65. Market sentiment is also cautious, with the Fear & Greed reading at 39 on November 8. So can it hit $5 by 2030?
Why It Could
ETF demand: Spot $XRP ETFs have attracted roughly $1.4 billion since launching in November 2025.
Real use case: Ripple keeps expanding bank and cross-border payment partnerships.
Market cycles: Four years is enough time for a full bull run.
Why It Might Not
Heavy math: $5 means roughly a $300B market cap and a gain of about 270%+ from today's price.
Supply pressure: Tokens released from escrow can weigh on price.
Weak momentum: XRP has struggled to hold key levels recently.
The Verdict
$5 by 2030 is possible, but it's a bull-cycle scenario, not a base case. It would likely need strong ETF inflows, real payment adoption and a hot crypto market all at once.
#xrp #BinanceReopensWithdrawalsForMoreAssets

520
·
--
🐸🔥 $PEPE — BULLISH MOMENTUM IS BUILDING!
$PEPE is showing fresh bullish strength, currently trading around $0.00000508 (+3.67%) on the 4H chart.
Buyers are holding above the MA(7), MA(25), and MA(99), keeping the short-term structure positive. The immediate resistance is $0.00000510. A strong breakout above this level could open the door toward $0.00000530–$0.00000568.
📊 Key Levels:
- Current Price: $0.00000508
- Support: $0.00000495–$0.00000480
- Resistance: $0.00000510
- Next Targets: $0.00000530 / $0.00000568
⚠️ RSI is around 76, so a short-term pullback is possible. Watch for volume confirmation before chasing the breakout.
🚀 Can $PEPE reach $0.00000568 next?
Are you BUYING, HOLDING, or WAITING?
#PEPE #Memecoin #BinanceSquare #Bullish
🐸🔥 $PEPE — BULLISH MOMENTUM IS BUILDING!
$PEPE is showing fresh bullish strength, currently trading around $0.00000508 (+3.67%) on the 4H chart.
Buyers are holding above the MA(7), MA(25), and MA(99), keeping the short-term structure positive. The immediate resistance is $0.00000510. A strong breakout above this level could open the door toward $0.00000530–$0.00000568.
📊 Key Levels:
- Current Price: $0.00000508
- Support: $0.00000495–$0.00000480
- Resistance: $0.00000510
- Next Targets: $0.00000530 / $0.00000568
⚠️ RSI is around 76, so a short-term pullback is possible. Watch for volume confirmation before chasing the breakout.
🚀 Can $PEPE reach $0.00000568 next?
Are you BUYING, HOLDING, or WAITING?
#PEPE #Memecoin #BinanceSquare #Bullish
$PEPE is showing fresh bullish strength, currently trading around $0.00000508 (+3.67%) on the 4H chart.
Buyers are holding above the MA(7), MA(25), and MA(99), keeping the short-term structure positive. The immediate resistance is $0.00000510. A strong breakout above this level could open the door toward $0.00000530–$0.00000568.
📊 Key Levels:
- Current Price: $0.00000508
- Support: $0.00000495–$0.00000480
- Resistance: $0.00000510
- Next Targets: $0.00000530 / $0.00000568
⚠️ RSI is around 76, so a short-term pullback is possible. Watch for volume confirmation before chasing the breakout.
🚀 Can $PEPE reach $0.00000568 next?
Are you BUYING, HOLDING, or WAITING?
#PEPE #Memecoin #BinanceSquare #Bullish

123
·
--
🚀 $JCT — NEW ALL-TIME HIGH LOADING! 🔥
$JCT is making an explosive move! 📈
Currently trading at $0.010632, up an incredible +285.50% in 24 hours!
💥 24H High: $0.011798
📊 24H Volume: $492.29M USDT
🟢 MA(7): $0.005002
🟣 MA(25): $0.004226
🔵 MA(99): $0.005330
Buyers are showing massive strength, and trading volume is rising sharply.
🎯 Next Psychological Target: $0.01200
🚀 Bigger Target: $0.01500
A new ATH could be on the horizon if bullish momentum continues!
🔥 JCT's next big move could be exciting. Are you READY?
👇 What do you think — $0.015 coming soon?
#JCT #Binance #CryptoBreakout #BullishMomentum
🚀 $JCT — NEW ALL-TIME HIGH LOADING! 🔥
$JCT is making an explosive move! 📈
Currently trading at $0.010632, up an incredible +285.50% in 24 hours!
💥 24H High: $0.011798
📊 24H Volume: $492.29M USDT
🟢 MA(7): $0.005002
🟣 MA(25): $0.004226
🔵 MA(99): $0.005330
Buyers are showing massive strength, and trading volume is rising sharply.
🎯 Next Psychological Target: $0.01200
🚀 Bigger Target: $0.01500
A new ATH could be on the horizon if bullish momentum continues!
🔥 JCT's next big move could be exciting. Are you READY?
👇 What do you think — $0.015 coming soon?
#JCT #Binance #CryptoBreakout #BullishMomentum
$JCT is making an explosive move! 📈
Currently trading at $0.010632, up an incredible +285.50% in 24 hours!
💥 24H High: $0.011798
📊 24H Volume: $492.29M USDT
🟢 MA(7): $0.005002
🟣 MA(25): $0.004226
🔵 MA(99): $0.005330
Buyers are showing massive strength, and trading volume is rising sharply.
🎯 Next Psychological Target: $0.01200
🚀 Bigger Target: $0.01500
A new ATH could be on the horizon if bullish momentum continues!
🔥 JCT's next big move could be exciting. Are you READY?
👇 What do you think — $0.015 coming soon?
#JCT #Binance #CryptoBreakout #BullishMomentum

618
·
--
🚀 $HOT — Bullish Momentum Is Heating Up! 🔥
$HOT is trading at $0.000485, up +33.6%, with buyers pushing price toward a fresh breakout.
🎯 Targets: $0.000500 → $0.000550
🟢 Support: $0.000425 – $0.000396
A breakout above $0.000500 could trigger another bullish move. Watch for confirmation and avoid chasing the pump!
🔥 Are you HOLDING or BUYING $HOT ?
#BinanceSquare #cryptotrading
🚀 $HOT — Bullish Momentum Is Heating Up! 🔥
$HOT is trading at $0.000485, up +33.6%, with buyers pushing price toward a fresh breakout.
🎯 Targets: $0.000500 → $0.000550
🟢 Support: $0.000425 – $0.000396
A breakout above $0.000500 could trigger another bullish move. Watch for confirmation and avoid chasing the pump!
🔥 Are you HOLDING or BUYING $HOT ?
#BinanceSquare #cryptotrading
$HOT is trading at $0.000485, up +33.6%, with buyers pushing price toward a fresh breakout.
🎯 Targets: $0.000500 → $0.000550
🟢 Support: $0.000425 – $0.000396
A breakout above $0.000500 could trigger another bullish move. Watch for confirmation and avoid chasing the pump!
🔥 Are you HOLDING or BUYING $HOT ?
#BinanceSquare #cryptotrading

1
173
·
--
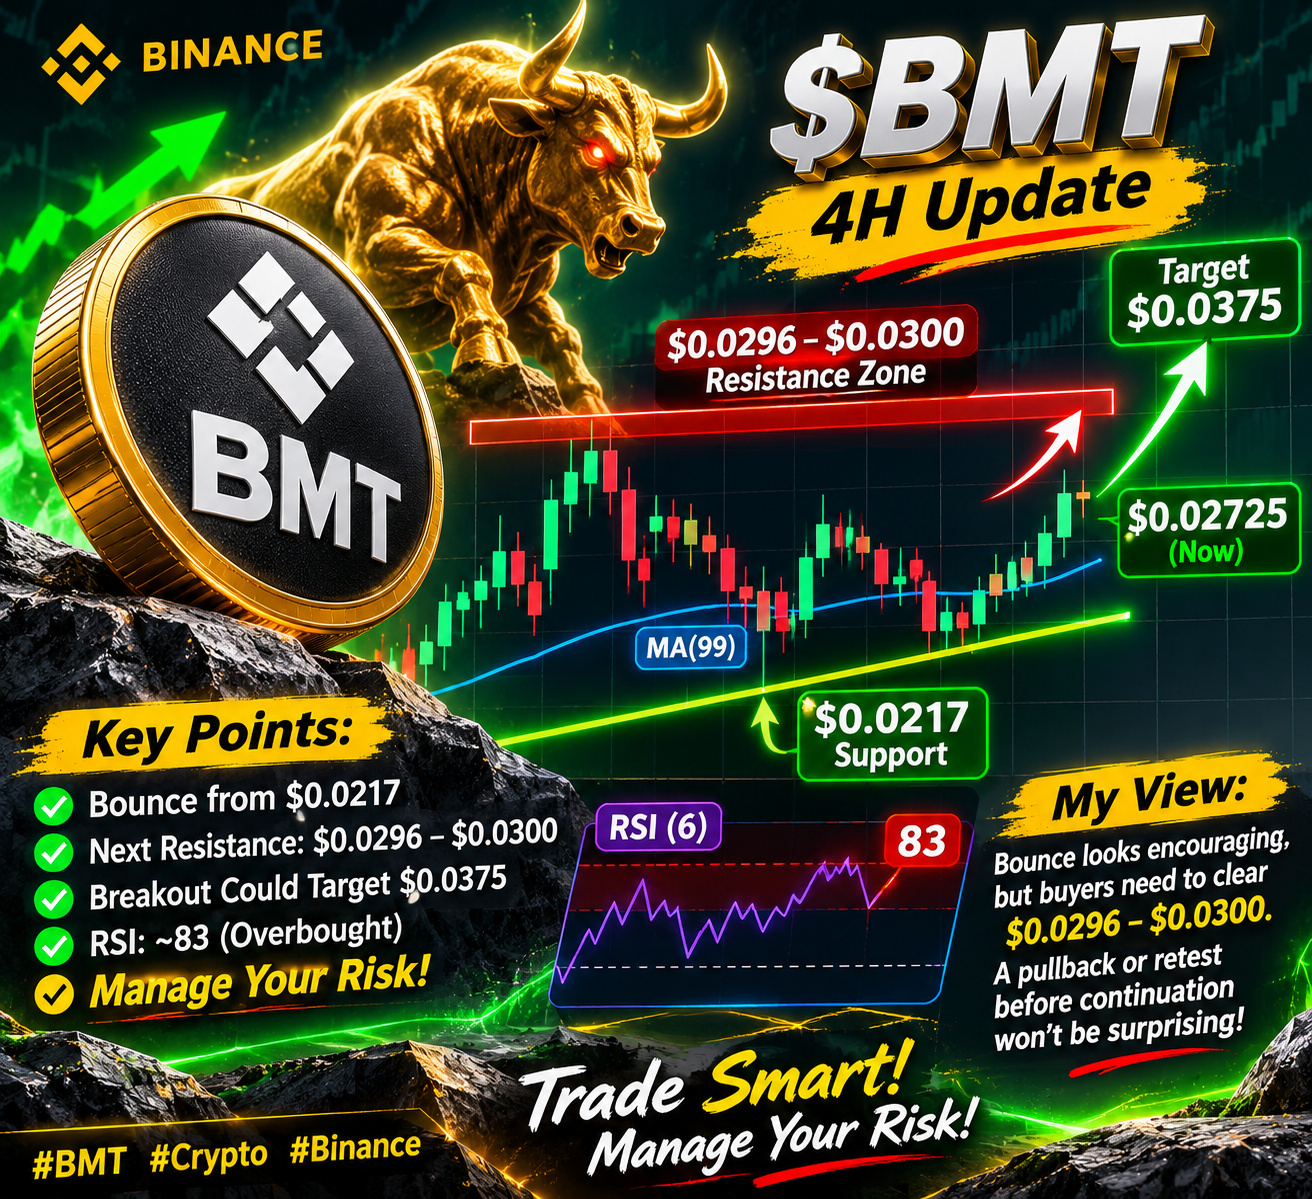
$BMT 4H Update
$BMT is bouncing from rising support near $0.0217 and trading around $0.02725 on this chart.
Next test is the $0.0296 to $0.0300 resistance zone, where the MA(99) and the previous swing highs sit. A breakout and successful retest could open a move toward $0.0375.
My view: the bounce looks encouraging, but buyers still need to clear resistance. Losing $0.0217 would weaken this setup.
RSI is already around 83 (overbought), so a pullback or retest before continuation wouldn't be surprising.
Manage your risk.
#BMT #crypto #Binance
$BMT 4H Update
$BMT is bouncing from rising support near $0.0217 and trading around $0.02725 on this chart.
Next test is the $0.0296 to $0.0300 resistance zone, where the MA(99) and the previous swing highs sit. A breakout and successful retest could open a move toward $0.0375.
My view: the bounce looks encouraging, but buyers still need to clear resistance. Losing $0.0217 would weaken this setup.
RSI is already around 83 (overbought), so a pullback or retest before continuation wouldn't be surprising.
Manage your risk.
#BMT #crypto #Binance
$BMT is bouncing from rising support near $0.0217 and trading around $0.02725 on this chart.
Next test is the $0.0296 to $0.0300 resistance zone, where the MA(99) and the previous swing highs sit. A breakout and successful retest could open a move toward $0.0375.
My view: the bounce looks encouraging, but buyers still need to clear resistance. Losing $0.0217 would weaken this setup.
RSI is already around 83 (overbought), so a pullback or retest before continuation wouldn't be surprising.
Manage your risk.
#BMT #crypto #Binance
55
·
--
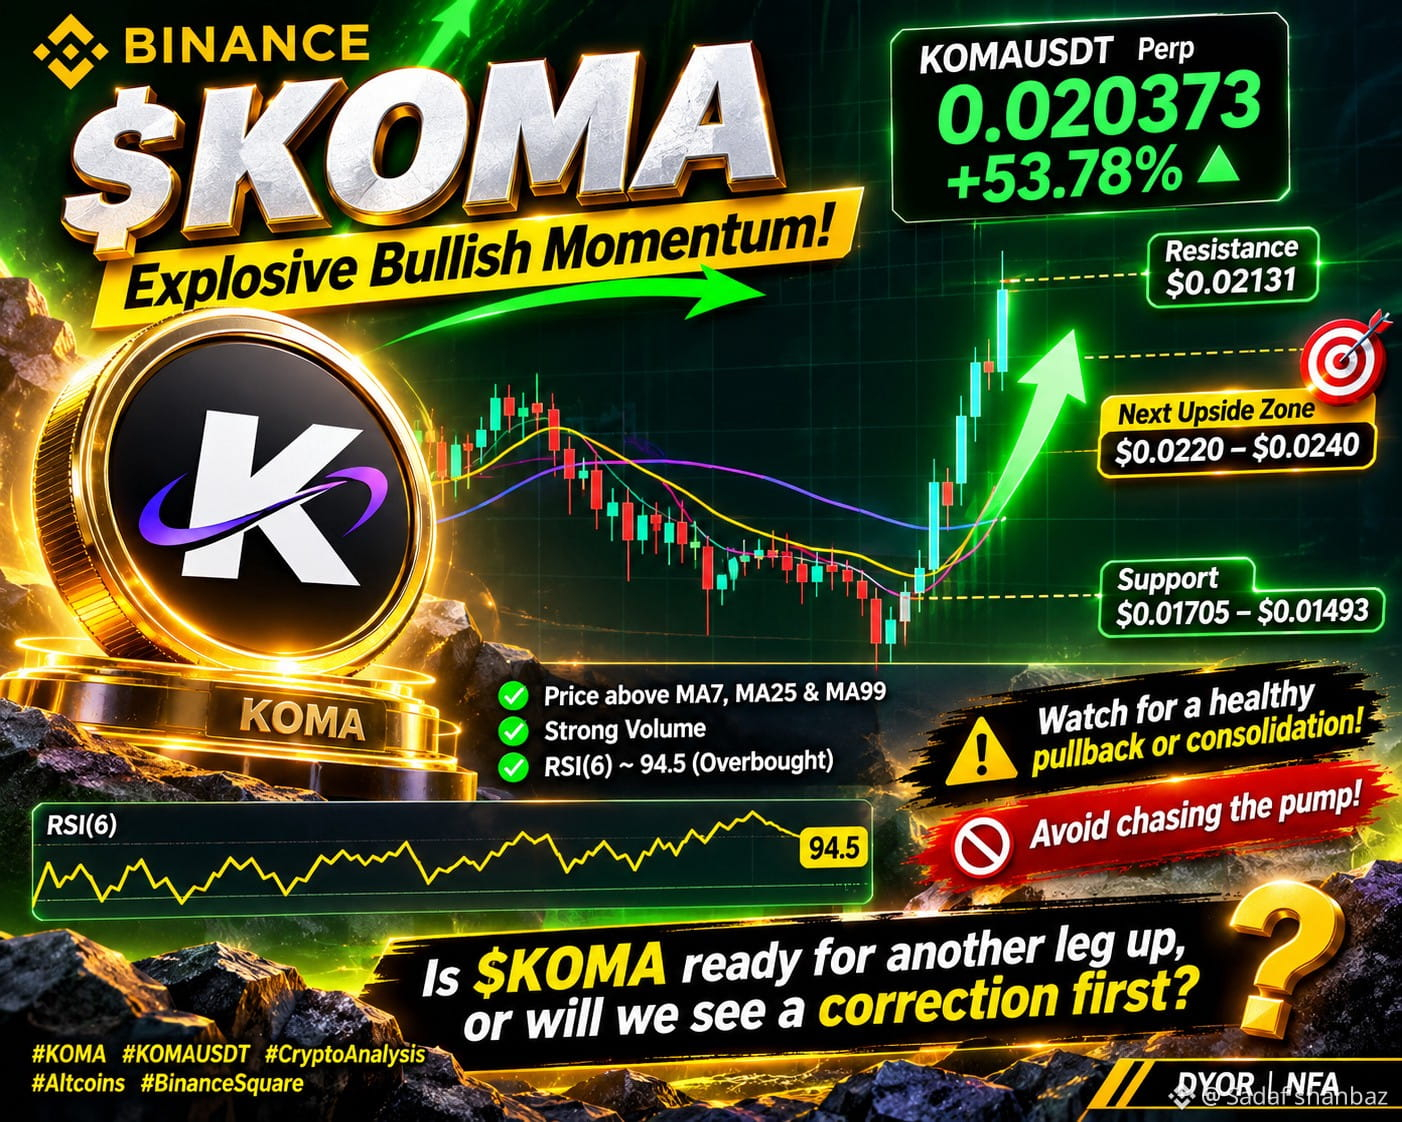
🚀 $KOMA — Explosive Bullish Momentum!
$KOMA is showing a powerful breakout on the 4H chart, currently trading at $0.020373 (+53.78%) with a massive surge in trading volume.
📊 Key Levels:
- Resistance: $0.02131
- Support: $0.01705 – $0.01493
- Next upside zone: $0.0220 – $0.0240
The price is trading well above MA7, MA25 and MA99, confirming strong bullish momentum. However, RSI(6) is near 94.5, indicating extremely overbought conditions.
I'm watching for a healthy pullback or consolidation before the next potential move. Avoid chasing the pump!
🔥 Is $KOMA ready for another leg up, or will we see a correction first?
#KOMA #KOMAUSDT #CryptoAnalysis #Altcoins #BinanceSquare
DYOR | NFA
🚀 $KOMA — Explosive Bullish Momentum!
$KOMA is showing a powerful breakout on the 4H chart, currently trading at $0.020373 (+53.78%) with a massive surge in trading volume.
📊 Key Levels:
- Resistance: $0.02131
- Support: $0.01705 – $0.01493
- Next upside zone: $0.0220 – $0.0240
The price is trading well above MA7, MA25 and MA99, confirming strong bullish momentum. However, RSI(6) is near 94.5, indicating extremely overbought conditions.
I'm watching for a healthy pullback or consolidation before the next potential move. Avoid chasing the pump!
🔥 Is $KOMA ready for another leg up, or will we see a correction first?
#KOMA #KOMAUSDT #CryptoAnalysis #Altcoins #BinanceSquare
DYOR | NFA
$KOMA is showing a powerful breakout on the 4H chart, currently trading at $0.020373 (+53.78%) with a massive surge in trading volume.
📊 Key Levels:
- Resistance: $0.02131
- Support: $0.01705 – $0.01493
- Next upside zone: $0.0220 – $0.0240
The price is trading well above MA7, MA25 and MA99, confirming strong bullish momentum. However, RSI(6) is near 94.5, indicating extremely overbought conditions.
I'm watching for a healthy pullback or consolidation before the next potential move. Avoid chasing the pump!
🔥 Is $KOMA ready for another leg up, or will we see a correction first?
#KOMA #KOMAUSDT #CryptoAnalysis #Altcoins #BinanceSquare
DYOR | NFA
76
·
--
🚀 $IDOL — What Should You Do Next?
👇 Are you BUYING, WAITING, or TAKING PROFITS?
IDOLUSDT has shown impressive momentum on the 4H chart, currently trading at 0.032658, up approximately 30% in 24 hours.
📊 Key Levels:
- 24H High: 0.045550 (long upper wick indicates selling pressure)
- 24H Low: 0.023399
- MA(7): 0.0313
- MA(25): 0.0246
- MA(99): 0.0162
- RSI(6): 72 (approaching overbought territory)
- 24H Volume: 464M USDT (strong trading activity)
📈 My Analysis:
Price is trading above all three moving averages, keeping the overall trend bullish. After a massive rally from 0.0068 to 0.0455, $IDOL is now experiencing a pullback.
The key is to watch whether buyers defend the current levels or selling pressure increases.
💬 What's your move?
🟢 BUYING – Looking for a pullback entry
🟡 WAITING – Waiting for confirmation
🔴 TAKING PROFITS – Securing gains
Drop your opinion in the comments! 👇
#IDOL #BinanceVietnamSquare #BinanceSquare #futures
🚀 $IDOL — What Should You Do Next?
👇 Are you BUYING, WAITING, or TAKING PROFITS?
IDOLUSDT has shown impressive momentum on the 4H chart, currently trading at 0.032658, up approximately 30% in 24 hours.
📊 Key Levels:
- 24H High: 0.045550 (long upper wick indicates selling pressure)
- 24H Low: 0.023399
- MA(7): 0.0313
- MA(25): 0.0246
- MA(99): 0.0162
- RSI(6): 72 (approaching overbought territory)
- 24H Volume: 464M USDT (strong trading activity)
📈 My Analysis:
Price is trading above all three moving averages, keeping the overall trend bullish. After a massive rally from 0.0068 to 0.0455, $IDOL is now experiencing a pullback.
The key is to watch whether buyers defend the current levels or selling pressure increases.
💬 What's your move?
🟢 BUYING – Looking for a pullback entry
🟡 WAITING – Waiting for confirmation
🔴 TAKING PROFITS – Securing gains
Drop your opinion in the comments! 👇
#IDOL #BinanceVietnamSquare #BinanceSquare #futures
👇 Are you BUYING, WAITING, or TAKING PROFITS?
IDOLUSDT has shown impressive momentum on the 4H chart, currently trading at 0.032658, up approximately 30% in 24 hours.
📊 Key Levels:
- 24H High: 0.045550 (long upper wick indicates selling pressure)
- 24H Low: 0.023399
- MA(7): 0.0313
- MA(25): 0.0246
- MA(99): 0.0162
- RSI(6): 72 (approaching overbought territory)
- 24H Volume: 464M USDT (strong trading activity)
📈 My Analysis:
Price is trading above all three moving averages, keeping the overall trend bullish. After a massive rally from 0.0068 to 0.0455, $IDOL is now experiencing a pullback.
The key is to watch whether buyers defend the current levels or selling pressure increases.
💬 What's your move?
🟢 BUYING – Looking for a pullback entry
🟡 WAITING – Waiting for confirmation
🔴 TAKING PROFITS – Securing gains
Drop your opinion in the comments! 👇
#IDOL #BinanceVietnamSquare #BinanceSquare #futures

261
Войдите, чтобы посмотреть больше материала
Присоединяйтесь к пользователям криптовалют по всему миру на Binance Square
⚡️ Получайте новейшую и полезную информацию о криптоактивах.
💬 Нам доверяет крупнейшая в мире криптобиржа.
👍 Получите достоверные аналитические данные от верифицированных создателей контента.
Эл. почта/номер телефона
В тренде
A Packed Week of Earnings and Data Tests Markets
Просмотров: 63,388
399 обсуждают
Nvidia, Anthropic і ФРС. Три тести за один тиждень
Nick_Invest
·Лайков: 3
·Просмотров: 1.3k
AnthropicIPOTestsInvestorAppetiteForAI
Просмотров: 118,739
1,378 обсуждают
BitcoinExtendsLosingStreakToSixWeeks
Просмотров: 92,728
740 обсуждают