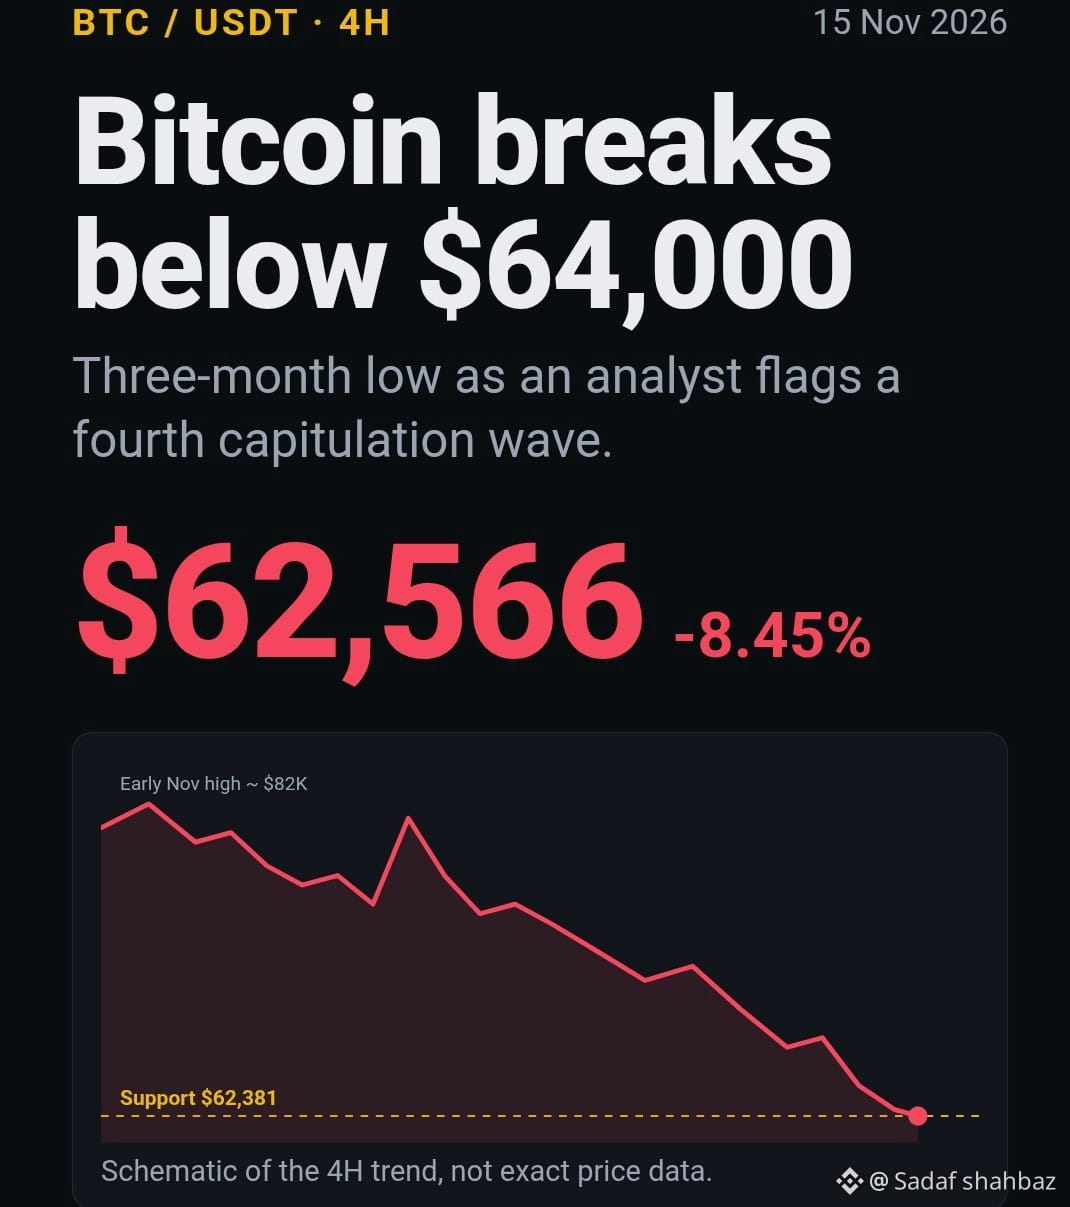
Bitcoin Slides Below $64,000 to a Three-Month Low as Analyst Flags Fourth Capitulation Wave
$BTC trades near $62,566, down roughly 8.5% on the day, as momentum indicators reach historically extreme oversold readings.
Market Snapshot
Metric
Value
Last price (BTC/USDT)
$62,565.99
24h change
-8.45%
24h high / low
$68,403.79 / $62,381.00
24h volume
~35,800 BTC (~$2.35B)
Bitcoin broke decisively below $64,000 in a sharp, high-volume decline, extending a drawdown that began after the early-November rejection near $82,000 on the 4-hour chart.
Technical Picture
Trend structure. Price sits below all three tracked moving averages: the 7-period at $65,626, the 25-period at $70,083 and the 99-period at $75,166. All three are sloping lower, which confirms a persistent bearish trend rather than a transient pullback.
Momentum. The 6-period RSI has dropped to 7.22, deep in oversold territory and far below the conventional 30 threshold. Readings this low have historically coincided with exhaustion in selling pressure and tactical rebounds. They are not, on their own, a reversal signal.
Volume. Expanding volume on large red candles points to forced liquidation and panic selling, the hallmark of capitulation-style price action.
What a "Capitulation Wave" Means
Capitulation describes a phase in which investors, often recent buyers holding unrealized losses, sell regardless of price. Such episodes have frequently clustered near local lows, as supply shifts from weak hands to higher-conviction holders. History also shows that markets can extend lower after an initial flush, and that a single capitulation event does not confirm a durable bottom.
Key Levels
Support: $62,381 (session low), then $61,400 and the psychological $60,000 zone.
Resistance: $65,600 (MA7), followed by $68,400 and $70,000.
A 4-hour close back above $65,600 would be the first sign that sellers are losing control. A sustained break below $62,381 would open the path toward $60,000.
#BTC
$BTC trades near $62,566, down roughly 8.5% on the day, as momentum indicators reach historically extreme oversold readings.
Market Snapshot
Metric
Value
Last price (BTC/USDT)
$62,565.99
24h change
-8.45%
24h high / low
$68,403.79 / $62,381.00
24h volume
~35,800 BTC (~$2.35B)
Bitcoin broke decisively below $64,000 in a sharp, high-volume decline, extending a drawdown that began after the early-November rejection near $82,000 on the 4-hour chart.
Technical Picture
Trend structure. Price sits below all three tracked moving averages: the 7-period at $65,626, the 25-period at $70,083 and the 99-period at $75,166. All three are sloping lower, which confirms a persistent bearish trend rather than a transient pullback.
Momentum. The 6-period RSI has dropped to 7.22, deep in oversold territory and far below the conventional 30 threshold. Readings this low have historically coincided with exhaustion in selling pressure and tactical rebounds. They are not, on their own, a reversal signal.
Volume. Expanding volume on large red candles points to forced liquidation and panic selling, the hallmark of capitulation-style price action.
What a "Capitulation Wave" Means
Capitulation describes a phase in which investors, often recent buyers holding unrealized losses, sell regardless of price. Such episodes have frequently clustered near local lows, as supply shifts from weak hands to higher-conviction holders. History also shows that markets can extend lower after an initial flush, and that a single capitulation event does not confirm a durable bottom.
Key Levels
Support: $62,381 (session low), then $61,400 and the psychological $60,000 zone.
Resistance: $65,600 (MA7), followed by $68,400 and $70,000.
A 4-hour close back above $65,600 would be the first sign that sellers are losing control. A sustained break below $62,381 would open the path toward $60,000.
#BTC