

RISKK TAKER
739 Публикации

RISKK TAKER
Отправить жалобу
Заблокировать пользователя
RISK TAKER, Technical Analyst, Trader, My post NFA
Открытая сделка
Случайный трейдер
9 мес.
7 подписок(и/а)
38 подписчиков(а)
1.0K+ понравилось
Посты
Портфель
Все
Цитирования
Видео
·
--
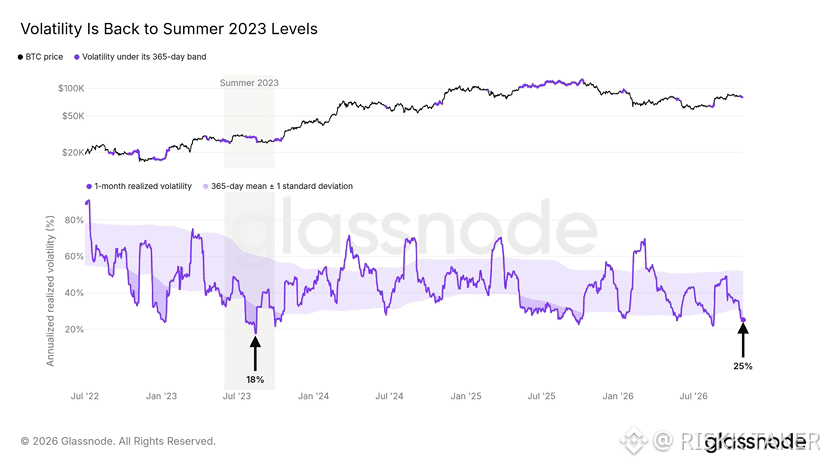
There’s an interesting parallel developing between Bitcoin’s current market and the summer of 2023.
Back then, BTC made an initial recovery, meme coins and altcoins caught fire, and volatility eventually dropped to unusually low levels. A similar sequence has played out this year, with Bitcoin’s volatility now back around summer 2023 levels.
The important part is what happened next. In 2023, Bitcoin eventually broke out and gained roughly 50% from the start of October through year end.
Could history repeat itself? Possibly, but low volatility doesn’t tell us which direction the next major move will take. In fact, Glassnode notes that the previous volatility low came just before a sharp move downward in August 2023.
For traders, the key is to watch for a breakout backed by stronger spot demand and trading volume. The setup is familiar, but confirmation matters more than the resemblance.$BNB
{future}(BNBUSDT)
There’s an interesting parallel developing between Bitcoin’s current market and the summer of 2023.
Back then, BTC made an initial recovery, meme coins and altcoins caught fire, and volatility eventually dropped to unusually low levels. A similar sequence has played out this year, with Bitcoin’s volatility now back around summer 2023 levels.
The important part is what happened next. In 2023, Bitcoin eventually broke out and gained roughly 50% from the start of October through year end.
Could history repeat itself? Possibly, but low volatility doesn’t tell us which direction the next major move will take. In fact, Glassnode notes that the previous volatility low came just before a sharp move downward in August 2023.
For traders, the key is to watch for a breakout backed by stronger spot demand and trading volume. The setup is familiar, but confirmation matters more than the resemblance.$BNB
1
73
·
--
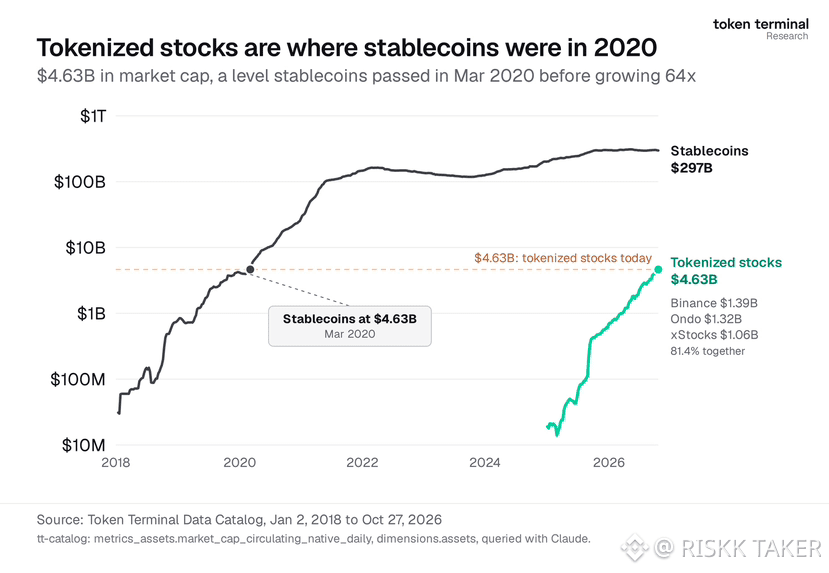
Tokenized stocks have reached a $4.63 billion market cap, bringing back comparisons with stablecoins, which were around the same size in March 2020 before eventually growing to nearly $300 billion.
The comparison is interesting because tokenization could make traditional equities easier to access through blockchain infrastructure, with potential benefits such as fractional ownership and trading beyond conventional market hours, depending on the product.
But there’s an important distinction: matching stablecoins’ early market cap doesn’t mean tokenized stocks will repeat their 64x growth. Stablecoins solve a different problem, and tokenized equities face their own regulatory, liquidity and adoption challenges.
For the sector, the next milestone isn’t just a bigger market cap. It’s whether trading volume, user demand and access across platforms continue to grow.
Tokenized stocks are gaining traction, but sustained adoption will determine whether this becomes a much larger market.
$BNB
{future}(BNBUSDT)
$PEPE
{spot}(PEPEUSDT)
Tokenized stocks have reached a $4.63 billion market cap, bringing back comparisons with stablecoins, which were around the same size in March 2020 before eventually growing to nearly $300 billion.
The comparison is interesting because tokenization could make traditional equities easier to access through blockchain infrastructure, with potential benefits such as fractional ownership and trading beyond conventional market hours, depending on the product.
But there’s an important distinction: matching stablecoins’ early market cap doesn’t mean tokenized stocks will repeat their 64x growth. Stablecoins solve a different problem, and tokenized equities face their own regulatory, liquidity and adoption challenges.
For the sector, the next milestone isn’t just a bigger market cap. It’s whether trading volume, user demand and access across platforms continue to grow.
Tokenized stocks are gaining traction, but sustained adoption will determine whether this becomes a much larger market.
$BNB
$PEPE
1
67
·
--
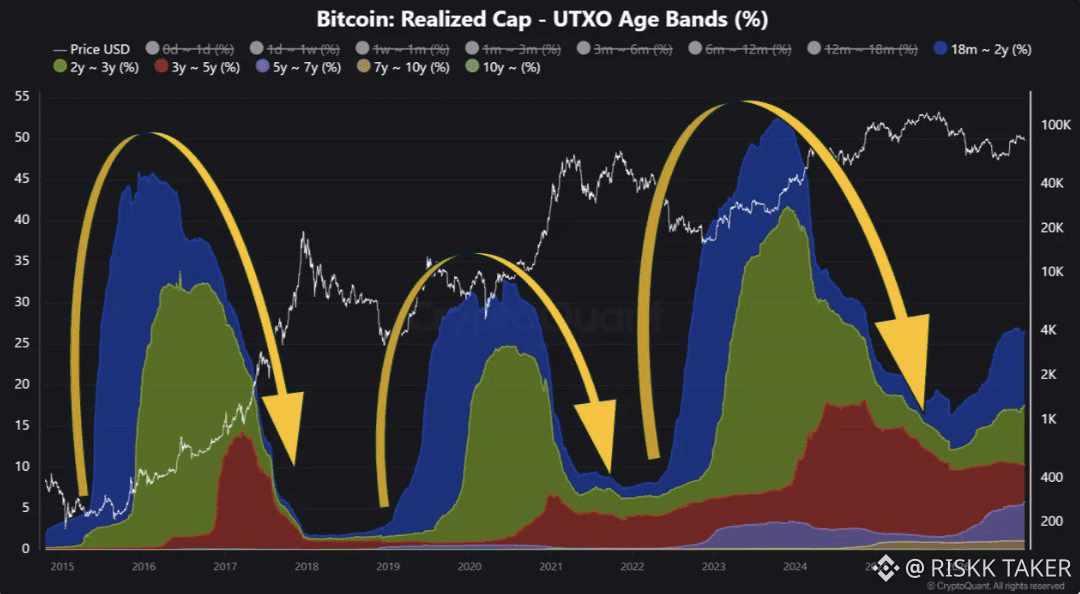
BITCOIN NEXT RALLY MAY BE TAKING SHAPE
Bitcoin’s long term holder behavior is showing a pattern that has historically appeared before strong rallies.
According to CryptoQuant, the share of Bitcoin’s realized cap held in coins untouched for 18 months or longer peaked at 26.98% on September 16, before easing to 26.59%. Similar declines have preceded major rallies in previous cycles.
The idea is that as older coins begin moving again, the market may be entering a new phase where long held supply changes hands and fresh demand absorbs it.
But this signal alone doesn’t confirm a rally. Long-term holders moving coins can also mean profit-taking, and without stronger spot demand, the bullish setup could fail.
The key now is confirmation, whether BTC demand improves while this metric continues to decline.
The pattern is worth watching, but price action still has to prove the thesis.
$BTC
{future}(BTCUSDT)
BITCOIN NEXT RALLY MAY BE TAKING SHAPE
Bitcoin’s long term holder behavior is showing a pattern that has historically appeared before strong rallies.
According to CryptoQuant, the share of Bitcoin’s realized cap held in coins untouched for 18 months or longer peaked at 26.98% on September 16, before easing to 26.59%. Similar declines have preceded major rallies in previous cycles.
The idea is that as older coins begin moving again, the market may be entering a new phase where long held supply changes hands and fresh demand absorbs it.
But this signal alone doesn’t confirm a rally. Long-term holders moving coins can also mean profit-taking, and without stronger spot demand, the bullish setup could fail.
The key now is confirmation, whether BTC demand improves while this metric continues to decline.
The pattern is worth watching, but price action still has to prove the thesis.
$BTC
2
242
·
--
Ripple and Robinhood have announced a strategic partnership covering stablecoins, institutional trading and treasury management.
The deal puts Ripple’s RLUSD stablecoin on Robinhood Chain and Bitstamp by Robinhood, with availability in the Robinhood app expected later this year. Robinhood will also use RLUSD on the XRP Ledger for institutional settlement.
The potential upside is broader distribution for RLUSD and more real-world use of stablecoins beyond crypto trading. If adoption grows, it could strengthen activity across Ripple’s payments infrastructure and the XRP Ledger ecosystem.
But RLUSD adoption doesn’t automatically mean increased demand for XRP. The stablecoin and XRP are different assets, and the market impact will depend on actual usage and transaction activity.
The real metric to watch is whether this partnership translates into meaningful stablecoin circulation and settlement volume, not just another headline.
$XRP
{future}(XRPUSDT)
$HOOD
{future}(HOODUSDT)
Ripple and Robinhood have announced a strategic partnership covering stablecoins, institutional trading and treasury management.
The deal puts Ripple’s RLUSD stablecoin on Robinhood Chain and Bitstamp by Robinhood, with availability in the Robinhood app expected later this year. Robinhood will also use RLUSD on the XRP Ledger for institutional settlement.
The potential upside is broader distribution for RLUSD and more real-world use of stablecoins beyond crypto trading. If adoption grows, it could strengthen activity across Ripple’s payments infrastructure and the XRP Ledger ecosystem.
But RLUSD adoption doesn’t automatically mean increased demand for XRP. The stablecoin and XRP are different assets, and the market impact will depend on actual usage and transaction activity.
The real metric to watch is whether this partnership translates into meaningful stablecoin circulation and settlement volume, not just another headline.
$XRP
$HOOD

1
184
·
--
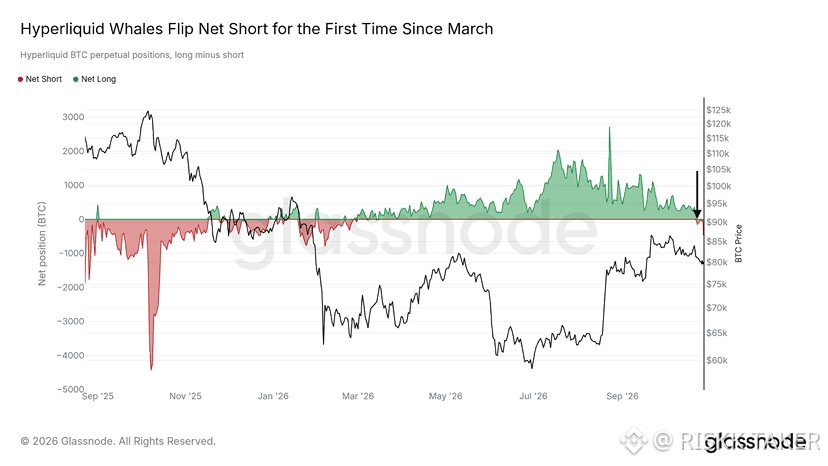
Large Hyperliquid traders are now net short BTC for the first time since March, after successfully riding the previous bottom with long positions. Their positioning reportedly flipped last week.
This puts Bitcoin at an interesting point. If selling pressure builds and BTC loses key support, these traders could be positioned to profit from a deeper correction.
But there’s a risk to that trade.
If BTC starts recovering instead, crowded short positions could be forced to close, adding buying pressure and potentially triggering a short squeeze.
Current whale data also shows significant short exposure, although the exact picture depends on which wallets and trader groups are tracked.
whale positioning is worth watching, but it isn’t a reliable prediction on its own. BTC’s price reaction, open interest and liquidation data will help show whether this bearish shift is well-timed or becoming a crowded trade. $HYPE
{future}(HYPEUSDT)
$BTC
{future}(BTCUSDT)
Large Hyperliquid traders are now net short BTC for the first time since March, after successfully riding the previous bottom with long positions. Their positioning reportedly flipped last week.
This puts Bitcoin at an interesting point. If selling pressure builds and BTC loses key support, these traders could be positioned to profit from a deeper correction.
But there’s a risk to that trade.
If BTC starts recovering instead, crowded short positions could be forced to close, adding buying pressure and potentially triggering a short squeeze.
Current whale data also shows significant short exposure, although the exact picture depends on which wallets and trader groups are tracked.
whale positioning is worth watching, but it isn’t a reliable prediction on its own. BTC’s price reaction, open interest and liquidation data will help show whether this bearish shift is well-timed or becoming a crowded trade. $HYPE
$BTC
1
186
·
--
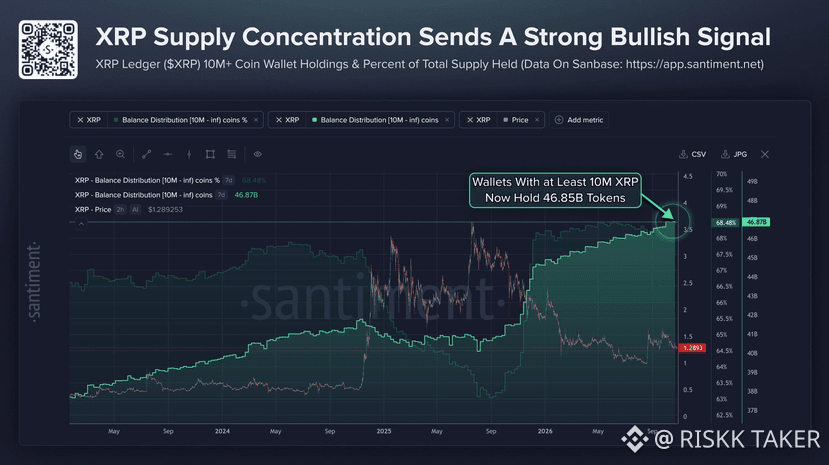
🐋 XRP WHALES NOW CONTROL 68.5% OF SUPPLY
Wallets holding at least 10 million XRP now control 46.87 billion tokens, representing 68.5% of the total supply. Santiment says this is the highest share since November 2022, while XRP trades around $1.29.
This concentration could support XRP if large holders continue accumulating and absorb tokens being sold by smaller investors. With fewer tokens circulating among smaller holders, renewed demand could also amplify a price recovery.
But there’s another side: whale accumulation doesn’t guarantee a rally. Large holders can influence liquidity, and recent reports also point to rising XRP balances on exchanges, which could increase selling pressure.
For traders, $1.30 is a key level to watch, while holding $1.20 could help preserve the recovery setup. A breakdown would weaken the bullish case.
The whale data is encouraging, but price action and exchange flows will show whether accumulation is translating into real market strength.
$XRP
{future}(XRPUSDT)
🐋 XRP WHALES NOW CONTROL 68.5% OF SUPPLY
Wallets holding at least 10 million XRP now control 46.87 billion tokens, representing 68.5% of the total supply. Santiment says this is the highest share since November 2022, while XRP trades around $1.29.
This concentration could support XRP if large holders continue accumulating and absorb tokens being sold by smaller investors. With fewer tokens circulating among smaller holders, renewed demand could also amplify a price recovery.
But there’s another side: whale accumulation doesn’t guarantee a rally. Large holders can influence liquidity, and recent reports also point to rising XRP balances on exchanges, which could increase selling pressure.
For traders, $1.30 is a key level to watch, while holding $1.20 could help preserve the recovery setup. A breakdown would weaken the bullish case.
The whale data is encouraging, but price action and exchange flows will show whether accumulation is translating into real market strength.
$XRP
1
591
·
--
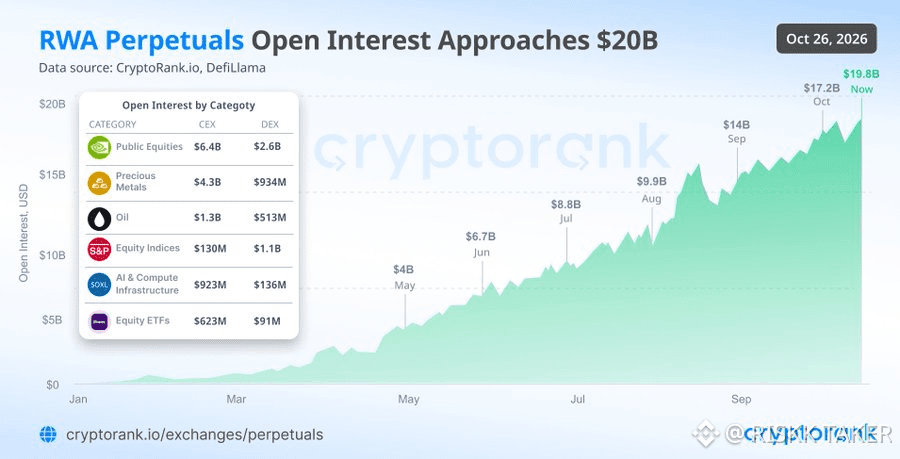
📊 RWA PERPETUALS APPROACH $20B IN OPEN INTEREST
CryptoRank data shows open interest in real world asset (RWA) perpetual futures has climbed close to $20 billion, up roughly 192% since June.
These contracts give traders leveraged exposure to traditional assets such as stocks, gold, oil and equity indices through crypto trading platforms.
The growth signals that traders are increasingly using crypto infrastructure to trade beyond Bitcoin and altcoins.
For the market, this could be a positive sign for the expansion of tokenized finance, attracting more activity and competition between centralized and decentralized exchanges.
But there’s a risk behind the headline, open interest measures outstanding positions, not actual buying or guaranteed demand. More leverage can also mean larger liquidations when prices move sharply.
The real story isn’t just the $20B figure. It’s how quickly RWA derivatives are becoming a bigger part of crypto trading.
$DOOD
{future}(DOODUSDT)
📊 RWA PERPETUALS APPROACH $20B IN OPEN INTEREST
CryptoRank data shows open interest in real world asset (RWA) perpetual futures has climbed close to $20 billion, up roughly 192% since June.
These contracts give traders leveraged exposure to traditional assets such as stocks, gold, oil and equity indices through crypto trading platforms.
The growth signals that traders are increasingly using crypto infrastructure to trade beyond Bitcoin and altcoins.
For the market, this could be a positive sign for the expansion of tokenized finance, attracting more activity and competition between centralized and decentralized exchanges.
But there’s a risk behind the headline, open interest measures outstanding positions, not actual buying or guaranteed demand. More leverage can also mean larger liquidations when prices move sharply.
The real story isn’t just the $20B figure. It’s how quickly RWA derivatives are becoming a bigger part of crypto trading.
$DOOD
78
·
--
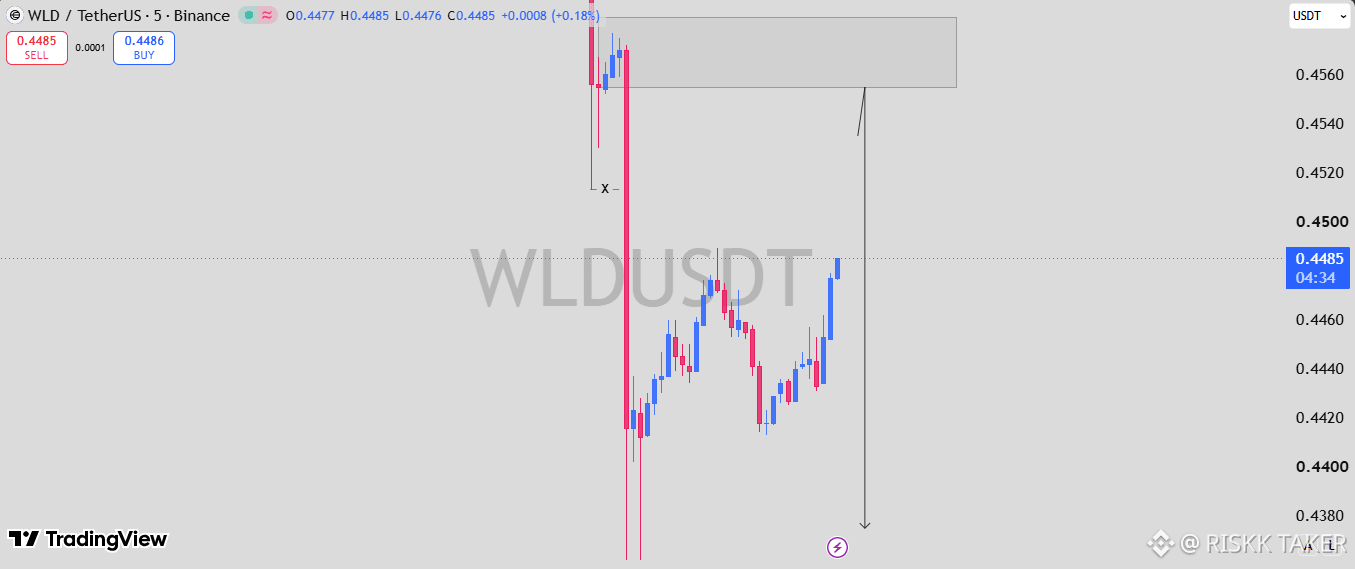
WLD is currently trading around $0.4485 following a strong downward move and a subsequent recovery from the $0.441 region.
On the 5 minute chart, this rebound suggests that buyers are attempting to recover some of the lost ground, but price is approaching a clearly marked supply zone that could become decisive for the next move.
The resistance area between $0.455 and $0.458 is the primary zone of interest. If WLD pushes into this region and encounters strong selling pressure, the recovery could lose momentum and develop into another bearish continuation.
The chart projection points toward approximately $0.438 as a potential downside target, representing a return toward the lower end of the recent price range.
For this scenario to develop, I would want to see clear rejection or a bearish shift in short-term market structure around the supply zone. A direct breakout above resistance followed by sustained price acceptance would weaken the setup and require a reassessment.
The current rebound is worth monitoring, but it is not sufficient evidence of a confirmed trend reversal. The next reaction at resistance should provide a clearer indication of whether sellers can regain control.
$WLD
{future}(WLDUSDT)
WLD is currently trading around $0.4485 following a strong downward move and a subsequent recovery from the $0.441 region.
On the 5 minute chart, this rebound suggests that buyers are attempting to recover some of the lost ground, but price is approaching a clearly marked supply zone that could become decisive for the next move.
The resistance area between $0.455 and $0.458 is the primary zone of interest. If WLD pushes into this region and encounters strong selling pressure, the recovery could lose momentum and develop into another bearish continuation.
The chart projection points toward approximately $0.438 as a potential downside target, representing a return toward the lower end of the recent price range.
For this scenario to develop, I would want to see clear rejection or a bearish shift in short-term market structure around the supply zone. A direct breakout above resistance followed by sustained price acceptance would weaken the setup and require a reassessment.
The current rebound is worth monitoring, but it is not sufficient evidence of a confirmed trend reversal. The next reaction at resistance should provide a clearer indication of whether sellers can regain control.
$WLD
2
261
·
--
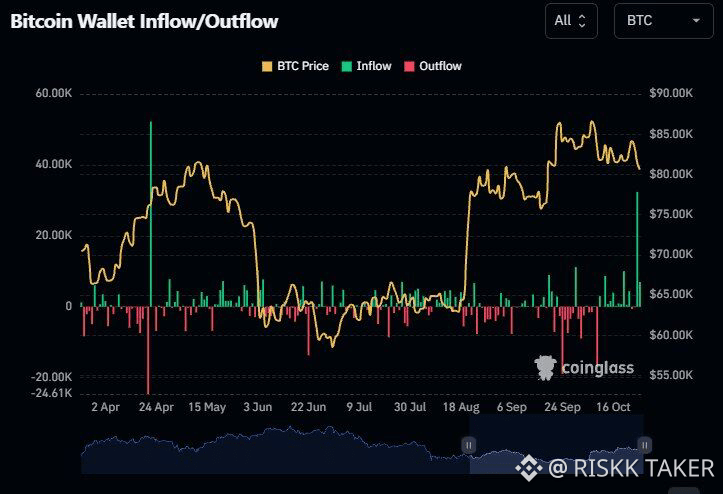
Around 32,380 BTC worth $2.6 billion flowed into exchanges in a single day, marking the largest daily inflow since April 2026.
This matters because Bitcoin holders often move coins to exchanges when preparing to sell, potentially increasing available supply.
There’s also a historical pattern worth watching: the last comparable spike was followed by a BTC price peak a few weeks later. That doesn’t guarantee another top, but it raises a question about whether holders are preparing to take profits.
The key now is whether these deposits translate into actual selling and whether buyers can absorb the supply.
Big exchange inflows aren’t a sell signal on their own, but they’re worth watching closely.
$BTC
{future}(BTCUSDT)
Around 32,380 BTC worth $2.6 billion flowed into exchanges in a single day, marking the largest daily inflow since April 2026.
This matters because Bitcoin holders often move coins to exchanges when preparing to sell, potentially increasing available supply.
There’s also a historical pattern worth watching: the last comparable spike was followed by a BTC price peak a few weeks later. That doesn’t guarantee another top, but it raises a question about whether holders are preparing to take profits.
The key now is whether these deposits translate into actual selling and whether buyers can absorb the supply.
Big exchange inflows aren’t a sell signal on their own, but they’re worth watching closely.
$BTC
1
72
·
--
$PEPE $IRYS $BONK to the moon!
{spot}(BONKUSDT)
{future}(IRYSUSDT)
{spot}(PEPEUSDT)
$PEPE $IRYS $BONK to the moon!

RISKK TAKER
·
--
The Ultimate Pump is Coming
1
179
·
--
PEPE is pushing higher despite cautious market sentiment, climbing 10.2% in 24 hours and 20.6% over the past week to reclaim a $2.08 billion market cap.
Spot trading volume reached roughly $483 million, showing that traders are actively chasing the move.
What makes this rally interesting is that it’s happening without strong bullish sentiment across the wider market. With the Fear & Greed Index at 47, PEPE appears to be attracting speculative interest even while broader confidence remains mixed.
The next test is whether buying volume can sustain the move or early buyers start taking profits. Meme coins can run hard, but those gains can reverse just as quickly.
Watch volume alongside price, a rally needs continued demand to stay alive.
$PEPE
{spot}(PEPEUSDT)
PEPE is pushing higher despite cautious market sentiment, climbing 10.2% in 24 hours and 20.6% over the past week to reclaim a $2.08 billion market cap.
Spot trading volume reached roughly $483 million, showing that traders are actively chasing the move.
What makes this rally interesting is that it’s happening without strong bullish sentiment across the wider market. With the Fear & Greed Index at 47, PEPE appears to be attracting speculative interest even while broader confidence remains mixed.
The next test is whether buying volume can sustain the move or early buyers start taking profits. Meme coins can run hard, but those gains can reverse just as quickly.
Watch volume alongside price, a rally needs continued demand to stay alive.
$PEPE


3
90
·
--
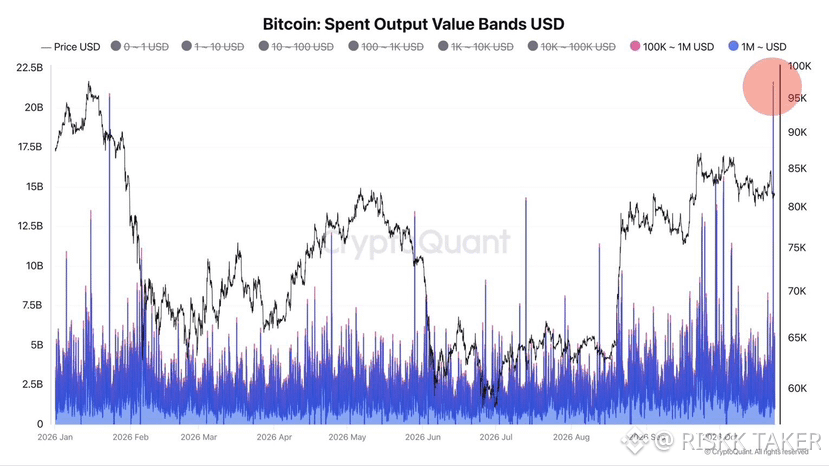
More than 230,000 BTC worth over $21 billion has moved on chain. The activity marks the largest Bitcoin UTXO spending movement recorded so far this year.
But a transfer of this size doesn’t automatically mean a whale is selling.
The analyst believes the coins were likely moved between addresses, with no clear evidence of funds flowing to exchanges. Some of the movement also involved Bitcoin held for months or even years.
For traders, the key question is where these coins go next. If they remain off exchanges, there’s no immediate confirmation of major sell pressure. Exchange inflows and follow up price action will be worth watching.
$PEPE
{spot}(PEPEUSDT)
More than 230,000 BTC worth over $21 billion has moved on chain. The activity marks the largest Bitcoin UTXO spending movement recorded so far this year.
But a transfer of this size doesn’t automatically mean a whale is selling.
The analyst believes the coins were likely moved between addresses, with no clear evidence of funds flowing to exchanges. Some of the movement also involved Bitcoin held for months or even years.
For traders, the key question is where these coins go next. If they remain off exchanges, there’s no immediate confirmation of major sell pressure. Exchange inflows and follow up price action will be worth watching.
$PEPE
1
67
·
--
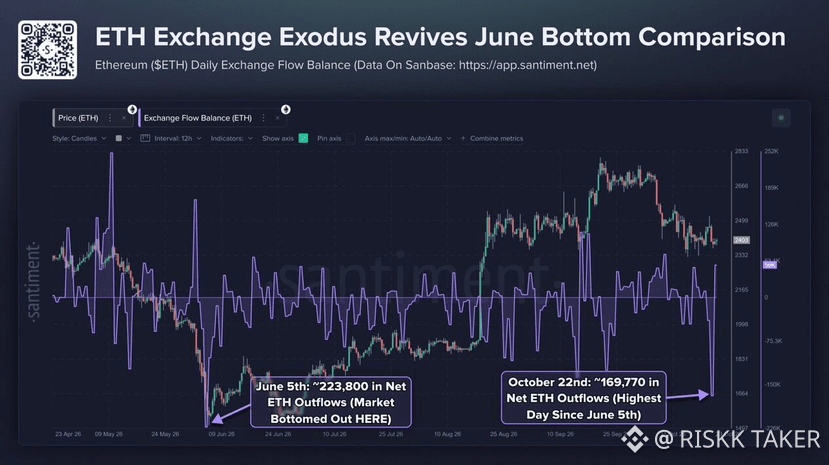
Ethereum recorded roughly 169,770 ETH in net exchange outflows, its largest such move in more than four months, according to Santiment.
Exchange outflows can suggest investors are moving ETH into private wallets or long-term storage instead of keeping it readily available to sell. But it doesn’t automatically mean everyone is accumulating; the reason behind the transfers matters.
Meanwhile, traders are watching the $2,400 level closely. If ETH holds above it, that could help support sentiment. A break below may put buyers under pressure and shift attention to lower support zones.
The key is whether these outflows are followed by sustained buying and price strength. On chain signals matter, but price confirmation still counts.
$ETH
{future}(ETHUSDT)
$IRYS
{future}(IRYSUSDT)
Ethereum recorded roughly 169,770 ETH in net exchange outflows, its largest such move in more than four months, according to Santiment.
Exchange outflows can suggest investors are moving ETH into private wallets or long-term storage instead of keeping it readily available to sell. But it doesn’t automatically mean everyone is accumulating; the reason behind the transfers matters.
Meanwhile, traders are watching the $2,400 level closely. If ETH holds above it, that could help support sentiment. A break below may put buyers under pressure and shift attention to lower support zones.
The key is whether these outflows are followed by sustained buying and price strength. On chain signals matter, but price confirmation still counts.
$ETH
$IRYS
1
648
·
--
Robinhood has received authorization from Dubai’s Financial Services Authority (DFSA) to bring its retail investing platform to the Middle East.
The approval covers trading and custody across multiple asset classes, including cryptocurrencies, stocks, ETFs and investment tokens. Robinhood will establish its regional headquarters at the Dubai International Financial Centre (DIFC), with its platform launch planned for 2027.
This is another step in Robinhood’s international expansion. For crypto, the important part is that users in the region could eventually access digital assets through a familiar mainstream investing platform.
The approval is confirmed
$HOOD
{future}(HOODUSDT)
$BTR
{future}(BTRUSDT)
$DNA
{alpha}(560xa991f61940095aea0724ef54077223b048c5cf7b)
Robinhood has received authorization from Dubai’s Financial Services Authority (DFSA) to bring its retail investing platform to the Middle East.
The approval covers trading and custody across multiple asset classes, including cryptocurrencies, stocks, ETFs and investment tokens. Robinhood will establish its regional headquarters at the Dubai International Financial Centre (DIFC), with its platform launch planned for 2027.
This is another step in Robinhood’s international expansion. For crypto, the important part is that users in the region could eventually access digital assets through a familiar mainstream investing platform.
The approval is confirmed
$HOOD
$BTR
$DNA


1
80
·
--
🔥 CHAINLINK PARTNERS WITH LG CNS TO TARGET KOREA’S $68B DIGITAL ASSET MARKET
Chainlink is teaming up with LG CNS, the technology arm of LG Group, to develop compliant digital asset infrastructure for South Korea.
The collaboration aims to support the infrastructure needed for regulated digital assets, connecting blockchain technology with traditional financial systems.
This matters because institutional adoption requires more than tokenization. Businesses also need reliable data, interoperability between networks and systems that can meet regulatory requirements.
For Chainlink, partnerships like this could expand its role in the infrastructure behind tokenized assets and institutional blockchain applications.
South Korea’s digital asset market is attracting serious infrastructure players. The next phase is about making tokenization work at institutional scale. $LINK
{future}(LINKUSDT)
🔥 CHAINLINK PARTNERS WITH LG CNS TO TARGET KOREA’S $68B DIGITAL ASSET MARKET
Chainlink is teaming up with LG CNS, the technology arm of LG Group, to develop compliant digital asset infrastructure for South Korea.
The collaboration aims to support the infrastructure needed for regulated digital assets, connecting blockchain technology with traditional financial systems.
This matters because institutional adoption requires more than tokenization. Businesses also need reliable data, interoperability between networks and systems that can meet regulatory requirements.
For Chainlink, partnerships like this could expand its role in the infrastructure behind tokenized assets and institutional blockchain applications.
South Korea’s digital asset market is attracting serious infrastructure players. The next phase is about making tokenization work at institutional scale. $LINK


1
99
·
--
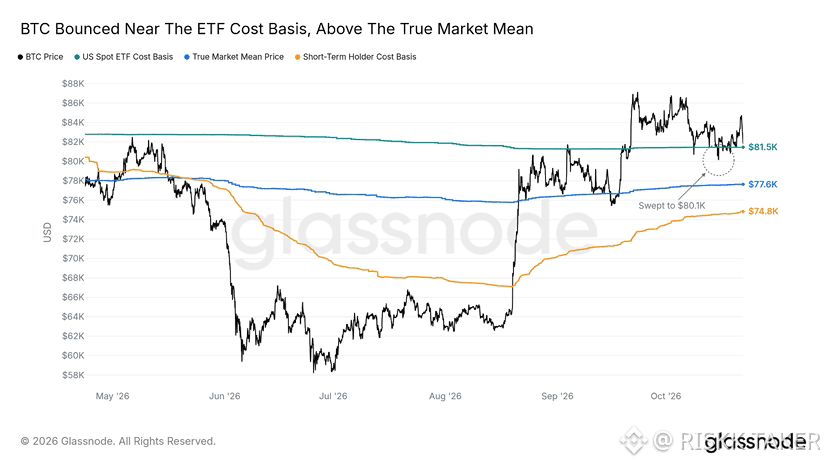
Bitcoin is testing the $81,000 spot ETF cost basis, a level that previously capped the May rally before BTC suffered a deeper correction.
The same zone also came into play during last week’s downside sweep, making it an important level for traders to watch.
A convincing close below $81K could open the door to a move toward the mid $70K range. But if BTC holds and reclaims this level, buyers may prevent another deeper pullback.
BTC is at a critical point.
$BTC
{future}(BTCUSDT)
Bitcoin is testing the $81,000 spot ETF cost basis, a level that previously capped the May rally before BTC suffered a deeper correction.
The same zone also came into play during last week’s downside sweep, making it an important level for traders to watch.
A convincing close below $81K could open the door to a move toward the mid $70K range. But if BTC holds and reclaims this level, buyers may prevent another deeper pullback.
BTC is at a critical point.
$BTC
1
87
·
--
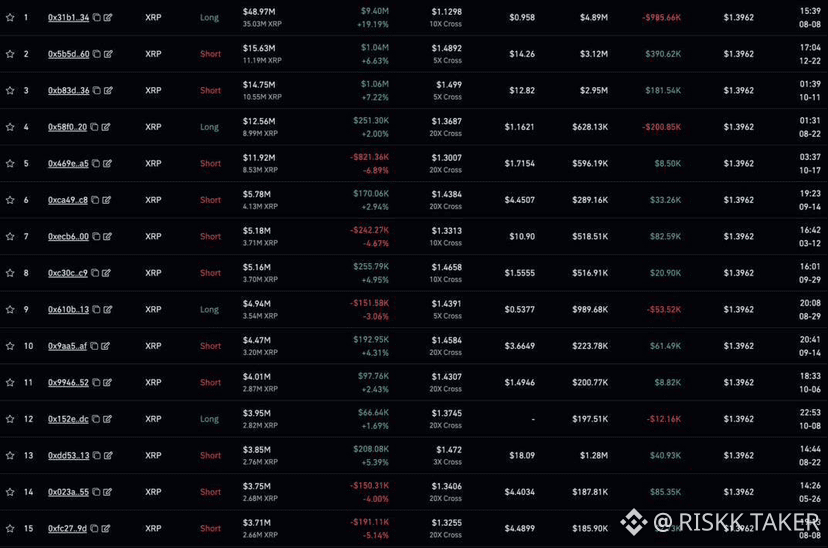
Nearly all top XRP and ENA traders on Hyperliquid are reportedly holding short positions, signaling bearish positioning among a group of active derivatives traders.
When so many traders lean in one direction, a sharp move against them can trigger forced liquidations and accelerate price action in the opposite direction.
However, short positioning alone doesn’t guarantee a price drop. The key is whether selling pressure continues or the market forces bears to cover.
If XRP and ENA start moving higher, could these crowded shorts become fuel for a squeeze?
$XRP
{future}(XRPUSDT)
$ENA
{future}(ENAUSDT)
$TAO
{future}(TAOUSDT)
Nearly all top XRP and ENA traders on Hyperliquid are reportedly holding short positions, signaling bearish positioning among a group of active derivatives traders.
When so many traders lean in one direction, a sharp move against them can trigger forced liquidations and accelerate price action in the opposite direction.
However, short positioning alone doesn’t guarantee a price drop. The key is whether selling pressure continues or the market forces bears to cover.
If XRP and ENA start moving higher, could these crowded shorts become fuel for a squeeze?
$XRP
$ENA
$TAO
2
3
·
--
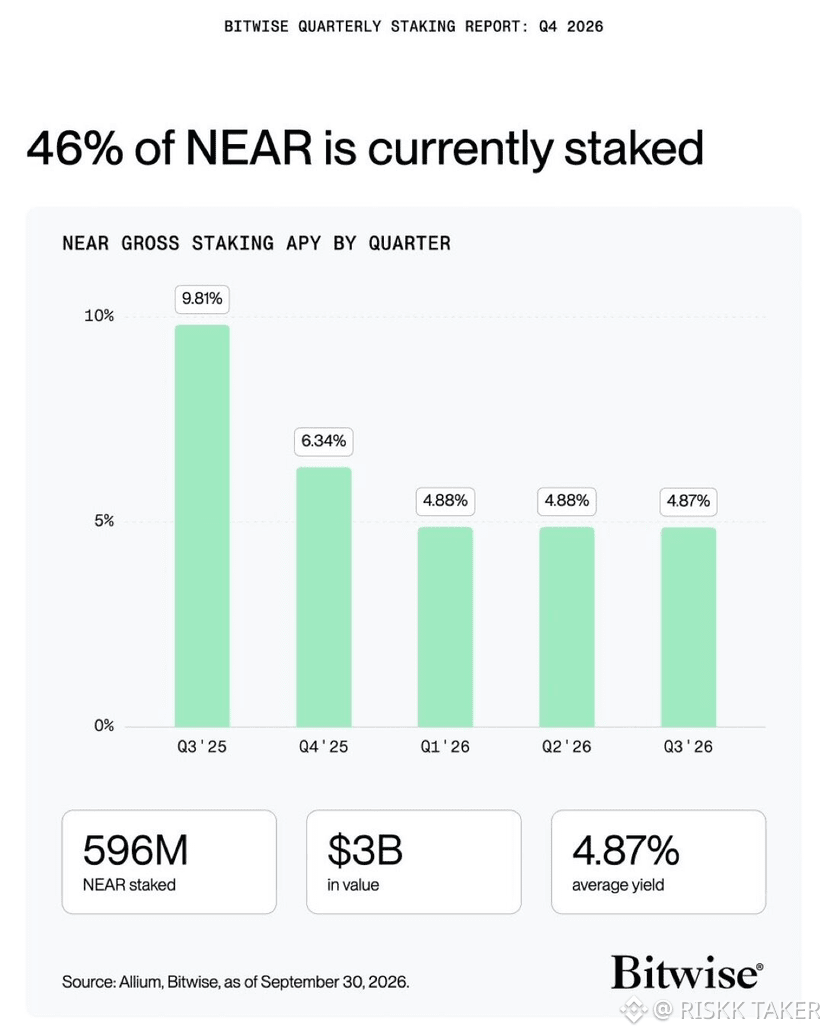
NEAR Protocol has maintained a staking ratio of around 46%, with approximately 596 million NEAR worth $3 billion staked and an average yield of 4.87%, according to figures reported by Bitwise.
The notable part is that staking participation has remained strong despite the reduction in token issuance.
A stable staking ratio means a substantial share of NEAR’s supply remains committed to securing the network rather than immediately circulating in the market.
The key question is whether NEAR can maintain this participation as its token economics continue to evolve.
$NEAR
{future}(NEARUSDT)
NEAR Protocol has maintained a staking ratio of around 46%, with approximately 596 million NEAR worth $3 billion staked and an average yield of 4.87%, according to figures reported by Bitwise.
The notable part is that staking participation has remained strong despite the reduction in token issuance.
A stable staking ratio means a substantial share of NEAR’s supply remains committed to securing the network rather than immediately circulating in the market.
The key question is whether NEAR can maintain this participation as its token economics continue to evolve.
$NEAR

2
107
·
--
CRYPTO OPEN INTEREST RISES AS PRICES RECOVER
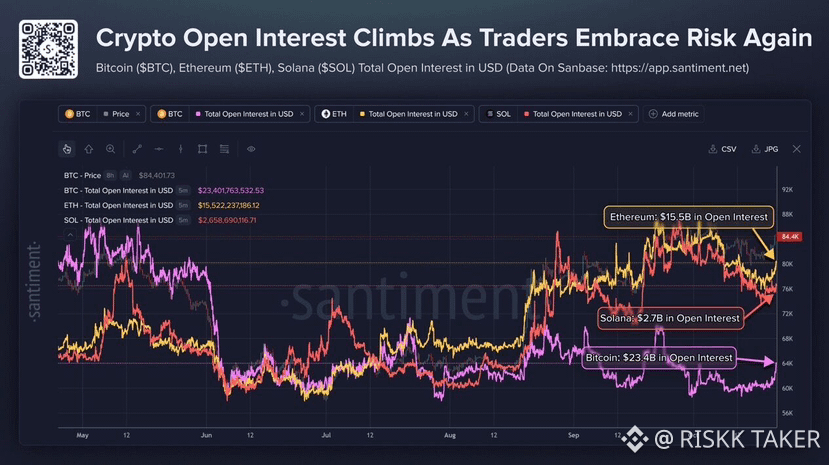
Crypto derivatives activity is picking up, with open interest reaching $23.4B for BTC, $15.5B for ETH and $2.7B for SOL, according to Santiment data.
Rising open interest alongside recovering prices suggests traders are opening more positions and leverage may be building across the market.
That can support further momentum if buyers remain in control, but it also increases the risk of sharp liquidations if prices reverse.
The key now is whether fresh positioning fuels the recovery or leaves the market vulnerable to another leverage flush.
$BTC
{future}(BTCUSDT)
$SOL
{future}(SOLUSDT)
$ETH
{future}(ETHUSDT)
CRYPTO OPEN INTEREST RISES AS PRICES RECOVER
Crypto derivatives activity is picking up, with open interest reaching $23.4B for BTC, $15.5B for ETH and $2.7B for SOL, according to Santiment data.
Rising open interest alongside recovering prices suggests traders are opening more positions and leverage may be building across the market.
That can support further momentum if buyers remain in control, but it also increases the risk of sharp liquidations if prices reverse.
The key now is whether fresh positioning fuels the recovery or leaves the market vulnerable to another leverage flush.
$BTC
$SOL
$ETH
2
104
Войдите, чтобы посмотреть больше материала
Присоединяйтесь к пользователям криптовалют по всему миру на Binance Square
⚡️ Получайте новейшую и полезную информацию о криптоактивах.
💬 Нам доверяет крупнейшая в мире криптобиржа.
👍 Получите достоверные аналитические данные от верифицированных создателей контента.
Эл. почта/номер телефона