
PolinaK13
44 Публикации

PolinaK13
Отправить жалобу
Заблокировать пользователя
10 подписок(и/а)
29 подписчиков(а)
44 понравилось
Посты
Все
Цитирования
·
--
Не кожна можливість на ринку — це угода. Чому?
На графіку може з’явитися ситуація, яка виглядає дуже привабливо:
ціна сильно рухається → є потенціал заробити → хочеться зайти в позицію.
Але сама можливість ще не означає, що угоду варто відкривати.
Наприклад, ти очікуєш рух акції на 5%, але для цього доведеться відкрити занадто велику позицію.
Або потенційний прибуток виглядає привабливо, але можливий збиток у разі помилки значно більший.
Ще один сценарій — ти бачиш хороший рівень для входу, але ліквідність низька, тому виконання великої позиції може відбутися за менш вигідною ціною.
Тому перед угодою варто дивитися не тільки на:
«Скільки я можу заробити?»
а й на:
скільки можу втратити;
який розмір позиції потрібен;
наскільки ліквідний ринок;
чи відповідає ця угода моєму рівню ризику.
Іноді найкраще рішення — побачити можливість, але не перетворювати її на позицію.
Бо можливість на графіку — це ще не готова угода.
#Trading #RiskManagement
Не кожна можливість на ринку — це угода. Чому?
На графіку може з’явитися ситуація, яка виглядає дуже привабливо:
ціна сильно рухається → є потенціал заробити → хочеться зайти в позицію.
Але сама можливість ще не означає, що угоду варто відкривати.
Наприклад, ти очікуєш рух акції на 5%, але для цього доведеться відкрити занадто велику позицію.
Або потенційний прибуток виглядає привабливо, але можливий збиток у разі помилки значно більший.
Ще один сценарій — ти бачиш хороший рівень для входу, але ліквідність низька, тому виконання великої позиції може відбутися за менш вигідною ціною.
Тому перед угодою варто дивитися не тільки на:
«Скільки я можу заробити?»
а й на:
скільки можу втратити;
який розмір позиції потрібен;
наскільки ліквідний ринок;
чи відповідає ця угода моєму рівню ризику.
Іноді найкраще рішення — побачити можливість, але не перетворювати її на позицію.
Бо можливість на графіку — це ще не готова угода.
#Trading #RiskManagement
На графіку може з’явитися ситуація, яка виглядає дуже привабливо:
ціна сильно рухається → є потенціал заробити → хочеться зайти в позицію.
Але сама можливість ще не означає, що угоду варто відкривати.
Наприклад, ти очікуєш рух акції на 5%, але для цього доведеться відкрити занадто велику позицію.
Або потенційний прибуток виглядає привабливо, але можливий збиток у разі помилки значно більший.
Ще один сценарій — ти бачиш хороший рівень для входу, але ліквідність низька, тому виконання великої позиції може відбутися за менш вигідною ціною.
Тому перед угодою варто дивитися не тільки на:
«Скільки я можу заробити?»
а й на:
скільки можу втратити;
який розмір позиції потрібен;
наскільки ліквідний ринок;
чи відповідає ця угода моєму рівню ризику.
Іноді найкраще рішення — побачити можливість, але не перетворювати її на позицію.
Бо можливість на графіку — це ще не готова угода.
#Trading #RiskManagement

171
·
--
Позиція маленька. Чому ризик все одно може бути великим?
На перший погляд:
«Я відкрив позицію лише на $100. Це ж небагато».
Але сама сума позиції ще не показує реальний ризик.
Уявімо два рахунки:
$100 позиція на рахунку $10 000
→ це лише 1% капіталу.
$100 позиція на рахунку $200
→ це вже 50% капіталу.
Однакова позиція — але зовсім різний вплив на рахунок.
Є ще один нюанс — плече.
Позиція на $100 може бути відкритою з використанням $20 власного капіталу та плеча. Тоді навіть відносно невеликий рух ціни матиме набагато більший вплив саме на використану маржу.
Тому питання:
«Наскільки велика моя позиція?»
не завжди достатнє.
Важливіше дивитися на:
розмір позиції відносно всього капіталу;
рівень плеча;
скільки можна втратити при русі ціни проти тебе;
умови самого інструменту.
Маленька позиція в доларах не завжди означає маленький ризик для твого рахунку.
Ризик потрібно оцінювати відносно капіталу, а не просто дивитися на цифру позиції.
#Trading #RiskManagement
Позиція маленька. Чому ризик все одно може бути великим?
На перший погляд:
«Я відкрив позицію лише на $100. Це ж небагато».
Але сама сума позиції ще не показує реальний ризик.
Уявімо два рахунки:
$100 позиція на рахунку $10 000
→ це лише 1% капіталу.
$100 позиція на рахунку $200
→ це вже 50% капіталу.
Однакова позиція — але зовсім різний вплив на рахунок.
Є ще один нюанс — плече.
Позиція на $100 може бути відкритою з використанням $20 власного капіталу та плеча. Тоді навіть відносно невеликий рух ціни матиме набагато більший вплив саме на використану маржу.
Тому питання:
«Наскільки велика моя позиція?»
не завжди достатнє.
Важливіше дивитися на:
розмір позиції відносно всього капіталу;
рівень плеча;
скільки можна втратити при русі ціни проти тебе;
умови самого інструменту.
Маленька позиція в доларах не завжди означає маленький ризик для твого рахунку.
Ризик потрібно оцінювати відносно капіталу, а не просто дивитися на цифру позиції.
#Trading #RiskManagement
На перший погляд:
«Я відкрив позицію лише на $100. Це ж небагато».
Але сама сума позиції ще не показує реальний ризик.
Уявімо два рахунки:
$100 позиція на рахунку $10 000
→ це лише 1% капіталу.
$100 позиція на рахунку $200
→ це вже 50% капіталу.
Однакова позиція — але зовсім різний вплив на рахунок.
Є ще один нюанс — плече.
Позиція на $100 може бути відкритою з використанням $20 власного капіталу та плеча. Тоді навіть відносно невеликий рух ціни матиме набагато більший вплив саме на використану маржу.
Тому питання:
«Наскільки велика моя позиція?»
не завжди достатнє.
Важливіше дивитися на:
розмір позиції відносно всього капіталу;
рівень плеча;
скільки можна втратити при русі ціни проти тебе;
умови самого інструменту.
Маленька позиція в доларах не завжди означає маленький ризик для твого рахунку.
Ризик потрібно оцінювати відносно капіталу, а не просто дивитися на цифру позиції.
#Trading #RiskManagement

363
·
--
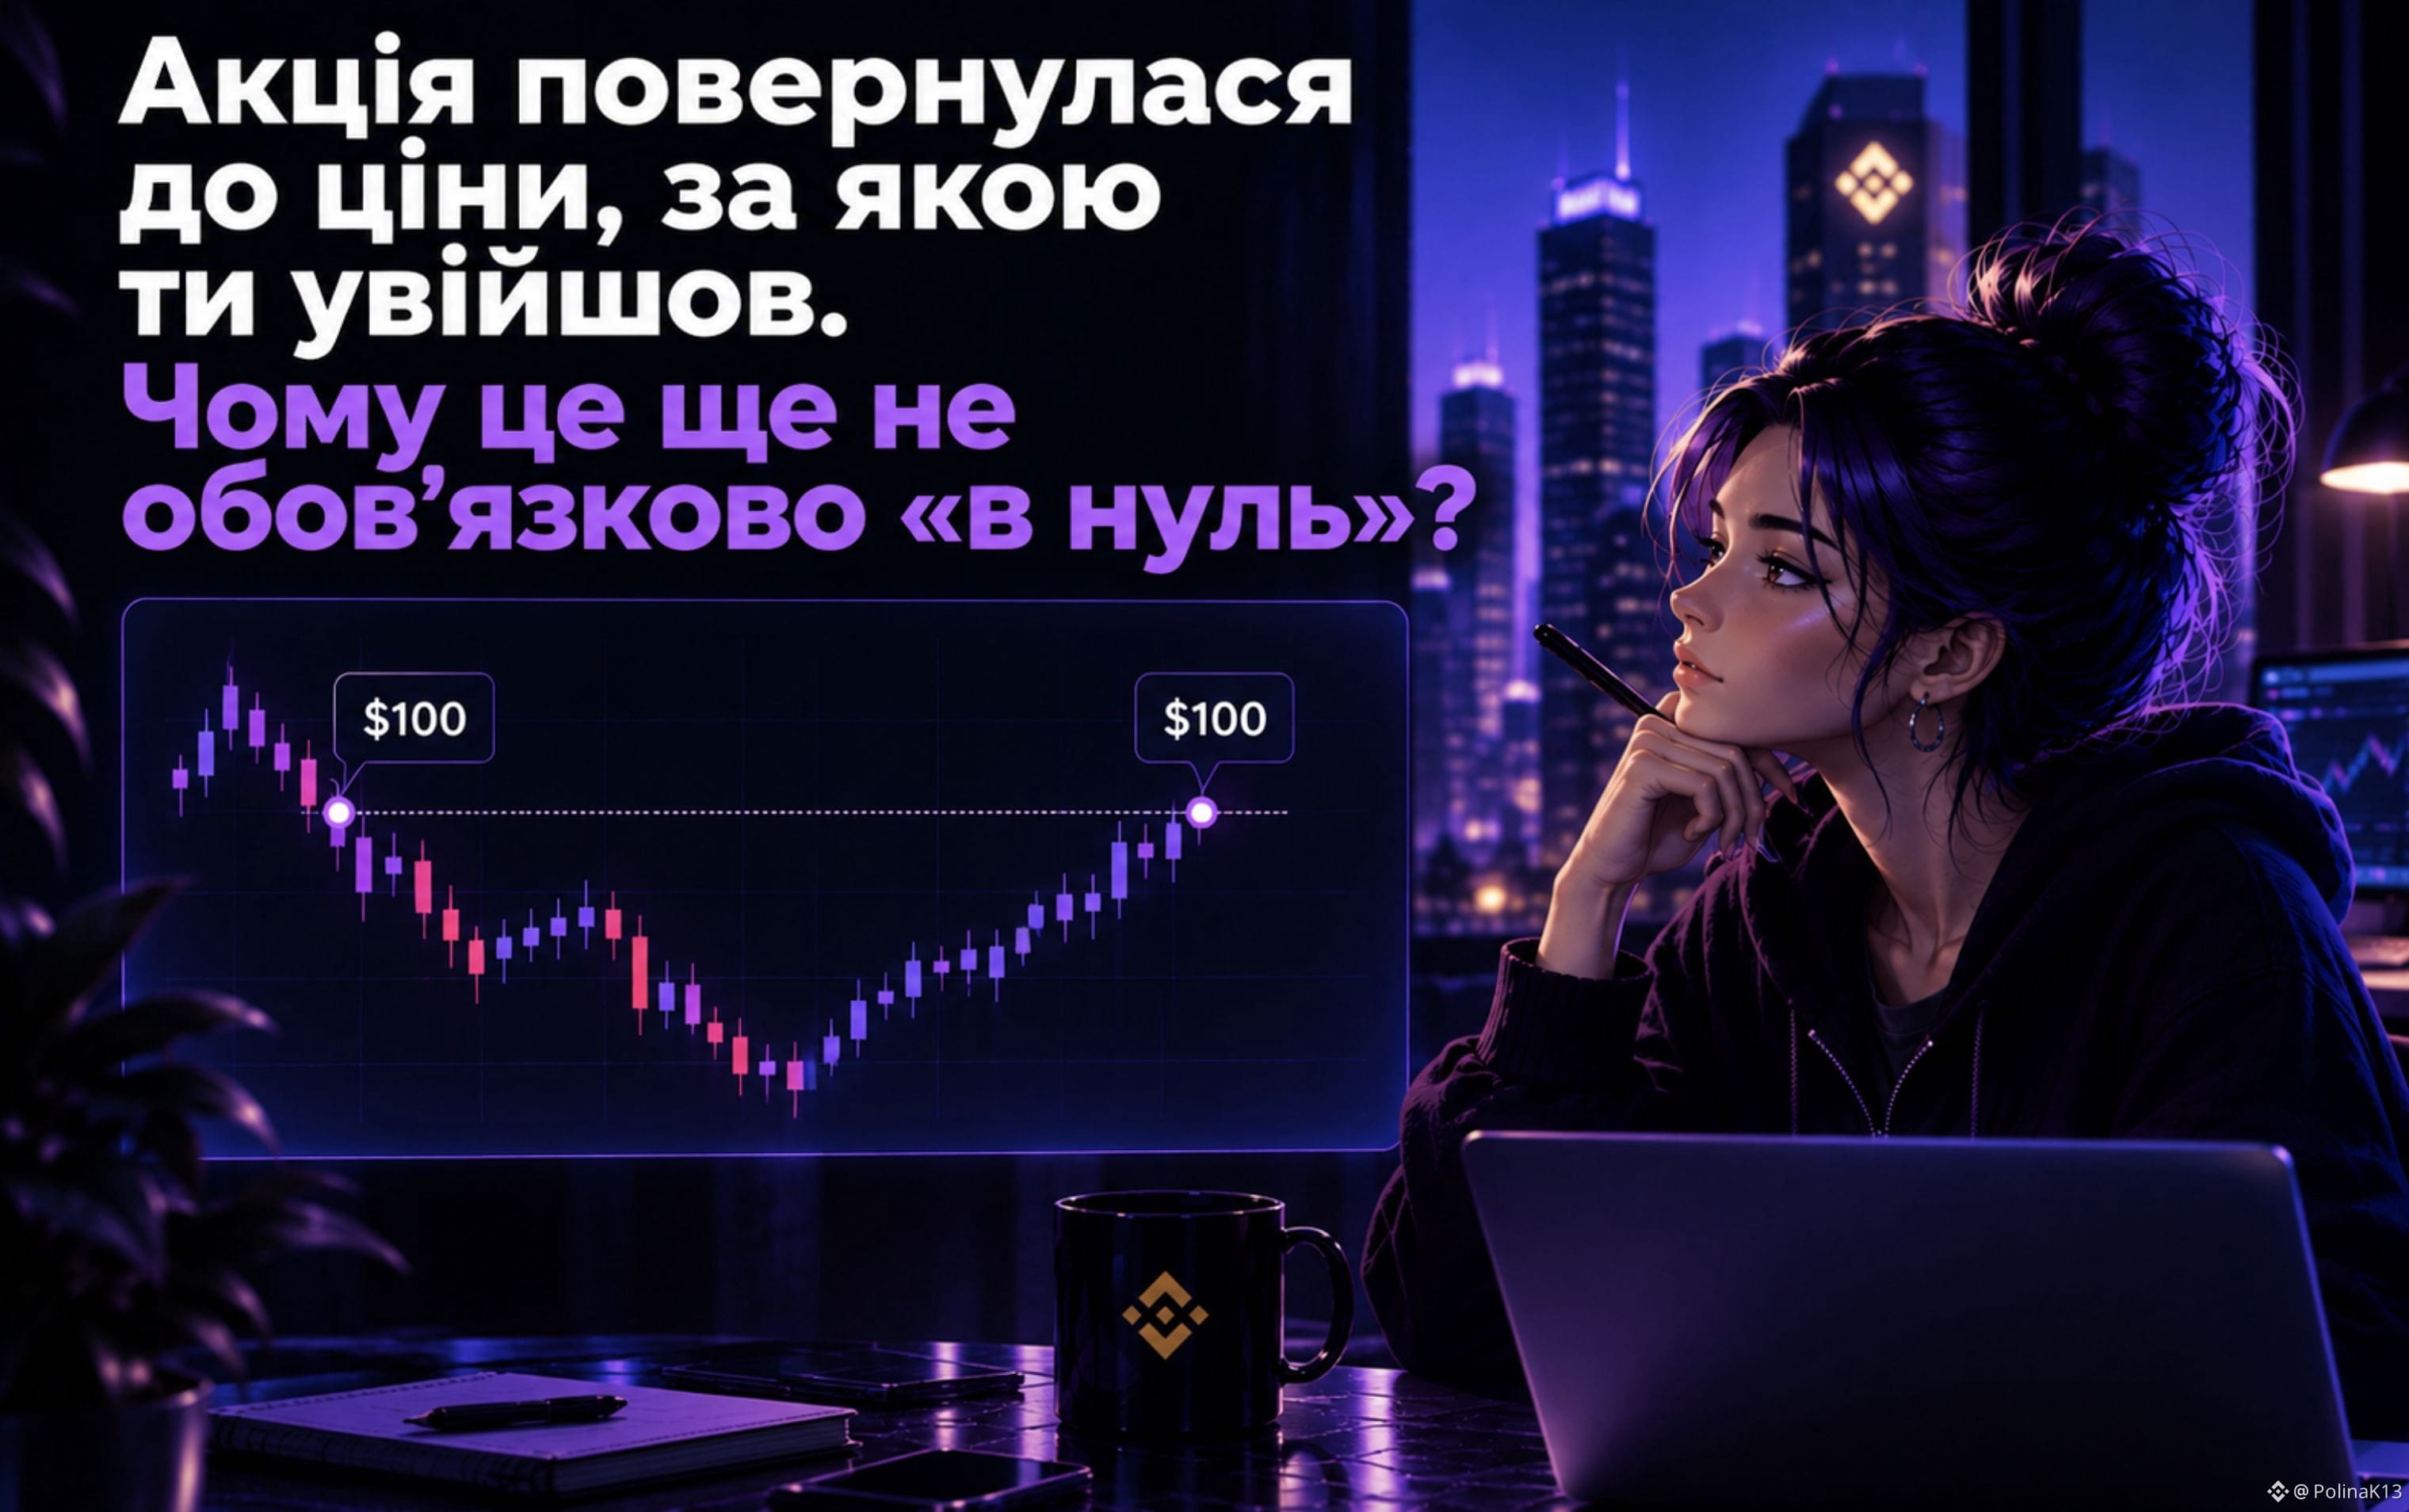
Акція повернулася до ціни, за якою ти увійшов. Чому це ще не обов’язково «в нуль»?
Уявімо:
Ти відкрив позицію, коли акція коштувала $100.
Спочатку вона впала до $95, а потім повернулася до $100.
Здається:
«Ціна повернулася → я знову в нулі».
Але не зовсім.
На результат угоди можуть впливати витрати, пов’язані з позицією.
Наприклад:
комісія за відкриття та закриття;
funding, якщо це perpetual;
різниця між ціною, яку ти бачиш на графіку, і фактичною ціною виконання.
Тому навіть якщо базовий актив повернувся до твоєї ціни входу, фактичний результат позиції може залишатися негативним.
І тут важлива різниця:
Ціна повернулася до точки входу ≠ угода автоматично закривається в нуль.
Графік показує рух ціни.
А твій реальний P&L залежить ще й від того, яким інструментом ти торгуєш і які витрати виникли під час угоди.
Тому дивитися лише на:
«Я зайшов по $100, зараз знову $100»
— недостатньо.
Іноді ціна повернулася в нуль, а твоя позиція — ще ні.
#Trading #RiskManagement
Акція повернулася до ціни, за якою ти увійшов. Чому це ще не обов’язково «в нуль»?
Уявімо:
Ти відкрив позицію, коли акція коштувала $100.
Спочатку вона впала до $95, а потім повернулася до $100.
Здається:
«Ціна повернулася → я знову в нулі».
Але не зовсім.
На результат угоди можуть впливати витрати, пов’язані з позицією.
Наприклад:
комісія за відкриття та закриття;
funding, якщо це perpetual;
різниця між ціною, яку ти бачиш на графіку, і фактичною ціною виконання.
Тому навіть якщо базовий актив повернувся до твоєї ціни входу, фактичний результат позиції може залишатися негативним.
І тут важлива різниця:
Ціна повернулася до точки входу ≠ угода автоматично закривається в нуль.
Графік показує рух ціни.
А твій реальний P&L залежить ще й від того, яким інструментом ти торгуєш і які витрати виникли під час угоди.
Тому дивитися лише на:
«Я зайшов по $100, зараз знову $100»
— недостатньо.
Іноді ціна повернулася в нуль, а твоя позиція — ще ні.
#Trading #RiskManagement
Уявімо:
Ти відкрив позицію, коли акція коштувала $100.
Спочатку вона впала до $95, а потім повернулася до $100.
Здається:
«Ціна повернулася → я знову в нулі».
Але не зовсім.
На результат угоди можуть впливати витрати, пов’язані з позицією.
Наприклад:
комісія за відкриття та закриття;
funding, якщо це perpetual;
різниця між ціною, яку ти бачиш на графіку, і фактичною ціною виконання.
Тому навіть якщо базовий актив повернувся до твоєї ціни входу, фактичний результат позиції може залишатися негативним.
І тут важлива різниця:
Ціна повернулася до точки входу ≠ угода автоматично закривається в нуль.
Графік показує рух ціни.
А твій реальний P&L залежить ще й від того, яким інструментом ти торгуєш і які витрати виникли під час угоди.
Тому дивитися лише на:
«Я зайшов по $100, зараз знову $100»
— недостатньо.
Іноді ціна повернулася в нуль, а твоя позиція — ще ні.
#Trading #RiskManagement
106
·
--
Ти заробив на першій угоді. Чому друга може все змінити?
Уявімо:
Ти відкрив угоду на $1 000 і заробив $100.
На рахунку вже $1 100.
Здається логічним:
«Раз вийшло один раз — можна повторити».
І тут часто змінюється головне — розмір ризику.
Після прибуткової угоди трейдер може збільшити позицію, використати більше плеча або просто почати ризикувати сильніше.
Наприклад:
1-ша угода: +$100
2-га угода: −$200
У підсумку:
+$100 − $200 = −$100
Тобто одна збиткова угода не просто забрала прибуток від першої — вона перевела весь результат у мінус.
Тому проблема не в тому, що друга угода обов'язково буде невдалою.
Проблема виникає тоді, коли після успіху змінюється рівень ризику.
Прибуткова угода не робить наступну угоду безпечнішою.
Ринок не знає, що ти щойно заробив.
Тому після плюса важливо оцінювати наступну позицію так само, як і першу:
яким буде збиток, якщо цього разу я помилюся?
#Trading #RiskManagement
Ти заробив на першій угоді. Чому друга може все змінити?
Уявімо:
Ти відкрив угоду на $1 000 і заробив $100.
На рахунку вже $1 100.
Здається логічним:
«Раз вийшло один раз — можна повторити».
І тут часто змінюється головне — розмір ризику.
Після прибуткової угоди трейдер може збільшити позицію, використати більше плеча або просто почати ризикувати сильніше.
Наприклад:
1-ша угода: +$100
2-га угода: −$200
У підсумку:
+$100 − $200 = −$100
Тобто одна збиткова угода не просто забрала прибуток від першої — вона перевела весь результат у мінус.
Тому проблема не в тому, що друга угода обов'язково буде невдалою.
Проблема виникає тоді, коли після успіху змінюється рівень ризику.
Прибуткова угода не робить наступну угоду безпечнішою.
Ринок не знає, що ти щойно заробив.
Тому після плюса важливо оцінювати наступну позицію так само, як і першу:
яким буде збиток, якщо цього разу я помилюся?
#Trading #RiskManagement
Уявімо:
Ти відкрив угоду на $1 000 і заробив $100.
На рахунку вже $1 100.
Здається логічним:
«Раз вийшло один раз — можна повторити».
І тут часто змінюється головне — розмір ризику.
Після прибуткової угоди трейдер може збільшити позицію, використати більше плеча або просто почати ризикувати сильніше.
Наприклад:
1-ша угода: +$100
2-га угода: −$200
У підсумку:
+$100 − $200 = −$100
Тобто одна збиткова угода не просто забрала прибуток від першої — вона перевела весь результат у мінус.
Тому проблема не в тому, що друга угода обов'язково буде невдалою.
Проблема виникає тоді, коли після успіху змінюється рівень ризику.
Прибуткова угода не робить наступну угоду безпечнішою.
Ринок не знає, що ти щойно заробив.
Тому після плюса важливо оцінювати наступну позицію так само, як і першу:
яким буде збиток, якщо цього разу я помилюся?
#Trading #RiskManagement

3
1.7k
·
--
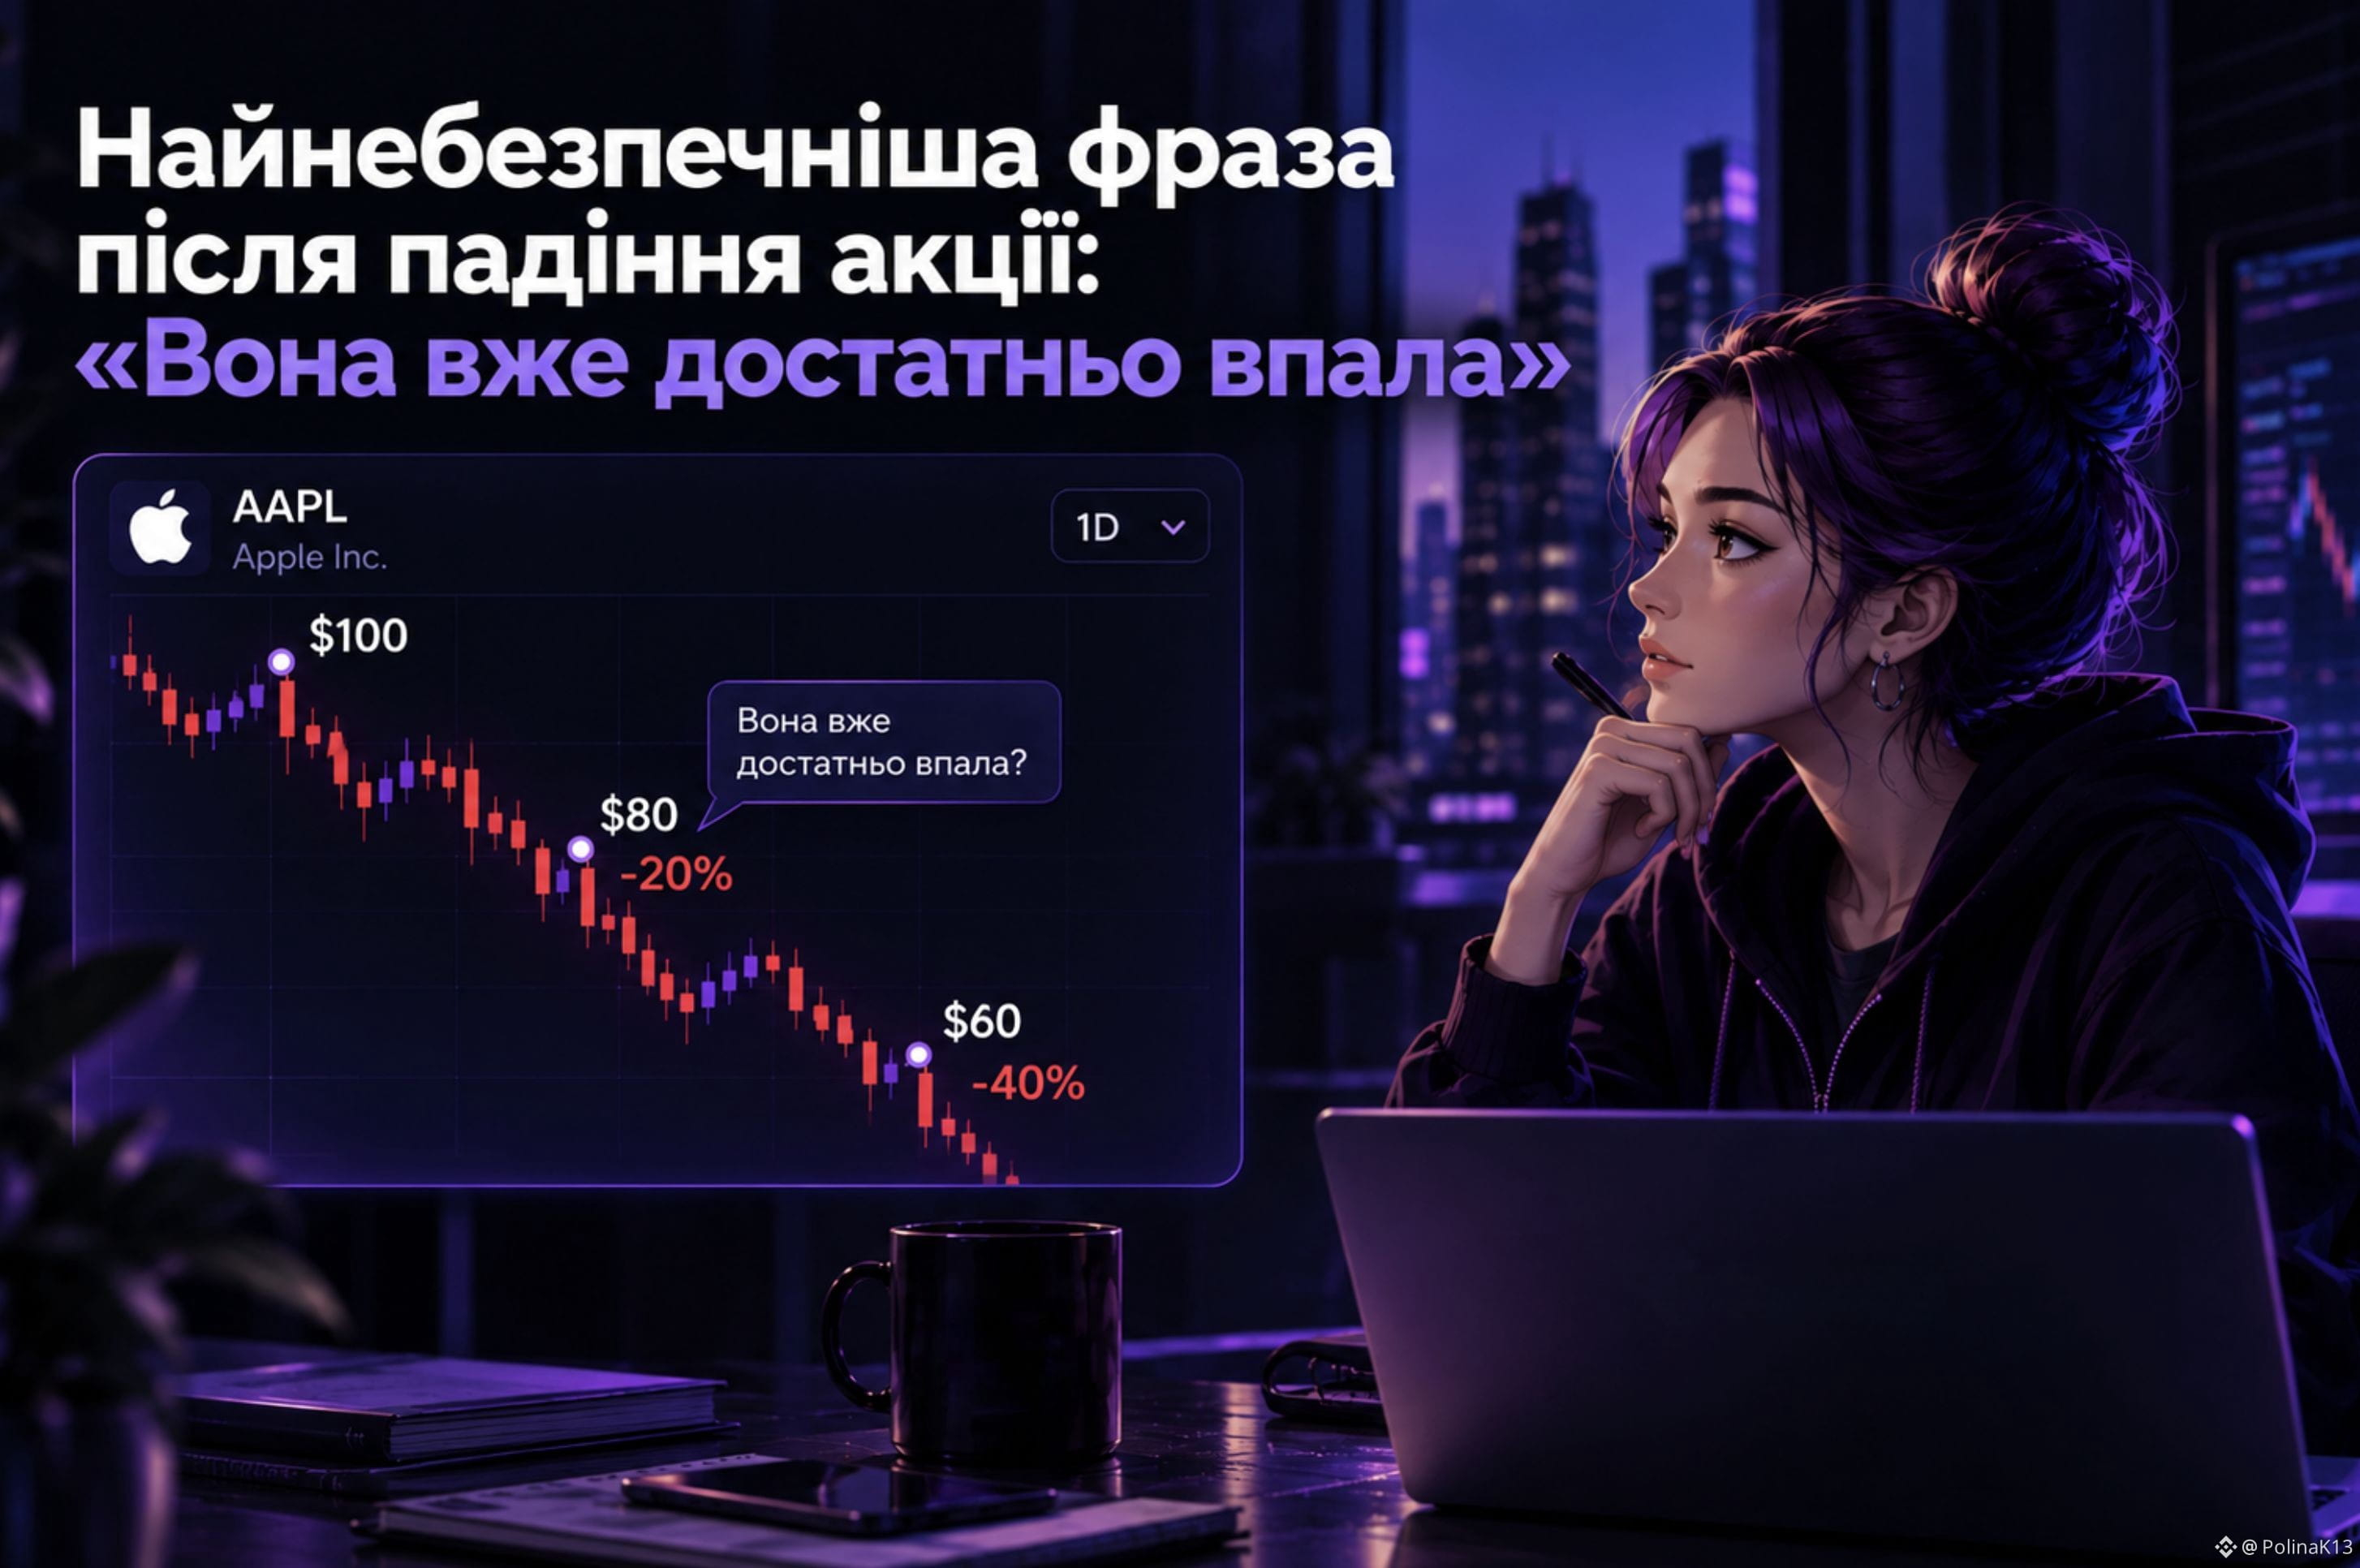
Найнебезпечніша фраза після падіння акції: «Вона вже достатньо впала»
Акція впала на 20%.
Перша думка:
«Ну куди їй ще падати?»
Але ринок не знає, де для тебе знаходиться «достатньо низько».
Акція може впасти ще на 10%, 20% або навіть 50%.
Наприклад:
$100 → $80 → $60
На $80 може здаватися, що акція вже дешева.
Але після падіння до $60 виникає питання:
чому $80 взагалі здавалося дном?
Тому замість:
❌ «Наскільки вона вже впала?»
краще запитати:
✅ «Чому вона падає?»
Чи змінилися перспективи компанії?
Чи це реакція ринку?
Чи є причини очікувати відновлення?
Падіння саме по собі не робить актив дешевим.
А в TradFi Perpetual це ще важливіше: можливість відкрити коротку позицію не означає, що будь-яке падіння автоматично є можливістю для заробітку.
«Вона вже достатньо впала» — це не аналіз.
Це лише припущення, що далі буде краще.
#TradFi
Найнебезпечніша фраза після падіння акції: «Вона вже достатньо впала»
Акція впала на 20%.
Перша думка:
«Ну куди їй ще падати?»
Але ринок не знає, де для тебе знаходиться «достатньо низько».
Акція може впасти ще на 10%, 20% або навіть 50%.
Наприклад:
$100 → $80 → $60
На $80 може здаватися, що акція вже дешева.
Але після падіння до $60 виникає питання:
чому $80 взагалі здавалося дном?
Тому замість:
❌ «Наскільки вона вже впала?»
краще запитати:
✅ «Чому вона падає?»
Чи змінилися перспективи компанії?
Чи це реакція ринку?
Чи є причини очікувати відновлення?
Падіння саме по собі не робить актив дешевим.
А в TradFi Perpetual це ще важливіше: можливість відкрити коротку позицію не означає, що будь-яке падіння автоматично є можливістю для заробітку.
«Вона вже достатньо впала» — це не аналіз.
Це лише припущення, що далі буде краще.
#TradFi
Акція впала на 20%.
Перша думка:
«Ну куди їй ще падати?»
Але ринок не знає, де для тебе знаходиться «достатньо низько».
Акція може впасти ще на 10%, 20% або навіть 50%.
Наприклад:
$100 → $80 → $60
На $80 може здаватися, що акція вже дешева.
Але після падіння до $60 виникає питання:
чому $80 взагалі здавалося дном?
Тому замість:
❌ «Наскільки вона вже впала?»
краще запитати:
✅ «Чому вона падає?»
Чи змінилися перспективи компанії?
Чи це реакція ринку?
Чи є причини очікувати відновлення?
Падіння саме по собі не робить актив дешевим.
А в TradFi Perpetual це ще важливіше: можливість відкрити коротку позицію не означає, що будь-яке падіння автоматично є можливістю для заробітку.
«Вона вже достатньо впала» — це не аналіз.
Це лише припущення, що далі буде краще.
#TradFi
615
·
--
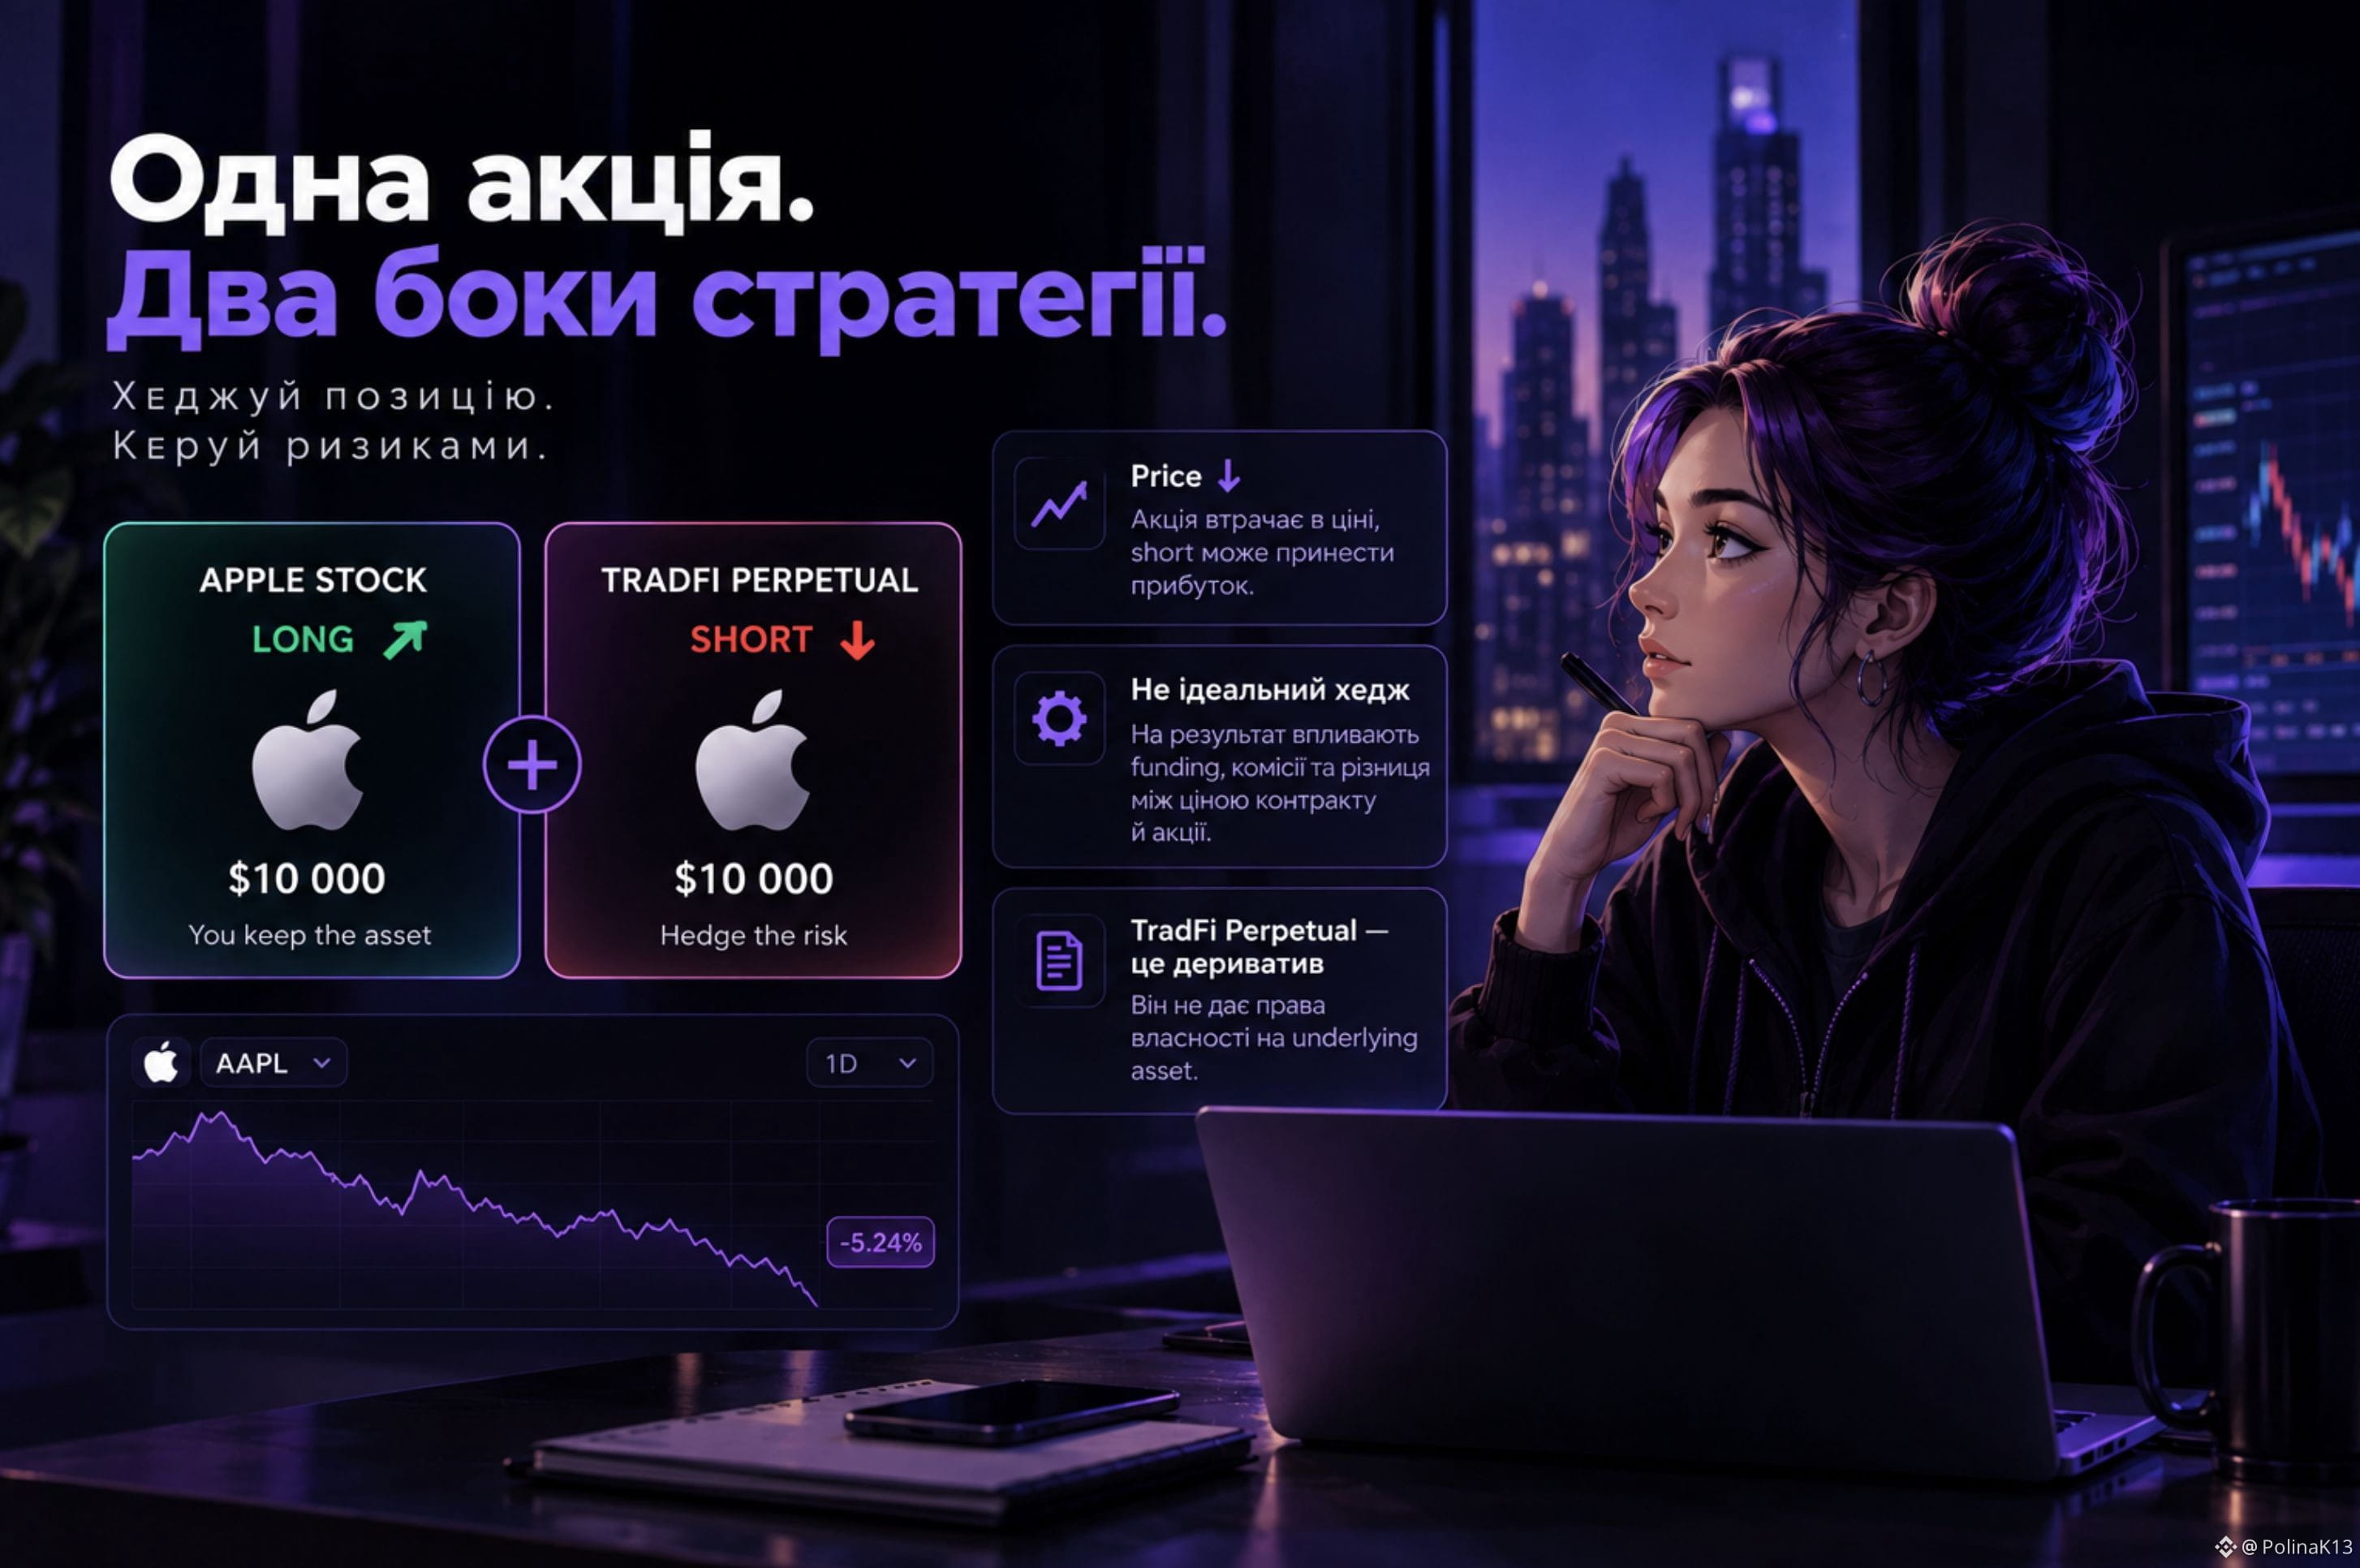
Чи можна захеджувати акцію через TradFi Perpetual, не продаючи саму акцію?
Уявімо ситуацію: у мене є акція на $10 000, але я очікую короткострокове падіння.
Продавати її не хочу, бо планую залишатися в позиції довше.
Тоді виникає ідея відкрити short TradFi Perpetual на той самий underlying.
Якщо ціна акції падає, її вартість зменшується, а short-позиція потенційно приносить прибуток.
На перший погляд усе просто:
акція → long
perpetual → short
Але тут є важливий нюанс.
TradFi Perpetual — це дериватив, а не сама акція. Він не дає права власності на underlying asset.
Тому short не є ідеальною копією моєї позиції в акції.
На результат можуть впливати funding, комісії, розмір позиції та різниця між ціною контракту й акції.
Наприклад, якщо акція впала на 5%, це не означає, що short TradFi Perpetual автоматично принесе рівно 5% прибутку.
Саме тому хедж — це не просто протилежна позиція.
Потрібно дивитися, наскільки точно дериватив повторює рух underlying і скільки коштує утримання самого хеджа.
Для мене це цікавий приклад того, що TradFi Perpetual можна розглядати не лише як інструмент для спекуляції.
У певних ситуаціях він може допомогти тимчасово зменшити ризик уже існуючої позиції, не продаючи сам актив.
#TradFi
Чи можна захеджувати акцію через TradFi Perpetual, не продаючи саму акцію?
Уявімо ситуацію: у мене є акція на $10 000, але я очікую короткострокове падіння.
Продавати її не хочу, бо планую залишатися в позиції довше.
Тоді виникає ідея відкрити short TradFi Perpetual на той самий underlying.
Якщо ціна акції падає, її вартість зменшується, а short-позиція потенційно приносить прибуток.
На перший погляд усе просто:
акція → long
perpetual → short
Але тут є важливий нюанс.
TradFi Perpetual — це дериватив, а не сама акція. Він не дає права власності на underlying asset.
Тому short не є ідеальною копією моєї позиції в акції.
На результат можуть впливати funding, комісії, розмір позиції та різниця між ціною контракту й акції.
Наприклад, якщо акція впала на 5%, це не означає, що short TradFi Perpetual автоматично принесе рівно 5% прибутку.
Саме тому хедж — це не просто протилежна позиція.
Потрібно дивитися, наскільки точно дериватив повторює рух underlying і скільки коштує утримання самого хеджа.
Для мене це цікавий приклад того, що TradFi Perpetual можна розглядати не лише як інструмент для спекуляції.
У певних ситуаціях він може допомогти тимчасово зменшити ризик уже існуючої позиції, не продаючи сам актив.
#TradFi
Уявімо ситуацію: у мене є акція на $10 000, але я очікую короткострокове падіння.
Продавати її не хочу, бо планую залишатися в позиції довше.
Тоді виникає ідея відкрити short TradFi Perpetual на той самий underlying.
Якщо ціна акції падає, її вартість зменшується, а short-позиція потенційно приносить прибуток.
На перший погляд усе просто:
акція → long
perpetual → short
Але тут є важливий нюанс.
TradFi Perpetual — це дериватив, а не сама акція. Він не дає права власності на underlying asset.
Тому short не є ідеальною копією моєї позиції в акції.
На результат можуть впливати funding, комісії, розмір позиції та різниця між ціною контракту й акції.
Наприклад, якщо акція впала на 5%, це не означає, що short TradFi Perpetual автоматично принесе рівно 5% прибутку.
Саме тому хедж — це не просто протилежна позиція.
Потрібно дивитися, наскільки точно дериватив повторює рух underlying і скільки коштує утримання самого хеджа.
Для мене це цікавий приклад того, що TradFi Perpetual можна розглядати не лише як інструмент для спекуляції.
У певних ситуаціях він може допомогти тимчасово зменшити ризик уже існуючої позиції, не продаючи сам актив.
#TradFi
194
·
--
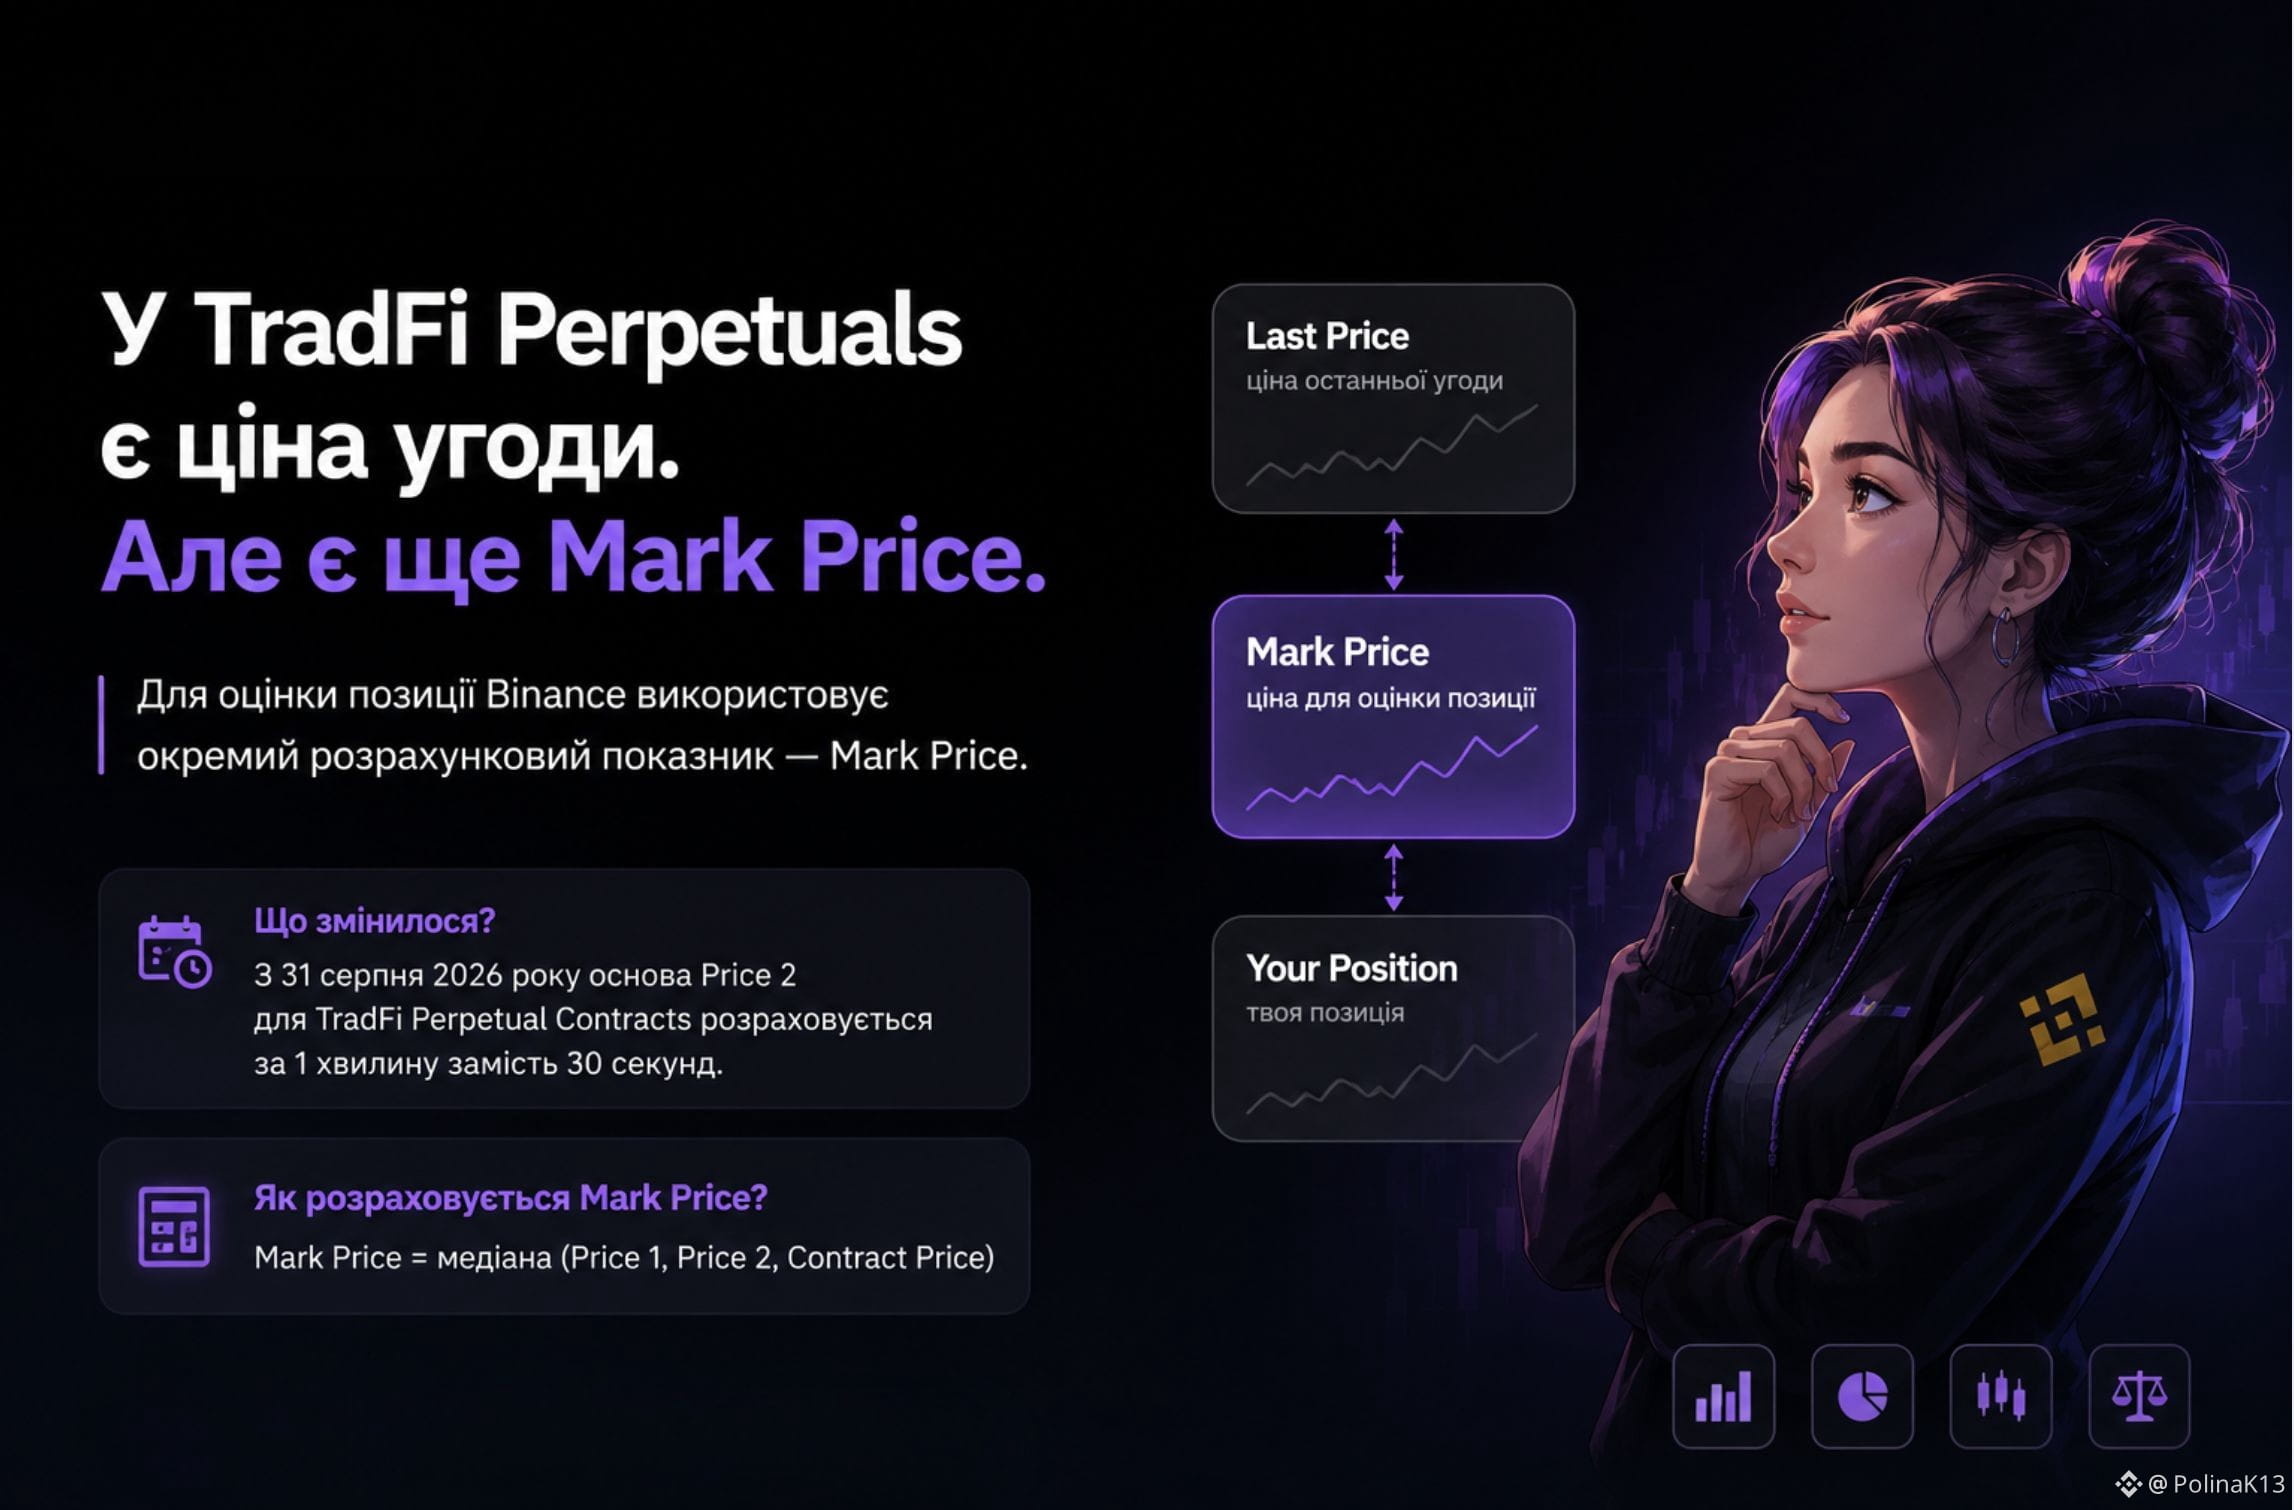
У TradFi Perpetuals є ціна угоди. Але для розрахунку Mark Price Binance використовує не лише її.
На перший погляд здається логічним: якщо контракт торгується за певною ціною, саме її біржа й має використовувати.
Але у perpetual-контрактів механіка складніша.
Binance розраховує Mark Price через медіану трьох значень: Price 1, Price 2 та Contract Price.
І саме Price 2 нещодавно змінився.
З 31 серпня 2026 року для TradFi Perpetual Contracts Binance змінила основу його розрахунку: замість Moving Average за 30 секунд використовується середнє за 1 хвилину.
При цьому сам Mark Price продовжує розраховуватися як медіана Price 1, Price 2 та Contract Price.
Чому це цікаво?
Тому що навіть невелика зміна в методиці розрахунку показує важливу річ:
ціна, яку ти бачиш як останню угоду, і Mark Price — це різні величини.
Mark Price — це окремий розрахунковий показник, а не просто копія останньої угоди.
Тому, коли працюєш із TradFi Perpetuals, недостатньо дивитися лише на графік.
Важливо розуміти, як саме формується ціна, яку використовує механіка контракту.
І мені подобається саме цей момент у TradFi на Binance: за знайомою назвою акції стоїть зовсім інша ринкова інфраструктура.
Тут важлива не тільки ціна активу, а й те, як біржа її розраховує.
#TradFi
У TradFi Perpetuals є ціна угоди. Але для розрахунку Mark Price Binance використовує не лише її.
На перший погляд здається логічним: якщо контракт торгується за певною ціною, саме її біржа й має використовувати.
Але у perpetual-контрактів механіка складніша.
Binance розраховує Mark Price через медіану трьох значень: Price 1, Price 2 та Contract Price.
І саме Price 2 нещодавно змінився.
З 31 серпня 2026 року для TradFi Perpetual Contracts Binance змінила основу його розрахунку: замість Moving Average за 30 секунд використовується середнє за 1 хвилину.
При цьому сам Mark Price продовжує розраховуватися як медіана Price 1, Price 2 та Contract Price.
Чому це цікаво?
Тому що навіть невелика зміна в методиці розрахунку показує важливу річ:
ціна, яку ти бачиш як останню угоду, і Mark Price — це різні величини.
Mark Price — це окремий розрахунковий показник, а не просто копія останньої угоди.
Тому, коли працюєш із TradFi Perpetuals, недостатньо дивитися лише на графік.
Важливо розуміти, як саме формується ціна, яку використовує механіка контракту.
І мені подобається саме цей момент у TradFi на Binance: за знайомою назвою акції стоїть зовсім інша ринкова інфраструктура.
Тут важлива не тільки ціна активу, а й те, як біржа її розраховує.
#TradFi
На перший погляд здається логічним: якщо контракт торгується за певною ціною, саме її біржа й має використовувати.
Але у perpetual-контрактів механіка складніша.
Binance розраховує Mark Price через медіану трьох значень: Price 1, Price 2 та Contract Price.
І саме Price 2 нещодавно змінився.
З 31 серпня 2026 року для TradFi Perpetual Contracts Binance змінила основу його розрахунку: замість Moving Average за 30 секунд використовується середнє за 1 хвилину.
При цьому сам Mark Price продовжує розраховуватися як медіана Price 1, Price 2 та Contract Price.
Чому це цікаво?
Тому що навіть невелика зміна в методиці розрахунку показує важливу річ:
ціна, яку ти бачиш як останню угоду, і Mark Price — це різні величини.
Mark Price — це окремий розрахунковий показник, а не просто копія останньої угоди.
Тому, коли працюєш із TradFi Perpetuals, недостатньо дивитися лише на графік.
Важливо розуміти, як саме формується ціна, яку використовує механіка контракту.
І мені подобається саме цей момент у TradFi на Binance: за знайомою назвою акції стоїть зовсім інша ринкова інфраструктура.
Тут важлива не тільки ціна активу, а й те, як біржа її розраховує.
#TradFi
112
·
--
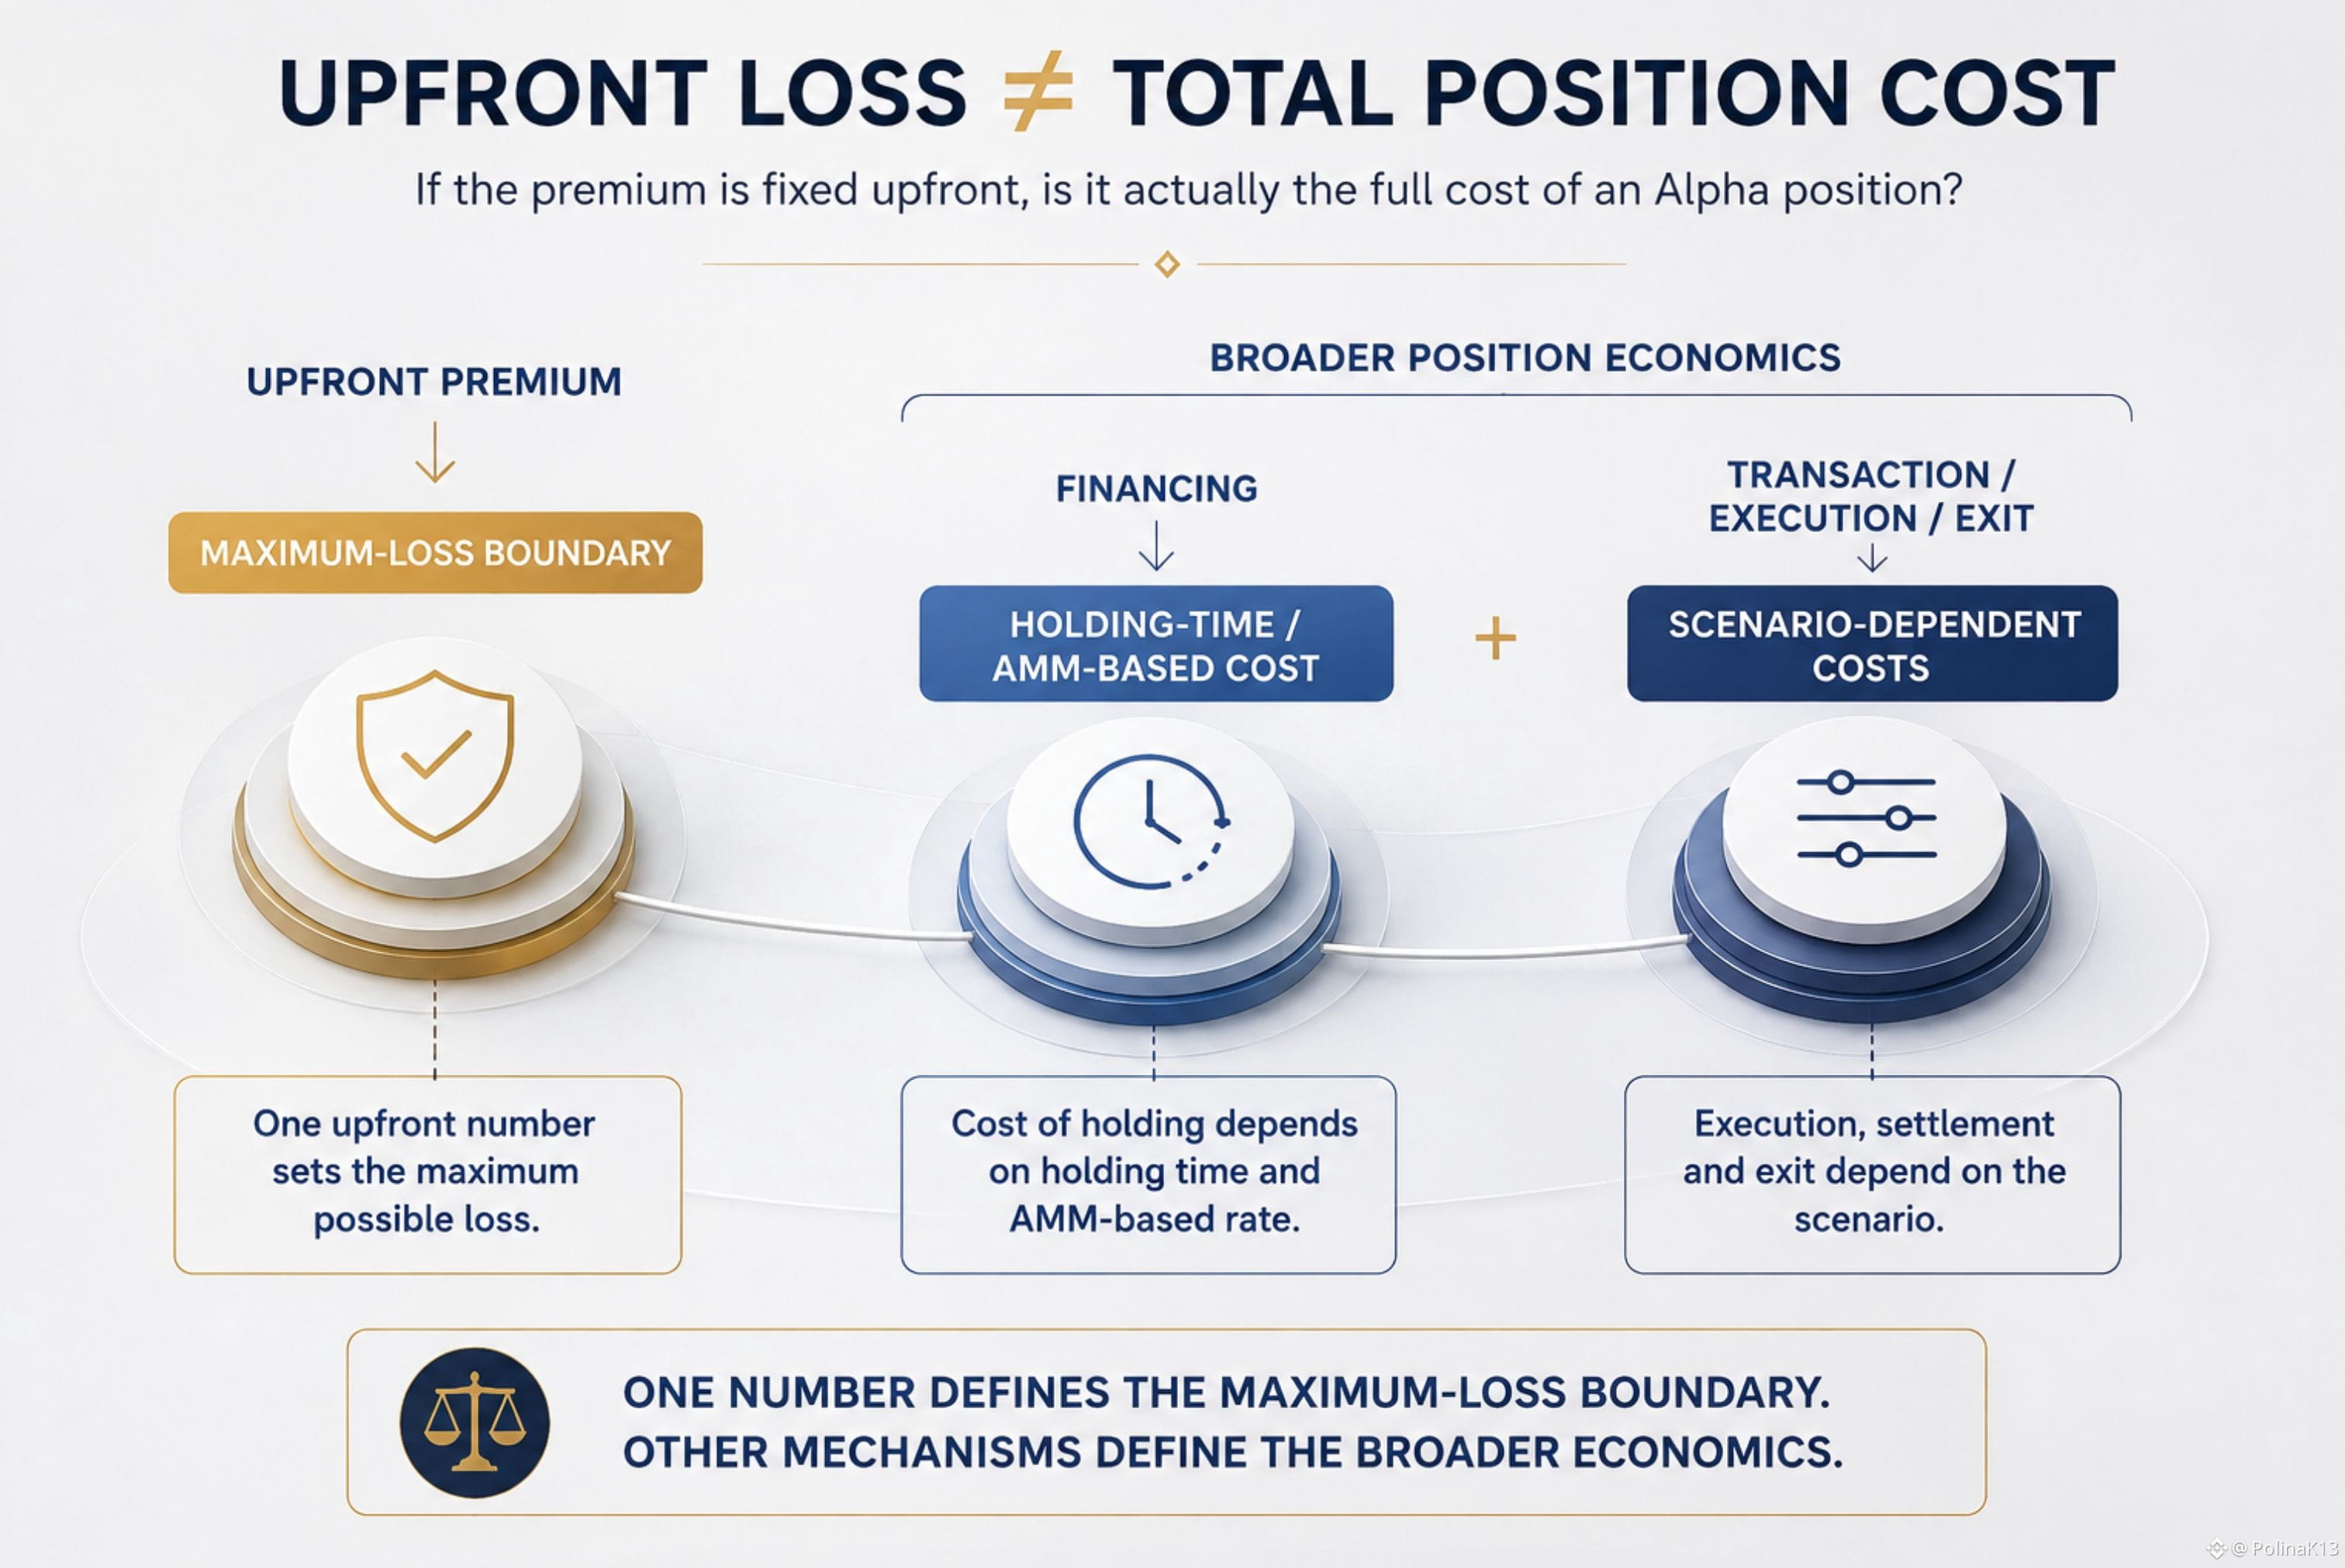
If the premium is fixed upfront, is it actually the full cost of an Alpha position?
It’s easy to treat the upfront premium as the cost of the position.
After all, TermMax defines Max Cost as the upfront premium — and as the maximum possible loss of the Alpha position.
But that answers one question:
How large can the position’s loss be?
It doesn’t necessarily answer another:
What are the broader economics of holding or executing the position?
TermMax separately documents option financing.
That financing is calculated using the option’s notional value, the AMM rate and the time the position is held. The AMM-based annual rate can also adjust dynamically.
And financing isn’t the only separate mechanism. TermMax also documents transaction, execution and exit-related costs that can apply depending on the scenario.
The important distinction is not:
premium + fees = a bigger maximum loss.
That would contradict what Max Cost is designed to represent.
The distinction is:
maximum-loss boundary
vs.
broader economic cost structure
So knowing the maximum loss upfront does not mean every economic cost associated with holding or executing the position is fixed upfront.
The useful distinction isn't cheap vs. expensive.
It’s understanding what the upfront number actually tells you — and what it doesn't.
UPFRONT LOSS ≠ TOTAL POSITION COST
#termmax @termmax
If the premium is fixed upfront, is it actually the full cost of an Alpha position?
It’s easy to treat the upfront premium as the cost of the position.
After all, TermMax defines Max Cost as the upfront premium — and as the maximum possible loss of the Alpha position.
But that answers one question:
How large can the position’s loss be?
It doesn’t necessarily answer another:
What are the broader economics of holding or executing the position?
TermMax separately documents option financing.
That financing is calculated using the option’s notional value, the AMM rate and the time the position is held. The AMM-based annual rate can also adjust dynamically.
And financing isn’t the only separate mechanism. TermMax also documents transaction, execution and exit-related costs that can apply depending on the scenario.
The important distinction is not:
premium + fees = a bigger maximum loss.
That would contradict what Max Cost is designed to represent.
The distinction is:
maximum-loss boundary
vs.
broader economic cost structure
So knowing the maximum loss upfront does not mean every economic cost associated with holding or executing the position is fixed upfront.
The useful distinction isn't cheap vs. expensive.
It’s understanding what the upfront number actually tells you — and what it doesn't.
UPFRONT LOSS ≠ TOTAL POSITION COST
#termmax @TermMax
It’s easy to treat the upfront premium as the cost of the position.
After all, TermMax defines Max Cost as the upfront premium — and as the maximum possible loss of the Alpha position.
But that answers one question:
How large can the position’s loss be?
It doesn’t necessarily answer another:
What are the broader economics of holding or executing the position?
TermMax separately documents option financing.
That financing is calculated using the option’s notional value, the AMM rate and the time the position is held. The AMM-based annual rate can also adjust dynamically.
And financing isn’t the only separate mechanism. TermMax also documents transaction, execution and exit-related costs that can apply depending on the scenario.
The important distinction is not:
premium + fees = a bigger maximum loss.
That would contradict what Max Cost is designed to represent.
The distinction is:
maximum-loss boundary
vs.
broader economic cost structure
So knowing the maximum loss upfront does not mean every economic cost associated with holding or executing the position is fixed upfront.
The useful distinction isn't cheap vs. expensive.
It’s understanding what the upfront number actually tells you — and what it doesn't.
UPFRONT LOSS ≠ TOTAL POSITION COST
#termmax @TermMax
82
·
--
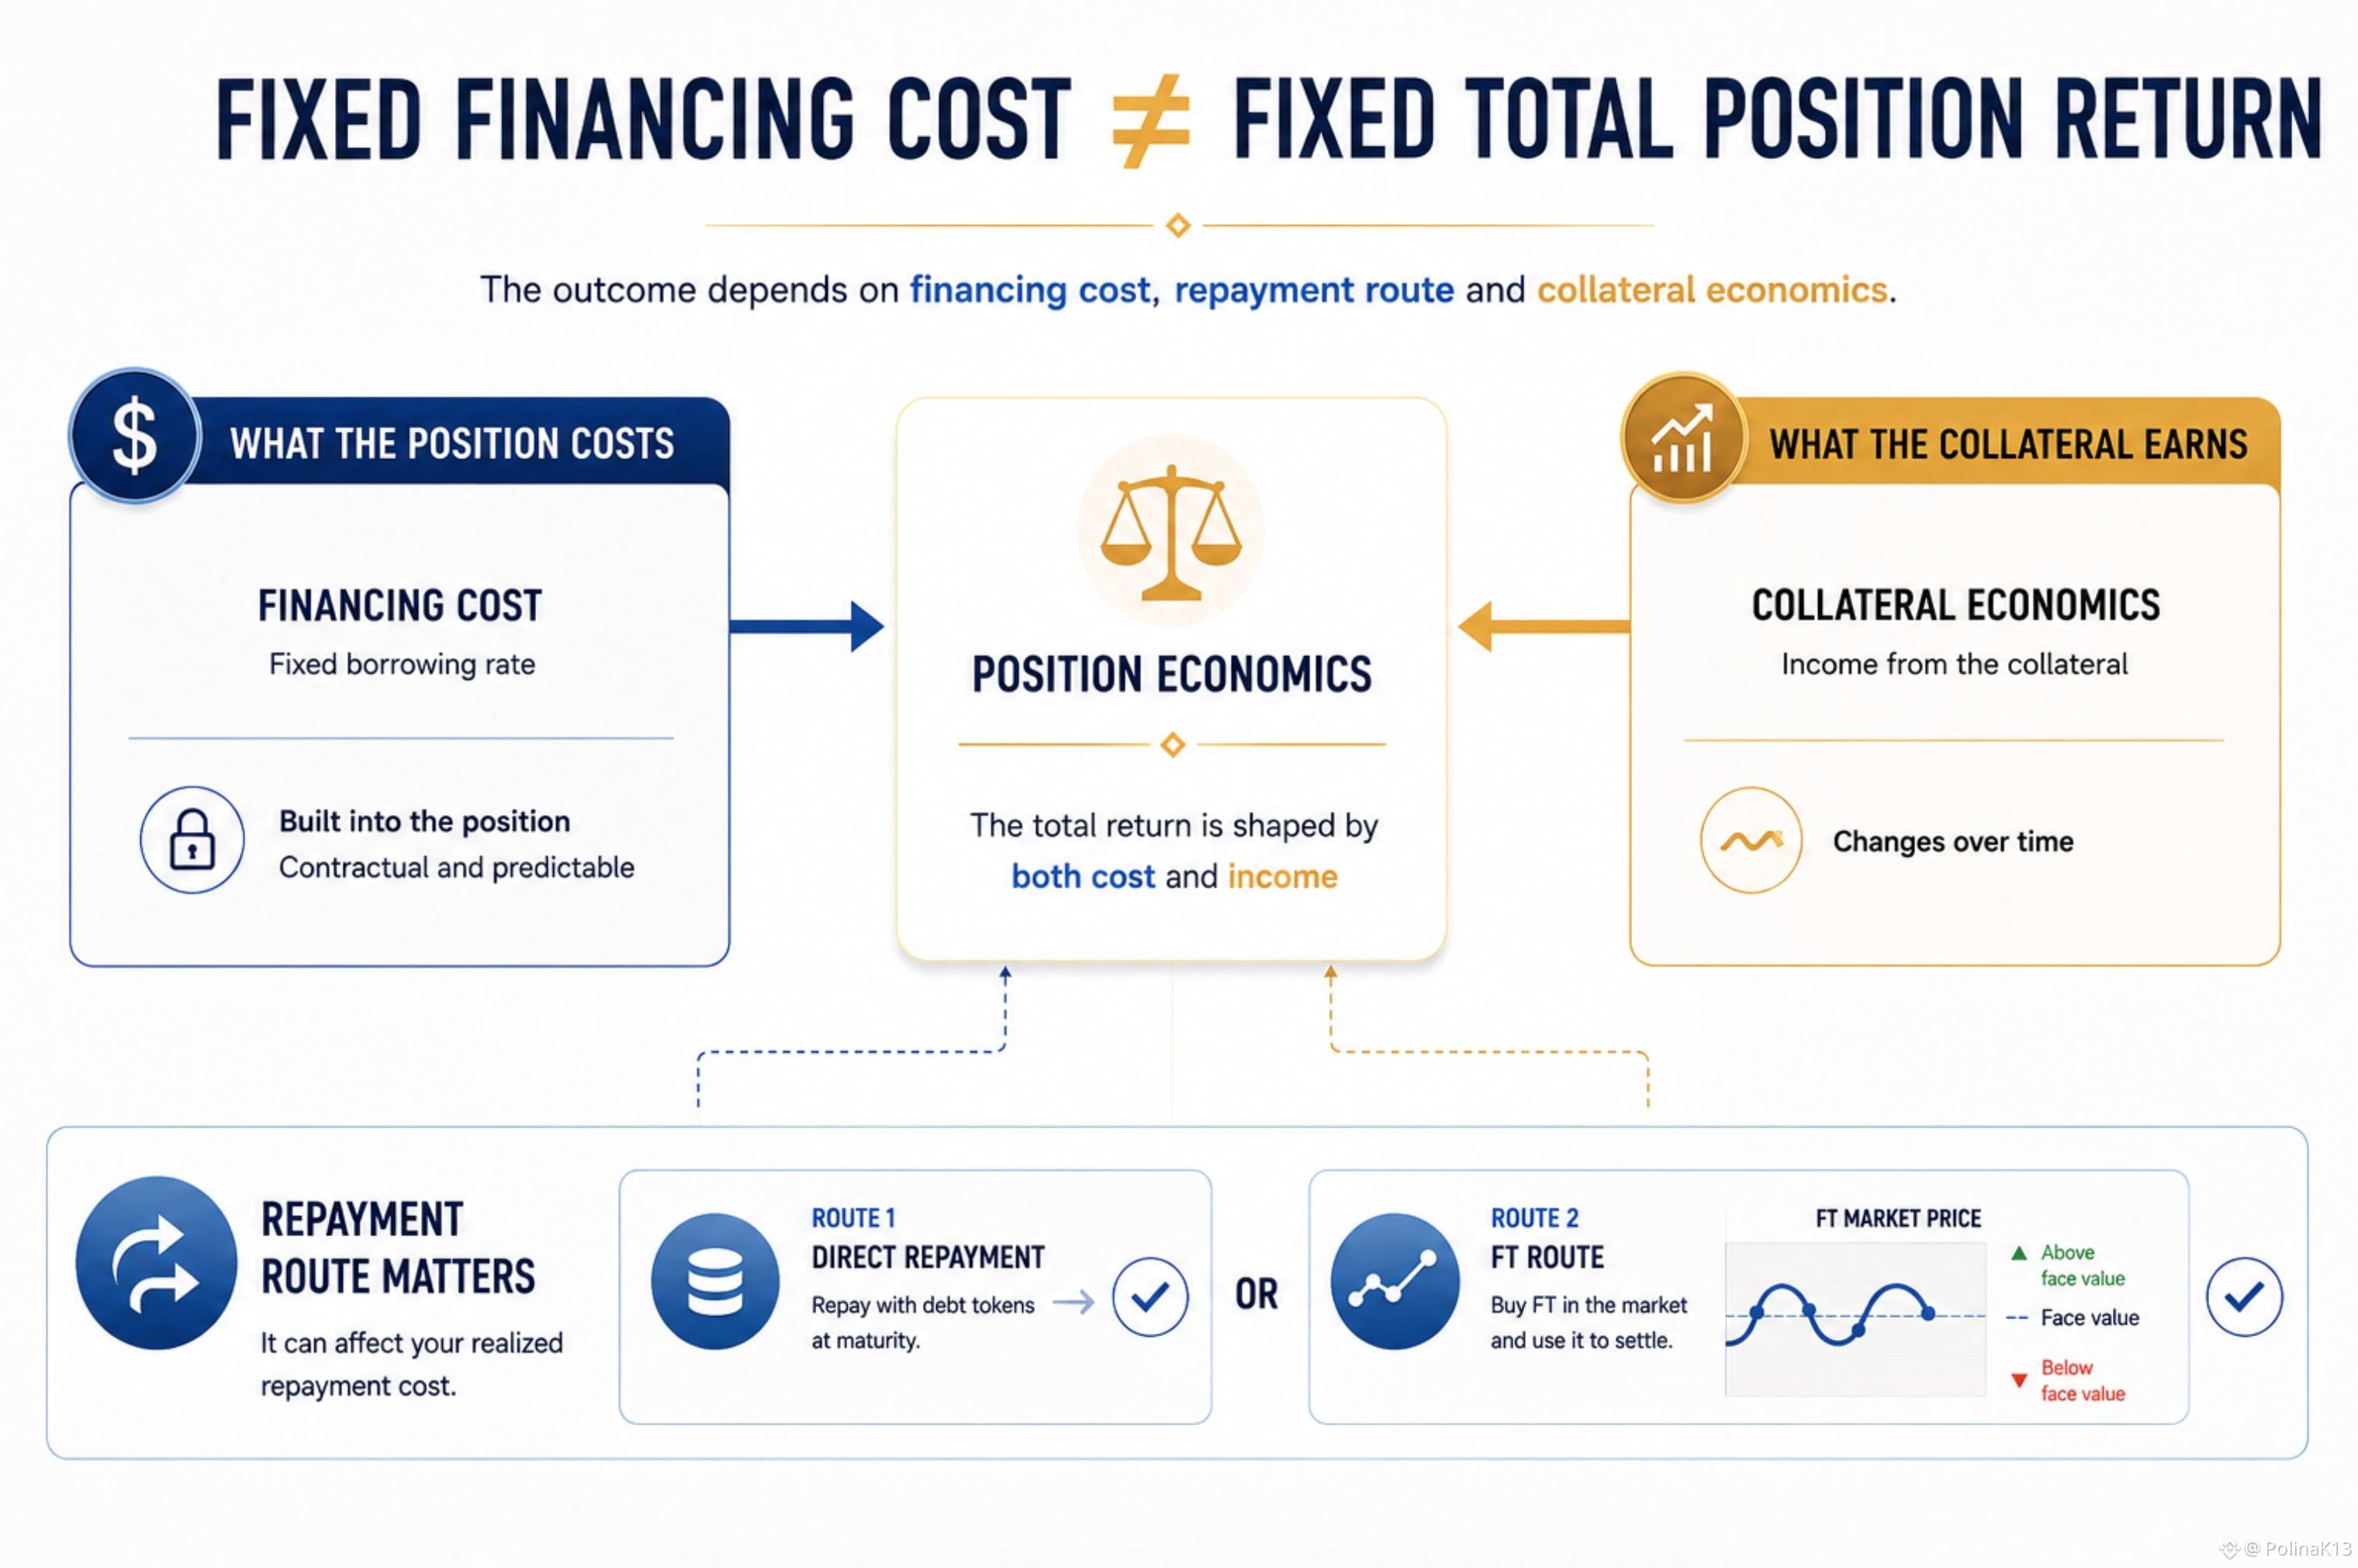
A leveraged position can look cheaper or more expensive than expected for a reason that is easy to miss.
In TermMax, the borrowing rate is fixed when the position is formed.
But the important part is what that means for the position’s value.
TermMax finalizes the borrowing cost upfront. The future interest obligation is therefore already reflected in the GT’s value, rather than simply accumulating over time like interest in a conventional floating-rate money market.
That changes how I would read a leveraged position.
The right question is not only:
“What is the borrowing rate?”
It is also:
“How much of the financing cost is already embedded in the position I’m looking at?”
There is one more layer.
Before maturity, the borrower can either repay directly with debt tokens or use the corresponding FT to settle the debt.
If that FT is available at a sufficient discount, the FT route can potentially reduce the realized repayment cost.
So the contractual financing obligation is fixed.
But the economics of settling that obligation can still depend on the repayment route.
And on the other side of the position, the collateral may have its own income profile.
That means I would evaluate leverage through two separate questions:
What does the financing cost?
and
What does the collateral earn?
The fixed rate gives certainty on the first.
It does not, by itself, tell you the economic return of the whole position.
For me, that is the more useful way to read a leveraged TermMax position: separate the financing obligation from the economics generated by the collateral.
#termmax @termmax
A leveraged position can look cheaper or more expensive than expected for a reason that is easy to miss.
In TermMax, the borrowing rate is fixed when the position is formed.
But the important part is what that means for the position’s value.
TermMax finalizes the borrowing cost upfront. The future interest obligation is therefore already reflected in the GT’s value, rather than simply accumulating over time like interest in a conventional floating-rate money market.
That changes how I would read a leveraged position.
The right question is not only:
“What is the borrowing rate?”
It is also:
“How much of the financing cost is already embedded in the position I’m looking at?”
There is one more layer.
Before maturity, the borrower can either repay directly with debt tokens or use the corresponding FT to settle the debt.
If that FT is available at a sufficient discount, the FT route can potentially reduce the realized repayment cost.
So the contractual financing obligation is fixed.
But the economics of settling that obligation can still depend on the repayment route.
And on the other side of the position, the collateral may have its own income profile.
That means I would evaluate leverage through two separate questions:
What does the financing cost?
and
What does the collateral earn?
The fixed rate gives certainty on the first.
It does not, by itself, tell you the economic return of the whole position.
For me, that is the more useful way to read a leveraged TermMax position: separate the financing obligation from the economics generated by the collateral.
#termmax @TermMax
In TermMax, the borrowing rate is fixed when the position is formed.
But the important part is what that means for the position’s value.
TermMax finalizes the borrowing cost upfront. The future interest obligation is therefore already reflected in the GT’s value, rather than simply accumulating over time like interest in a conventional floating-rate money market.
That changes how I would read a leveraged position.
The right question is not only:
“What is the borrowing rate?”
It is also:
“How much of the financing cost is already embedded in the position I’m looking at?”
There is one more layer.
Before maturity, the borrower can either repay directly with debt tokens or use the corresponding FT to settle the debt.
If that FT is available at a sufficient discount, the FT route can potentially reduce the realized repayment cost.
So the contractual financing obligation is fixed.
But the economics of settling that obligation can still depend on the repayment route.
And on the other side of the position, the collateral may have its own income profile.
That means I would evaluate leverage through two separate questions:
What does the financing cost?
and
What does the collateral earn?
The fixed rate gives certainty on the first.
It does not, by itself, tell you the economic return of the whole position.
For me, that is the more useful way to read a leveraged TermMax position: separate the financing obligation from the economics generated by the collateral.
#termmax @TermMax
78
·
--
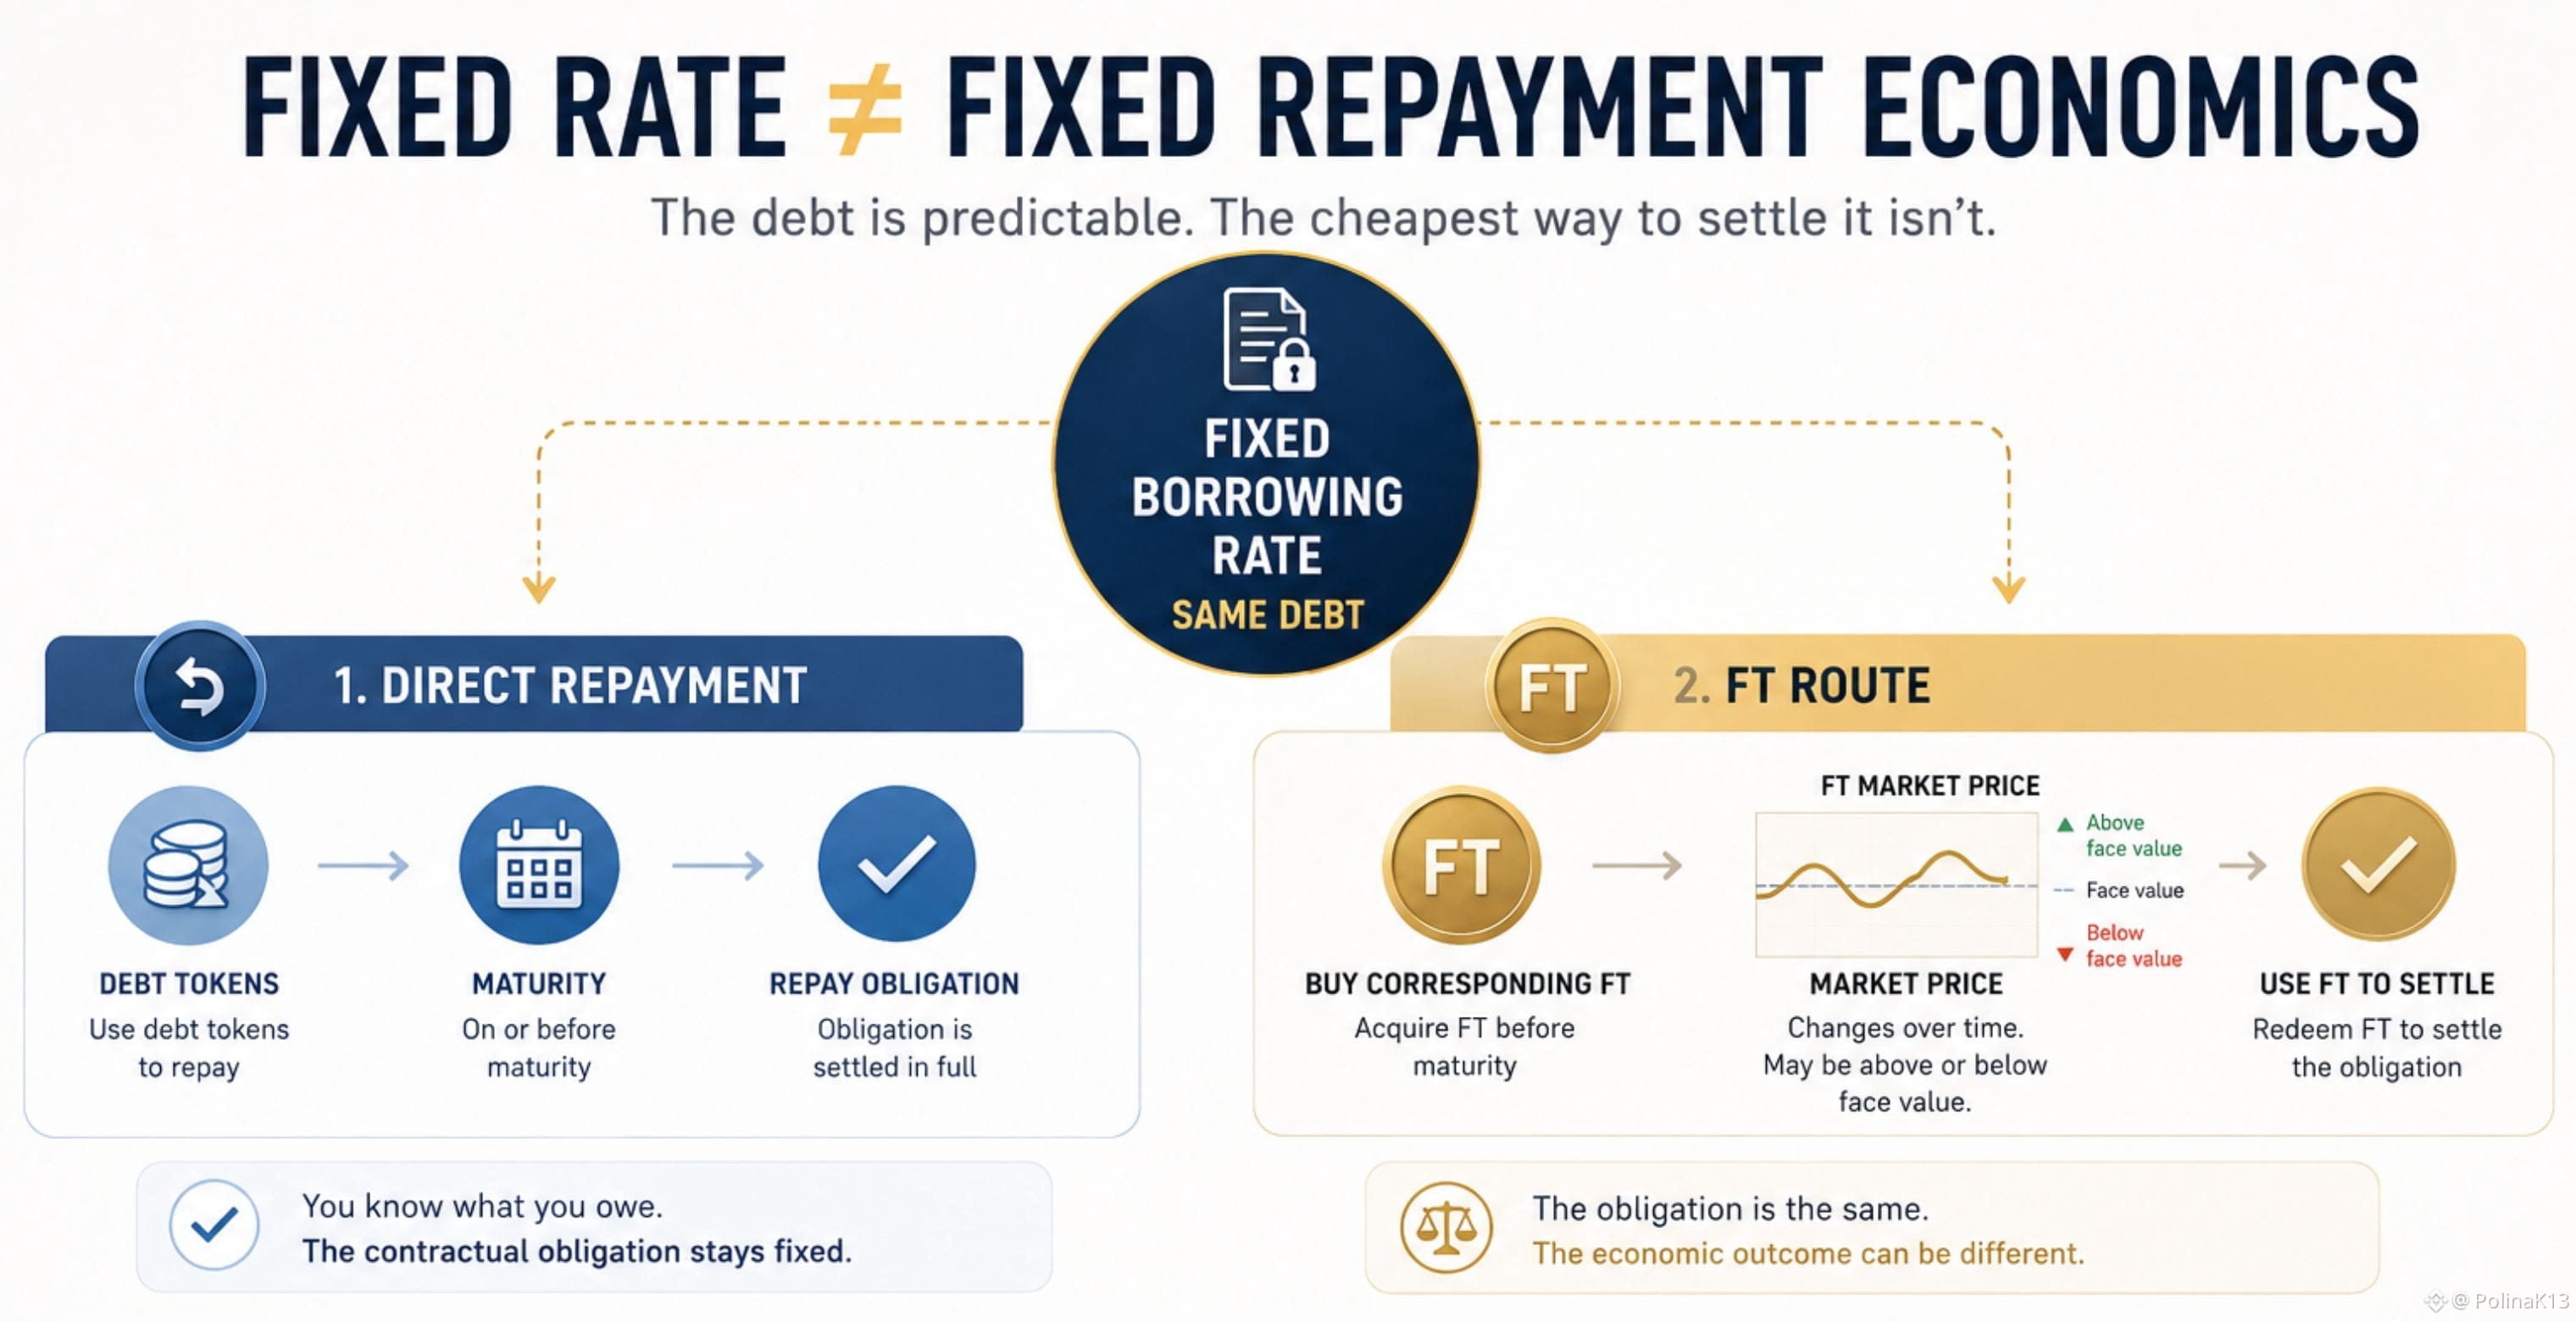
A fixed borrowing rate can make the debt predictable. The interesting question is whether the cheapest way to settle it stays predictable too.
In TermMax, a borrower has two repayment routes:
→ repay the debt directly with debt tokens
→ or buy the corresponding FT before maturity and use it to settle the debt.
That second route is where the economics get more interesting.
Before maturity, an FT can trade below its face value. And the relationship between the current market rate and the borrower's locked rate can affect whether that discount exists and how attractive the FT route becomes.
If market rates move above the rate the borrower originally locked, TermMax's documentation notes that the corresponding FT may be available at a discount, potentially making settlement cheaper.
But “potentially” matters.
The debt obligation itself hasn't changed. And a discount doesn't automatically mean the borrower saves money. The FT still has to be available at a sufficient discount for that repayment route to be economically preferable.
So fixed-rate borrowing gives you certainty about the rate.
It doesn't necessarily give you certainty about which way of settling that same obligation will be cheapest.
That distinction makes the repayment economics more interesting than the fixed rate alone.
#termmax @termmax
A fixed borrowing rate can make the debt predictable. The interesting question is whether the cheapest way to settle it stays predictable too.
In TermMax, a borrower has two repayment routes:
→ repay the debt directly with debt tokens
→ or buy the corresponding FT before maturity and use it to settle the debt.
That second route is where the economics get more interesting.
Before maturity, an FT can trade below its face value. And the relationship between the current market rate and the borrower's locked rate can affect whether that discount exists and how attractive the FT route becomes.
If market rates move above the rate the borrower originally locked, TermMax's documentation notes that the corresponding FT may be available at a discount, potentially making settlement cheaper.
But “potentially” matters.
The debt obligation itself hasn't changed. And a discount doesn't automatically mean the borrower saves money. The FT still has to be available at a sufficient discount for that repayment route to be economically preferable.
So fixed-rate borrowing gives you certainty about the rate.
It doesn't necessarily give you certainty about which way of settling that same obligation will be cheapest.
That distinction makes the repayment economics more interesting than the fixed rate alone.
#termmax @TermMax
In TermMax, a borrower has two repayment routes:
→ repay the debt directly with debt tokens
→ or buy the corresponding FT before maturity and use it to settle the debt.
That second route is where the economics get more interesting.
Before maturity, an FT can trade below its face value. And the relationship between the current market rate and the borrower's locked rate can affect whether that discount exists and how attractive the FT route becomes.
If market rates move above the rate the borrower originally locked, TermMax's documentation notes that the corresponding FT may be available at a discount, potentially making settlement cheaper.
But “potentially” matters.
The debt obligation itself hasn't changed. And a discount doesn't automatically mean the borrower saves money. The FT still has to be available at a sufficient discount for that repayment route to be economically preferable.
So fixed-rate borrowing gives you certainty about the rate.
It doesn't necessarily give you certainty about which way of settling that same obligation will be cheapest.
That distinction makes the repayment economics more interesting than the fixed rate alone.
#termmax @TermMax
83
·
--
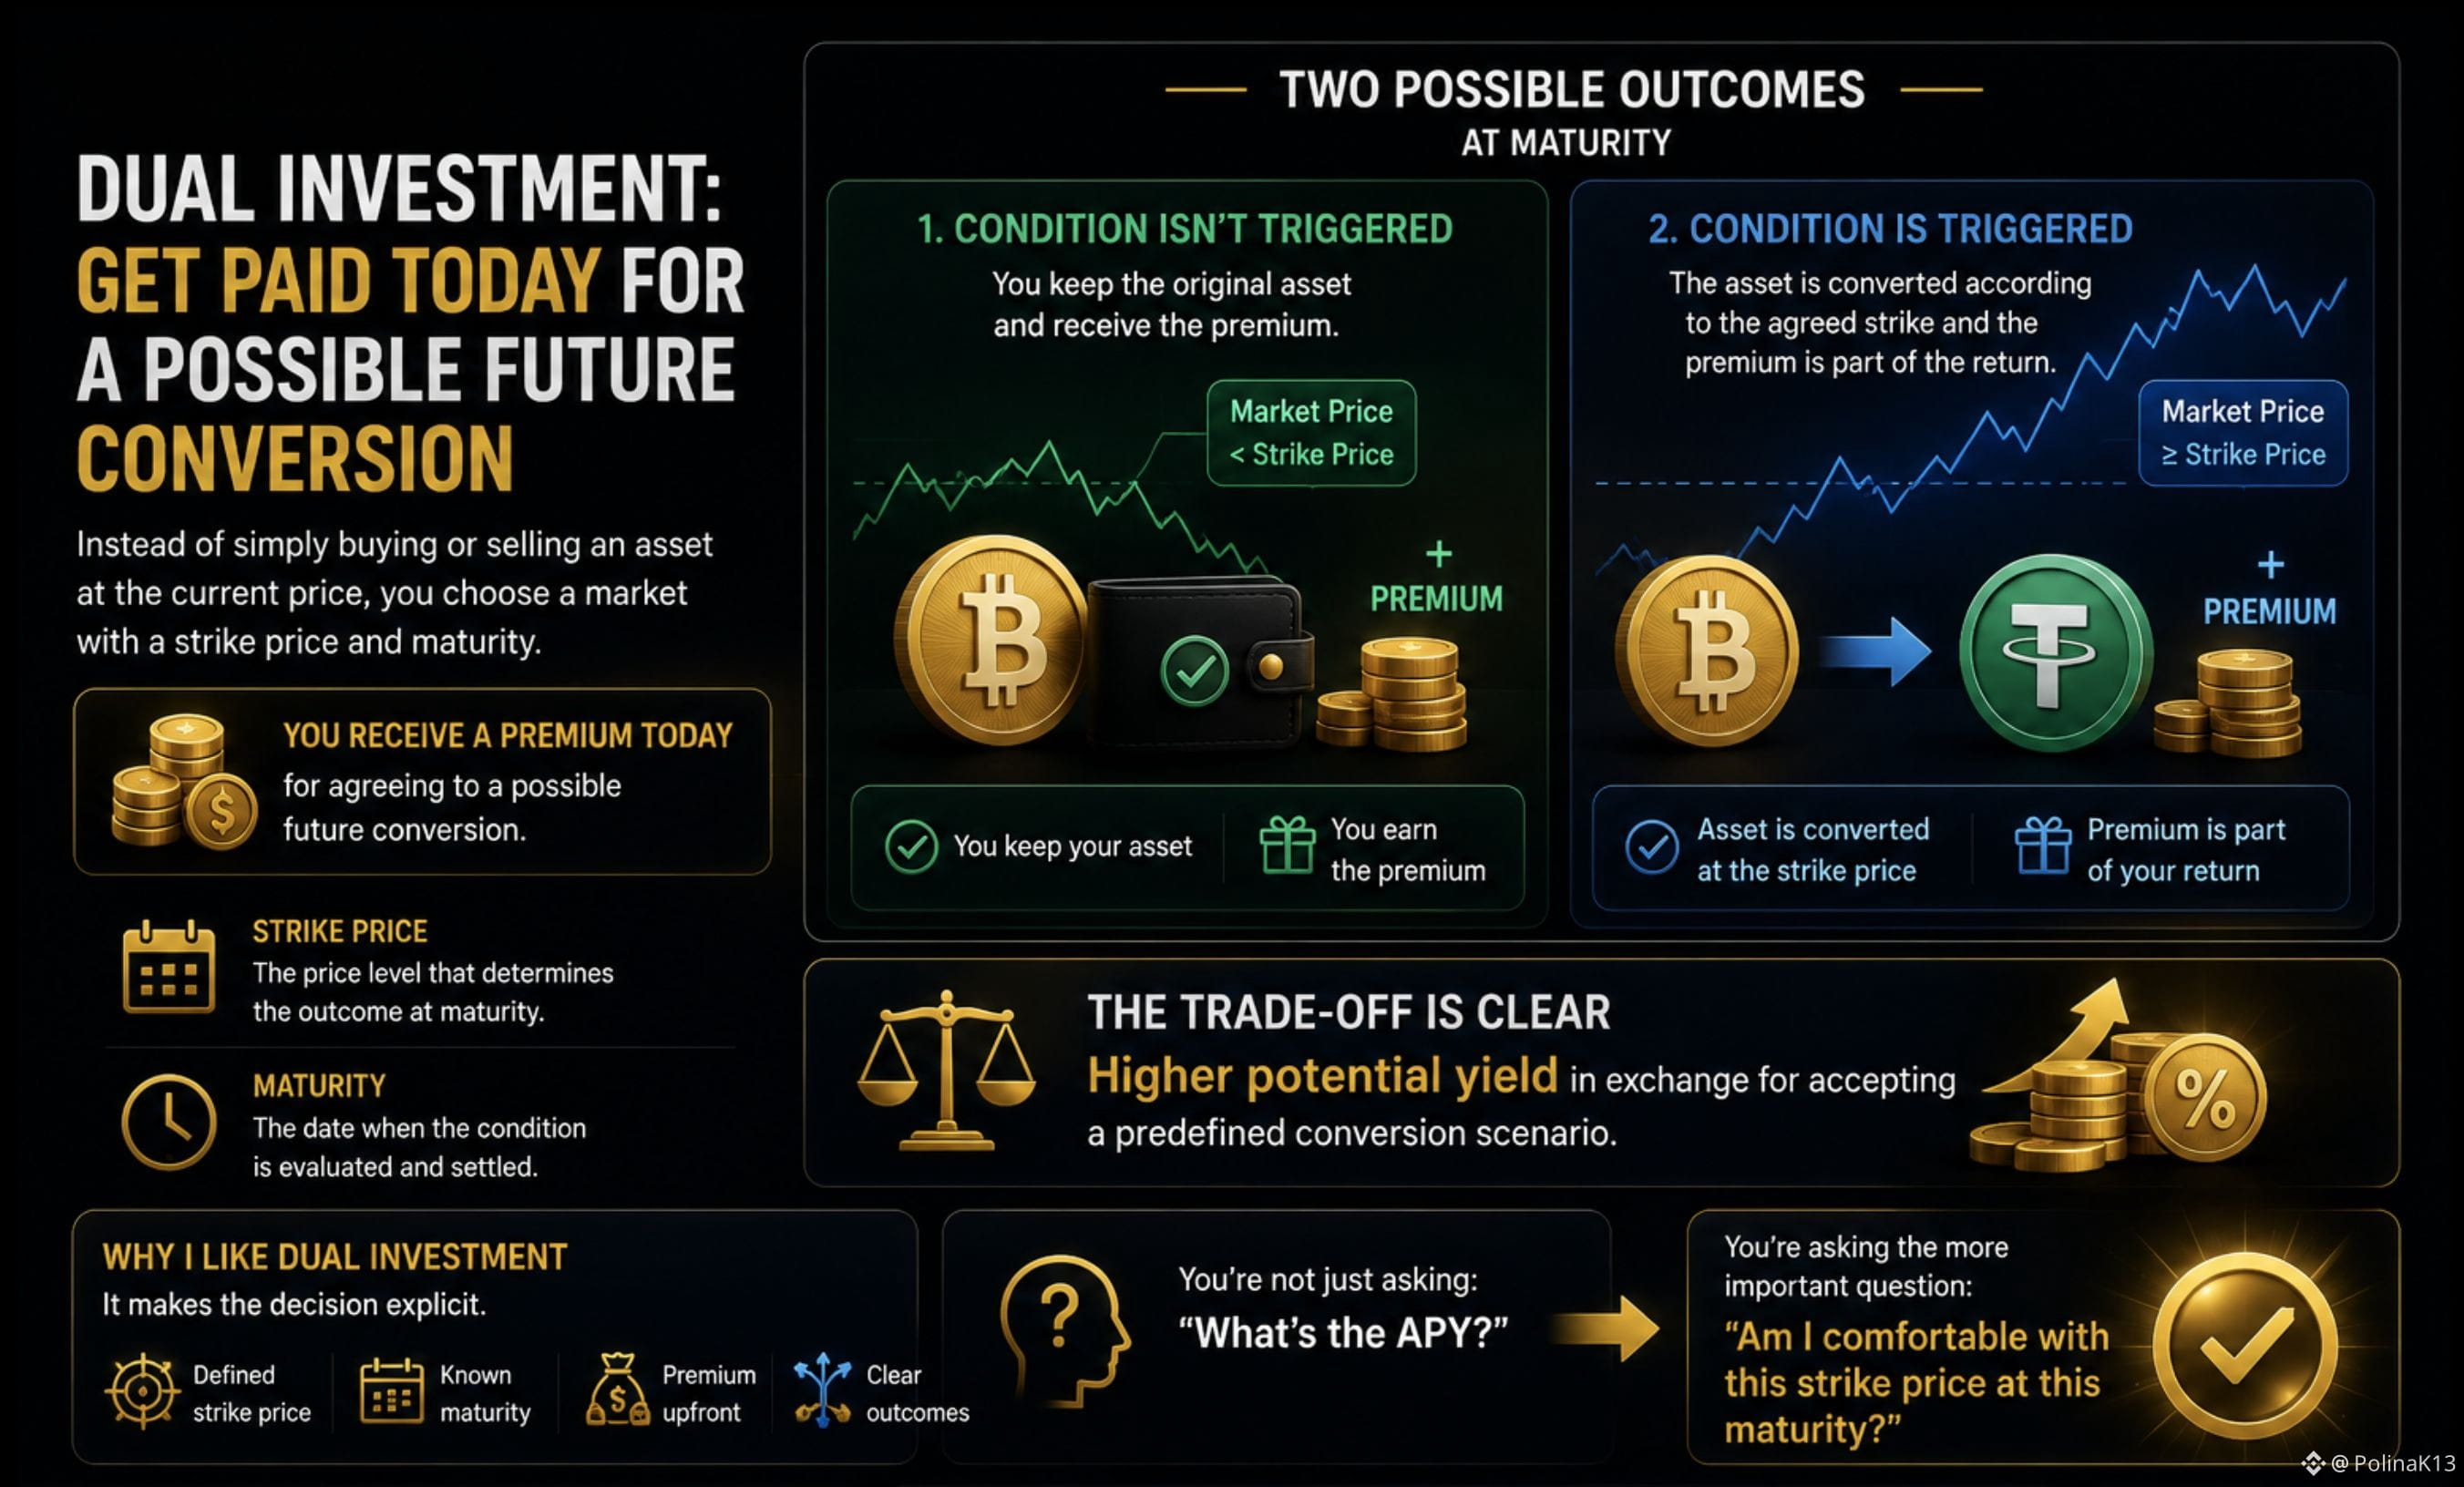
What if you could get paid today for agreeing to a possible future conversion?
That's the basic idea behind Dual Investment.
Instead of simply buying or selling an asset at the current price, you choose a market with a strike price and maturity.
Then there are two possible outcomes.
If the condition isn't triggered:
→ you keep the original asset
→ and receive the premium
If the condition is triggered:
→ the asset is converted according to the agreed strike
→ and the premium is part of the return.
So the trade-off is pretty clear:
higher potential yield in exchange for accepting a predefined conversion scenario.
I like this structure because it makes the decision explicit.
You're not just asking:
“What's the APY?”
You're asking:
“Am I comfortable with this strike price at this maturity?”
That is a much more useful question.
#termmax @termmax
What if you could get paid today for agreeing to a possible future conversion?
That's the basic idea behind Dual Investment.
Instead of simply buying or selling an asset at the current price, you choose a market with a strike price and maturity.
Then there are two possible outcomes.
If the condition isn't triggered:
→ you keep the original asset
→ and receive the premium
If the condition is triggered:
→ the asset is converted according to the agreed strike
→ and the premium is part of the return.
So the trade-off is pretty clear:
higher potential yield in exchange for accepting a predefined conversion scenario.
I like this structure because it makes the decision explicit.
You're not just asking:
“What's the APY?”
You're asking:
“Am I comfortable with this strike price at this maturity?”
That is a much more useful question.
#termmax @TermMax
That's the basic idea behind Dual Investment.
Instead of simply buying or selling an asset at the current price, you choose a market with a strike price and maturity.
Then there are two possible outcomes.
If the condition isn't triggered:
→ you keep the original asset
→ and receive the premium
If the condition is triggered:
→ the asset is converted according to the agreed strike
→ and the premium is part of the return.
So the trade-off is pretty clear:
higher potential yield in exchange for accepting a predefined conversion scenario.
I like this structure because it makes the decision explicit.
You're not just asking:
“What's the APY?”
You're asking:
“Am I comfortable with this strike price at this maturity?”
That is a much more useful question.
#termmax @TermMax
56
·
--
If the token is already in my wallet, what determines whether I can use it?
I used to think that once an asset was in my wallet, the main question was simply whether I controlled it.
But bStocks made me separate two things.
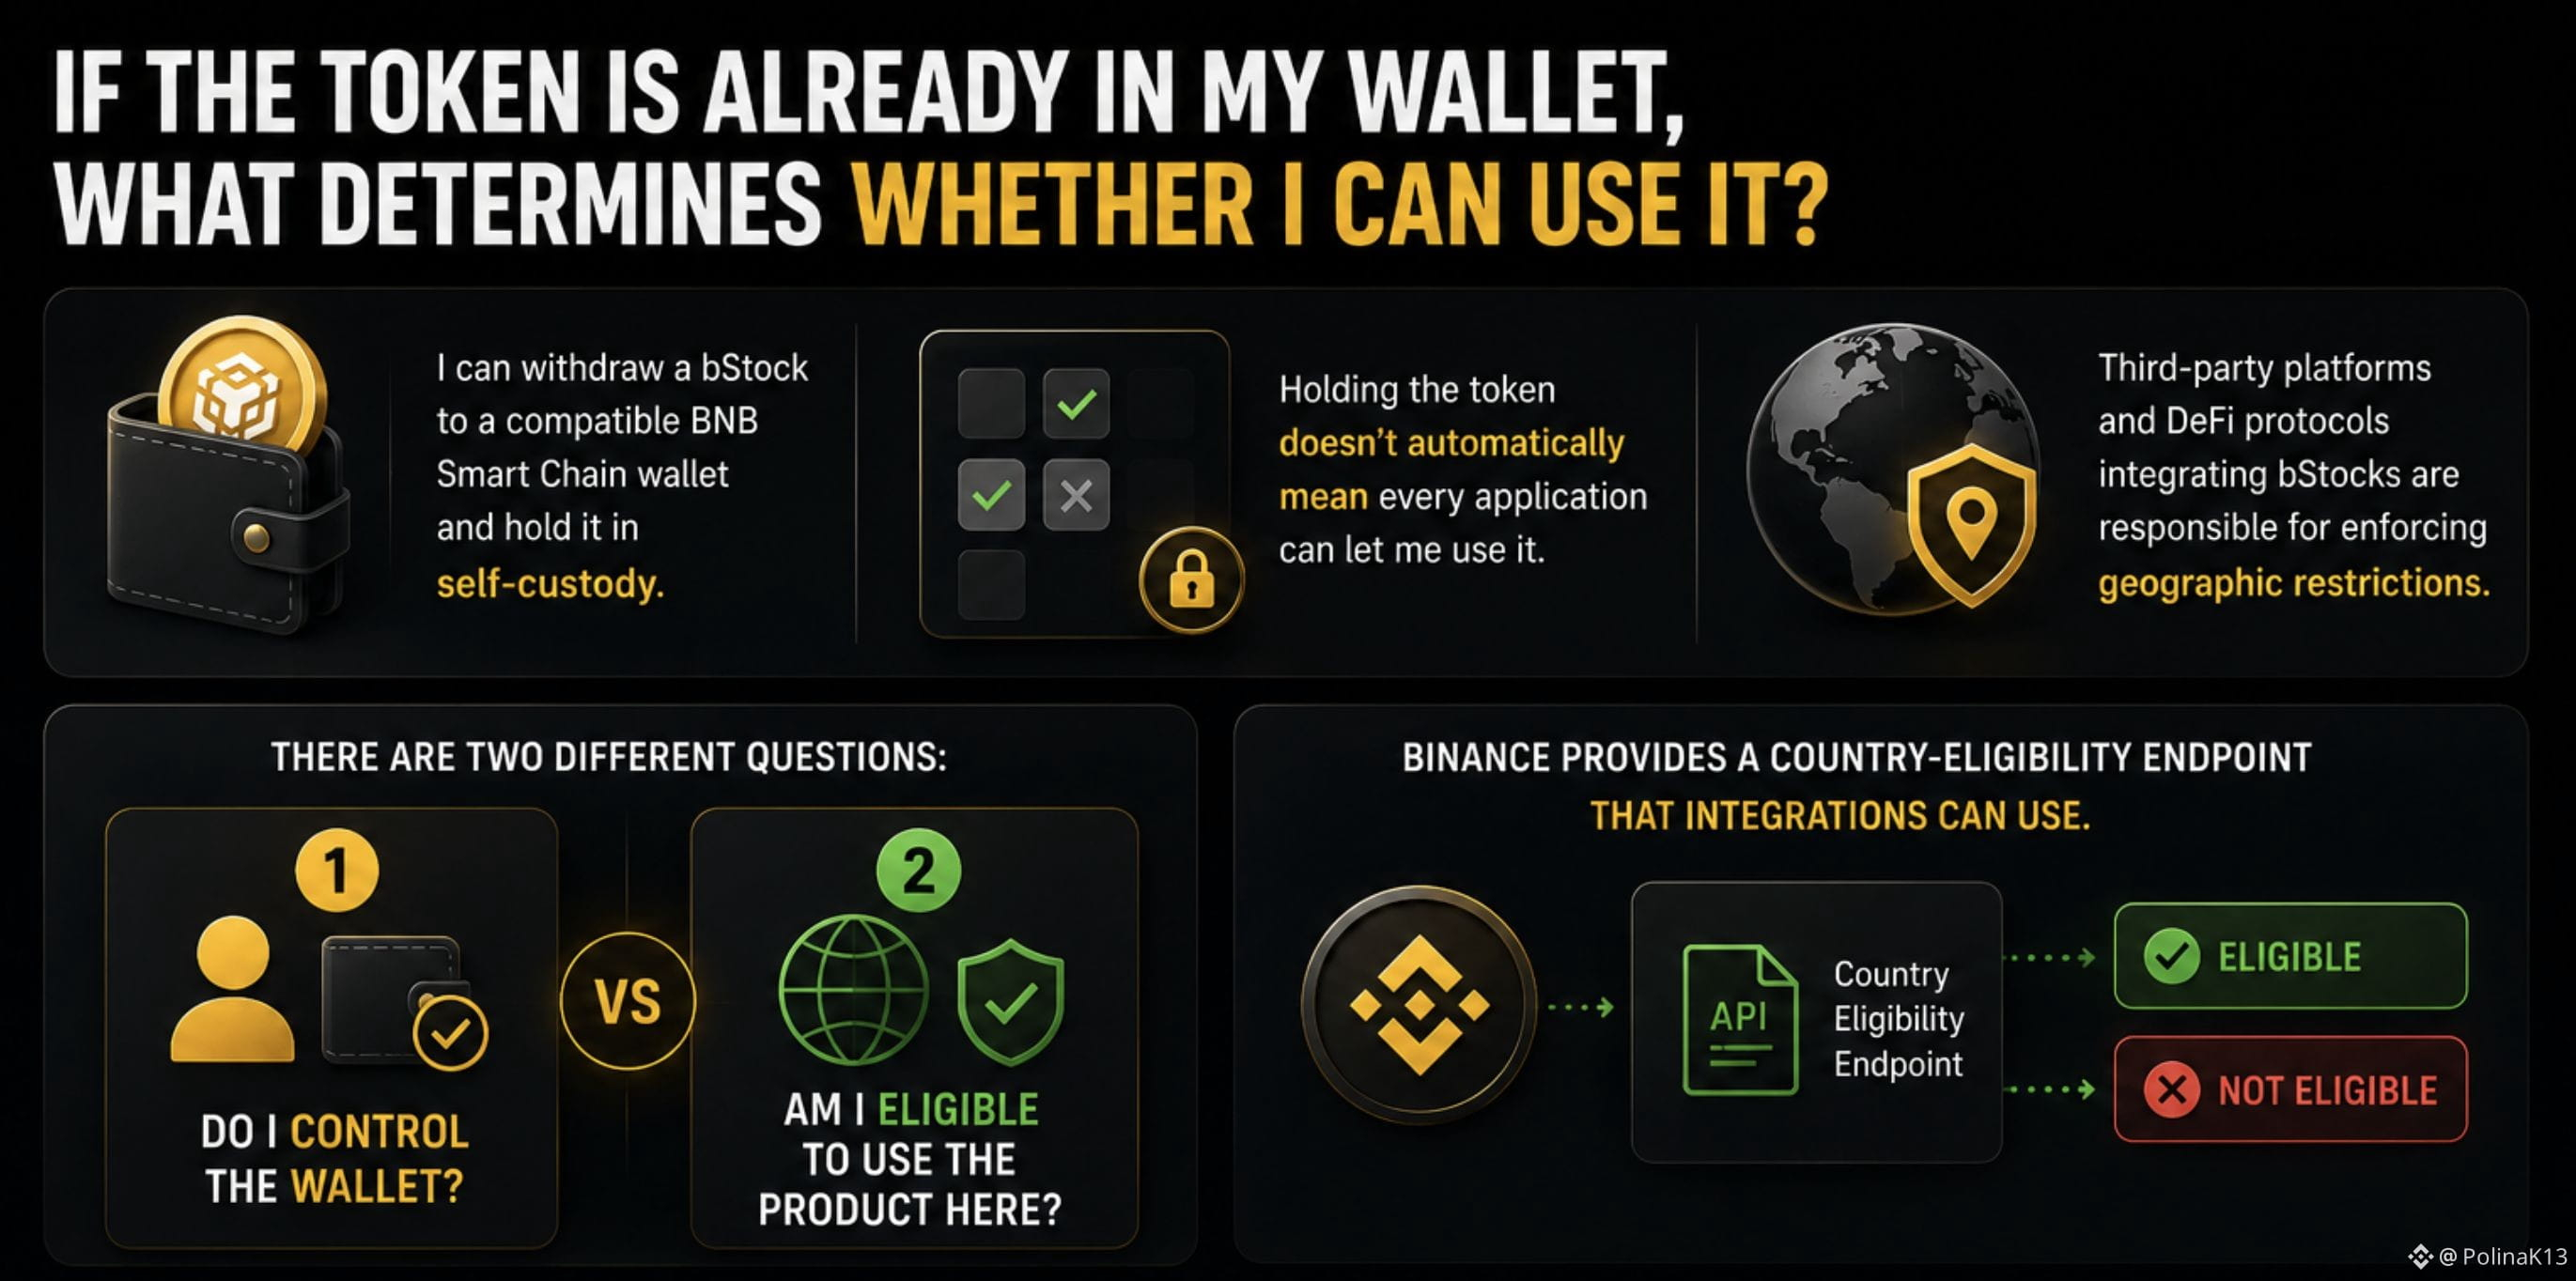
I can withdraw a bStock to a compatible BNB Smart Chain wallet and hold it in self-custody.
But holding the token doesn't automatically mean every application can let me use it.
Third-party platforms and DeFi protocols integrating bStocks are responsible for enforcing geographic restrictions.
Binance also provides a country-eligibility endpoint that integrations can use to check whether a user is eligible in a particular jurisdiction.
So there are two different questions:
Do I control the wallet?
and
Am I eligible to use the product here?
That's the distinction I find interesting.
Self-custody changes where I hold the asset.
It doesn't automatically change where the product can be used.
So instead of asking only:
“Is the token in my wallet?”
I'd also ask:
“What determines whether I can actually use it?”
For me:
Wallet control ≠ product eligibility.
#bstockscis @BinanceCIS
If the token is already in my wallet, what determines whether I can use it?
I used to think that once an asset was in my wallet, the main question was simply whether I controlled it.
But bStocks made me separate two things.
I can withdraw a bStock to a compatible BNB Smart Chain wallet and hold it in self-custody.
But holding the token doesn't automatically mean every application can let me use it.
Third-party platforms and DeFi protocols integrating bStocks are responsible for enforcing geographic restrictions.
Binance also provides a country-eligibility endpoint that integrations can use to check whether a user is eligible in a particular jurisdiction.
So there are two different questions:
Do I control the wallet?
and
Am I eligible to use the product here?
That's the distinction I find interesting.
Self-custody changes where I hold the asset.
It doesn't automatically change where the product can be used.
So instead of asking only:
“Is the token in my wallet?”
I'd also ask:
“What determines whether I can actually use it?”
For me:
Wallet control ≠ product eligibility.
#bstockscis @BinanceCIS
I used to think that once an asset was in my wallet, the main question was simply whether I controlled it.
But bStocks made me separate two things.
I can withdraw a bStock to a compatible BNB Smart Chain wallet and hold it in self-custody.
But holding the token doesn't automatically mean every application can let me use it.
Third-party platforms and DeFi protocols integrating bStocks are responsible for enforcing geographic restrictions.
Binance also provides a country-eligibility endpoint that integrations can use to check whether a user is eligible in a particular jurisdiction.
So there are two different questions:
Do I control the wallet?
and
Am I eligible to use the product here?
That's the distinction I find interesting.
Self-custody changes where I hold the asset.
It doesn't automatically change where the product can be used.
So instead of asking only:
“Is the token in my wallet?”
I'd also ask:
“What determines whether I can actually use it?”
For me:
Wallet control ≠ product eligibility.
#bstockscis @BinanceCIS
2
1
73
·
--
NVIDIA looks like a GPU company. But the business underneath is a platform.
When I first looked at NVDAB, my mental shortcut was simple:
NVIDIA → GPUs → AI.
That shortcut isn't wrong.
It just leaves out a layer I find more interesting.
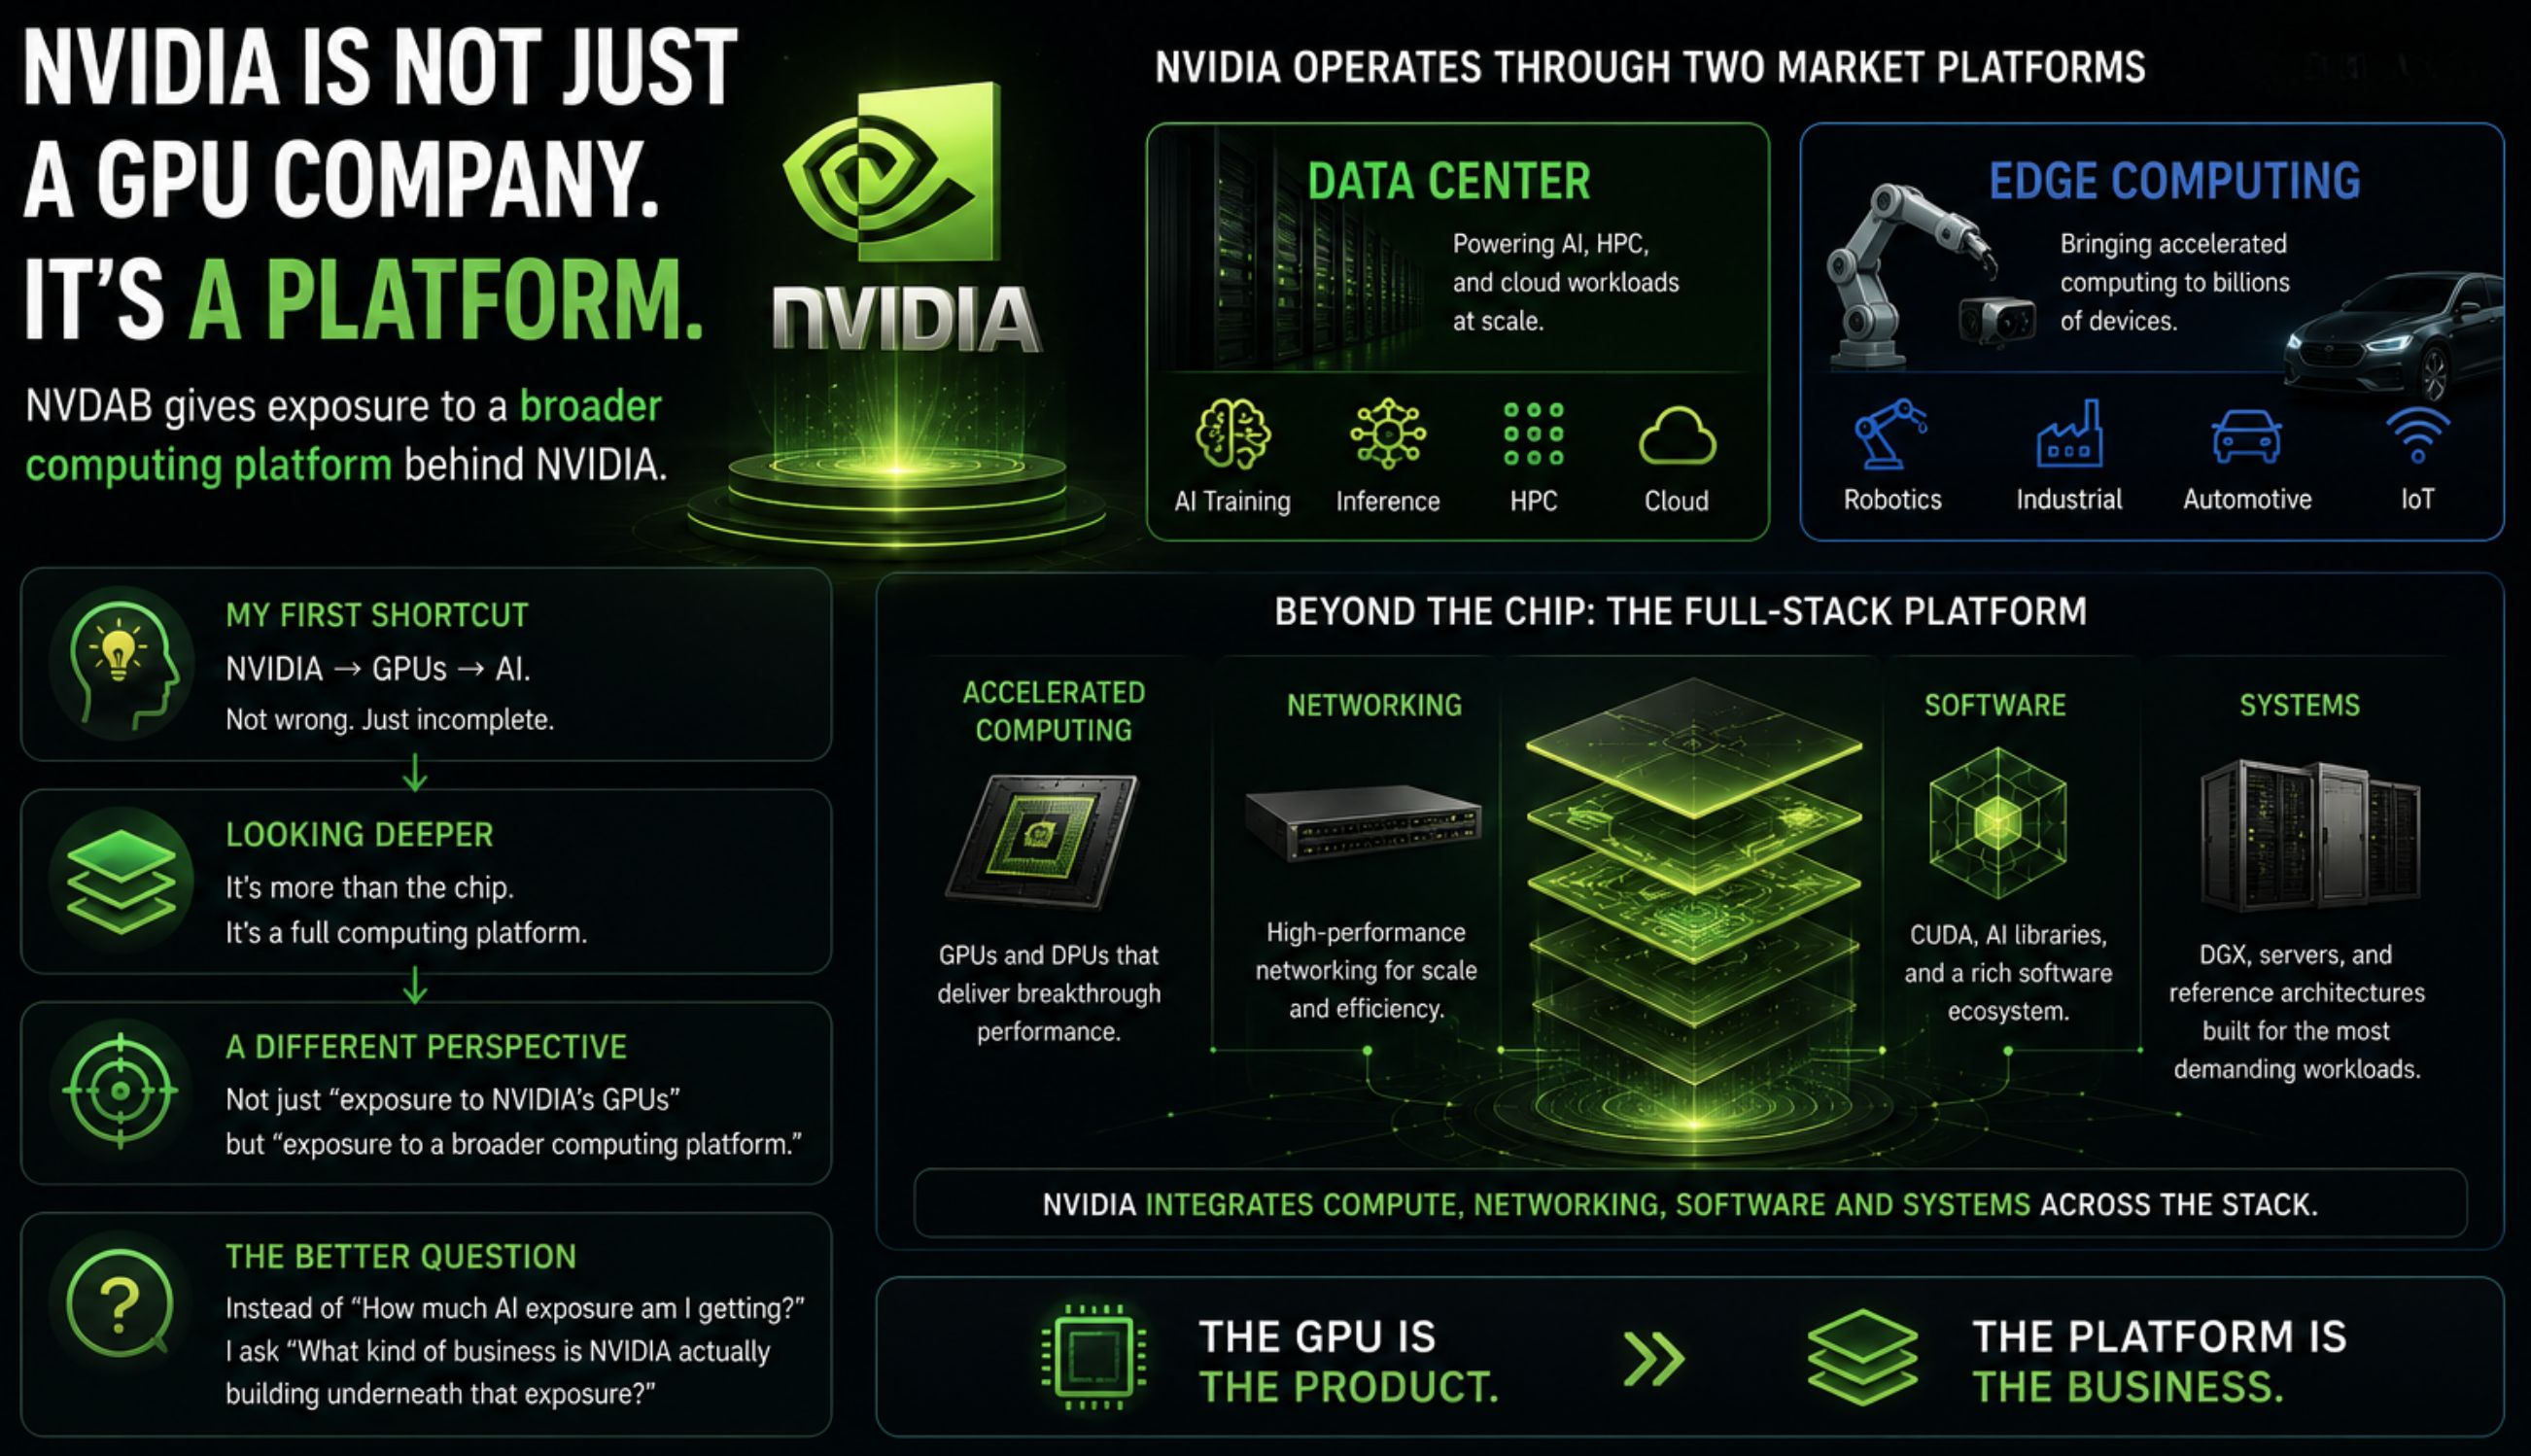
NVIDIA now describes its business through two market platforms:
Data Center
and
Edge Computing.
And the platform goes beyond the chip itself.
NVIDIA combines accelerated computing, networking, software and systems across the stack.
So I started looking at NVDAB differently.
Not simply as:
“exposure to NVIDIA's GPUs”
but as:
“exposure to a broader computing platform.”
That changes the question for me.
Instead of asking:
“How much AI exposure am I getting?”
I'd ask:
“What kind of business is NVIDIA actually building underneath that exposure?”
For me:
The GPU is the product.
The platform is the business.
#bstockscis @BinanceCIS
NVIDIA looks like a GPU company. But the business underneath is a platform.
When I first looked at NVDAB, my mental shortcut was simple:
NVIDIA → GPUs → AI.
That shortcut isn't wrong.
It just leaves out a layer I find more interesting.
NVIDIA now describes its business through two market platforms:
Data Center
and
Edge Computing.
And the platform goes beyond the chip itself.
NVIDIA combines accelerated computing, networking, software and systems across the stack.
So I started looking at NVDAB differently.
Not simply as:
“exposure to NVIDIA's GPUs”
but as:
“exposure to a broader computing platform.”
That changes the question for me.
Instead of asking:
“How much AI exposure am I getting?”
I'd ask:
“What kind of business is NVIDIA actually building underneath that exposure?”
For me:
The GPU is the product.
The platform is the business.
#bstockscis @BinanceCIS
When I first looked at NVDAB, my mental shortcut was simple:
NVIDIA → GPUs → AI.
That shortcut isn't wrong.
It just leaves out a layer I find more interesting.
NVIDIA now describes its business through two market platforms:
Data Center
and
Edge Computing.
And the platform goes beyond the chip itself.
NVIDIA combines accelerated computing, networking, software and systems across the stack.
So I started looking at NVDAB differently.
Not simply as:
“exposure to NVIDIA's GPUs”
but as:
“exposure to a broader computing platform.”
That changes the question for me.
Instead of asking:
“How much AI exposure am I getting?”
I'd ask:
“What kind of business is NVIDIA actually building underneath that exposure?”
For me:
The GPU is the product.
The platform is the business.
#bstockscis @BinanceCIS
52
·
--
I wanted to understand what actually happens inside a TermMax fixed-rate position.
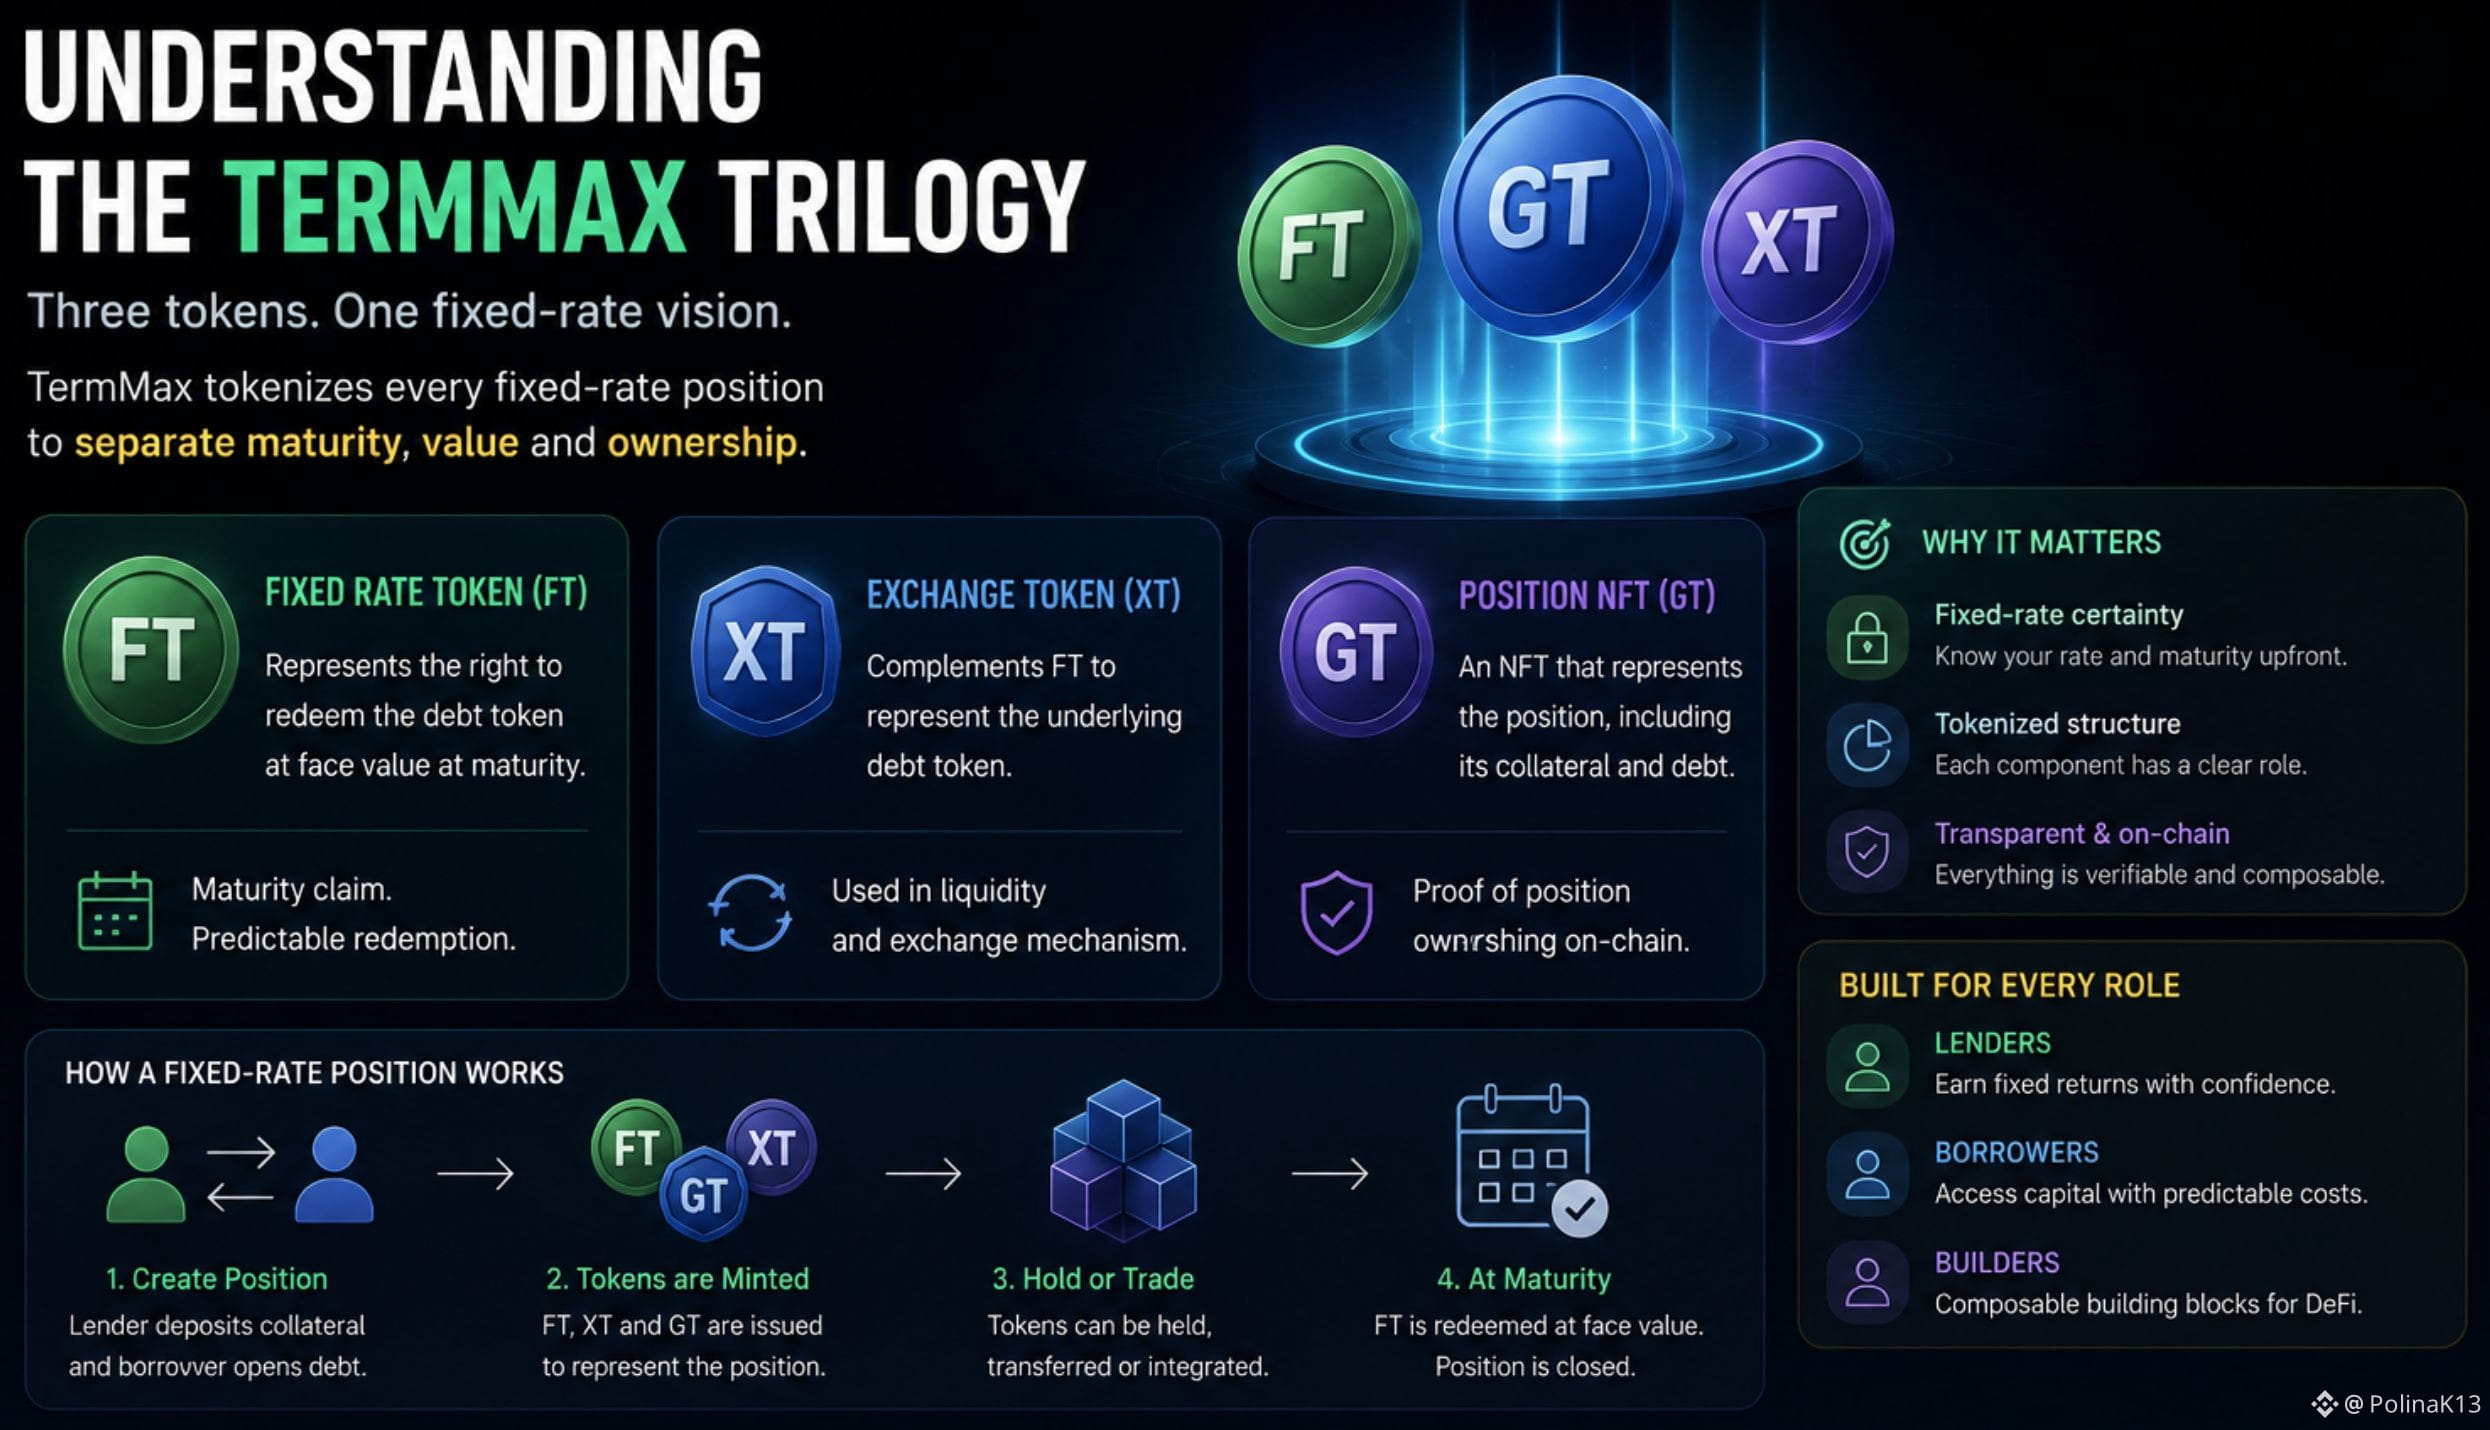
The architecture is built around three main tokens:
FT → represents the right to redeem the debt token at face value at maturity.
XT → complements FT to represent the underlying debt token and plays a role in the liquidity mechanism.
GT → an NFT representing the position, including its collateral and debt.
So TermMax isn’t simply saying “here is a fixed rate.”
It tokenizes different parts of the position and separates the maturity claim from the underlying economics.
For lenders, this creates a fixed-return position.
For borrowers, it creates financing with a defined maturity and rate structure.
That token architecture is probably one of the most interesting things to understand before judging TermMax as just another lending protocol.
#termmax @termmax
I wanted to understand what actually happens inside a TermMax fixed-rate position.
The architecture is built around three main tokens:
FT → represents the right to redeem the debt token at face value at maturity.
XT → complements FT to represent the underlying debt token and plays a role in the liquidity mechanism.
GT → an NFT representing the position, including its collateral and debt.
So TermMax isn’t simply saying “here is a fixed rate.”
It tokenizes different parts of the position and separates the maturity claim from the underlying economics.
For lenders, this creates a fixed-return position.
For borrowers, it creates financing with a defined maturity and rate structure.
That token architecture is probably one of the most interesting things to understand before judging TermMax as just another lending protocol.
#termmax @TermMax
The architecture is built around three main tokens:
FT → represents the right to redeem the debt token at face value at maturity.
XT → complements FT to represent the underlying debt token and plays a role in the liquidity mechanism.
GT → an NFT representing the position, including its collateral and debt.
So TermMax isn’t simply saying “here is a fixed rate.”
It tokenizes different parts of the position and separates the maturity claim from the underlying economics.
For lenders, this creates a fixed-return position.
For borrowers, it creates financing with a defined maturity and rate structure.
That token architecture is probably one of the most interesting things to understand before judging TermMax as just another lending protocol.
#termmax @TermMax
71
·
--
More USDC doesn't automatically mean proportionally more reserve income for Circle.
CRCLB is one of the bStocks that caught my attention because the obvious label is simple:
Circle = USDC.
So when USDC circulation grows, my first instinct is to expect Circle's reserve income to grow at roughly the same pace.
But the latest numbers made that assumption look too simple.
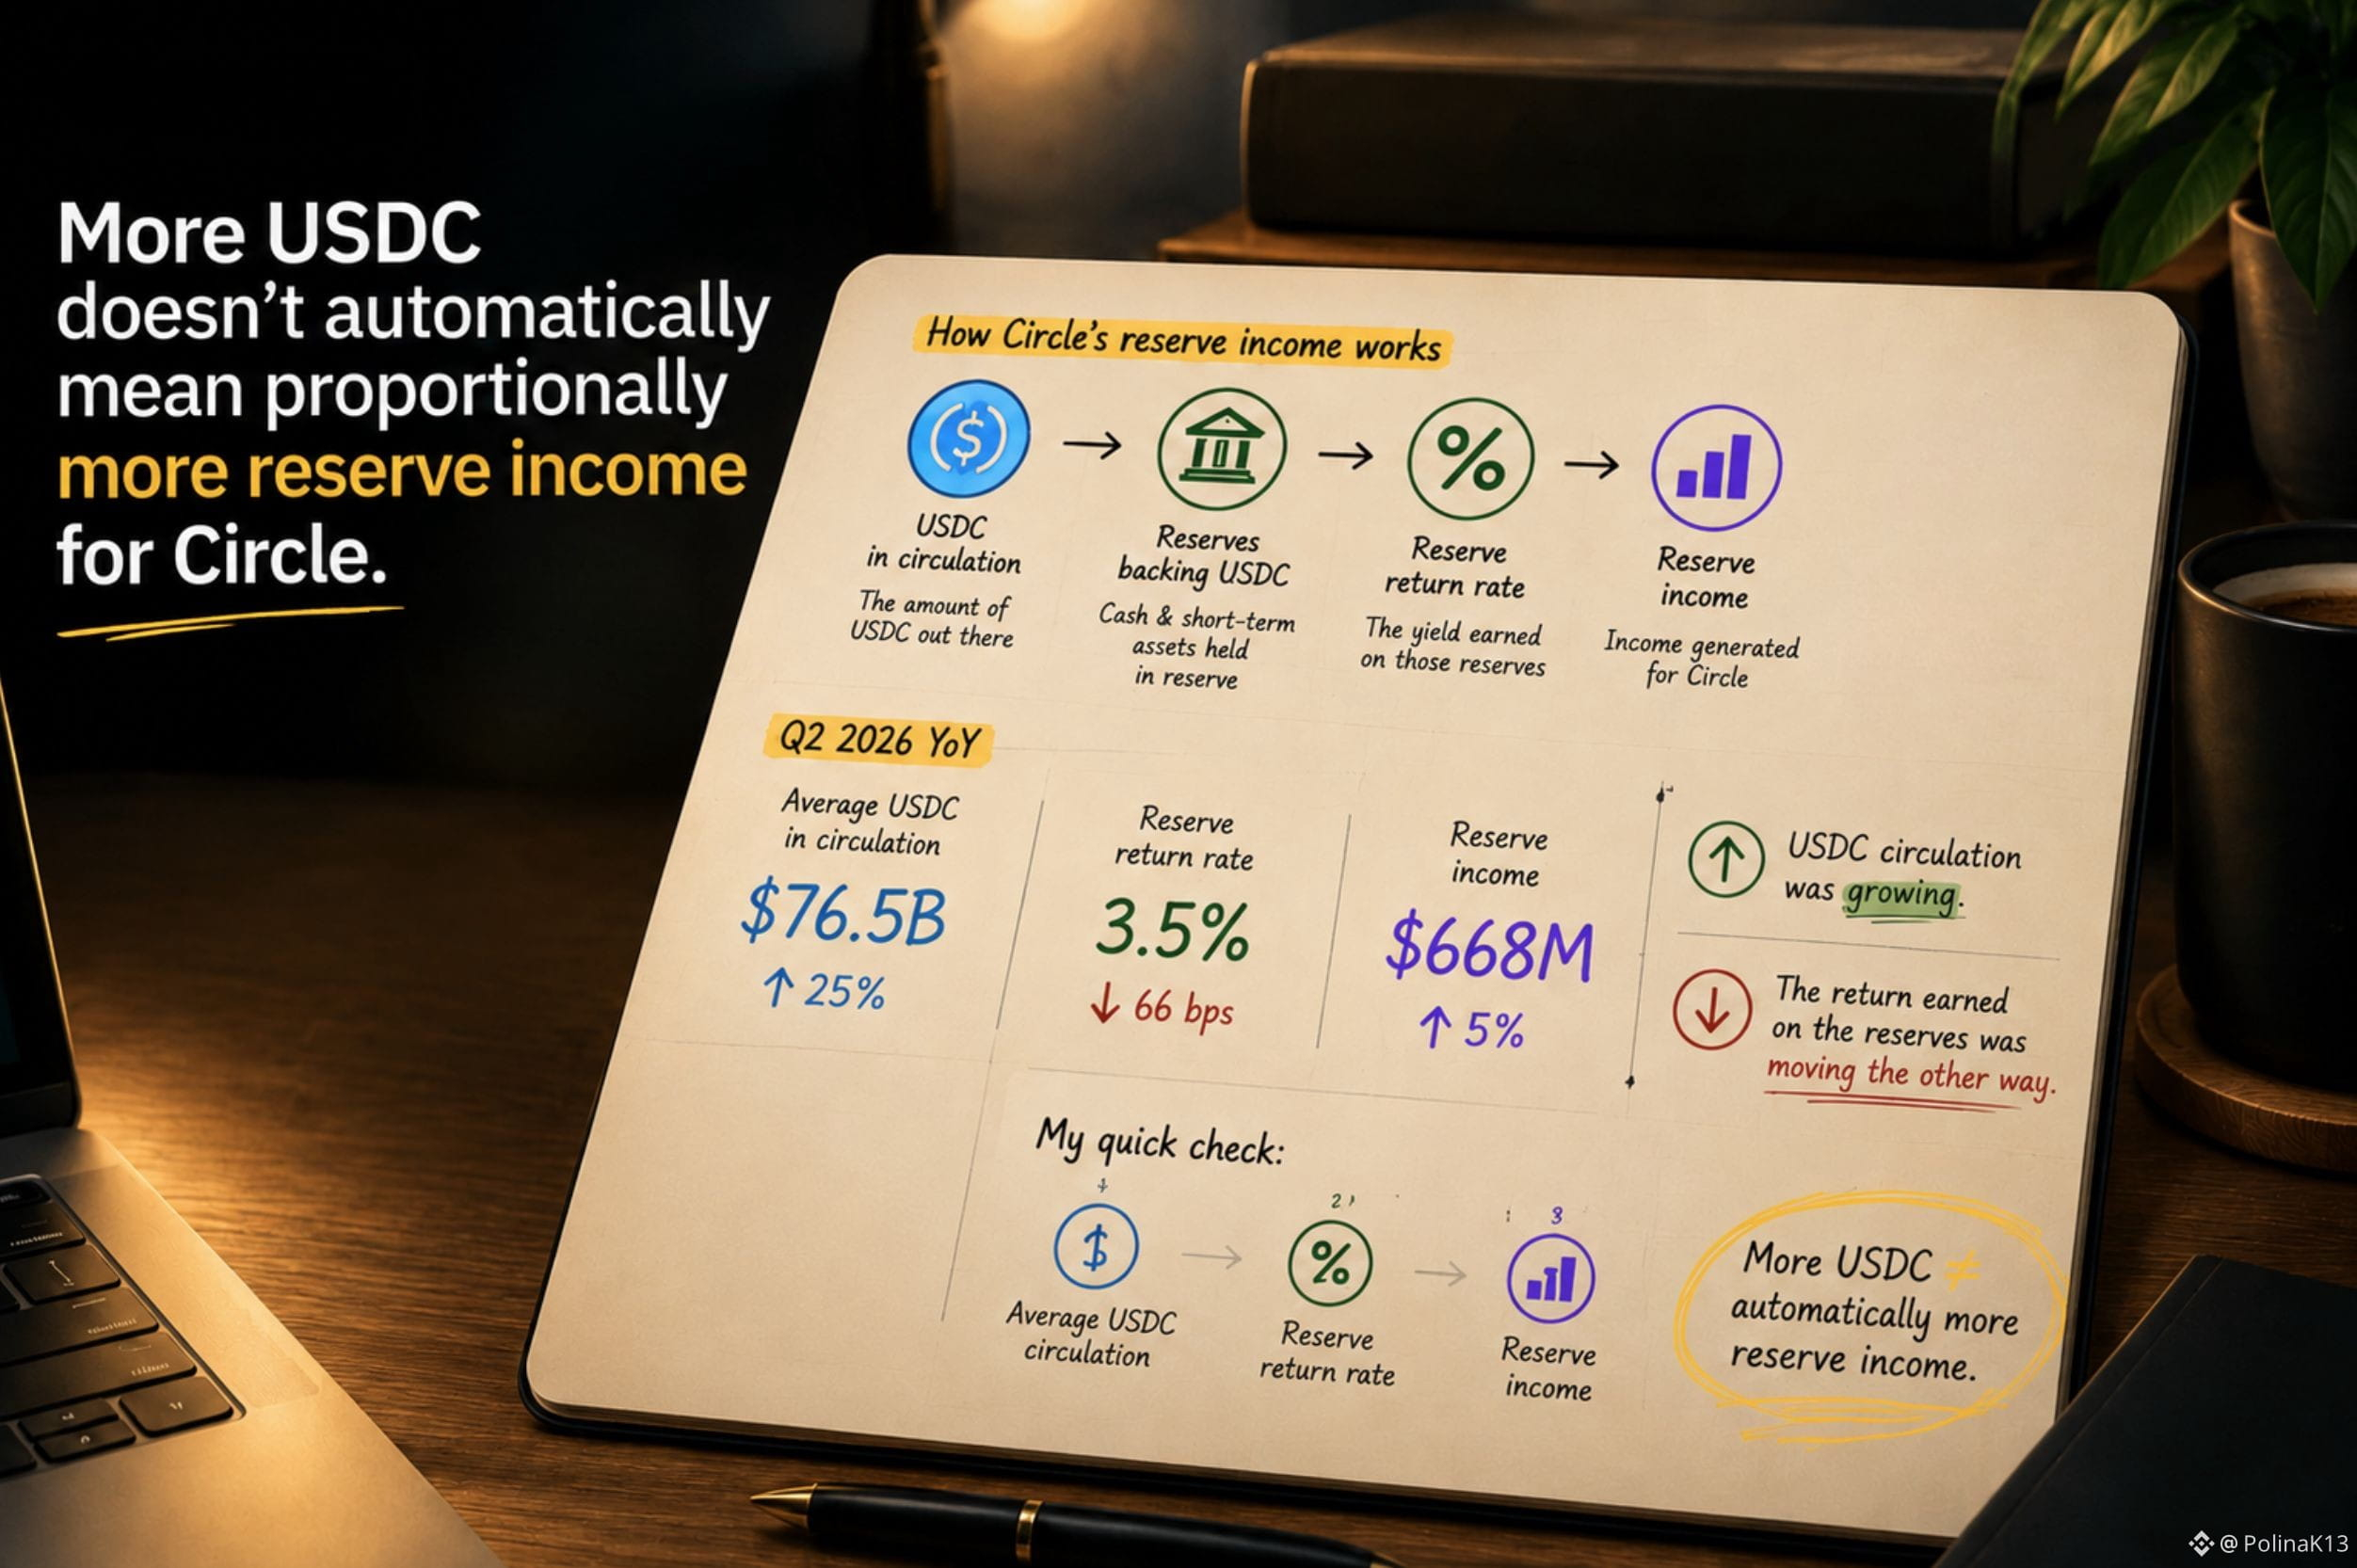
In Q2, average USDC in circulation reached about $76.5B, up 25% YoY.
Yet reserve income was about $668M, up only 5% YoY.
Why the gap?
Because reserve income depends on both the amount of USDC in circulation and the return earned on the reserves backing it.
And while circulation was growing, the reserve return rate fell to about 3.5%, down 66 bps YoY.
USDC circulation was growing. The return earned on the reserves was moving the other way.
That changed how I look at CRCLB.
I don't want to stop at:
“USDC adoption is growing.”
I want to ask:
“What is that growth actually doing to Circle's economics?”
My quick check would be:
1. Average USDC circulation
2. Reserve return rate
3. Reserve income
Because:
More USDC ≠ automatically more reserve income.
#bstockscis @BinanceCIS
More USDC doesn't automatically mean proportionally more reserve income for Circle.
CRCLB is one of the bStocks that caught my attention because the obvious label is simple:
Circle = USDC.
So when USDC circulation grows, my first instinct is to expect Circle's reserve income to grow at roughly the same pace.
But the latest numbers made that assumption look too simple.
In Q2, average USDC in circulation reached about $76.5B, up 25% YoY.
Yet reserve income was about $668M, up only 5% YoY.
Why the gap?
Because reserve income depends on both the amount of USDC in circulation and the return earned on the reserves backing it.
And while circulation was growing, the reserve return rate fell to about 3.5%, down 66 bps YoY.
USDC circulation was growing. The return earned on the reserves was moving the other way.
That changed how I look at CRCLB.
I don't want to stop at:
“USDC adoption is growing.”
I want to ask:
“What is that growth actually doing to Circle's economics?”
My quick check would be:
1. Average USDC circulation
2. Reserve return rate
3. Reserve income
Because:
More USDC ≠ automatically more reserve income.
#bstockscis @BinanceCIS
CRCLB is one of the bStocks that caught my attention because the obvious label is simple:
Circle = USDC.
So when USDC circulation grows, my first instinct is to expect Circle's reserve income to grow at roughly the same pace.
But the latest numbers made that assumption look too simple.
In Q2, average USDC in circulation reached about $76.5B, up 25% YoY.
Yet reserve income was about $668M, up only 5% YoY.
Why the gap?
Because reserve income depends on both the amount of USDC in circulation and the return earned on the reserves backing it.
And while circulation was growing, the reserve return rate fell to about 3.5%, down 66 bps YoY.
USDC circulation was growing. The return earned on the reserves was moving the other way.
That changed how I look at CRCLB.
I don't want to stop at:
“USDC adoption is growing.”
I want to ask:
“What is that growth actually doing to Circle's economics?”
My quick check would be:
1. Average USDC circulation
2. Reserve return rate
3. Reserve income
Because:
More USDC ≠ automatically more reserve income.
#bstockscis @BinanceCIS
2
1
212
·
--
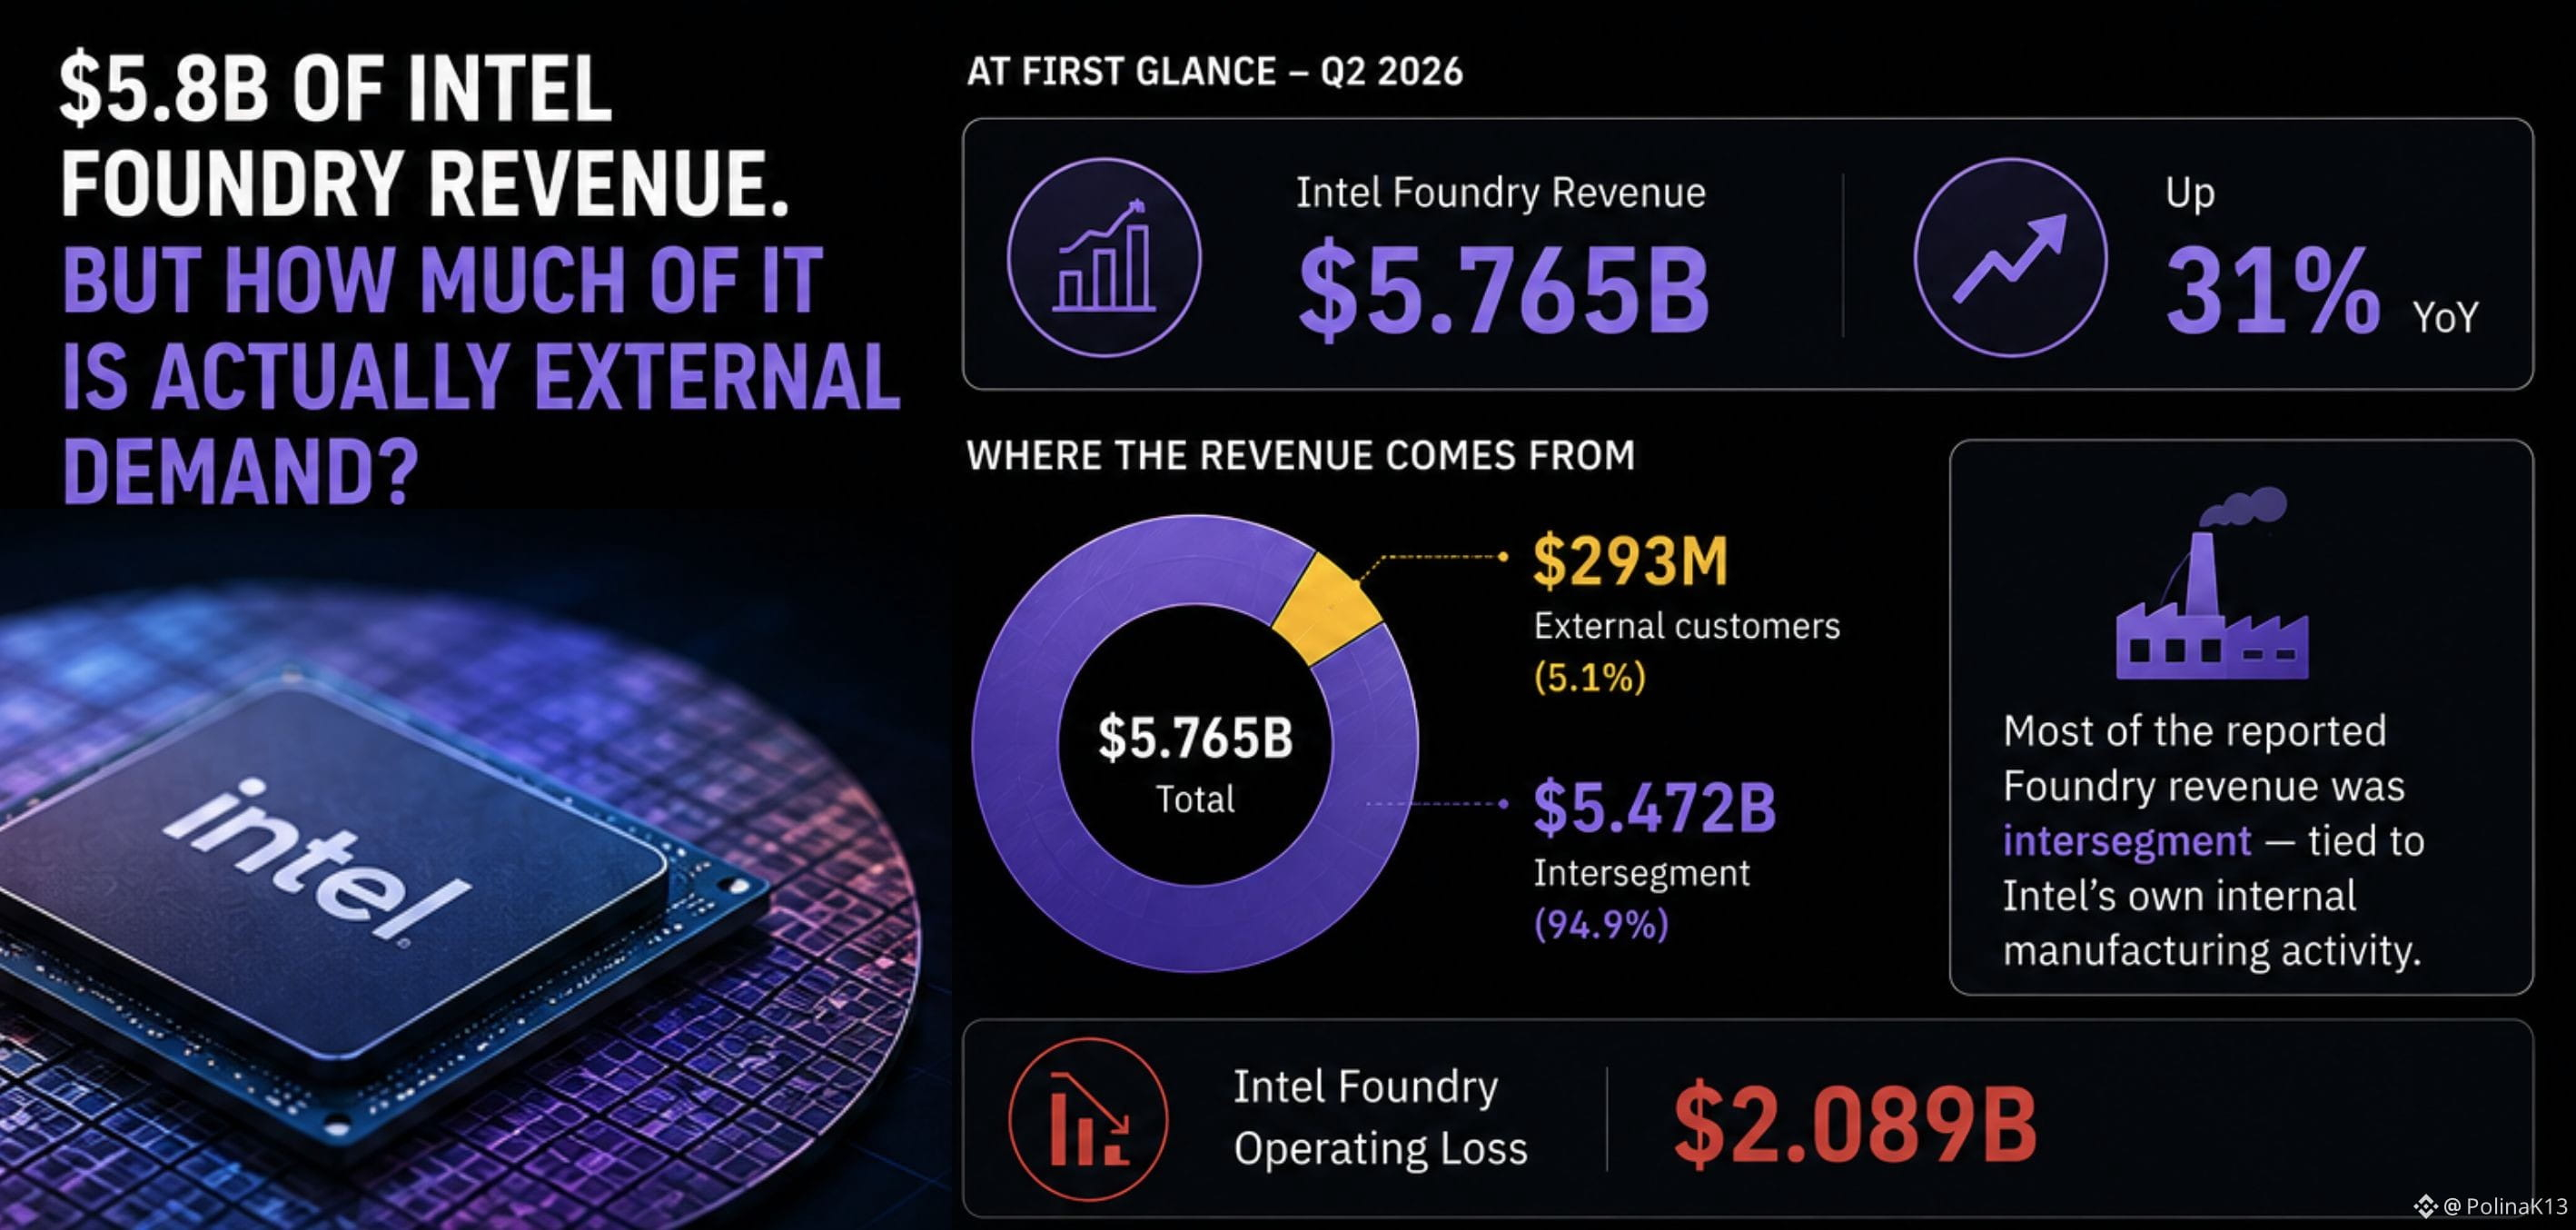
$5.8B of Intel Foundry revenue. But how much of it is actually external demand?
INTCB is one of the bStocks we can use to get exposure to Intel.
At first glance, Intel Foundry's Q2 revenue looks like a large foundry business:
$5.765B, up 31% YoY.
But then I looked one layer deeper.
Only $293M came from external customers.
Most of the reported Foundry revenue was intersegment — tied to Intel's own internal manufacturing activity. Intel also reported a $2.089B operating loss for the segment.
That changed how I read the headline number.
Foundry revenue ≠ external foundry demand.
A segment can be large before its external customer business is.
So when I look at INTCB, I don't just want to know:
“How big is Intel Foundry?”
I want to know:
“How much of that business is actually being bought by outside customers?”
For me, that's a much more useful way to read a foundry story.
#bstockscis @BinanceCIS
$5.8B of Intel Foundry revenue. But how much of it is actually external demand?
INTCB is one of the bStocks we can use to get exposure to Intel.
At first glance, Intel Foundry's Q2 revenue looks like a large foundry business:
$5.765B, up 31% YoY.
But then I looked one layer deeper.
Only $293M came from external customers.
Most of the reported Foundry revenue was intersegment — tied to Intel's own internal manufacturing activity. Intel also reported a $2.089B operating loss for the segment.
That changed how I read the headline number.
Foundry revenue ≠ external foundry demand.
A segment can be large before its external customer business is.
So when I look at INTCB, I don't just want to know:
“How big is Intel Foundry?”
I want to know:
“How much of that business is actually being bought by outside customers?”
For me, that's a much more useful way to read a foundry story.
#bstockscis @BinanceCIS
INTCB is one of the bStocks we can use to get exposure to Intel.
At first glance, Intel Foundry's Q2 revenue looks like a large foundry business:
$5.765B, up 31% YoY.
But then I looked one layer deeper.
Only $293M came from external customers.
Most of the reported Foundry revenue was intersegment — tied to Intel's own internal manufacturing activity. Intel also reported a $2.089B operating loss for the segment.
That changed how I read the headline number.
Foundry revenue ≠ external foundry demand.
A segment can be large before its external customer business is.
So when I look at INTCB, I don't just want to know:
“How big is Intel Foundry?”
I want to know:
“How much of that business is actually being bought by outside customers?”
For me, that's a much more useful way to read a foundry story.
#bstockscis @BinanceCIS
4
2
91
·
--
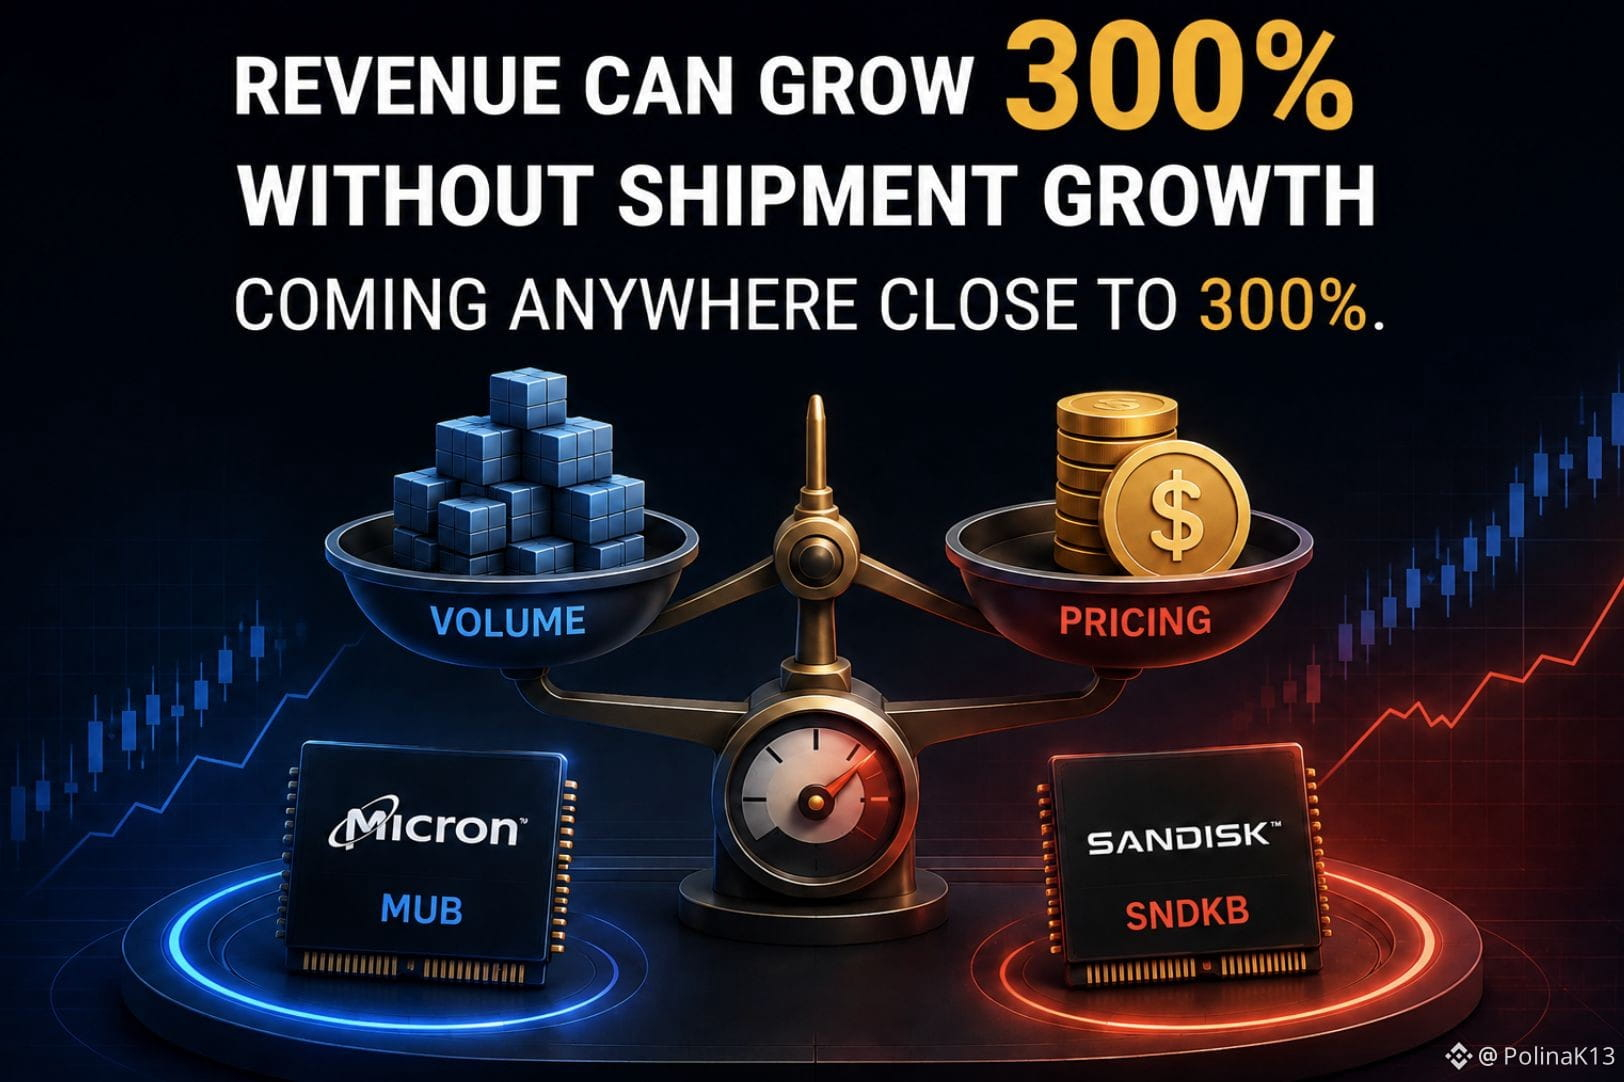
Revenue can grow 300%+ without shipment growth coming anywhere close to 300%.
MUB and SNDKB are both available as bStocks and sit in the broader semiconductor/memory universe.
So at first glance, it’s easy to group them into the same broader semiconductor growth story.
But look at what’s actually driving the numbers.
For Micron, DRAM revenue reached $31.3B in fiscal Q3, up 343% YoY and representing 76% of total revenue.
Yet DRAM bit shipments grew only in the low-20% range YoY, while DRAM ASPs increased in the low-260% range.
In other words, DRAM revenue growth wasn't simply about selling dramatically more bits.
SanDisk's latest quarter tells a similar story from a different angle.
Its fiscal Q4 revenue reached $8.97B, up 51% sequentially — with roughly one-third of the sequential increase coming from higher volume and two-thirds from higher pricing.
That made me rethink how I read “growth” when looking at bStocks.
The ticker tells me which company I'm getting exposure to.
But the headline growth number doesn't automatically tell me what is driving that exposure.
Two bStocks can sit in the same broad category while very different things drive their financial results.
Before comparing growth rates, ask what's underneath the growth.
#bstockscis @BinanceCIS
Revenue can grow 300%+ without shipment growth coming anywhere close to 300%.
MUB and SNDKB are both available as bStocks and sit in the broader semiconductor/memory universe.
So at first glance, it’s easy to group them into the same broader semiconductor growth story.
But look at what’s actually driving the numbers.
For Micron, DRAM revenue reached $31.3B in fiscal Q3, up 343% YoY and representing 76% of total revenue.
Yet DRAM bit shipments grew only in the low-20% range YoY, while DRAM ASPs increased in the low-260% range.
In other words, DRAM revenue growth wasn't simply about selling dramatically more bits.
SanDisk's latest quarter tells a similar story from a different angle.
Its fiscal Q4 revenue reached $8.97B, up 51% sequentially — with roughly one-third of the sequential increase coming from higher volume and two-thirds from higher pricing.
That made me rethink how I read “growth” when looking at bStocks.
The ticker tells me which company I'm getting exposure to.
But the headline growth number doesn't automatically tell me what is driving that exposure.
Two bStocks can sit in the same broad category while very different things drive their financial results.
Before comparing growth rates, ask what's underneath the growth.
#bstockscis @BinanceCIS
MUB and SNDKB are both available as bStocks and sit in the broader semiconductor/memory universe.
So at first glance, it’s easy to group them into the same broader semiconductor growth story.
But look at what’s actually driving the numbers.
For Micron, DRAM revenue reached $31.3B in fiscal Q3, up 343% YoY and representing 76% of total revenue.
Yet DRAM bit shipments grew only in the low-20% range YoY, while DRAM ASPs increased in the low-260% range.
In other words, DRAM revenue growth wasn't simply about selling dramatically more bits.
SanDisk's latest quarter tells a similar story from a different angle.
Its fiscal Q4 revenue reached $8.97B, up 51% sequentially — with roughly one-third of the sequential increase coming from higher volume and two-thirds from higher pricing.
That made me rethink how I read “growth” when looking at bStocks.
The ticker tells me which company I'm getting exposure to.
But the headline growth number doesn't automatically tell me what is driving that exposure.
Two bStocks can sit in the same broad category while very different things drive their financial results.
Before comparing growth rates, ask what's underneath the growth.
#bstockscis @BinanceCIS
2
1
130
·
--
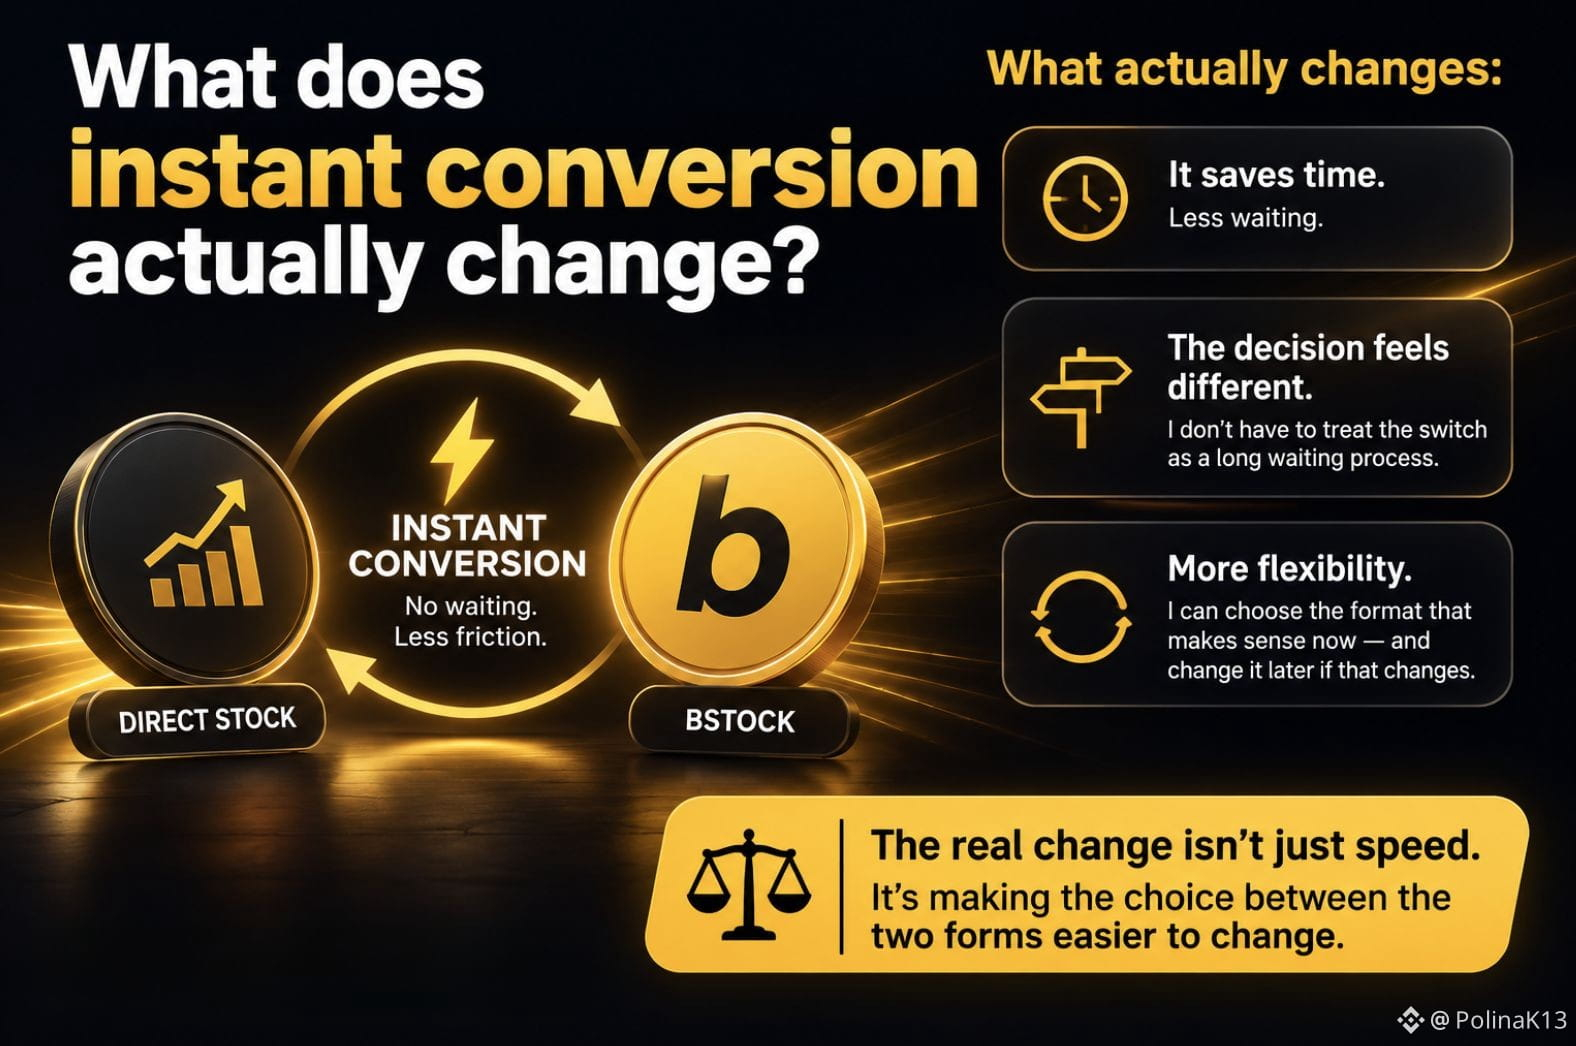
What does instant conversion actually change?
When I first saw that eligible stocks can be converted into bStocks instantly, I thought the main benefit was obvious:
It saves time.
But the more I thought about it, the less that seemed to be the whole story.
If moving between a direct stock and a bStock doesn't require me to wait for a traditional conversion process, the decision itself starts to feel different.
I don't have to treat the switch as a decision that comes with a long waiting period.
I can choose the format that makes sense for what I want to do now — and change it later if that changes.
That made me look at the word “instant” differently.
It's not just about how quickly the conversion happens.
It's about how much friction there is in changing my decision.
So I started wondering:
Does instant conversion simply save time, or does it make switching between the two forms of exposure a different kind of decision?
For me, that's the more interesting part.
The value isn't only in getting from one form to another faster.
It's in making the choice between them easier to change.
#bstockscis @BinanceCIS
What does instant conversion actually change?
When I first saw that eligible stocks can be converted into bStocks instantly, I thought the main benefit was obvious:
It saves time.
But the more I thought about it, the less that seemed to be the whole story.
If moving between a direct stock and a bStock doesn't require me to wait for a traditional conversion process, the decision itself starts to feel different.
I don't have to treat the switch as a decision that comes with a long waiting period.
I can choose the format that makes sense for what I want to do now — and change it later if that changes.
That made me look at the word “instant” differently.
It's not just about how quickly the conversion happens.
It's about how much friction there is in changing my decision.
So I started wondering:
Does instant conversion simply save time, or does it make switching between the two forms of exposure a different kind of decision?
For me, that's the more interesting part.
The value isn't only in getting from one form to another faster.
It's in making the choice between them easier to change.
#bstockscis @BinanceCIS
When I first saw that eligible stocks can be converted into bStocks instantly, I thought the main benefit was obvious:
It saves time.
But the more I thought about it, the less that seemed to be the whole story.
If moving between a direct stock and a bStock doesn't require me to wait for a traditional conversion process, the decision itself starts to feel different.
I don't have to treat the switch as a decision that comes with a long waiting period.
I can choose the format that makes sense for what I want to do now — and change it later if that changes.
That made me look at the word “instant” differently.
It's not just about how quickly the conversion happens.
It's about how much friction there is in changing my decision.
So I started wondering:
Does instant conversion simply save time, or does it make switching between the two forms of exposure a different kind of decision?
For me, that's the more interesting part.
The value isn't only in getting from one form to another faster.
It's in making the choice between them easier to change.
#bstockscis @BinanceCIS
85
·
--
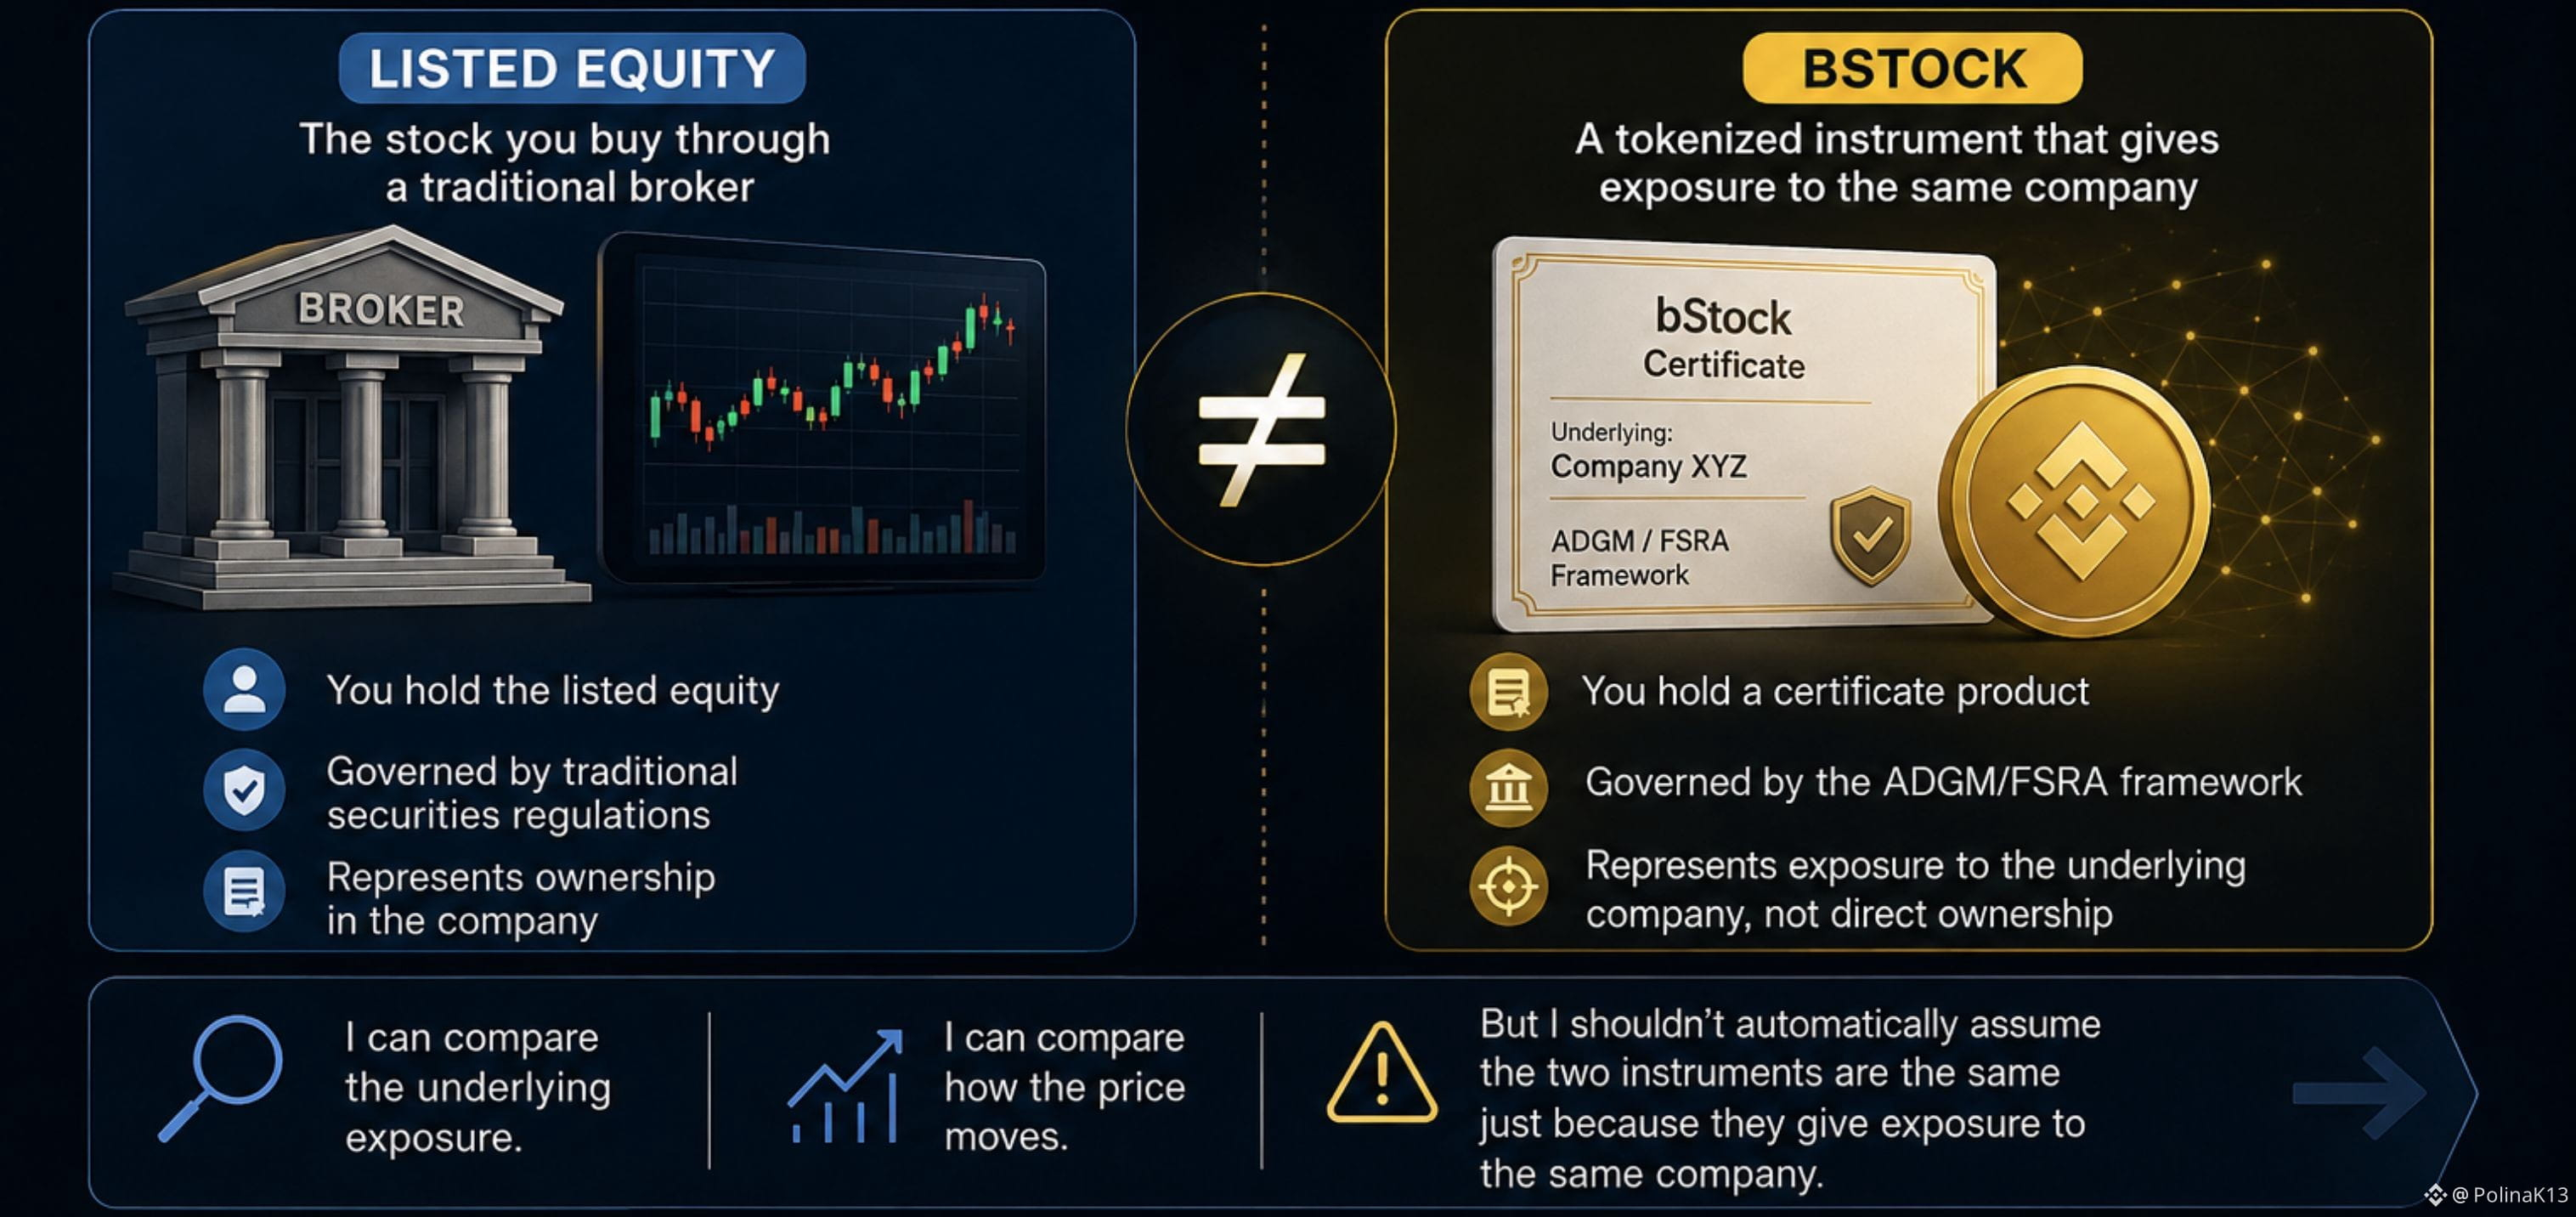
If a bStock tracks a listed stock, is it the same financial product?
When I first looked at bStocks, I naturally made a simple connection.
If a bStock gives me exposure to a listed company, I assumed the product itself should be pretty similar to the stock I would buy through a traditional broker.
But that's where I realized I was mixing two different things.
A bStock can give me exposure to the same underlying company without being the listed equity itself.
It is a certificate product under the ADGM/FSRA framework, rather than the listed equity.
And that distinction matters.
Two products can give me exposure to the same company without being the same financial product.
That made me change the question I ask when looking at a bStock.
Not only:
“Which company am I getting exposure to?”
But also:
“What kind of financial product am I actually holding?”
I can compare the underlying exposure.
I can compare how the price moves.
But I shouldn't automatically assume that the two instruments are the same just because they give me exposure to the same company.
For me, that's one of the important distinctions to understand with tokenized assets.
Same underlying company doesn't necessarily mean the same financial product.
#bstockscis @BinanceCIS
If a bStock tracks a listed stock, is it the same financial product?
When I first looked at bStocks, I naturally made a simple connection.
If a bStock gives me exposure to a listed company, I assumed the product itself should be pretty similar to the stock I would buy through a traditional broker.
But that's where I realized I was mixing two different things.
A bStock can give me exposure to the same underlying company without being the listed equity itself.
It is a certificate product under the ADGM/FSRA framework, rather than the listed equity.
And that distinction matters.
Two products can give me exposure to the same company without being the same financial product.
That made me change the question I ask when looking at a bStock.
Not only:
“Which company am I getting exposure to?”
But also:
“What kind of financial product am I actually holding?”
I can compare the underlying exposure.
I can compare how the price moves.
But I shouldn't automatically assume that the two instruments are the same just because they give me exposure to the same company.
For me, that's one of the important distinctions to understand with tokenized assets.
Same underlying company doesn't necessarily mean the same financial product.
#bstockscis @BinanceCIS
When I first looked at bStocks, I naturally made a simple connection.
If a bStock gives me exposure to a listed company, I assumed the product itself should be pretty similar to the stock I would buy through a traditional broker.
But that's where I realized I was mixing two different things.
A bStock can give me exposure to the same underlying company without being the listed equity itself.
It is a certificate product under the ADGM/FSRA framework, rather than the listed equity.
And that distinction matters.
Two products can give me exposure to the same company without being the same financial product.
That made me change the question I ask when looking at a bStock.
Not only:
“Which company am I getting exposure to?”
But also:
“What kind of financial product am I actually holding?”
I can compare the underlying exposure.
I can compare how the price moves.
But I shouldn't automatically assume that the two instruments are the same just because they give me exposure to the same company.
For me, that's one of the important distinctions to understand with tokenized assets.
Same underlying company doesn't necessarily mean the same financial product.
#bstockscis @BinanceCIS
73
·
--
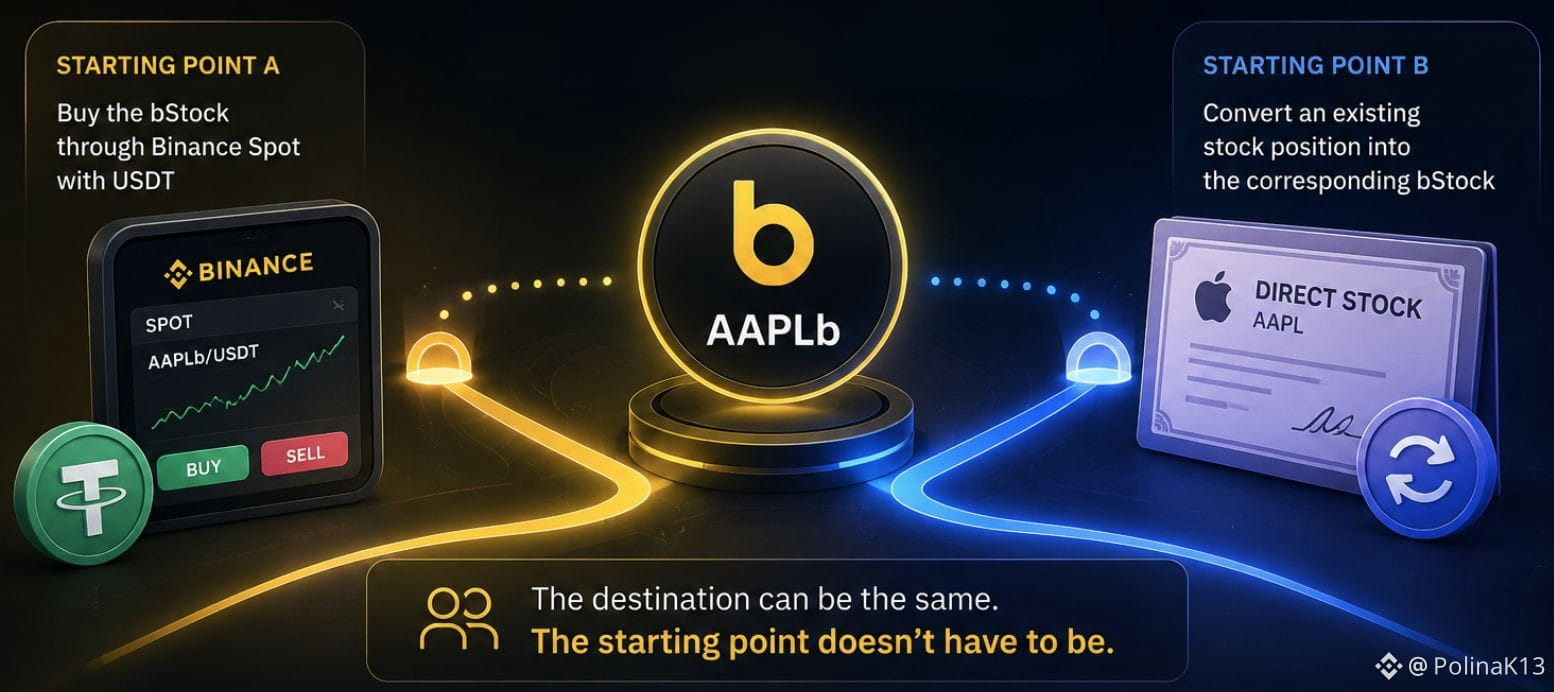
Why can the same bStock have completely different starting points?
When I first looked at bStocks, I mostly thought about the token itself.
Then I started thinking about the person holding it.
Two people can end up with the same bStock while coming from completely different places.
One might already hold USDT and buy the bStock through Binance Spot.
Someone else might already have exposure to the underlying stock and enter the same bStock through the conversion route.
Same token.
Different starting point.
And I think that's more interesting than it first sounds.
Tokenization doesn't necessarily have to be a completely new path for someone entering the market.
It can also become another format for someone who already has exposure to the underlying asset.
That's why I started looking at bStocks less as a single way to access stocks and more as a bridge between different starting points.
The question isn't only:
“How do I get this bStock?”
It's:
“Where am I starting from before I get there?”
For me, that's one of the more interesting things about tokenized assets.
The destination can be the same.
The starting point doesn't have to be.
#bstockscis @BinanceCIS
Why can the same bStock have completely different starting points?
When I first looked at bStocks, I mostly thought about the token itself.
Then I started thinking about the person holding it.
Two people can end up with the same bStock while coming from completely different places.
One might already hold USDT and buy the bStock through Binance Spot.
Someone else might already have exposure to the underlying stock and enter the same bStock through the conversion route.
Same token.
Different starting point.
And I think that's more interesting than it first sounds.
Tokenization doesn't necessarily have to be a completely new path for someone entering the market.
It can also become another format for someone who already has exposure to the underlying asset.
That's why I started looking at bStocks less as a single way to access stocks and more as a bridge between different starting points.
The question isn't only:
“How do I get this bStock?”
It's:
“Where am I starting from before I get there?”
For me, that's one of the more interesting things about tokenized assets.
The destination can be the same.
The starting point doesn't have to be.
#bstockscis @BinanceCIS
When I first looked at bStocks, I mostly thought about the token itself.
Then I started thinking about the person holding it.
Two people can end up with the same bStock while coming from completely different places.
One might already hold USDT and buy the bStock through Binance Spot.
Someone else might already have exposure to the underlying stock and enter the same bStock through the conversion route.
Same token.
Different starting point.
And I think that's more interesting than it first sounds.
Tokenization doesn't necessarily have to be a completely new path for someone entering the market.
It can also become another format for someone who already has exposure to the underlying asset.
That's why I started looking at bStocks less as a single way to access stocks and more as a bridge between different starting points.
The question isn't only:
“How do I get this bStock?”
It's:
“Where am I starting from before I get there?”
For me, that's one of the more interesting things about tokenized assets.
The destination can be the same.
The starting point doesn't have to be.
#bstockscis @BinanceCIS
3
1
95
Войдите, чтобы посмотреть больше материала
Присоединяйтесь к пользователям криптовалют по всему миру на Binance Square
⚡️ Получайте новейшую и полезную информацию о криптоактивах.
💬 Нам доверяет крупнейшая в мире криптобиржа.
👍 Получите достоверные аналитические данные от верифицированных создателей контента.
Эл. почта/номер телефона