
Sackman
277 Публикации

Sackman
Отправить жалобу
Заблокировать пользователя
MAGNET
Открытая сделка
Случайный трейдер
5.4 г
13 подписок(и/а)
53 подписчиков(а)
112 понравилось
Посты
Портфель
Все
Цитирования
Видео
·
--
Статья
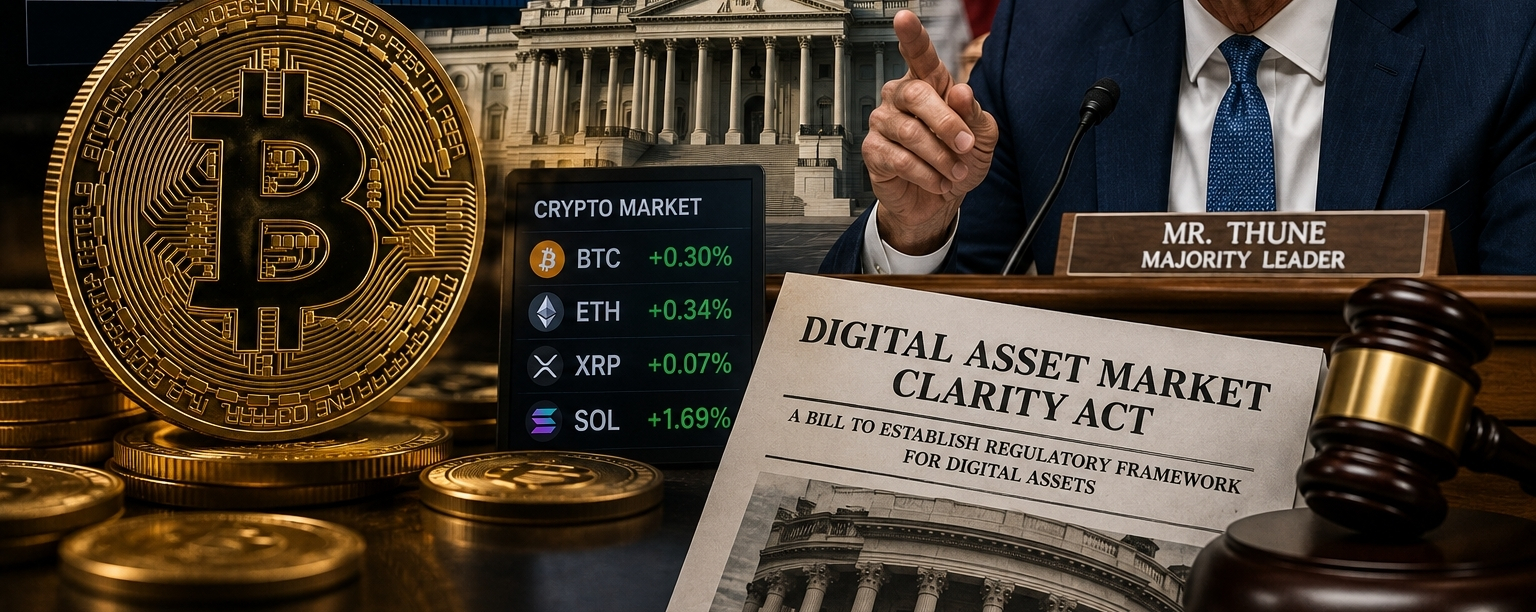
Bitcoin at $65K: Whales Accumulate as the Clarity Act Moves ForwardBitcoin is back near $65,000, but the bigger story is happening beneath the price.
The U.S. Senate has officially opened the first procedural stage for the Digital Asset Market Clarity Act, keeping one of crypto's most important U.S. regulatory bills alive for September.
The bill still faces a difficult path.
It needs 60 Senate votes, and lawmakers remain divided over government-ethics rules, stablecoin rewards, illicit-finance protections and other provisions.
But politically, the story has changed.
The Clarity Act is no longer simply waiting for a vote.
The process has started.
Meanwhile, Bitcoin whales are accumulating. 🐋
Wallets holding between 10 and 10,000 BTC accumulated more than 20,000 BTC, worth roughly $1.2 billion, since July 29.
At the same time, U.S. spot Bitcoin ETFs attracted approximately $754 million in weekly inflows.
That creates an interesting market structure:
🐋 Large holders are accumulating
🏦 Institutional money is returning
🏛️ U.S. crypto legislation is progressing
📊 Bitcoin is testing the $65K area
Yet BTC hasn't produced a decisive breakout.
That tells us the market is still cautious.
The macro environment remains the major obstacle.
Oil prices have moved higher again, bringing inflation concerns back into focus. Higher inflation expectations can keep Treasury yields elevated and reduce the appetite for risk assets such as Bitcoin.
So the market is currently caught between two forces:
Institutional accumulation vs. macroeconomic pressure.
Where could Bitcoin go next?
If BTC can establish a convincing break above $65K, momentum could strengthen toward $70K, with the $76K area becoming an important upside target.
If $65K continues to reject price, Bitcoin could remain trapped between roughly $60K and $65K.
And if oil, yields and the dollar continue rising while BTC loses $60K, the market could enter another deeper correction.
But there is something important to watch.
The combination of ETF inflows + whale accumulation + potential U.S. regulatory clarity could become much more powerful if macro conditions turn supportive.
That is where the next major move could come from.
The question isn't simply:
“Will Bitcoin go up?”
The bigger question is:
“Are whales and institutions positioning before the market receives the regulatory and liquidity conditions needed for the next expansion?”
September could provide an important answer.
For now, $65K remains the level to watch.
#bitcoin #BTC #crypto #CryptoNews #BinanceSquare
Bitcoin at $65K: Whales Accumulate as the Clarity Act Moves Forward
Bitcoin is back near $65,000, but the bigger story is happening beneath the price.
The U.S. Senate has officially opened the first procedural stage for the Digital Asset Market Clarity Act, keeping one of crypto's most important U.S. regulatory bills alive for September.
The bill still faces a difficult path.
It needs 60 Senate votes, and lawmakers remain divided over government-ethics rules, stablecoin rewards, illicit-finance protections and other provisions.
But politically, the story has changed.
The Clarity Act is no longer simply waiting for a vote.
The process has started.
Meanwhile, Bitcoin whales are accumulating. 🐋
Wallets holding between 10 and 10,000 BTC accumulated more than 20,000 BTC, worth roughly $1.2 billion, since July 29.
At the same time, U.S. spot Bitcoin ETFs attracted approximately $754 million in weekly inflows.
That creates an interesting market structure:
🐋 Large holders are accumulating
🏦 Institutional money is returning
🏛️ U.S. crypto legislation is progressing
📊 Bitcoin is testing the $65K area
Yet BTC hasn't produced a decisive breakout.
That tells us the market is still cautious.
The macro environment remains the major obstacle.
Oil prices have moved higher again, bringing inflation concerns back into focus. Higher inflation expectations can keep Treasury yields elevated and reduce the appetite for risk assets such as Bitcoin.
So the market is currently caught between two forces:
Institutional accumulation vs. macroeconomic pressure.
Where could Bitcoin go next?
If BTC can establish a convincing break above $65K, momentum could strengthen toward $70K, with the $76K area becoming an important upside target.
If $65K continues to reject price, Bitcoin could remain trapped between roughly $60K and $65K.
And if oil, yields and the dollar continue rising while BTC loses $60K, the market could enter another deeper correction.
But there is something important to watch.
The combination of ETF inflows + whale accumulation + potential U.S. regulatory clarity could become much more powerful if macro conditions turn supportive.
That is where the next major move could come from.
The question isn't simply:
“Will Bitcoin go up?”
The bigger question is:
“Are whales and institutions positioning before the market receives the regulatory and liquidity conditions needed for the next expansion?”
September could provide an important answer.
For now, $65K remains the level to watch.
#bitcoin #BTC #crypto #CryptoNews #BinanceSquare
The U.S. Senate has officially opened the first procedural stage for the Digital Asset Market Clarity Act, keeping one of crypto's most important U.S. regulatory bills alive for September.
The bill still faces a difficult path.
It needs 60 Senate votes, and lawmakers remain divided over government-ethics rules, stablecoin rewards, illicit-finance protections and other provisions.
But politically, the story has changed.
The Clarity Act is no longer simply waiting for a vote.
The process has started.
Meanwhile, Bitcoin whales are accumulating. 🐋
Wallets holding between 10 and 10,000 BTC accumulated more than 20,000 BTC, worth roughly $1.2 billion, since July 29.
At the same time, U.S. spot Bitcoin ETFs attracted approximately $754 million in weekly inflows.
That creates an interesting market structure:
🐋 Large holders are accumulating
🏦 Institutional money is returning
🏛️ U.S. crypto legislation is progressing
📊 Bitcoin is testing the $65K area
Yet BTC hasn't produced a decisive breakout.
That tells us the market is still cautious.
The macro environment remains the major obstacle.
Oil prices have moved higher again, bringing inflation concerns back into focus. Higher inflation expectations can keep Treasury yields elevated and reduce the appetite for risk assets such as Bitcoin.
So the market is currently caught between two forces:
Institutional accumulation vs. macroeconomic pressure.
Where could Bitcoin go next?
If BTC can establish a convincing break above $65K, momentum could strengthen toward $70K, with the $76K area becoming an important upside target.
If $65K continues to reject price, Bitcoin could remain trapped between roughly $60K and $65K.
And if oil, yields and the dollar continue rising while BTC loses $60K, the market could enter another deeper correction.
But there is something important to watch.
The combination of ETF inflows + whale accumulation + potential U.S. regulatory clarity could become much more powerful if macro conditions turn supportive.
That is where the next major move could come from.
The question isn't simply:
“Will Bitcoin go up?”
The bigger question is:
“Are whales and institutions positioning before the market receives the regulatory and liquidity conditions needed for the next expansion?”
September could provide an important answer.
For now, $65K remains the level to watch.
#bitcoin #BTC #crypto #CryptoNews #BinanceSquare
87
·
--
$BTC MARKET UPDATE 📊
Bitcoin Holds Near $64.3K as US Jobs Report Meets Rising Oil Pressure
Bitcoin is holding around $64,300, with traders waiting for the latest U.S. jobs report a key macro catalyst that could determine whether BTC finally breaks out of its current range.
The bigger picture is mixed.
🟡 $BTC: ~$64,284, down 0.91%
🔵 $ETH: ~$1,902, down 0.63%
⚫ $XRP: ~$1.03, down 2.52%
🟣 $SOL: ~$72.90, down 1.37%
🇺🇸 Jobs data takes center stage
A weaker-than-expected U.S. jobs report could strengthen expectations for easier Federal Reserve policy, potentially supporting risk assets such as crypto.
But a strong jobs print could reinforce the case for higher-for-longer rates.
And there is another pressure point: oil.
Brent crude climbed around 1.4% to $83.61 after renewed tensions around the Strait of Hormuz. Higher oil prices can increase inflation concerns, potentially keeping financial conditions tighter and limiting upside for risk assets.
🧠 What traders are watching
The important reaction may not simply be the headline jobs number.
Watch U.S. Treasury yields and the dollar.
If jobs data eases rate concerns and yields fall, $BTC could get room to push higher.
If employment remains strong while oil continues climbing, markets could interpret the combination as another reason for the Fed to stay restrictive.
Meanwhile, Bitcoin whales have recently accumulated more than 20,000 BTC worth roughly $1.2 billion, while U.S. spot Bitcoin ETFs attracted approximately $754.69 million this week.
That creates an interesting contrast:
Large players are accumulating but BTC is still struggling to escape its range.
For now, $BTC remains a market waiting for its next major catalyst.
Watch the data. Watch yields. Watch the reaction.
⚠️ This is market information for educational purposes, not financial advice. DYOR.
#BinanceSquare #CryptoMarket #Bitcoin #BTC #ETH #XRP #sol #CryptoNews
$BTC MARKET UPDATE 📊
Bitcoin Holds Near $64.3K as US Jobs Report Meets Rising Oil Pressure
Bitcoin is holding around $64,300, with traders waiting for the latest U.S. jobs report a key macro catalyst that could determine whether BTC finally breaks out of its current range.
The bigger picture is mixed.
🟡 $BTC: ~$64,284, down 0.91%
🔵 $ETH: ~$1,902, down 0.63%
⚫ $XRP: ~$1.03, down 2.52%
🟣 $SOL: ~$72.90, down 1.37%
🇺🇸 Jobs data takes center stage
A weaker-than-expected U.S. jobs report could strengthen expectations for easier Federal Reserve policy, potentially supporting risk assets such as crypto.
But a strong jobs print could reinforce the case for higher-for-longer rates.
And there is another pressure point: oil.
Brent crude climbed around 1.4% to $83.61 after renewed tensions around the Strait of Hormuz. Higher oil prices can increase inflation concerns, potentially keeping financial conditions tighter and limiting upside for risk assets.
🧠 What traders are watching
The important reaction may not simply be the headline jobs number.
Watch U.S. Treasury yields and the dollar.
If jobs data eases rate concerns and yields fall, $BTC could get room to push higher.
If employment remains strong while oil continues climbing, markets could interpret the combination as another reason for the Fed to stay restrictive.
Meanwhile, Bitcoin whales have recently accumulated more than 20,000 BTC worth roughly $1.2 billion, while U.S. spot Bitcoin ETFs attracted approximately $754.69 million this week.
That creates an interesting contrast:
Large players are accumulating but BTC is still struggling to escape its range.
For now, $BTC remains a market waiting for its next major catalyst.
Watch the data. Watch yields. Watch the reaction.
⚠️ This is market information for educational purposes, not financial advice. DYOR.
#BinanceSquare #CryptoMarket #Bitcoin #BTC #ETH #XRP #sol #CryptoNews
Bitcoin Holds Near $64.3K as US Jobs Report Meets Rising Oil Pressure
Bitcoin is holding around $64,300, with traders waiting for the latest U.S. jobs report a key macro catalyst that could determine whether BTC finally breaks out of its current range.
The bigger picture is mixed.
🟡 $BTC: ~$64,284, down 0.91%
🔵 $ETH: ~$1,902, down 0.63%
⚫ $XRP: ~$1.03, down 2.52%
🟣 $SOL: ~$72.90, down 1.37%
🇺🇸 Jobs data takes center stage
A weaker-than-expected U.S. jobs report could strengthen expectations for easier Federal Reserve policy, potentially supporting risk assets such as crypto.
But a strong jobs print could reinforce the case for higher-for-longer rates.
And there is another pressure point: oil.
Brent crude climbed around 1.4% to $83.61 after renewed tensions around the Strait of Hormuz. Higher oil prices can increase inflation concerns, potentially keeping financial conditions tighter and limiting upside for risk assets.
🧠 What traders are watching
The important reaction may not simply be the headline jobs number.
Watch U.S. Treasury yields and the dollar.
If jobs data eases rate concerns and yields fall, $BTC could get room to push higher.
If employment remains strong while oil continues climbing, markets could interpret the combination as another reason for the Fed to stay restrictive.
Meanwhile, Bitcoin whales have recently accumulated more than 20,000 BTC worth roughly $1.2 billion, while U.S. spot Bitcoin ETFs attracted approximately $754.69 million this week.
That creates an interesting contrast:
Large players are accumulating but BTC is still struggling to escape its range.
For now, $BTC remains a market waiting for its next major catalyst.
Watch the data. Watch yields. Watch the reaction.
⚠️ This is market information for educational purposes, not financial advice. DYOR.
#BinanceSquare #CryptoMarket #Bitcoin #BTC #ETH #XRP #sol #CryptoNews

92
·
--
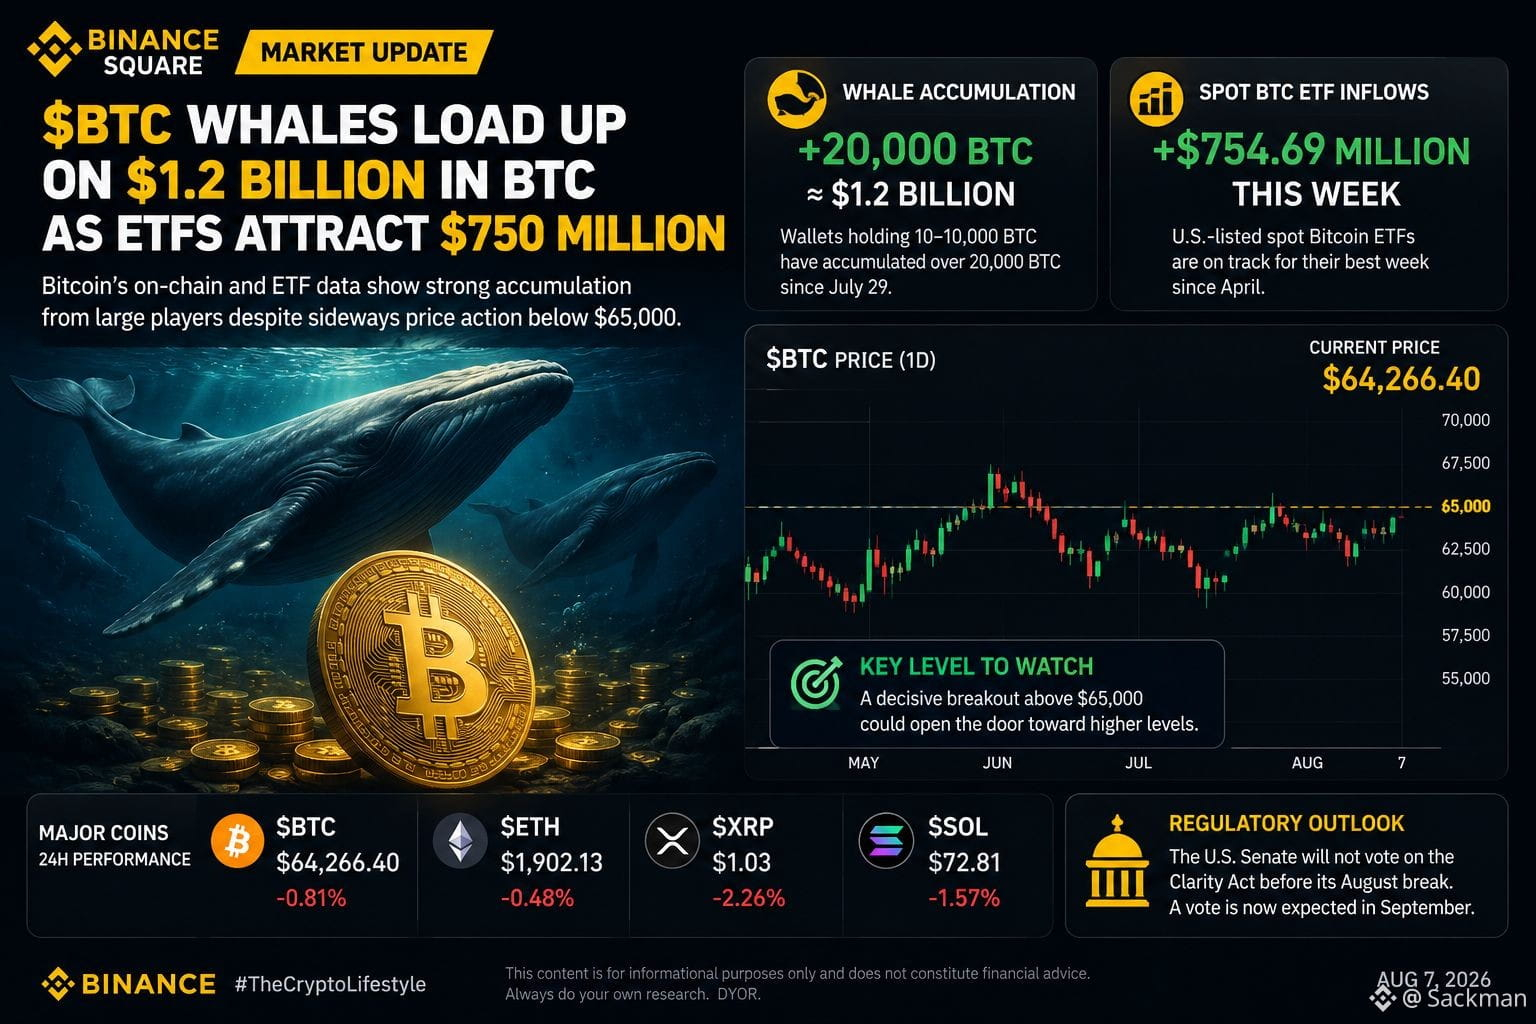
$BTC | 🐋 Bitcoin Whales Accumulate $1.2B as ETFs Pull In $750M
Bitcoin’s market structure is showing an interesting divergence: large holders are accumulating while smaller holders remain cautious.
According to data cited by CoinDesk, wallets holding between 10 and 10,000 BTC have accumulated more than 20,000 BTC — worth roughly $1.2 billion — since July 29, while Bitcoin has remained largely trapped below $65,000.
At the same time, U.S.-listed spot Bitcoin ETFs recorded approximately $754.69 million in inflows this week, putting them on track for their strongest week since April.
📊 What the market is telling us
🐋 Whales: +20,000 BTC accumulated
🏦 Spot BTC ETFs: +$754.69M this week
📍 BTC: Around $64,266
🎯 Key level: $65,000
📈 Potential upside: A sustained move above $65K could strengthen the bullish case toward higher levels.
The interesting part is that BTC has not yet produced a major rally despite the accumulation.
That could mean larger players are positioning gradually rather than aggressively chasing price.
Meanwhile, the delayed U.S. Clarity Act remains a potential headwind for the broader crypto market, with the Senate now expected to revisit the legislation in September.
🔎 Market takeaway
The current setup is a battle between accumulation and confirmation.
Whales are buying.
ETF capital is returning.
But $BTC still needs to reclaim important resistance.
$65,000 is becoming a level to watch closely.
A decisive breakout could change market sentiment quickly but until that happens, accumulation alone doesn't guarantee a rally.
Market information for educational purposes only. Not financial advice.
#BTC #ETH #XRP #SOL #Bitcoin #Solana #CryptoMarket #MarketUpdate #BinanceSquare #CryptoNews
$BTC | 🐋 Bitcoin Whales Accumulate $1.2B as ETFs Pull In $750M
Bitcoin’s market structure is showing an interesting divergence: large holders are accumulating while smaller holders remain cautious.
According to data cited by CoinDesk, wallets holding between 10 and 10,000 BTC have accumulated more than 20,000 BTC — worth roughly $1.2 billion — since July 29, while Bitcoin has remained largely trapped below $65,000.
At the same time, U.S.-listed spot Bitcoin ETFs recorded approximately $754.69 million in inflows this week, putting them on track for their strongest week since April.
📊 What the market is telling us
🐋 Whales: +20,000 BTC accumulated
🏦 Spot BTC ETFs: +$754.69M this week
📍 BTC: Around $64,266
🎯 Key level: $65,000
📈 Potential upside: A sustained move above $65K could strengthen the bullish case toward higher levels.
The interesting part is that BTC has not yet produced a major rally despite the accumulation.
That could mean larger players are positioning gradually rather than aggressively chasing price.
Meanwhile, the delayed U.S. Clarity Act remains a potential headwind for the broader crypto market, with the Senate now expected to revisit the legislation in September.
🔎 Market takeaway
The current setup is a battle between accumulation and confirmation.
Whales are buying.
ETF capital is returning.
But $BTC still needs to reclaim important resistance.
$65,000 is becoming a level to watch closely.
A decisive breakout could change market sentiment quickly but until that happens, accumulation alone doesn't guarantee a rally.
Market information for educational purposes only. Not financial advice.
#BTC #ETH #XRP #SOL #Bitcoin #Solana #CryptoMarket #MarketUpdate #BinanceSquare #CryptoNews
Bitcoin’s market structure is showing an interesting divergence: large holders are accumulating while smaller holders remain cautious.
According to data cited by CoinDesk, wallets holding between 10 and 10,000 BTC have accumulated more than 20,000 BTC — worth roughly $1.2 billion — since July 29, while Bitcoin has remained largely trapped below $65,000.
At the same time, U.S.-listed spot Bitcoin ETFs recorded approximately $754.69 million in inflows this week, putting them on track for their strongest week since April.
📊 What the market is telling us
🐋 Whales: +20,000 BTC accumulated
🏦 Spot BTC ETFs: +$754.69M this week
📍 BTC: Around $64,266
🎯 Key level: $65,000
📈 Potential upside: A sustained move above $65K could strengthen the bullish case toward higher levels.
The interesting part is that BTC has not yet produced a major rally despite the accumulation.
That could mean larger players are positioning gradually rather than aggressively chasing price.
Meanwhile, the delayed U.S. Clarity Act remains a potential headwind for the broader crypto market, with the Senate now expected to revisit the legislation in September.
🔎 Market takeaway
The current setup is a battle between accumulation and confirmation.
Whales are buying.
ETF capital is returning.
But $BTC still needs to reclaim important resistance.
$65,000 is becoming a level to watch closely.
A decisive breakout could change market sentiment quickly but until that happens, accumulation alone doesn't guarantee a rally.
Market information for educational purposes only. Not financial advice.
#BTC #ETH #XRP #SOL #Bitcoin #Solana #CryptoMarket #MarketUpdate #BinanceSquare #CryptoNews
71
·
--
Market Update: U.S. Senate Delays Crypto Clarity Act Vote to September
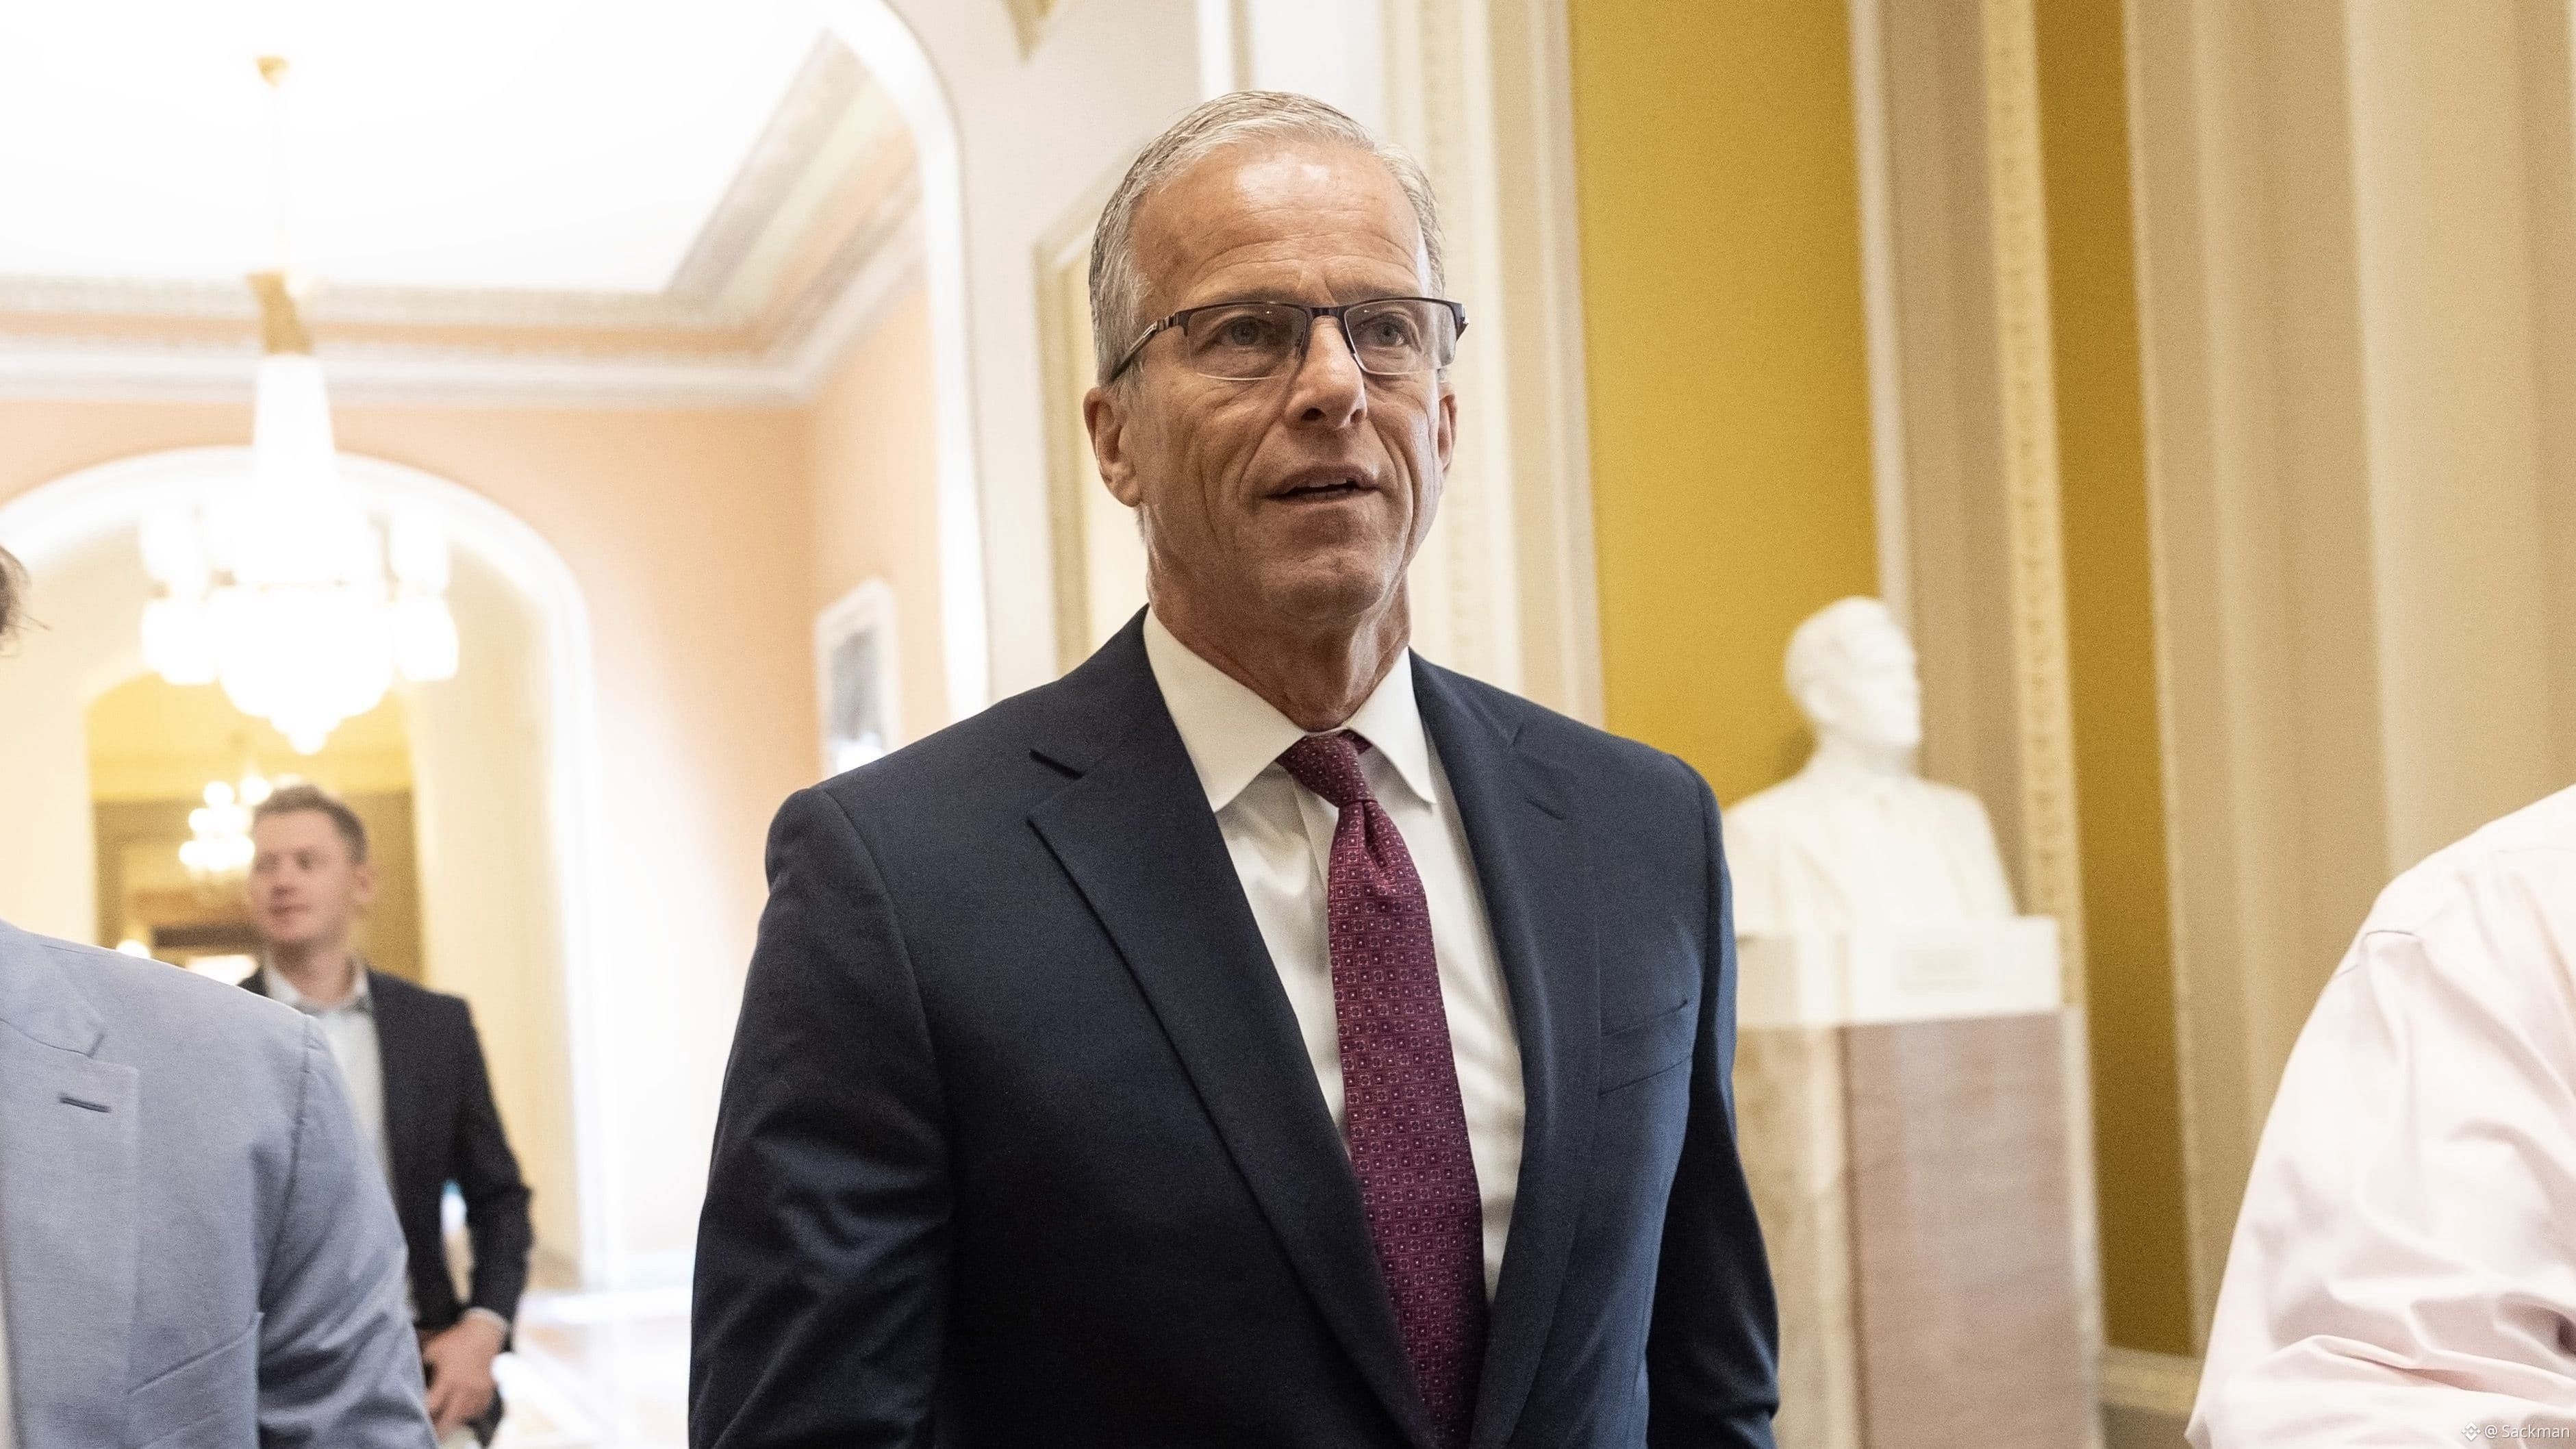
The U.S. Senate will not vote on the Crypto Clarity Act in August, pushing the highly anticipated crypto market-structure legislation into September.
The Senate is scheduled to return to Washington on September 14, 2026, with lawmakers expected to have roughly three weeks to address the remaining issues and potentially advance the bill.
Why it matters for crypto
The Clarity Act is designed to establish clearer rules for digital assets in the United States, including regulatory responsibilities and the treatment of crypto markets.
The delay adds another layer of uncertainty for the digital-asset industry. Several disagreements remain, including provisions concerning stablecoin rewards, law-enforcement concerns, Agriculture Committee provisions and ethics requirements.
For the broader market, regulatory clarity remains an important factor for institutional participation and where crypto businesses choose to operate.
📊 Market watch
The delay comes as major cryptocurrencies remain under pressure:
$BTC — around $64K
$ETH — around $1.9K
$XRP — around $1.02
$SOL — around $72.6
Recent market reporting shows $XRP among the weaker majors, while $BTC continues to trade around the $64K region.
🔎 What traders should watch
September could become an important month for crypto regulation in the U.S. The key question isn't simply whether the Senate votes, but whether lawmakers can resolve the remaining political disagreements and secure the 60 votes needed to advance the legislation.
Until then, the market may continue pricing in regulatory uncertainty.
The crypto market isn't just watching price charts it's watching Washington.
Market update for informational purposes only. Not financial advice.
#bitcoin #Ethereum #XRP #solana #ClarityAct #CryptoRegulationBattle #MarketUpdate #BinanceSquare #CryptoNews
Market Update: U.S. Senate Delays Crypto Clarity Act Vote to September
The U.S. Senate will not vote on the Crypto Clarity Act in August, pushing the highly anticipated crypto market-structure legislation into September.
The Senate is scheduled to return to Washington on September 14, 2026, with lawmakers expected to have roughly three weeks to address the remaining issues and potentially advance the bill.
Why it matters for crypto
The Clarity Act is designed to establish clearer rules for digital assets in the United States, including regulatory responsibilities and the treatment of crypto markets.
The delay adds another layer of uncertainty for the digital-asset industry. Several disagreements remain, including provisions concerning stablecoin rewards, law-enforcement concerns, Agriculture Committee provisions and ethics requirements.
For the broader market, regulatory clarity remains an important factor for institutional participation and where crypto businesses choose to operate.
📊 Market watch
The delay comes as major cryptocurrencies remain under pressure:
$BTC — around $64K
$ETH — around $1.9K
$XRP — around $1.02
$SOL — around $72.6
Recent market reporting shows $XRP among the weaker majors, while $BTC continues to trade around the $64K region.
🔎 What traders should watch
September could become an important month for crypto regulation in the U.S. The key question isn't simply whether the Senate votes, but whether lawmakers can resolve the remaining political disagreements and secure the 60 votes needed to advance the legislation.
Until then, the market may continue pricing in regulatory uncertainty.
The crypto market isn't just watching price charts it's watching Washington.
Market update for informational purposes only. Not financial advice.
#bitcoin #Ethereum #XRP #solana #ClarityAct #CryptoRegulationBattle #MarketUpdate #BinanceSquare #CryptoNews
The U.S. Senate will not vote on the Crypto Clarity Act in August, pushing the highly anticipated crypto market-structure legislation into September.
The Senate is scheduled to return to Washington on September 14, 2026, with lawmakers expected to have roughly three weeks to address the remaining issues and potentially advance the bill.
Why it matters for crypto
The Clarity Act is designed to establish clearer rules for digital assets in the United States, including regulatory responsibilities and the treatment of crypto markets.
The delay adds another layer of uncertainty for the digital-asset industry. Several disagreements remain, including provisions concerning stablecoin rewards, law-enforcement concerns, Agriculture Committee provisions and ethics requirements.
For the broader market, regulatory clarity remains an important factor for institutional participation and where crypto businesses choose to operate.
📊 Market watch
The delay comes as major cryptocurrencies remain under pressure:
$BTC — around $64K
$ETH — around $1.9K
$XRP — around $1.02
$SOL — around $72.6
Recent market reporting shows $XRP among the weaker majors, while $BTC continues to trade around the $64K region.
🔎 What traders should watch
September could become an important month for crypto regulation in the U.S. The key question isn't simply whether the Senate votes, but whether lawmakers can resolve the remaining political disagreements and secure the 60 votes needed to advance the legislation.
Until then, the market may continue pricing in regulatory uncertainty.
The crypto market isn't just watching price charts it's watching Washington.
Market update for informational purposes only. Not financial advice.
#bitcoin #Ethereum #XRP #solana #ClarityAct #CryptoRegulationBattle #MarketUpdate #BinanceSquare #CryptoNews
55
·
--
$BTC | BITCOIN MARKET UPDATE 📊
$76,000 TARGET? Bitcoin’s “Boring” Price Action May Be Building a Bullish Setup
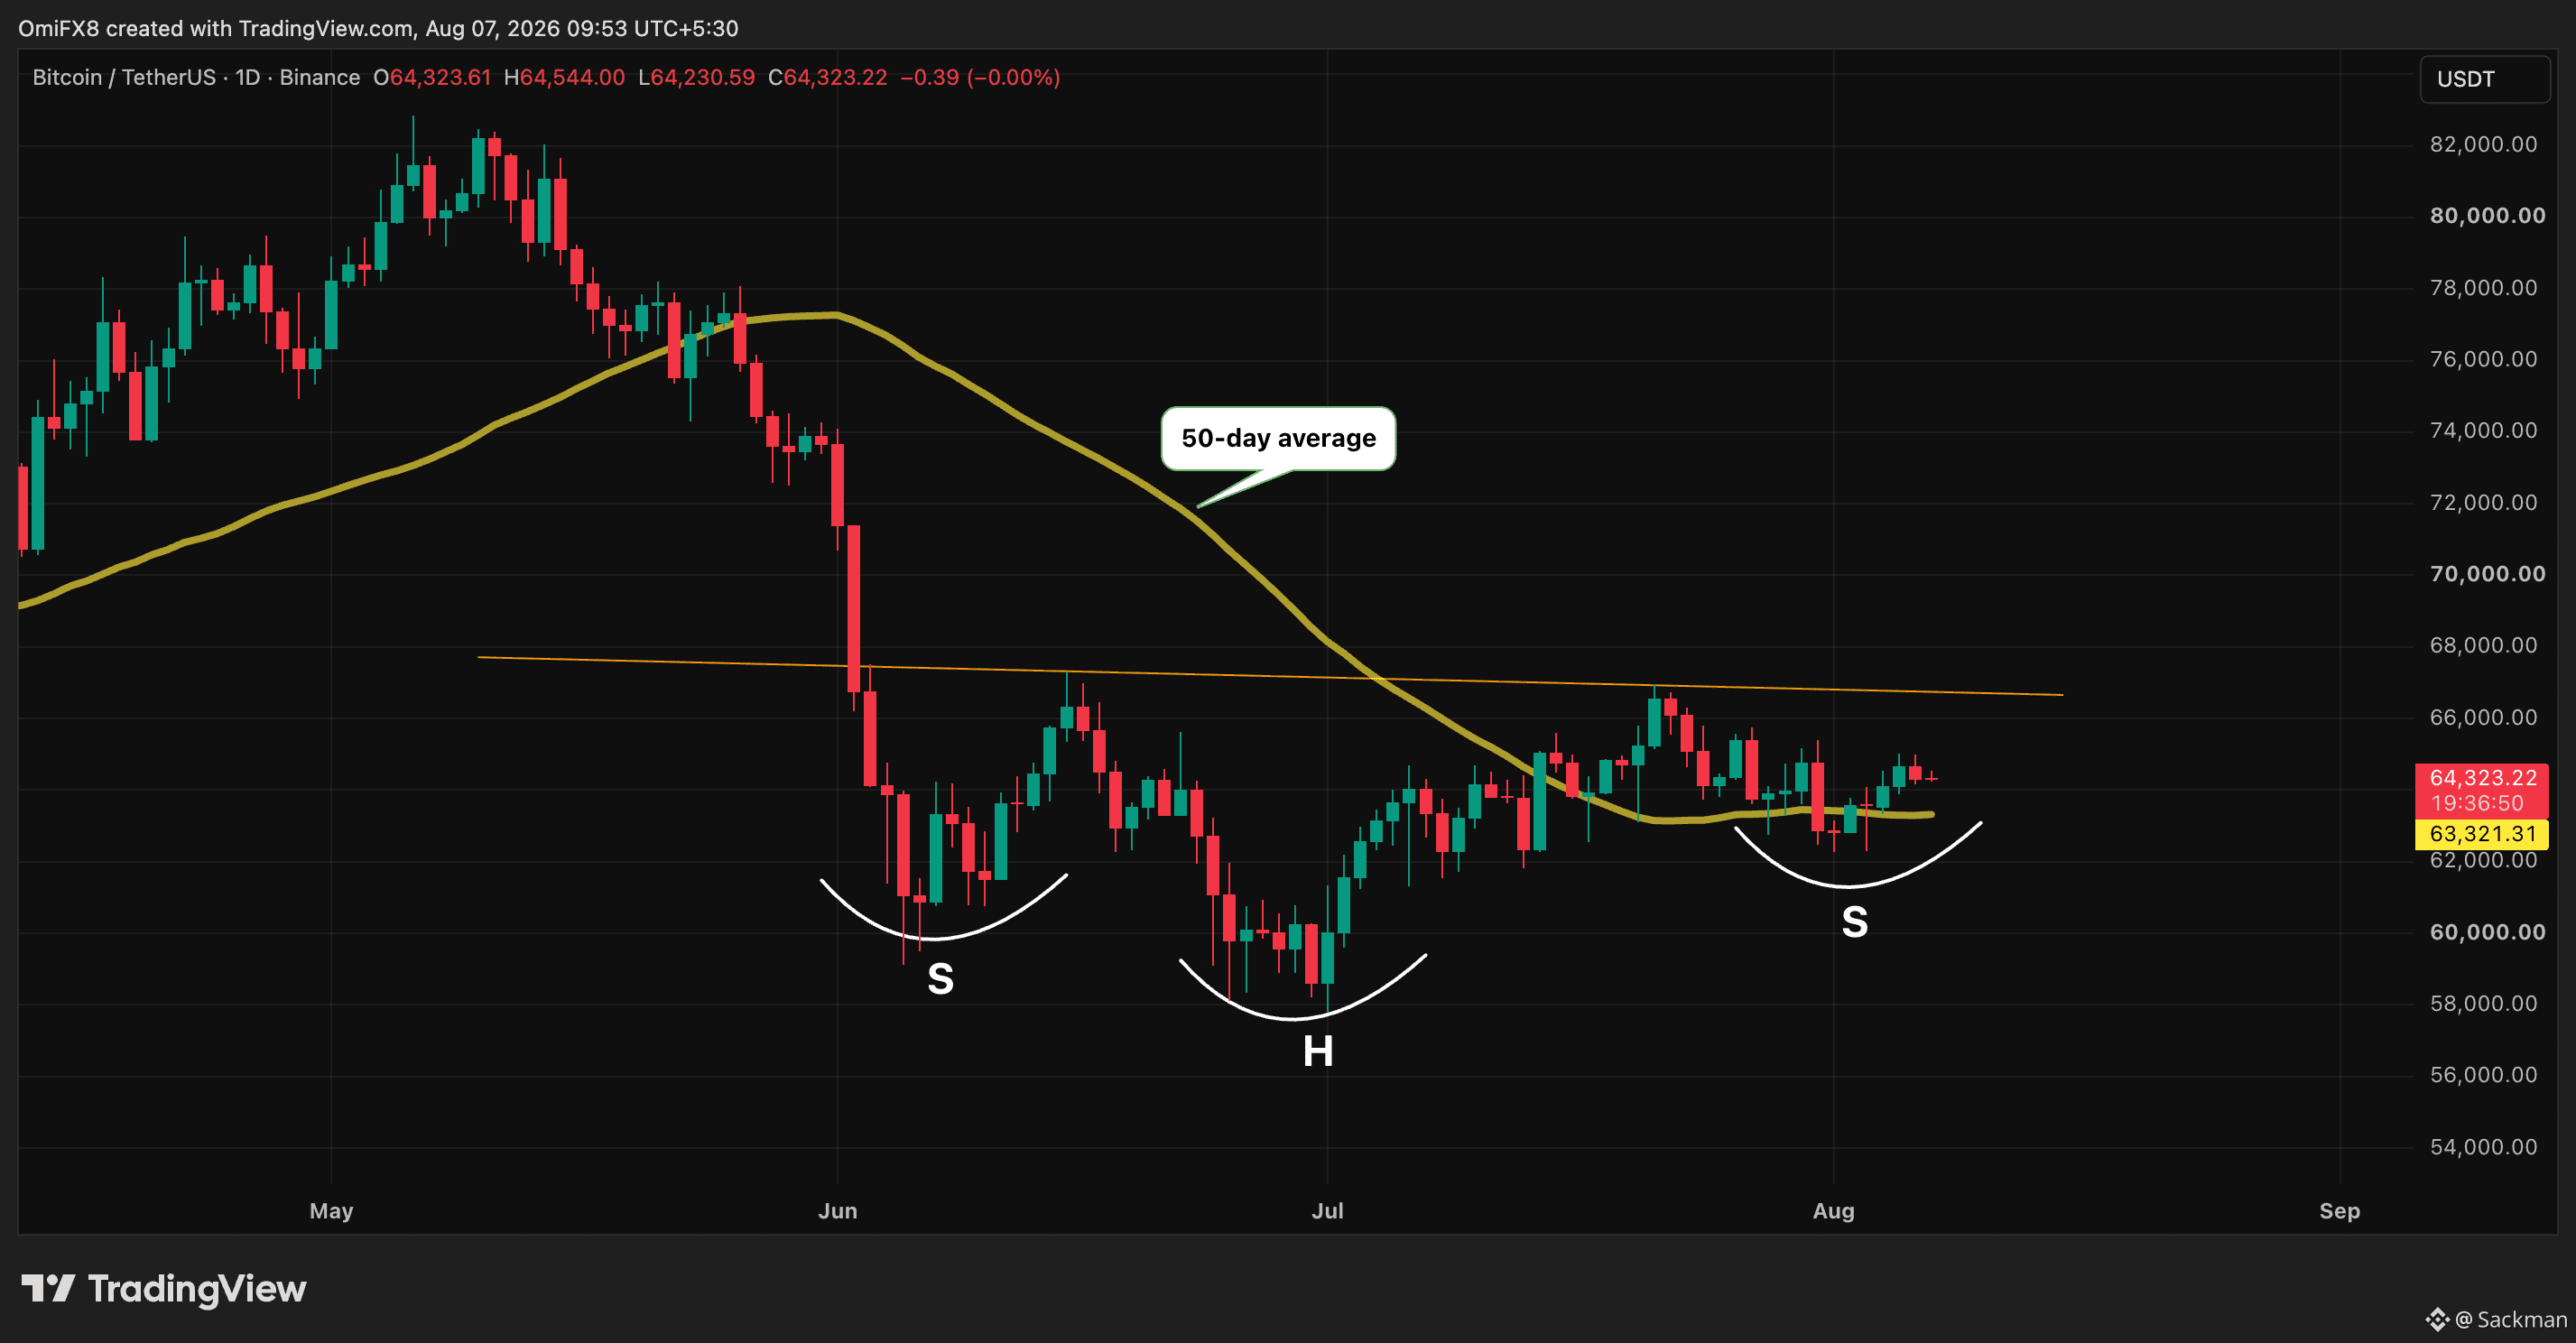
Bitcoin is trading around $64,198, down roughly 1%, but beneath the quiet price action, a potentially bullish technical structure is developing.
📈 The setup:
Analysts are watching a possible inverse Head & Shoulders pattern on the daily chart.
• Left shoulder: ~$60,000
• Head: ~$57,700
• Right shoulder: ~$62,500
• Neckline: ~$66,800
• Potential measured target: ~$76,000
🔥 The key level is $66,800.
A decisive breakout and hold above the neckline could confirm the bullish pattern and open the path toward the $76K area.
⚠️ But confirmation matters.
If $BTC loses its 50-day SMA near $63,321, the bullish setup could weaken and the market may need to reassess the structure.
There is also a macro/regulatory headwind: uncertainty surrounding the Clarity Act has reduced one potential catalyst for crypto markets.
Bottom line:
Bitcoin may look boring right now but sometimes the biggest moves begin while the market is quiet.
$BTC | Watch $63.3K support → $66.8K breakout → $76K potential target.
Not financial advice. Watch the levels, not the hype.
#bitcoin #BTC #crypto #CryptoNews #BinanceSquare
$BTC | BITCOIN MARKET UPDATE 📊
$76,000 TARGET? Bitcoin’s “Boring” Price Action May Be Building a Bullish Setup
Bitcoin is trading around $64,198, down roughly 1%, but beneath the quiet price action, a potentially bullish technical structure is developing.
📈 The setup:
Analysts are watching a possible inverse Head & Shoulders pattern on the daily chart.
• Left shoulder: ~$60,000
• Head: ~$57,700
• Right shoulder: ~$62,500
• Neckline: ~$66,800
• Potential measured target: ~$76,000
🔥 The key level is $66,800.
A decisive breakout and hold above the neckline could confirm the bullish pattern and open the path toward the $76K area.
⚠️ But confirmation matters.
If $BTC loses its 50-day SMA near $63,321, the bullish setup could weaken and the market may need to reassess the structure.
There is also a macro/regulatory headwind: uncertainty surrounding the Clarity Act has reduced one potential catalyst for crypto markets.
Bottom line:
Bitcoin may look boring right now but sometimes the biggest moves begin while the market is quiet.
$BTC | Watch $63.3K support → $66.8K breakout → $76K potential target.
Not financial advice. Watch the levels, not the hype.
#bitcoin #BTC #crypto #CryptoNews #BinanceSquare
$76,000 TARGET? Bitcoin’s “Boring” Price Action May Be Building a Bullish Setup
Bitcoin is trading around $64,198, down roughly 1%, but beneath the quiet price action, a potentially bullish technical structure is developing.
📈 The setup:
Analysts are watching a possible inverse Head & Shoulders pattern on the daily chart.
• Left shoulder: ~$60,000
• Head: ~$57,700
• Right shoulder: ~$62,500
• Neckline: ~$66,800
• Potential measured target: ~$76,000
🔥 The key level is $66,800.
A decisive breakout and hold above the neckline could confirm the bullish pattern and open the path toward the $76K area.
⚠️ But confirmation matters.
If $BTC loses its 50-day SMA near $63,321, the bullish setup could weaken and the market may need to reassess the structure.
There is also a macro/regulatory headwind: uncertainty surrounding the Clarity Act has reduced one potential catalyst for crypto markets.
Bottom line:
Bitcoin may look boring right now but sometimes the biggest moves begin while the market is quiet.
$BTC | Watch $63.3K support → $66.8K breakout → $76K potential target.
Not financial advice. Watch the levels, not the hype.
#bitcoin #BTC #crypto #CryptoNews #BinanceSquare
80
·
--
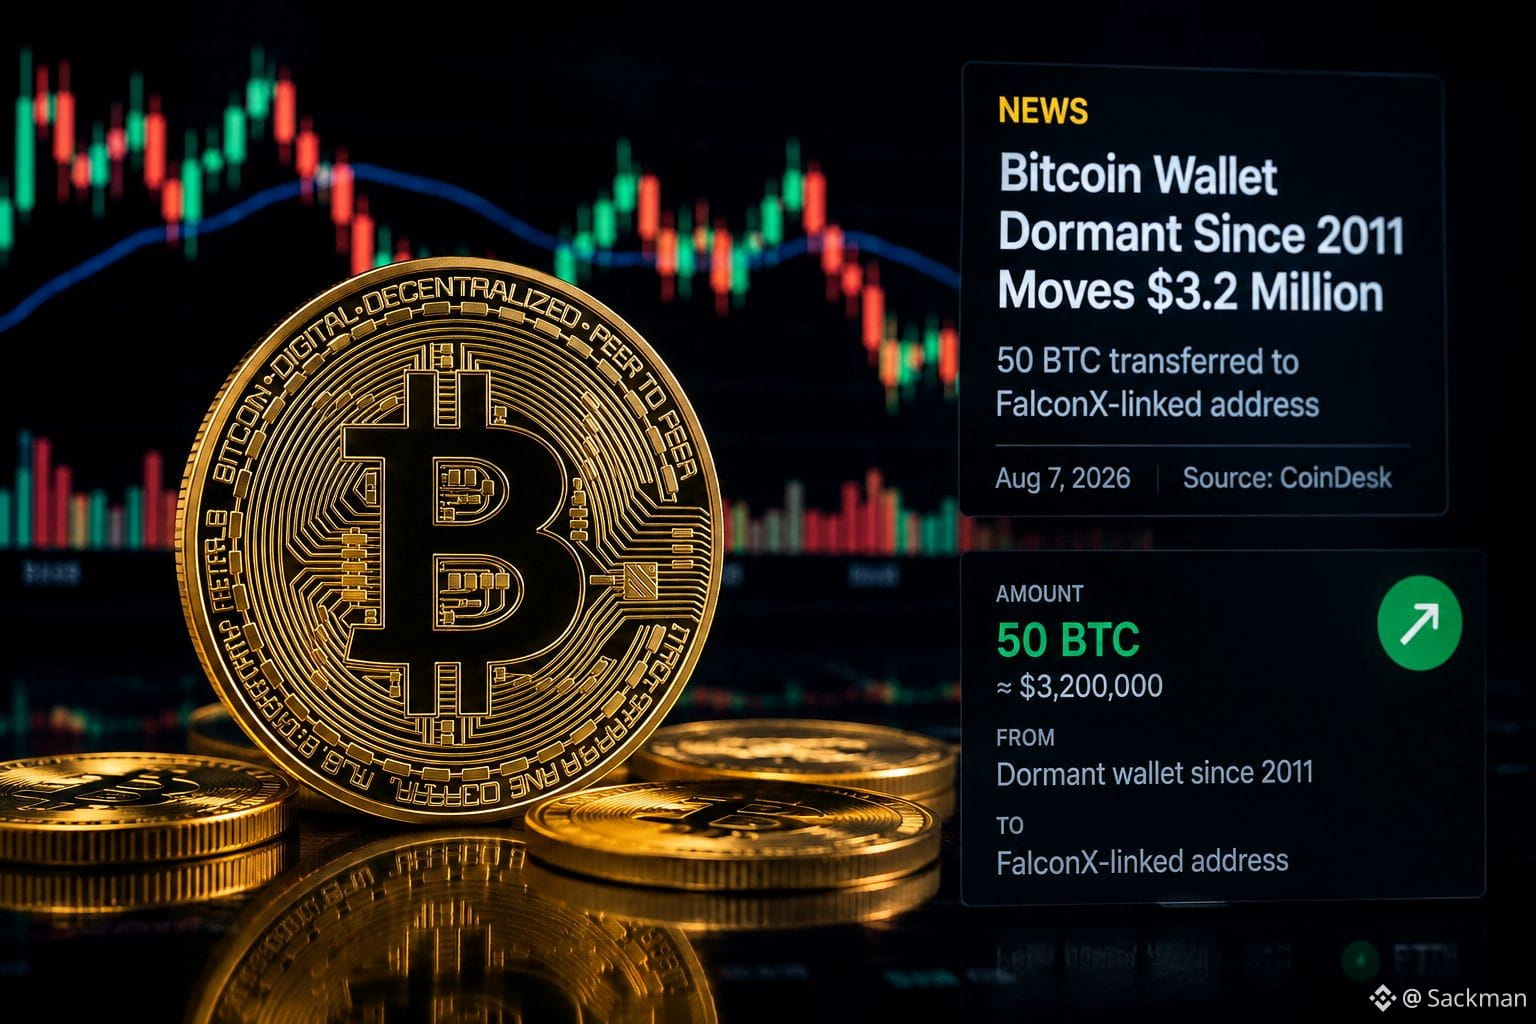
Market Updates :15-YEAR-OLD BITCOIN WALLET JUST MOVED $3.2M BUT DID IT SELL?
A Bitcoin wallet that had been dormant since 2011 has suddenly moved almost 50 BTC, now worth roughly $3.2 million.
🧠 What happened? • The wallet received 49.97 BTC in July 2011, when BTC was around $10 • On Aug. 6, nearly 50 BTC was moved to another SegWit address • That destination has previously sent BTC to addresses labelled by Arkham as FalconX deposits • The 50 BTC was still sitting at the destination address Friday morning
⚠️ Important: There is no evidence yet that these BTC were sold or sent directly to an exchange.
📚 What traders can learn
A dormant-wallet movement is on-chain activity, not automatically a sell signal.
The transfer could represent: 🔹 Wallet restructuring
🔹 A custody change
🔹 Security precautions
🔹 Preparation for a future trade
🔹 Or potentially movement toward a trading venue
The timing is also interesting. Recent Bitcoin wallet-security concerns have pushed long-term holders to review old storage setups.
📊 Current market snapshot: BTC ~$64.2K | ETH ~$1.90K | XRP ~$1.02 | SOL ~$72.7K
🎯 Trader takeaway:
Don't trade the headline alone. Watch the destination wallet, subsequent movements, exchange deposits and actual selling activity before concluding that an old whale is preparing to dump.
On-chain movement creates a signal. Follow-up transactions reveal the story.
#BinanceSquare #Bitcoin❗ #BTC、 #Cryptonewsdaily #OnChainAnalysis
Market Updates :15-YEAR-OLD BITCOIN WALLET JUST MOVED $3.2M BUT DID IT SELL?
A Bitcoin wallet that had been dormant since 2011 has suddenly moved almost 50 BTC, now worth roughly $3.2 million.
🧠 What happened? • The wallet received 49.97 BTC in July 2011, when BTC was around $10 • On Aug. 6, nearly 50 BTC was moved to another SegWit address • That destination has previously sent BTC to addresses labelled by Arkham as FalconX deposits • The 50 BTC was still sitting at the destination address Friday morning
⚠️ Important: There is no evidence yet that these BTC were sold or sent directly to an exchange.
📚 What traders can learn
A dormant-wallet movement is on-chain activity, not automatically a sell signal.
The transfer could represent: 🔹 Wallet restructuring
🔹 A custody change
🔹 Security precautions
🔹 Preparation for a future trade
🔹 Or potentially movement toward a trading venue
The timing is also interesting. Recent Bitcoin wallet-security concerns have pushed long-term holders to review old storage setups.
📊 Current market snapshot: BTC ~$64.2K | ETH ~$1.90K | XRP ~$1.02 | SOL ~$72.7K
🎯 Trader takeaway:
Don't trade the headline alone. Watch the destination wallet, subsequent movements, exchange deposits and actual selling activity before concluding that an old whale is preparing to dump.
On-chain movement creates a signal. Follow-up transactions reveal the story.
#BinanceSquare #Bitcoin❗ #BTC、 #Cryptonewsdaily #OnChainAnalysis
A Bitcoin wallet that had been dormant since 2011 has suddenly moved almost 50 BTC, now worth roughly $3.2 million.
🧠 What happened? • The wallet received 49.97 BTC in July 2011, when BTC was around $10 • On Aug. 6, nearly 50 BTC was moved to another SegWit address • That destination has previously sent BTC to addresses labelled by Arkham as FalconX deposits • The 50 BTC was still sitting at the destination address Friday morning
⚠️ Important: There is no evidence yet that these BTC were sold or sent directly to an exchange.
📚 What traders can learn
A dormant-wallet movement is on-chain activity, not automatically a sell signal.
The transfer could represent: 🔹 Wallet restructuring
🔹 A custody change
🔹 Security precautions
🔹 Preparation for a future trade
🔹 Or potentially movement toward a trading venue
The timing is also interesting. Recent Bitcoin wallet-security concerns have pushed long-term holders to review old storage setups.
📊 Current market snapshot: BTC ~$64.2K | ETH ~$1.90K | XRP ~$1.02 | SOL ~$72.7K
🎯 Trader takeaway:
Don't trade the headline alone. Watch the destination wallet, subsequent movements, exchange deposits and actual selling activity before concluding that an old whale is preparing to dump.
On-chain movement creates a signal. Follow-up transactions reveal the story.
#BinanceSquare #Bitcoin❗ #BTC、 #Cryptonewsdaily #OnChainAnalysis
82
·
--
🚨 Updates : HYPERLIQUID ETF DEMAND COOLS WHAT TRADERS SHOULD KNOW
JPMorgan says inflows into Hyperliquid (HYPE) ETFs have largely stalled after strong demand in May and June, as competition intensifies.
📉 What’s happening?
• HYPE was trading around $55.30, down 3%+ in 24h
• ETF demand weakened through July and early August
• Regulated U.S. crypto perpetual futures could pull activity away from decentralized venues
• Hyperliquid is also facing growing competition in prediction markets
• JPMorgan questions whether HYPE can keep gaining market share against larger ecosystems such as Solana and XRP
💡 The bigger lesson:
Strong token performance doesn't automatically mean sustainable demand. Traders should watch ETF flows, market share, trading activity, regulation and real economic usage rather than price alone.
For perspective, Bitcoin and Ethereum still dominate crypto ETFs, with roughly $77B and $10B in assets under management, respectively.
🎯 Trader takeaway:
HYPE's story isn't necessarily over but the next phase depends on whether Hyperliquid can defend its market share as regulated competitors enter the derivatives space.
Watch the flows. Watch the usage. Watch the competition.
#BinanceSquare #CryptoNews #Hyperliquid #hype #CryptoTrading. #DYOD
🚨 Updates : HYPERLIQUID ETF DEMAND COOLS WHAT TRADERS SHOULD KNOW
JPMorgan says inflows into Hyperliquid (HYPE) ETFs have largely stalled after strong demand in May and June, as competition intensifies.
📉 What’s happening?
• HYPE was trading around $55.30, down 3%+ in 24h
• ETF demand weakened through July and early August
• Regulated U.S. crypto perpetual futures could pull activity away from decentralized venues
• Hyperliquid is also facing growing competition in prediction markets
• JPMorgan questions whether HYPE can keep gaining market share against larger ecosystems such as Solana and XRP
💡 The bigger lesson:
Strong token performance doesn't automatically mean sustainable demand. Traders should watch ETF flows, market share, trading activity, regulation and real economic usage rather than price alone.
For perspective, Bitcoin and Ethereum still dominate crypto ETFs, with roughly $77B and $10B in assets under management, respectively.
🎯 Trader takeaway:
HYPE's story isn't necessarily over but the next phase depends on whether Hyperliquid can defend its market share as regulated competitors enter the derivatives space.
Watch the flows. Watch the usage. Watch the competition.
#BinanceSquare #CryptoNews #Hyperliquid #hype #CryptoTrading. #DYOD
JPMorgan says inflows into Hyperliquid (HYPE) ETFs have largely stalled after strong demand in May and June, as competition intensifies.
📉 What’s happening?
• HYPE was trading around $55.30, down 3%+ in 24h
• ETF demand weakened through July and early August
• Regulated U.S. crypto perpetual futures could pull activity away from decentralized venues
• Hyperliquid is also facing growing competition in prediction markets
• JPMorgan questions whether HYPE can keep gaining market share against larger ecosystems such as Solana and XRP
💡 The bigger lesson:
Strong token performance doesn't automatically mean sustainable demand. Traders should watch ETF flows, market share, trading activity, regulation and real economic usage rather than price alone.
For perspective, Bitcoin and Ethereum still dominate crypto ETFs, with roughly $77B and $10B in assets under management, respectively.
🎯 Trader takeaway:
HYPE's story isn't necessarily over but the next phase depends on whether Hyperliquid can defend its market share as regulated competitors enter the derivatives space.
Watch the flows. Watch the usage. Watch the competition.
#BinanceSquare #CryptoNews #Hyperliquid #hype #CryptoTrading. #DYOD

84
·
--
Статья
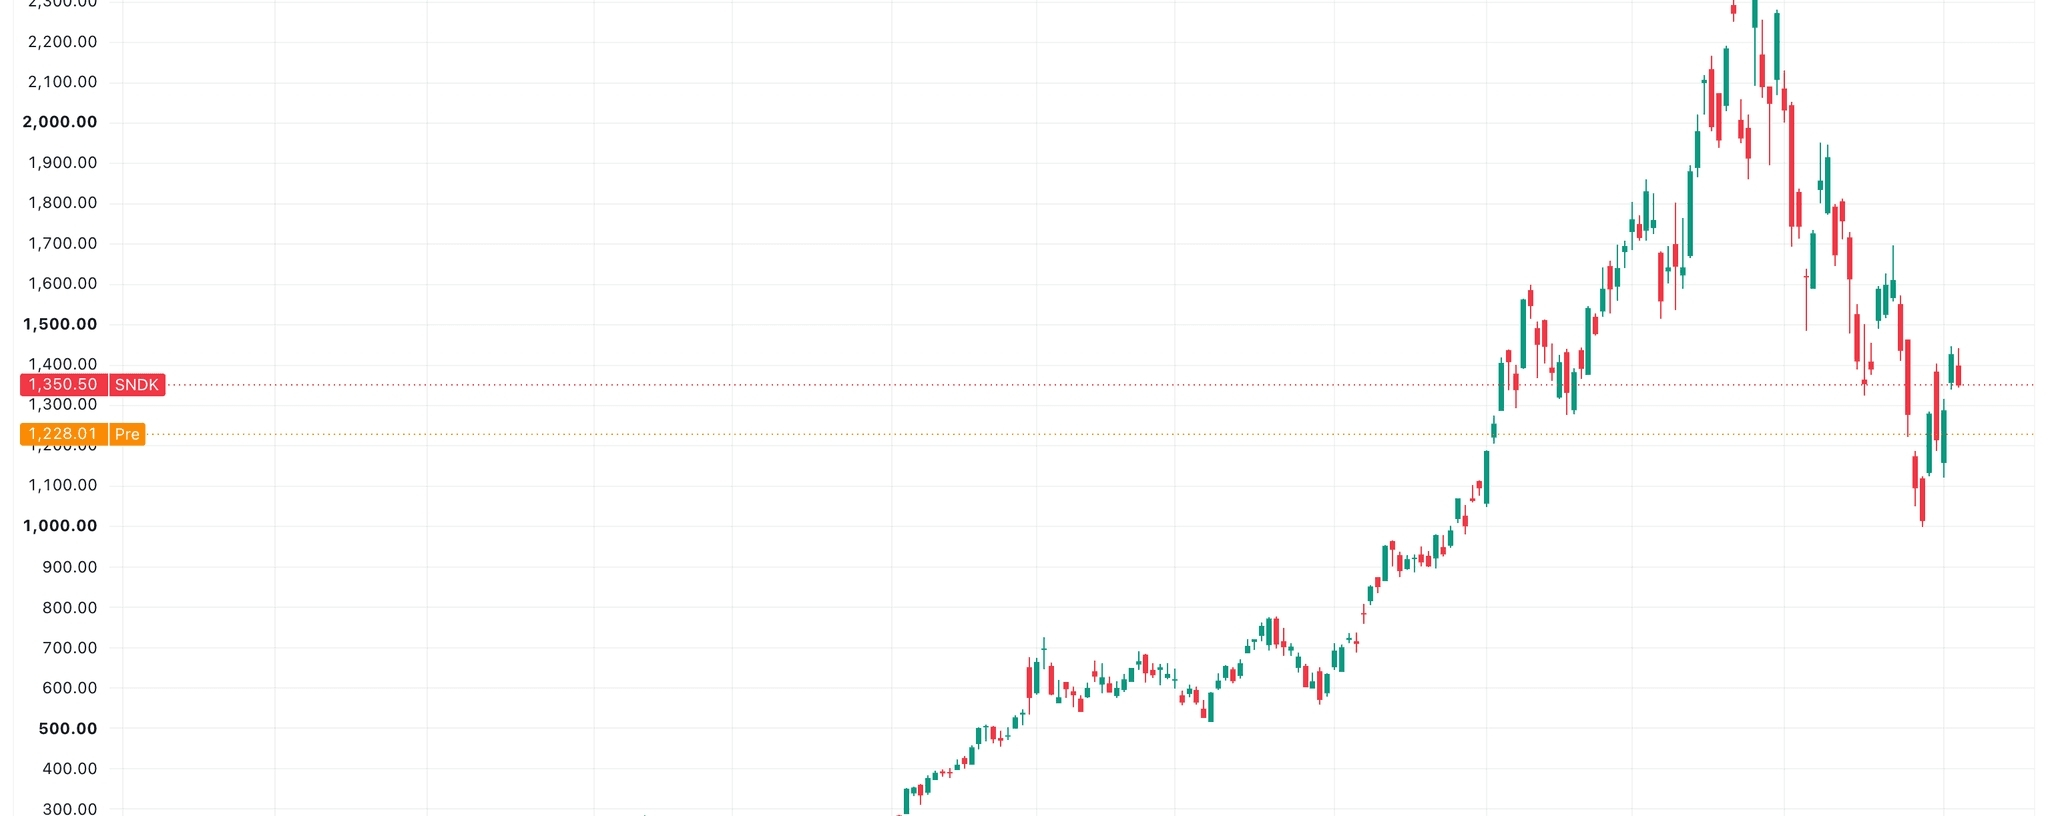
🚨 AI MONEY IS MOVING BUT WHERE DOES IT GO NEXT?Two major AI-storage winners, SanDisk and Western Digital, suddenly fell around 10% despite reporting strong earnings.
That sounds strange until you understand one of the most important lessons in markets:
📊 GREAT RESULTS ≠ GREAT STOCK PRICE
SanDisk reported record quarterly revenue of about $8.97B, while Western Digital reported $3.75B, up 44% year-over-year.
Yet investors sold.
Why?
Because markets don't only price what happened.
They price what investors EXPECT to happen next.
SanDisk's forward revenue outlook came in below analyst expectations, while Western Digital faced an even higher expectations problem after its enormous prior run.
This is called an expectations gap.
And crypto traders should pay attention.
🔄 WHY THIS MATTERS FOR BITCOIN
For much of this cycle, capital has been heavily attracted to AI and technology-related assets.
Now we're seeing an interesting divergence:
🔸 AI-linked stocks are facing profit-taking
🔸 Gold has strengthened
🔸 BTC is holding above $64K
🔸 BTC is showing resilience despite recent crypto-specific shocks
🔸 Altcoins remain considerably weaker than BTC
That does NOT automatically mean money is rotating into Bitcoin.
That's the mistake traders should avoid.
Capital rotation needs confirmation.
🧠 WHAT SHOULD TRADERS WATCH?
Don't just ask:
“Is Bitcoin going up?”
Ask:
“Where is capital moving FROM and where is it moving TO?”
Watch:
📌 BTC relative strength vs. equities
📌 BTC ETF flows
📌 BTC dominance
📌 Stablecoin liquidity
📌 Futures open interest & funding
📌 Gold and Treasury yields
📌 AI/tech-sector momentum
📌 Altcoin breadth
If technology weakens while BTC strengthens with increasing institutional flows, the rotation thesis becomes much more interesting.
If tech falls and BTC falls with it, that's not rotation.
That's risk-off.
🎯 THE BIG LESSON
Markets don't move because an asset had “good news.”
They move when reality beats or disappoints expectations and when capital decides where the next opportunity lies.
For crypto traders, the AI trade may therefore be worth watching just as closely as the crypto chart itself.
The question isn't simply whether Bitcoin will rise.
The bigger question is: WHERE IS THE MONEY GOING NEXT?
#bitcoin #cryptotrading #cryptoeducation #MarketUpdate
🚨 AI MONEY IS MOVING BUT WHERE DOES IT GO NEXT?
Two major AI-storage winners, SanDisk and Western Digital, suddenly fell around 10% despite reporting strong earnings.
That sounds strange until you understand one of the most important lessons in markets:
📊 GREAT RESULTS ≠ GREAT STOCK PRICE
SanDisk reported record quarterly revenue of about $8.97B, while Western Digital reported $3.75B, up 44% year-over-year.
Yet investors sold.
Why?
Because markets don't only price what happened.
They price what investors EXPECT to happen next.
SanDisk's forward revenue outlook came in below analyst expectations, while Western Digital faced an even higher expectations problem after its enormous prior run.
This is called an expectations gap.
And crypto traders should pay attention.
🔄 WHY THIS MATTERS FOR BITCOIN
For much of this cycle, capital has been heavily attracted to AI and technology-related assets.
Now we're seeing an interesting divergence:
🔸 AI-linked stocks are facing profit-taking
🔸 Gold has strengthened
🔸 BTC is holding above $64K
🔸 BTC is showing resilience despite recent crypto-specific shocks
🔸 Altcoins remain considerably weaker than BTC
That does NOT automatically mean money is rotating into Bitcoin.
That's the mistake traders should avoid.
Capital rotation needs confirmation.
🧠 WHAT SHOULD TRADERS WATCH?
Don't just ask:
“Is Bitcoin going up?”
Ask:
“Where is capital moving FROM and where is it moving TO?”
Watch:
📌 BTC relative strength vs. equities
📌 BTC ETF flows
📌 BTC dominance
📌 Stablecoin liquidity
📌 Futures open interest & funding
📌 Gold and Treasury yields
📌 AI/tech-sector momentum
📌 Altcoin breadth
If technology weakens while BTC strengthens with increasing institutional flows, the rotation thesis becomes much more interesting.
If tech falls and BTC falls with it, that's not rotation.
That's risk-off.
🎯 THE BIG LESSON
Markets don't move because an asset had “good news.”
They move when reality beats or disappoints expectations and when capital decides where the next opportunity lies.
For crypto traders, the AI trade may therefore be worth watching just as closely as the crypto chart itself.
The question isn't simply whether Bitcoin will rise.
The bigger question is: WHERE IS THE MONEY GOING NEXT?
#bitcoin #cryptotrading #cryptoeducation #MarketUpdate
That sounds strange until you understand one of the most important lessons in markets:
📊 GREAT RESULTS ≠ GREAT STOCK PRICE
SanDisk reported record quarterly revenue of about $8.97B, while Western Digital reported $3.75B, up 44% year-over-year.
Yet investors sold.
Why?
Because markets don't only price what happened.
They price what investors EXPECT to happen next.
SanDisk's forward revenue outlook came in below analyst expectations, while Western Digital faced an even higher expectations problem after its enormous prior run.
This is called an expectations gap.
And crypto traders should pay attention.
🔄 WHY THIS MATTERS FOR BITCOIN
For much of this cycle, capital has been heavily attracted to AI and technology-related assets.
Now we're seeing an interesting divergence:
🔸 AI-linked stocks are facing profit-taking
🔸 Gold has strengthened
🔸 BTC is holding above $64K
🔸 BTC is showing resilience despite recent crypto-specific shocks
🔸 Altcoins remain considerably weaker than BTC
That does NOT automatically mean money is rotating into Bitcoin.
That's the mistake traders should avoid.
Capital rotation needs confirmation.
🧠 WHAT SHOULD TRADERS WATCH?
Don't just ask:
“Is Bitcoin going up?”
Ask:
“Where is capital moving FROM and where is it moving TO?”
Watch:
📌 BTC relative strength vs. equities
📌 BTC ETF flows
📌 BTC dominance
📌 Stablecoin liquidity
📌 Futures open interest & funding
📌 Gold and Treasury yields
📌 AI/tech-sector momentum
📌 Altcoin breadth
If technology weakens while BTC strengthens with increasing institutional flows, the rotation thesis becomes much more interesting.
If tech falls and BTC falls with it, that's not rotation.
That's risk-off.
🎯 THE BIG LESSON
Markets don't move because an asset had “good news.”
They move when reality beats or disappoints expectations and when capital decides where the next opportunity lies.
For crypto traders, the AI trade may therefore be worth watching just as closely as the crypto chart itself.
The question isn't simply whether Bitcoin will rise.
The bigger question is: WHERE IS THE MONEY GOING NEXT?
#bitcoin #cryptotrading #cryptoeducation #MarketUpdate
44
·
--
Статья
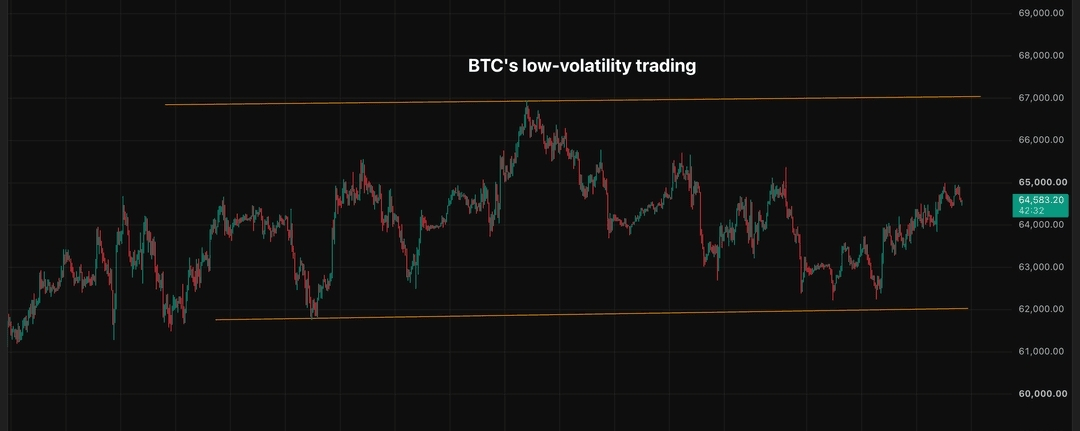
⚠️ BITCOIN LOOKS CALM BUT THAT DOESN’T MEAN THE MARKET IS SAFEBitcoin is hovering around $64,600, while ETH is near $1,907. At first glance, the market looks unusually quiet.
But here’s the lesson traders need to understand:
Low volatility ≠ low risk.
In fact, prolonged periods of unusually low volatility can create the conditions for a much larger move.
🧠 Why does this happen?
When BTC moves inside a narrow range for long enough, traders can become comfortable using leverage because price swings appear limited.
Options become cheaper.
Directional positions become easier to build.
Market makers accumulate hedging exposure.
Then, when BTC finally breaks a heavily positioned level, traders may have to rapidly adjust or close positions.
That positioning can amplify the move — turning a quiet market into a volatile one surprisingly quickly.
📊 What the market is telling us now
BTC's 30-day implied volatility is around 36%, a historically important low area.
Meanwhile:
🔹 BTC remains below $65K
🔹 Demand for downside protection has weakened
🔹 Strong upside call demand is also missing
🔹 BTC and ETH are showing stronger positioning than many altcoins
🔹 DOGE has continued struggling despite BTC stabilizing
That last point is particularly interesting.
When Bitcoin stabilizes but speculative assets such as DOGE remain weak, it can indicate that traders aren't yet willing to chase high-risk exposure.
🎯 What could change the picture?
Bullish catalyst:
Clearer crypto regulation, such as progress around the CLARITY Act, could encourage institutional participation and potentially strengthen ETF inflows.
Bearish catalyst:
A breakdown in geopolitical negotiations or a renewed inflation shock could push yields and risk aversion higher.
🔎 THE TRADER'S LESSON
Don't look at BTC's volatility alone.
Watch the combination of:
BTC price + implied volatility + futures open interest + funding + options positioning + liquidity.
A quiet chart can hide crowded positioning.
And when the market finally chooses a direction, the volatility you didn't see coming may be the volatility that matters most.
This isn't a prediction of an immediate breakout or crash. It's a reminder:
Risk is measured by what can happen next not only by how much price moved yesterday.
#Bitcoin #CryptoTrading #cryptoeducation #BinanceSquare
⚠️ BITCOIN LOOKS CALM BUT THAT DOESN’T MEAN THE MARKET IS SAFE
Bitcoin is hovering around $64,600, while ETH is near $1,907. At first glance, the market looks unusually quiet.
But here’s the lesson traders need to understand:
Low volatility ≠ low risk.
In fact, prolonged periods of unusually low volatility can create the conditions for a much larger move.
🧠 Why does this happen?
When BTC moves inside a narrow range for long enough, traders can become comfortable using leverage because price swings appear limited.
Options become cheaper.
Directional positions become easier to build.
Market makers accumulate hedging exposure.
Then, when BTC finally breaks a heavily positioned level, traders may have to rapidly adjust or close positions.
That positioning can amplify the move — turning a quiet market into a volatile one surprisingly quickly.
📊 What the market is telling us now
BTC's 30-day implied volatility is around 36%, a historically important low area.
Meanwhile:
🔹 BTC remains below $65K
🔹 Demand for downside protection has weakened
🔹 Strong upside call demand is also missing
🔹 BTC and ETH are showing stronger positioning than many altcoins
🔹 DOGE has continued struggling despite BTC stabilizing
That last point is particularly interesting.
When Bitcoin stabilizes but speculative assets such as DOGE remain weak, it can indicate that traders aren't yet willing to chase high-risk exposure.
🎯 What could change the picture?
Bullish catalyst:
Clearer crypto regulation, such as progress around the CLARITY Act, could encourage institutional participation and potentially strengthen ETF inflows.
Bearish catalyst:
A breakdown in geopolitical negotiations or a renewed inflation shock could push yields and risk aversion higher.
🔎 THE TRADER'S LESSON
Don't look at BTC's volatility alone.
Watch the combination of:
BTC price + implied volatility + futures open interest + funding + options positioning + liquidity.
A quiet chart can hide crowded positioning.
And when the market finally chooses a direction, the volatility you didn't see coming may be the volatility that matters most.
This isn't a prediction of an immediate breakout or crash. It's a reminder:
Risk is measured by what can happen next not only by how much price moved yesterday.
#Bitcoin #CryptoTrading #cryptoeducation #BinanceSquare
But here’s the lesson traders need to understand:
Low volatility ≠ low risk.
In fact, prolonged periods of unusually low volatility can create the conditions for a much larger move.
🧠 Why does this happen?
When BTC moves inside a narrow range for long enough, traders can become comfortable using leverage because price swings appear limited.
Options become cheaper.
Directional positions become easier to build.
Market makers accumulate hedging exposure.
Then, when BTC finally breaks a heavily positioned level, traders may have to rapidly adjust or close positions.
That positioning can amplify the move — turning a quiet market into a volatile one surprisingly quickly.
📊 What the market is telling us now
BTC's 30-day implied volatility is around 36%, a historically important low area.
Meanwhile:
🔹 BTC remains below $65K
🔹 Demand for downside protection has weakened
🔹 Strong upside call demand is also missing
🔹 BTC and ETH are showing stronger positioning than many altcoins
🔹 DOGE has continued struggling despite BTC stabilizing
That last point is particularly interesting.
When Bitcoin stabilizes but speculative assets such as DOGE remain weak, it can indicate that traders aren't yet willing to chase high-risk exposure.
🎯 What could change the picture?
Bullish catalyst:
Clearer crypto regulation, such as progress around the CLARITY Act, could encourage institutional participation and potentially strengthen ETF inflows.
Bearish catalyst:
A breakdown in geopolitical negotiations or a renewed inflation shock could push yields and risk aversion higher.
🔎 THE TRADER'S LESSON
Don't look at BTC's volatility alone.
Watch the combination of:
BTC price + implied volatility + futures open interest + funding + options positioning + liquidity.
A quiet chart can hide crowded positioning.
And when the market finally chooses a direction, the volatility you didn't see coming may be the volatility that matters most.
This isn't a prediction of an immediate breakout or crash. It's a reminder:
Risk is measured by what can happen next not only by how much price moved yesterday.
#Bitcoin #CryptoTrading #cryptoeducation #BinanceSquare
36
·
--
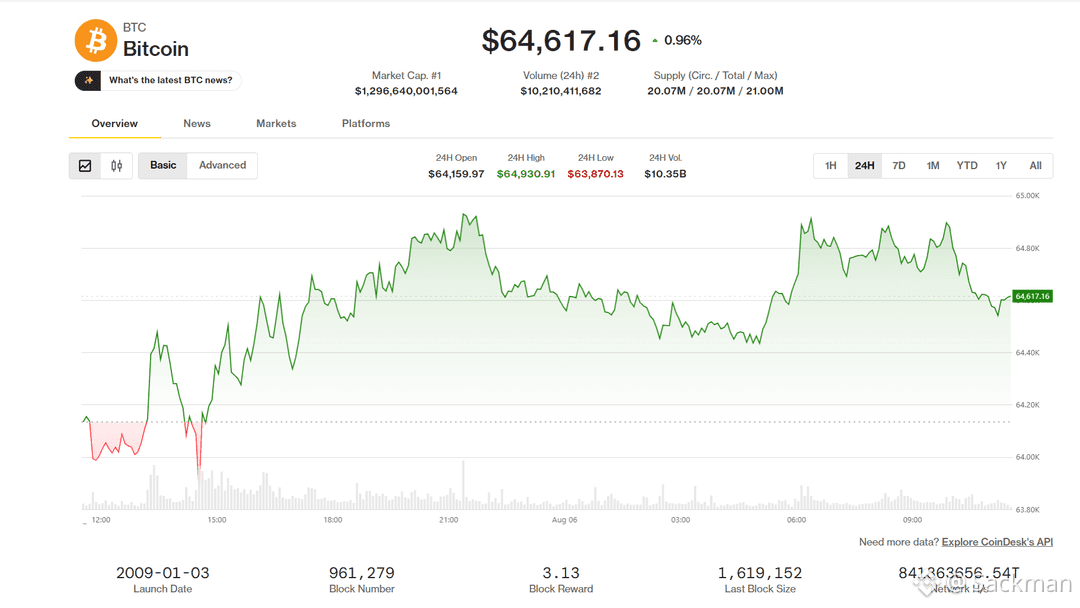
🚨Updates: CRYPTO ROTATION: BTC & ETH HOLD THE LINE AS ALTCOINS LOSE MOMENTUM
The market is showing a clear defensive rotation.
₿ BTC: ~$64.5K — holding stronger than the broader market
♦️ ETH: ~$1.90K — one of the few majors still positive
📉 Altcoin Season Index: 42/100
⚠️ Altcoin open interest: down ~15% over the past month
What traders are watching 👀
• BTC futures OI: ~770K BTC — rising, but previous spikes faded quickly. Sustainability matters.
• XRP: OI +5% while price falls toward $1.04 — a bearish leverage signal.
• SOL: OI continues unwinding after its June peak.
• BTC & ETH CVD: positive, showing stronger aggressive buying than many majors.
• Options: traders are positioning for higher BTC levels, with notable interest around $80K–$96K calls.
The bigger story: capital appears to be moving toward BTC and ETH while traders become more selective with altcoins.
For altseason to return, Bitcoin momentum may need to strengthen first.
Watch BTC price + OI + CVD together. The next move may be forming beneath the surface.
#crypto #bitcoin #Ethereum #altcoins #BinanceSquare
🚨Updates: CRYPTO ROTATION: BTC & ETH HOLD THE LINE AS ALTCOINS LOSE MOMENTUM
The market is showing a clear defensive rotation.
₿ BTC: ~$64.5K — holding stronger than the broader market
♦️ ETH: ~$1.90K — one of the few majors still positive
📉 Altcoin Season Index: 42/100
⚠️ Altcoin open interest: down ~15% over the past month
What traders are watching 👀
• BTC futures OI: ~770K BTC — rising, but previous spikes faded quickly. Sustainability matters.
• XRP: OI +5% while price falls toward $1.04 — a bearish leverage signal.
• SOL: OI continues unwinding after its June peak.
• BTC & ETH CVD: positive, showing stronger aggressive buying than many majors.
• Options: traders are positioning for higher BTC levels, with notable interest around $80K–$96K calls.
The bigger story: capital appears to be moving toward BTC and ETH while traders become more selective with altcoins.
For altseason to return, Bitcoin momentum may need to strengthen first.
Watch BTC price + OI + CVD together. The next move may be forming beneath the surface.
#crypto #bitcoin #Ethereum #altcoins #BinanceSquare
The market is showing a clear defensive rotation.
₿ BTC: ~$64.5K — holding stronger than the broader market
♦️ ETH: ~$1.90K — one of the few majors still positive
📉 Altcoin Season Index: 42/100
⚠️ Altcoin open interest: down ~15% over the past month
What traders are watching 👀
• BTC futures OI: ~770K BTC — rising, but previous spikes faded quickly. Sustainability matters.
• XRP: OI +5% while price falls toward $1.04 — a bearish leverage signal.
• SOL: OI continues unwinding after its June peak.
• BTC & ETH CVD: positive, showing stronger aggressive buying than many majors.
• Options: traders are positioning for higher BTC levels, with notable interest around $80K–$96K calls.
The bigger story: capital appears to be moving toward BTC and ETH while traders become more selective with altcoins.
For altseason to return, Bitcoin momentum may need to strengthen first.
Watch BTC price + OI + CVD together. The next move may be forming beneath the surface.
#crypto #bitcoin #Ethereum #altcoins #BinanceSquare
79
·
--
🚨 CRYPTO WARNING: $10M NFT FUNDRAISE ENDS IN FRAUD CHARGES
A major reminder for crypto investors: fundraising is not the same as accountability.
U.S. prosecutors have charged Taj Tarsha, founder of NFT startup Few and Far, with securities and wire fraud over allegations involving more than $10 million raised from at least 67 investors.
The funds were reportedly raised through SAFT agreements, giving investors rights to 95 million FAR tokens tied to the planned decentralized NFT marketplace.
According to prosecutors, instead of being used primarily to build the project, investor money was allegedly diverted toward:
🎰 Online gambling
₿ Cryptocurrency speculation
🏠 A Miami condominium loan
🎨 Interior design
🎧 Personal DJ-related expenses
Prosecutors also allege that employees were dismissed while a contractor was instructed to make the marketplace appear functional.
The alleged misconduct was reportedly uncovered during a 2023 audit.
The FAR token launched in May 2024, but prosecutors say it quickly became effectively worthless and stopped trading.
⚠️ WHY TRADERS SHOULD CARE
This isn't simply an NFT story.
Before putting money into any crypto project, look beyond the token price:
Who controls the treasury?
Where did the funding go?
Are claims independently verifiable?
What are the token rights?
Is there real product activity?
And what happens if the project fails?
Tarsha is presumed innocent unless proven guilty. Each charge carries a maximum potential sentence of 20 years if convicted.
In crypto, transparency is part of the investment thesis not an optional extra.
Follow Sackam for crypto news, market risks and the signals traders need to watch. 🔎
#CryptoNews #NFT #BİNANCESQUARE #CryptoInvesting #DYOR*
🚨 CRYPTO WARNING: $10M NFT FUNDRAISE ENDS IN FRAUD CHARGES
A major reminder for crypto investors: fundraising is not the same as accountability.
U.S. prosecutors have charged Taj Tarsha, founder of NFT startup Few and Far, with securities and wire fraud over allegations involving more than $10 million raised from at least 67 investors.
The funds were reportedly raised through SAFT agreements, giving investors rights to 95 million FAR tokens tied to the planned decentralized NFT marketplace.
According to prosecutors, instead of being used primarily to build the project, investor money was allegedly diverted toward:
🎰 Online gambling
₿ Cryptocurrency speculation
🏠 A Miami condominium loan
🎨 Interior design
🎧 Personal DJ-related expenses
Prosecutors also allege that employees were dismissed while a contractor was instructed to make the marketplace appear functional.
The alleged misconduct was reportedly uncovered during a 2023 audit.
The FAR token launched in May 2024, but prosecutors say it quickly became effectively worthless and stopped trading.
⚠️ WHY TRADERS SHOULD CARE
This isn't simply an NFT story.
Before putting money into any crypto project, look beyond the token price:
Who controls the treasury?
Where did the funding go?
Are claims independently verifiable?
What are the token rights?
Is there real product activity?
And what happens if the project fails?
Tarsha is presumed innocent unless proven guilty. Each charge carries a maximum potential sentence of 20 years if convicted.
In crypto, transparency is part of the investment thesis not an optional extra.
Follow Sackam for crypto news, market risks and the signals traders need to watch. 🔎
#CryptoNews #NFT #BİNANCESQUARE #CryptoInvesting #DYOR*
A major reminder for crypto investors: fundraising is not the same as accountability.
U.S. prosecutors have charged Taj Tarsha, founder of NFT startup Few and Far, with securities and wire fraud over allegations involving more than $10 million raised from at least 67 investors.
The funds were reportedly raised through SAFT agreements, giving investors rights to 95 million FAR tokens tied to the planned decentralized NFT marketplace.
According to prosecutors, instead of being used primarily to build the project, investor money was allegedly diverted toward:
🎰 Online gambling
₿ Cryptocurrency speculation
🏠 A Miami condominium loan
🎨 Interior design
🎧 Personal DJ-related expenses
Prosecutors also allege that employees were dismissed while a contractor was instructed to make the marketplace appear functional.
The alleged misconduct was reportedly uncovered during a 2023 audit.
The FAR token launched in May 2024, but prosecutors say it quickly became effectively worthless and stopped trading.
⚠️ WHY TRADERS SHOULD CARE
This isn't simply an NFT story.
Before putting money into any crypto project, look beyond the token price:
Who controls the treasury?
Where did the funding go?
Are claims independently verifiable?
What are the token rights?
Is there real product activity?
And what happens if the project fails?
Tarsha is presumed innocent unless proven guilty. Each charge carries a maximum potential sentence of 20 years if convicted.
In crypto, transparency is part of the investment thesis not an optional extra.
Follow Sackam for crypto news, market risks and the signals traders need to watch. 🔎
#CryptoNews #NFT #BİNANCESQUARE #CryptoInvesting #DYOR*
43
·
--
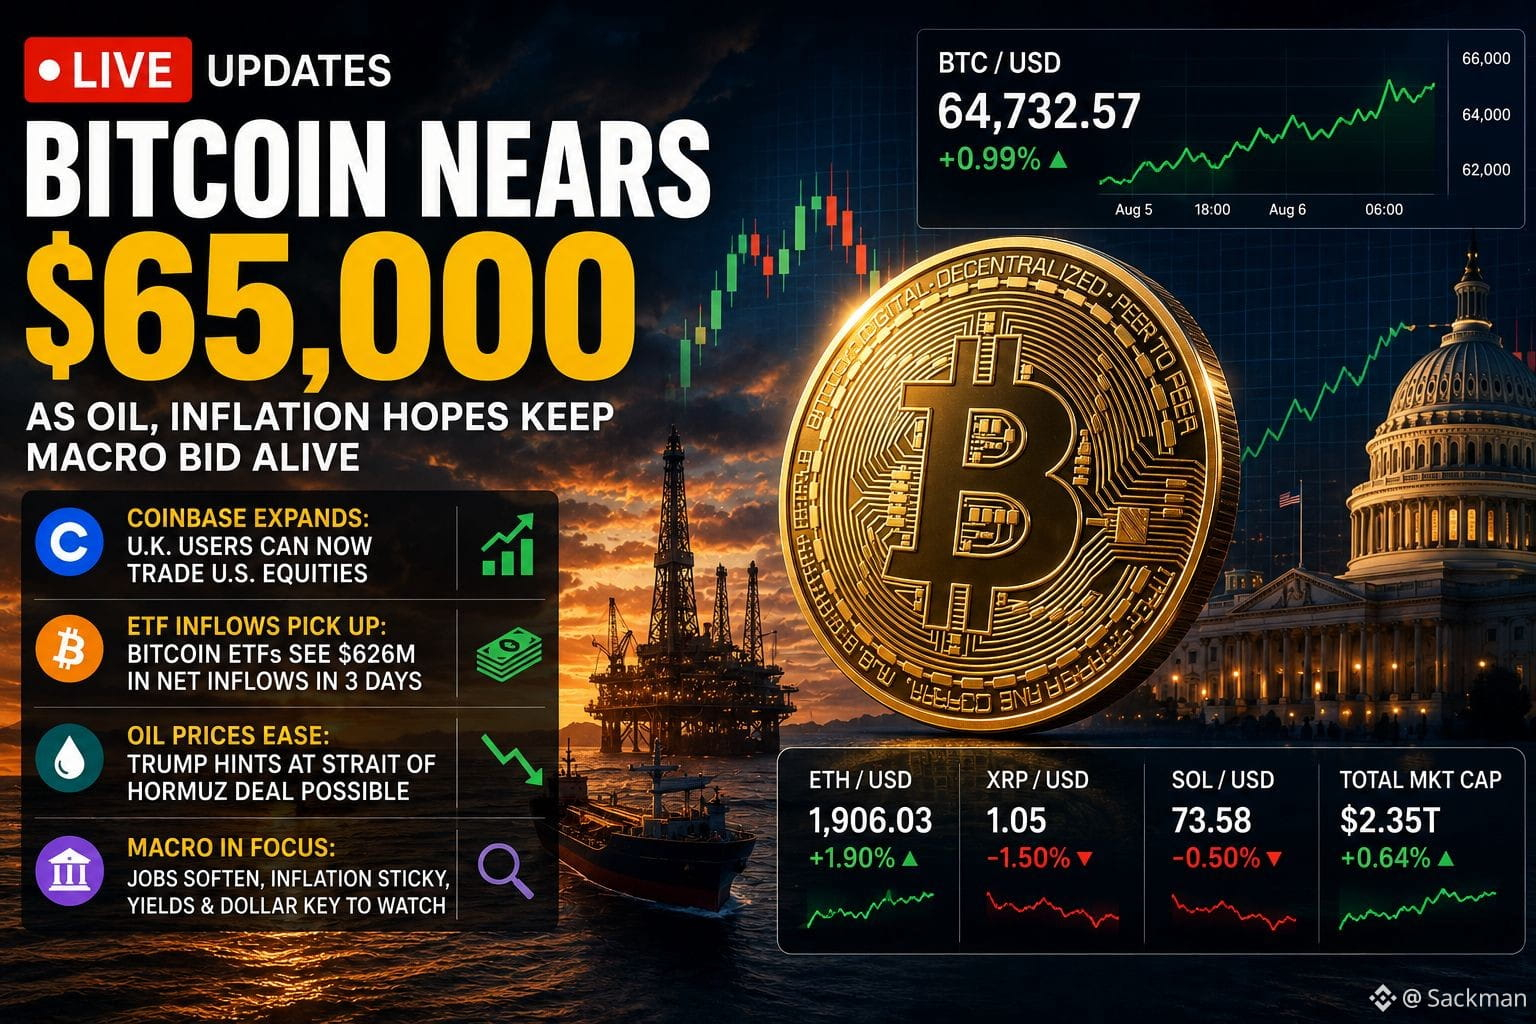
🚨 LIVE CRYPTO UPDATE | BTC NEARS $65K
Bitcoin is hovering around $64.7K, but the real story is bigger than price.
💰 $626M+ has flowed into U.S. spot Bitcoin ETFs in just 3 days.
🛢️ Oil is easing as hopes rise around the Strait of Hormuz potentially reducing inflation pressure.
📉 U.S. hiring is cooling, while inflation remains sticky.
🏦 Now watch the Fed, Treasury yields and the U.S. dollar. If yields and the dollar weaken while ETF inflows continue, Bitcoin could finally break out of its tight range.
$65K is the level everyone is watching. The question is: breakout or rejection? 👀
Follow Sackman for live crypto market updates and the signals behind the moves.
$BTC $ETH
#bitcoin #BİNANCESQUARE #BitcoinETFs #Ethereum✅ #BTCUpdate
🚨 LIVE CRYPTO UPDATE | BTC NEARS $65K
Bitcoin is hovering around $64.7K, but the real story is bigger than price.
💰 $626M+ has flowed into U.S. spot Bitcoin ETFs in just 3 days.
🛢️ Oil is easing as hopes rise around the Strait of Hormuz potentially reducing inflation pressure.
📉 U.S. hiring is cooling, while inflation remains sticky.
🏦 Now watch the Fed, Treasury yields and the U.S. dollar. If yields and the dollar weaken while ETF inflows continue, Bitcoin could finally break out of its tight range.
$65K is the level everyone is watching. The question is: breakout or rejection? 👀
Follow Sackman for live crypto market updates and the signals behind the moves.
$BTC $ETH
#bitcoin #BİNANCESQUARE #BitcoinETFs #Ethereum✅ #BTCUpdate
Bitcoin is hovering around $64.7K, but the real story is bigger than price.
💰 $626M+ has flowed into U.S. spot Bitcoin ETFs in just 3 days.
🛢️ Oil is easing as hopes rise around the Strait of Hormuz potentially reducing inflation pressure.
📉 U.S. hiring is cooling, while inflation remains sticky.
🏦 Now watch the Fed, Treasury yields and the U.S. dollar. If yields and the dollar weaken while ETF inflows continue, Bitcoin could finally break out of its tight range.
$65K is the level everyone is watching. The question is: breakout or rejection? 👀
Follow Sackman for live crypto market updates and the signals behind the moves.
$BTC $ETH
#bitcoin #BİNANCESQUARE #BitcoinETFs #Ethereum✅ #BTCUpdate
66
·
--
What if a contract could execute itself? 🤖⛓️
In Lesson 11, we break down smart contracts how code can automatically execute rules on a blockchain, power DeFi and DApps, and create new possibilities without traditional intermediaries.
🎥 Watch the full presentation and discover how smart contracts actually work.
Don’t just use crypto. Understand the technology behind it.
Follow, share #Beginnersguide #LearnTogether #learncryto $BTC
What if a contract could execute itself? 🤖⛓️
In Lesson 11, we break down smart contracts how code can automatically execute rules on a blockchain, power DeFi and DApps, and create new possibilities without traditional intermediaries.
🎥 Watch the full presentation and discover how smart contracts actually work.
Don’t just use crypto. Understand the technology behind it.
Follow, share #Beginnersguide #LearnTogether #learncryto $BTC
In Lesson 11, we break down smart contracts how code can automatically execute rules on a blockchain, power DeFi and DApps, and create new possibilities without traditional intermediaries.
🎥 Watch the full presentation and discover how smart contracts actually work.
Don’t just use crypto. Understand the technology behind it.
Follow, share #Beginnersguide #LearnTogether #learncryto $BTC
106
·
--
Статья
The Whale Signal Is Getting Loud: XRP Absorbs the Sell-Off While Ethereum Enters the Pain ZoneXRP is falling, but its biggest traders aren't behaving like they're giving up. Ethereum is telling a very different story — and that divergence could be more important than the daily price chart.
The cryptocurrency market is currently presenting investors with a puzzle.
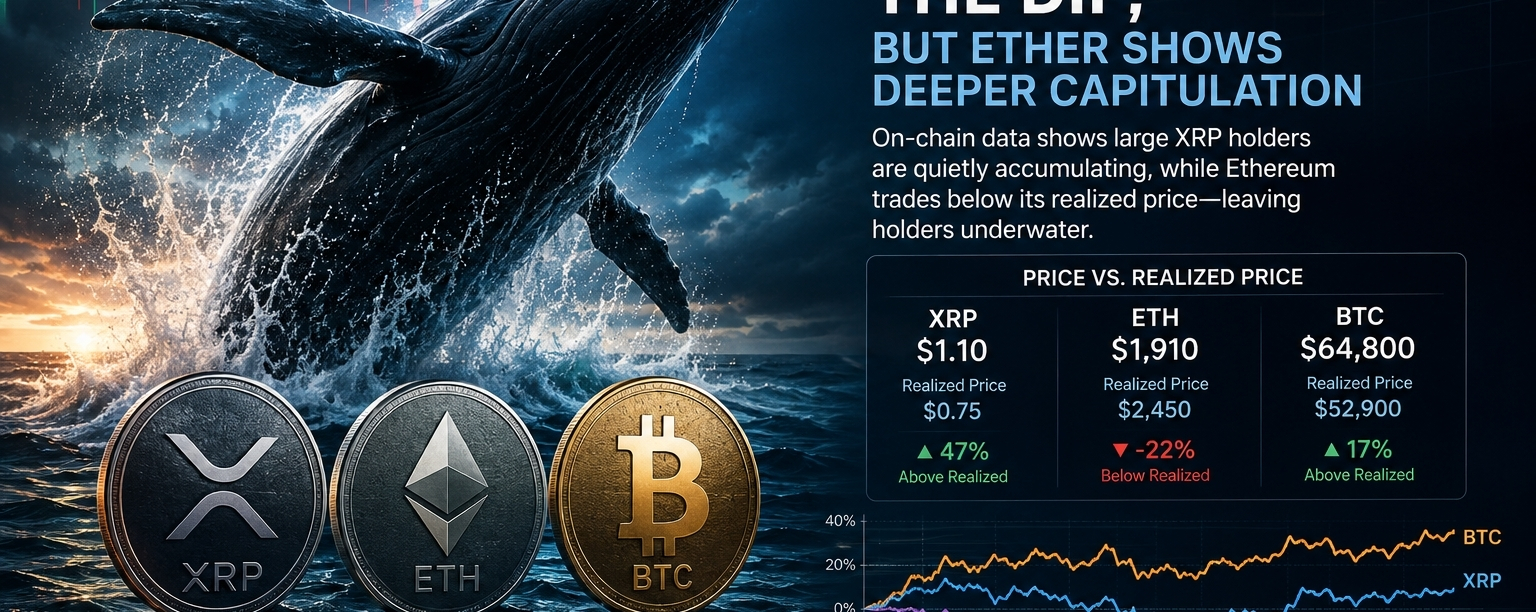
Bitcoin is hovering around $64,800, XRP is near $1.05, and Ethereum is trading around $1,900. On the surface, all three remain under pressure compared with their earlier 2026 levels.
But beneath the prices, the behaviour of large holders is becoming increasingly interesting.
The latest on-chain data suggests that XRP whales are continuing to participate during the decline, while Ethereum has entered a much more uncomfortable position: its market price sits below the estimated realized price of its holder base.
That creates three very different market conditions.
XRP is being absorbed.
Ethereum is being capitulated.
Bitcoin is being defended.
The question is which of those conditions comes first to matter.
XRP's price is weak but whale activity isn't disappearing
XRP has fallen dramatically from the roughly $2.30–$2.40 area seen earlier this year to around $1.10.
Normally, a decline of that magnitude would raise concerns about large holders abandoning the asset.
The on-chain picture is more complicated.
CryptoQuant's spot average-order data has continued to show unusually large XRP transactions, suggesting that whales remain active in the market. Earlier analysis also found large-holder activity strengthening while retail participation remained comparatively cautious.
But there is an important distinction that investors should not miss:
Whale activity does not automatically mean whale accumulation.
Large orders can represent buying or selling.
What makes the current XRP setup interesting is the combination of continued large-order activity and a market that has not collapsed through the $1 area.
That looks more like supply being absorbed than a clean panic exit.
It is not proof that XRP is preparing for a breakout. But it does suggest that the market's largest participants have not simply walked away.
The real XRP question: who's absorbing whom?
This is where the story becomes deeper than simply saying “whales are buying the dip.”
A whale can buy because it believes an asset is cheap.
But a whale can also buy because it is providing liquidity while another large participant sells.
That is why price response matters.
If large XRP orders continue appearing while downside pressure weakens, the market may be moving through an absorption phase.
If price instead continues falling despite those large orders, the interpretation changes: whales may be providing liquidity to sellers rather than accumulating for a longer-term move.
That distinction will become clearer through spot volume, exchange flows, taker CVD and price reaction around major support levels.
And there is another piece of evidence worth watching.
U.S. XRP ETFs have attracted institutional capital even while XRP has remained significantly below its early-year highs. Recent reporting put cumulative ETF inflows at roughly $1.47 billion, showing that investment demand through regulated products has not simply disappeared alongside the price decline.
That creates an unusual market structure:
Institutional exposure can increase while the token price remains weak.
That is not necessarily bullish but it is certainly worth watching.
Ethereum has a completely different problem
Ethereum's story is more painful.
ETH is trading around $1,900, while its realized price is estimated near $2,450.
Realized price is not a traditional support or resistance level. It represents the volume-weighted average price at which circulating coins last moved on-chain. When market price falls below realized price, the aggregate holder base is considered to be sitting in unrealized loss.
That makes Ethereum's current position particularly significant.
Bitcoin, by comparison, remains well above its roughly $52,900 realized price.
XRP is also above its estimated realized value of roughly $0.75.
So among these three assets, ETH is the outlier.
It is the only one where the current market price is below the estimated aggregate cost basis of its holders
That is what makes the Ethereum setup simultaneously bearish and potentially interesting.
Capitulation can create opportunity but it doesn't call the bottom
This is where crypto narratives often become too simplistic.
“ETH is below realized price” does not mean Ethereum must immediately rally.
It means a significant portion of the holder base is underwater.
That can create two opposing forces.
The first is capitulation.
Investors who have lost confidence may finally decide that waiting for a recovery is no longer worthwhile. That can create additional selling pressure and potentially push price even further below realized value.
The second is valuation-driven accumulation.
Investors who believe the market has become excessively pessimistic can begin buying from those sellers.
The eventual bottom is created when the second force becomes stronger than the first.
That is why realized price should be treated as context, not a magic floor.
Ethereum's whale structure adds another layer
The distribution of ETH among large wallets is also changing.
The data supplied by CryptoQuant shows substantial growth among wallets holding 10,000–100,000 ETH, while the very largest holders have also rebuilt positions after falling sharply during 2025.
At the same time, the 1,000–10,000 ETH cohort has declined from its January peak.
That suggests Ethereum is not simply experiencing uniform selling.
Instead, ownership is being redistributed.
Some large holders appear to be increasing their exposure while another group has reduced theirs.
That matters because the identity of the marginal seller can influence what happens next.
If smaller whales are exiting into stronger hands, the decline can eventually become an accumulation event.
If larger holders are distributing into weaker demand, the market may have further to fall.
Again, the price reaction has to confirm the on-chain story.
Bitcoin is quietly telling the market something too
Bitcoin's position is less dramatic.
Large-holder balances, excluding exchange and mining-pool addresses, have recovered from their late 2025 lows and were reported around 3.06 million BTC, although still below the previous cycle peak.
The more important point is that Bitcoin remains above realized price.
That means its aggregate holder base is in a fundamentally different position from Ethereum's.
And that could help explain why BTC continues to behave as the market's relative safe haven within crypto while ETH and XRP fight their own battles.
Recent market data also shows Bitcoin stabilizing around the $64,000 area even as Ethereum's recovery remains weaker.
Three coins. Three different market stories.
The current structure can therefore be summarized in a much more useful way than simply ranking daily percentage gains.
🐋 XRP The Absorption Test
Large orders remain active and institutional demand has persisted, but the market has not yet converted that activity into a decisive breakout.
Bullish confirmation: accumulation accompanied by rising spot demand and a sustained break above resistance.
Warning: large orders continue while price keeps falling and exchange inflows accelerate.
🔥 Ethereum The Capitulation Test
ETH is trading below realized value, placing its holder base in a much deeper unrealized loss environment than BTC or XRP.
Bullish confirmation: selling exhaustion followed by sustained spot accumulation.
Warning: realized value losses deepen alongside increasing exchange deposits and forced selling.
🟠 Bitcoin The Resilience Test
BTC remains above realized price and continues to hold a significantly stronger cost-basis position than ETH.
Bullish confirmation: renewed institutional demand and a sustained move through resistance.
Warning: losing major support while whale balances begin contracting again.
The bigger story isn't whales. It's liquidity.
There is a temptation in crypto to treat whale wallets as an oracle.
They aren't.
Large holders can be wrong. Wallet movements can have multiple explanations. Exchange transfers can represent preparation for selling, custody changes, internal restructuring or other activity.
The more powerful signal comes when on-chain behaviour, spot demand, derivatives positioning, ETF flows and price structure all point in the same direction.
That is not happening decisively yet.
And that may be the most important conclusion from the current data.
XRP is showing evidence of absorption, but not yet a confirmed reversal.
Ethereum is showing deep valuation stress, but being underwater does not guarantee a bottom.
Bitcoin is showing relative resilience, but resilience must eventually translate into demand if the broader market is going to follow.
What could trigger the next major move?
The market is now approaching a point where several signals could collide.
For XRP, traders will be watching whether the accumulation narrative develops into genuine spot demand and whether the token can reclaim the levels that previously rejected the recovery.
For Ethereum, the critical question is whether below-realized-price trading attracts long-term buyers or instead becomes the starting point for another liquidation wave.
For Bitcoin, the test is whether institutional demand can overpower the persistent macro and liquidity headwinds that have kept crypto from fully participating in the broader risk rally.
The market does not need another headline.
It needs confirmation.
And if XRP's whales continue absorbing supply while Ethereum's capitulation begins to exhaust sellers, the next major crypto rotation may already be forming beneath the surface.
The whales may be moving first. The price chart just hasn't decided what their movements mean yet.
The Whale Signal Is Getting Loud: XRP Absorbs the Sell-Off While Ethereum Enters the Pain Zone
XRP is falling, but its biggest traders aren't behaving like they're giving up. Ethereum is telling a very different story — and that divergence could be more important than the daily price chart.
The cryptocurrency market is currently presenting investors with a puzzle.
Bitcoin is hovering around $64,800, XRP is near $1.05, and Ethereum is trading around $1,900. On the surface, all three remain under pressure compared with their earlier 2026 levels.
But beneath the prices, the behaviour of large holders is becoming increasingly interesting.
The latest on-chain data suggests that XRP whales are continuing to participate during the decline, while Ethereum has entered a much more uncomfortable position: its market price sits below the estimated realized price of its holder base.
That creates three very different market conditions.
XRP is being absorbed.
Ethereum is being capitulated.
Bitcoin is being defended.
The question is which of those conditions comes first to matter.
XRP's price is weak but whale activity isn't disappearing
XRP has fallen dramatically from the roughly $2.30–$2.40 area seen earlier this year to around $1.10.
Normally, a decline of that magnitude would raise concerns about large holders abandoning the asset.
The on-chain picture is more complicated.
CryptoQuant's spot average-order data has continued to show unusually large XRP transactions, suggesting that whales remain active in the market. Earlier analysis also found large-holder activity strengthening while retail participation remained comparatively cautious.
But there is an important distinction that investors should not miss:
Whale activity does not automatically mean whale accumulation.
Large orders can represent buying or selling.
What makes the current XRP setup interesting is the combination of continued large-order activity and a market that has not collapsed through the $1 area.
That looks more like supply being absorbed than a clean panic exit.
It is not proof that XRP is preparing for a breakout. But it does suggest that the market's largest participants have not simply walked away.
The real XRP question: who's absorbing whom?
This is where the story becomes deeper than simply saying “whales are buying the dip.”
A whale can buy because it believes an asset is cheap.
But a whale can also buy because it is providing liquidity while another large participant sells.
That is why price response matters.
If large XRP orders continue appearing while downside pressure weakens, the market may be moving through an absorption phase.
If price instead continues falling despite those large orders, the interpretation changes: whales may be providing liquidity to sellers rather than accumulating for a longer-term move.
That distinction will become clearer through spot volume, exchange flows, taker CVD and price reaction around major support levels.
And there is another piece of evidence worth watching.
U.S. XRP ETFs have attracted institutional capital even while XRP has remained significantly below its early-year highs. Recent reporting put cumulative ETF inflows at roughly $1.47 billion, showing that investment demand through regulated products has not simply disappeared alongside the price decline.
That creates an unusual market structure:
Institutional exposure can increase while the token price remains weak.
That is not necessarily bullish but it is certainly worth watching.
Ethereum has a completely different problem
Ethereum's story is more painful.
ETH is trading around $1,900, while its realized price is estimated near $2,450.
Realized price is not a traditional support or resistance level. It represents the volume-weighted average price at which circulating coins last moved on-chain. When market price falls below realized price, the aggregate holder base is considered to be sitting in unrealized loss.
That makes Ethereum's current position particularly significant.
Bitcoin, by comparison, remains well above its roughly $52,900 realized price.
XRP is also above its estimated realized value of roughly $0.75.
So among these three assets, ETH is the outlier.
It is the only one where the current market price is below the estimated aggregate cost basis of its holders
That is what makes the Ethereum setup simultaneously bearish and potentially interesting.
Capitulation can create opportunity but it doesn't call the bottom
This is where crypto narratives often become too simplistic.
“ETH is below realized price” does not mean Ethereum must immediately rally.
It means a significant portion of the holder base is underwater.
That can create two opposing forces.
The first is capitulation.
Investors who have lost confidence may finally decide that waiting for a recovery is no longer worthwhile. That can create additional selling pressure and potentially push price even further below realized value.
The second is valuation-driven accumulation.
Investors who believe the market has become excessively pessimistic can begin buying from those sellers.
The eventual bottom is created when the second force becomes stronger than the first.
That is why realized price should be treated as context, not a magic floor.
Ethereum's whale structure adds another layer
The distribution of ETH among large wallets is also changing.
The data supplied by CryptoQuant shows substantial growth among wallets holding 10,000–100,000 ETH, while the very largest holders have also rebuilt positions after falling sharply during 2025.
At the same time, the 1,000–10,000 ETH cohort has declined from its January peak.
That suggests Ethereum is not simply experiencing uniform selling.
Instead, ownership is being redistributed.
Some large holders appear to be increasing their exposure while another group has reduced theirs.
That matters because the identity of the marginal seller can influence what happens next.
If smaller whales are exiting into stronger hands, the decline can eventually become an accumulation event.
If larger holders are distributing into weaker demand, the market may have further to fall.
Again, the price reaction has to confirm the on-chain story.
Bitcoin is quietly telling the market something too
Bitcoin's position is less dramatic.
Large-holder balances, excluding exchange and mining-pool addresses, have recovered from their late 2025 lows and were reported around 3.06 million BTC, although still below the previous cycle peak.
The more important point is that Bitcoin remains above realized price.
That means its aggregate holder base is in a fundamentally different position from Ethereum's.
And that could help explain why BTC continues to behave as the market's relative safe haven within crypto while ETH and XRP fight their own battles.
Recent market data also shows Bitcoin stabilizing around the $64,000 area even as Ethereum's recovery remains weaker.
Three coins. Three different market stories.
The current structure can therefore be summarized in a much more useful way than simply ranking daily percentage gains.
🐋 XRP The Absorption Test
Large orders remain active and institutional demand has persisted, but the market has not yet converted that activity into a decisive breakout.
Bullish confirmation: accumulation accompanied by rising spot demand and a sustained break above resistance.
Warning: large orders continue while price keeps falling and exchange inflows accelerate.
🔥 Ethereum The Capitulation Test
ETH is trading below realized value, placing its holder base in a much deeper unrealized loss environment than BTC or XRP.
Bullish confirmation: selling exhaustion followed by sustained spot accumulation.
Warning: realized value losses deepen alongside increasing exchange deposits and forced selling.
🟠 Bitcoin The Resilience Test
BTC remains above realized price and continues to hold a significantly stronger cost-basis position than ETH.
Bullish confirmation: renewed institutional demand and a sustained move through resistance.
Warning: losing major support while whale balances begin contracting again.
The bigger story isn't whales. It's liquidity.
There is a temptation in crypto to treat whale wallets as an oracle.
They aren't.
Large holders can be wrong. Wallet movements can have multiple explanations. Exchange transfers can represent preparation for selling, custody changes, internal restructuring or other activity.
The more powerful signal comes when on-chain behaviour, spot demand, derivatives positioning, ETF flows and price structure all point in the same direction.
That is not happening decisively yet.
And that may be the most important conclusion from the current data.
XRP is showing evidence of absorption, but not yet a confirmed reversal.
Ethereum is showing deep valuation stress, but being underwater does not guarantee a bottom.
Bitcoin is showing relative resilience, but resilience must eventually translate into demand if the broader market is going to follow.
What could trigger the next major move?
The market is now approaching a point where several signals could collide.
For XRP, traders will be watching whether the accumulation narrative develops into genuine spot demand and whether the token can reclaim the levels that previously rejected the recovery.
For Ethereum, the critical question is whether below-realized-price trading attracts long-term buyers or instead becomes the starting point for another liquidation wave.
For Bitcoin, the test is whether institutional demand can overpower the persistent macro and liquidity headwinds that have kept crypto from fully participating in the broader risk rally.
The market does not need another headline.
It needs confirmation.
And if XRP's whales continue absorbing supply while Ethereum's capitulation begins to exhaust sellers, the next major crypto rotation may already be forming beneath the surface.
The whales may be moving first. The price chart just hasn't decided what their movements mean yet.
The cryptocurrency market is currently presenting investors with a puzzle.
Bitcoin is hovering around $64,800, XRP is near $1.05, and Ethereum is trading around $1,900. On the surface, all three remain under pressure compared with their earlier 2026 levels.
But beneath the prices, the behaviour of large holders is becoming increasingly interesting.
The latest on-chain data suggests that XRP whales are continuing to participate during the decline, while Ethereum has entered a much more uncomfortable position: its market price sits below the estimated realized price of its holder base.
That creates three very different market conditions.
XRP is being absorbed.
Ethereum is being capitulated.
Bitcoin is being defended.
The question is which of those conditions comes first to matter.
XRP's price is weak but whale activity isn't disappearing
XRP has fallen dramatically from the roughly $2.30–$2.40 area seen earlier this year to around $1.10.
Normally, a decline of that magnitude would raise concerns about large holders abandoning the asset.
The on-chain picture is more complicated.
CryptoQuant's spot average-order data has continued to show unusually large XRP transactions, suggesting that whales remain active in the market. Earlier analysis also found large-holder activity strengthening while retail participation remained comparatively cautious.
But there is an important distinction that investors should not miss:
Whale activity does not automatically mean whale accumulation.
Large orders can represent buying or selling.
What makes the current XRP setup interesting is the combination of continued large-order activity and a market that has not collapsed through the $1 area.
That looks more like supply being absorbed than a clean panic exit.
It is not proof that XRP is preparing for a breakout. But it does suggest that the market's largest participants have not simply walked away.
The real XRP question: who's absorbing whom?
This is where the story becomes deeper than simply saying “whales are buying the dip.”
A whale can buy because it believes an asset is cheap.
But a whale can also buy because it is providing liquidity while another large participant sells.
That is why price response matters.
If large XRP orders continue appearing while downside pressure weakens, the market may be moving through an absorption phase.
If price instead continues falling despite those large orders, the interpretation changes: whales may be providing liquidity to sellers rather than accumulating for a longer-term move.
That distinction will become clearer through spot volume, exchange flows, taker CVD and price reaction around major support levels.
And there is another piece of evidence worth watching.
U.S. XRP ETFs have attracted institutional capital even while XRP has remained significantly below its early-year highs. Recent reporting put cumulative ETF inflows at roughly $1.47 billion, showing that investment demand through regulated products has not simply disappeared alongside the price decline.
That creates an unusual market structure:
Institutional exposure can increase while the token price remains weak.
That is not necessarily bullish but it is certainly worth watching.
Ethereum has a completely different problem
Ethereum's story is more painful.
ETH is trading around $1,900, while its realized price is estimated near $2,450.
Realized price is not a traditional support or resistance level. It represents the volume-weighted average price at which circulating coins last moved on-chain. When market price falls below realized price, the aggregate holder base is considered to be sitting in unrealized loss.
That makes Ethereum's current position particularly significant.
Bitcoin, by comparison, remains well above its roughly $52,900 realized price.
XRP is also above its estimated realized value of roughly $0.75.
So among these three assets, ETH is the outlier.
It is the only one where the current market price is below the estimated aggregate cost basis of its holders
That is what makes the Ethereum setup simultaneously bearish and potentially interesting.
Capitulation can create opportunity but it doesn't call the bottom
This is where crypto narratives often become too simplistic.
“ETH is below realized price” does not mean Ethereum must immediately rally.
It means a significant portion of the holder base is underwater.
That can create two opposing forces.
The first is capitulation.
Investors who have lost confidence may finally decide that waiting for a recovery is no longer worthwhile. That can create additional selling pressure and potentially push price even further below realized value.
The second is valuation-driven accumulation.
Investors who believe the market has become excessively pessimistic can begin buying from those sellers.
The eventual bottom is created when the second force becomes stronger than the first.
That is why realized price should be treated as context, not a magic floor.
Ethereum's whale structure adds another layer
The distribution of ETH among large wallets is also changing.
The data supplied by CryptoQuant shows substantial growth among wallets holding 10,000–100,000 ETH, while the very largest holders have also rebuilt positions after falling sharply during 2025.
At the same time, the 1,000–10,000 ETH cohort has declined from its January peak.
That suggests Ethereum is not simply experiencing uniform selling.
Instead, ownership is being redistributed.
Some large holders appear to be increasing their exposure while another group has reduced theirs.
That matters because the identity of the marginal seller can influence what happens next.
If smaller whales are exiting into stronger hands, the decline can eventually become an accumulation event.
If larger holders are distributing into weaker demand, the market may have further to fall.
Again, the price reaction has to confirm the on-chain story.
Bitcoin is quietly telling the market something too
Bitcoin's position is less dramatic.
Large-holder balances, excluding exchange and mining-pool addresses, have recovered from their late 2025 lows and were reported around 3.06 million BTC, although still below the previous cycle peak.
The more important point is that Bitcoin remains above realized price.
That means its aggregate holder base is in a fundamentally different position from Ethereum's.
And that could help explain why BTC continues to behave as the market's relative safe haven within crypto while ETH and XRP fight their own battles.
Recent market data also shows Bitcoin stabilizing around the $64,000 area even as Ethereum's recovery remains weaker.
Three coins. Three different market stories.
The current structure can therefore be summarized in a much more useful way than simply ranking daily percentage gains.
🐋 XRP The Absorption Test
Large orders remain active and institutional demand has persisted, but the market has not yet converted that activity into a decisive breakout.
Bullish confirmation: accumulation accompanied by rising spot demand and a sustained break above resistance.
Warning: large orders continue while price keeps falling and exchange inflows accelerate.
🔥 Ethereum The Capitulation Test
ETH is trading below realized value, placing its holder base in a much deeper unrealized loss environment than BTC or XRP.
Bullish confirmation: selling exhaustion followed by sustained spot accumulation.
Warning: realized value losses deepen alongside increasing exchange deposits and forced selling.
🟠 Bitcoin The Resilience Test
BTC remains above realized price and continues to hold a significantly stronger cost-basis position than ETH.
Bullish confirmation: renewed institutional demand and a sustained move through resistance.
Warning: losing major support while whale balances begin contracting again.
The bigger story isn't whales. It's liquidity.
There is a temptation in crypto to treat whale wallets as an oracle.
They aren't.
Large holders can be wrong. Wallet movements can have multiple explanations. Exchange transfers can represent preparation for selling, custody changes, internal restructuring or other activity.
The more powerful signal comes when on-chain behaviour, spot demand, derivatives positioning, ETF flows and price structure all point in the same direction.
That is not happening decisively yet.
And that may be the most important conclusion from the current data.
XRP is showing evidence of absorption, but not yet a confirmed reversal.
Ethereum is showing deep valuation stress, but being underwater does not guarantee a bottom.
Bitcoin is showing relative resilience, but resilience must eventually translate into demand if the broader market is going to follow.
What could trigger the next major move?
The market is now approaching a point where several signals could collide.
For XRP, traders will be watching whether the accumulation narrative develops into genuine spot demand and whether the token can reclaim the levels that previously rejected the recovery.
For Ethereum, the critical question is whether below-realized-price trading attracts long-term buyers or instead becomes the starting point for another liquidation wave.
For Bitcoin, the test is whether institutional demand can overpower the persistent macro and liquidity headwinds that have kept crypto from fully participating in the broader risk rally.
The market does not need another headline.
It needs confirmation.
And if XRP's whales continue absorbing supply while Ethereum's capitulation begins to exhaust sellers, the next major crypto rotation may already be forming beneath the surface.
The whales may be moving first. The price chart just hasn't decided what their movements mean yet.
89
·
--
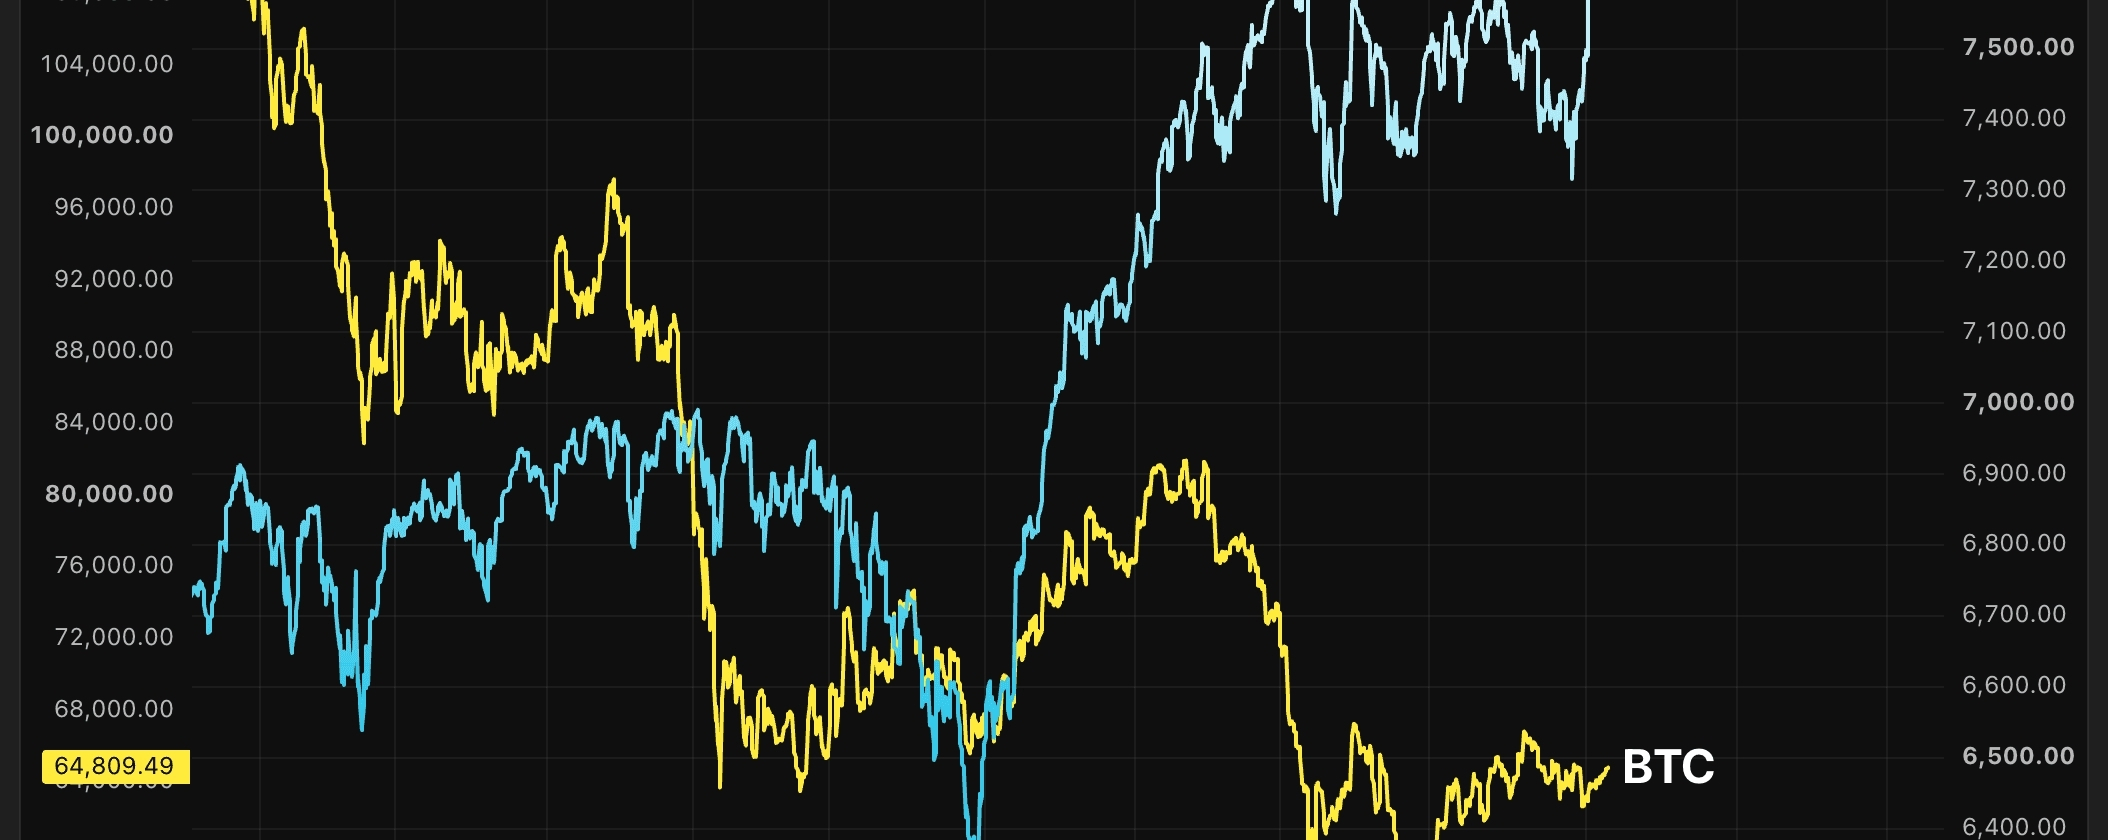
Статья
Why Bitcoin Remains Below $65,000 as the S&P 500 Adds $2 Trillion in Market ValueBitcoin is struggling to keep pace with Wall Street, despite a powerful risk-on rally in U.S. equities. The divergence highlights a changing relationship between traditional markets and crypto — and raises questions about what Bitcoin needs to break higher.
U.S. stocks are having a strong August, but Bitcoin has largely refused to join the party.
The S&P 500 has climbed roughly 3.12% this month, adding an estimated $2.1 trillion to its market capitalization and pushing its total value to around $70.5 trillion. The Nasdaq and Dow Jones have also remained firmly supported.
Bitcoin, meanwhile, has gained only around 2% this month and continues to trade near the $64,000–$65,000 area.
That disconnect is notable because Bitcoin has increasingly traded alongside traditional risk assets since the 2020 market crash. Yet the latest stock-market rally appears to be driven by factors that do not necessarily translate into cryptocurrency demand.
AI Is Driving Stocks — But Not Bitcoin
One of the biggest reasons for the divergence is the composition of the equity rally.
The latest move higher in U.S. stocks has been heavily concentrated in artificial intelligence, semiconductor and mega-cap technology companies.
Those sectors have little direct exposure to Bitcoin.
As a result, investors can be aggressively buying equities without necessarily increasing their exposure to crypto.
The distinction matters. A broad-based improvement in global risk appetite could potentially lift stocks and Bitcoin together. But when capital is flowing specifically toward AI and semiconductor companies, the transmission into crypto becomes much weaker.
Falling Oil Prices Could Eventually Help Bitcoin
Another important development is the renewed decline in oil prices and expectations that energy markets could normalize as conditions around the Strait of Hormuz improve.
Lower oil prices are generally supportive of equities because they can reduce costs for businesses.
For Bitcoin, however, the impact is more indirect.
Lower energy prices could reduce inflationary pressure, potentially influencing expectations for Federal Reserve monetary policy. If markets eventually begin pricing in a less restrictive Fed, liquidity-sensitive assets such as Bitcoin could benefit.
But that process takes time.
For now, uncertainty surrounding the Federal Reserve's next moves continues to keep investors cautious.
Crypto Has Its Own Problems
Bitcoin's underperformance isn't entirely about stocks.
The cryptocurrency market is also dealing with several crypto-specific pressures.
Recent concerns include the reported $120 million Coldcard exploit, uncertainty surrounding the Clarity Act, and reports involving Strategy's Bitcoin holdings.
These developments have weighed on sentiment and contributed to a more cautious market environment.
At the same time, the supply of major stablecoins has declined.
USDT supply reportedly fell from approximately $190 billion in April to $183 billion, while USDC declined from roughly $79.5 billion to $72 billion.
That matters because stablecoins provide an important source of liquidity within crypto markets.
If investors can earn attractive real returns through traditional fixed-income markets, there is less incentive to keep capital sitting inside crypto.
Bitcoin's Four-Year Cycle Is Also Affecting Investor Behaviour
Perhaps one of the most interesting factors is the market's belief in Bitcoin's traditional four-year cycle.
Some traders now expect Bitcoin to experience a significant bottom around October.
That expectation itself may be influencing behaviour.
Rather than aggressively buying Bitcoin during the current stock-market rally, some traders appear to be waiting for a potential correction later in the year.
This creates a curious situation: the expectation of a future Bitcoin bottom could actually be helping prevent traders from positioning aggressively today.
But there is another interpretation.
Bitcoin has remained relatively resilient despite a still-hawkish Federal Reserve environment. If monetary policy becomes less restrictive than expected, the market may discover that Bitcoin's anticipated cycle bottom has already occurred.
ETF Demand Needs to Prove Itself
Institutional Bitcoin demand is another major piece of the puzzle.
U.S.-listed spot Bitcoin ETFs recently recorded an outflow of approximately $61.5 million, interrupting a weak period of inflows.
However, this week's ETF flows have reportedly turned positive, bringing in approximately $626 million the strongest weekly inflow figure since early May.
The question now is whether that demand can continue.
A few positive sessions are not enough to establish a new trend. Sustained ETF inflows would provide stronger evidence that institutional investors are returning to Bitcoin.
The Key Levels Traders Are Watching
Bitcoin is currently caught in a relatively narrow range.
Market observers are watching approximately $63,000–$63,400 as support, while $64,500–$66,000 represents an important resistance area.
A decisive move above the upper resistance zone could change the short-term market structure and potentially attract momentum buyers.
Conversely, a breakdown below the $63,000 region would reinforce concerns that Bitcoin remains vulnerable to another leg lower.
Bitcoin Needs Its Own Catalyst
The bigger story is that Bitcoin can no longer simply rely on Wall Street's strength to generate upside.
The S&P 500 has demonstrated that investors are willing to take risk — but that risk appetite is currently being directed toward AI, semiconductors and mega-cap equities rather than crypto.
Bitcoin therefore needs a catalyst of its own.
That could come from stronger ETF inflows, improving liquidity, regulatory clarity, stablecoin growth, easier monetary policy or renewed institutional demand.
Until then, Bitcoin's inability to follow a surging S&P 500 suggests that the crypto market is still waiting for its next major narrative.
The Bottom Line
The current divergence does not necessarily mean Bitcoin is permanently disconnected from stocks.
Instead, it shows that not every risk-on rally is created equally.
Wall Street can add trillions in value while Bitcoin remains trapped below $65,000 when the money is concentrated in sectors with little direct connection to crypto.
For Bitcoin, the next major move may therefore depend less on whether stocks continue higher and more on whether crypto-specific liquidity and institutional demand return with enough force to break the current range.
Bitcoin is not necessarily being left behind. The market may simply be waiting for its own reason to move.
Why Bitcoin Remains Below $65,000 as the S&P 500 Adds $2 Trillion in Market Value
Bitcoin is struggling to keep pace with Wall Street, despite a powerful risk-on rally in U.S. equities. The divergence highlights a changing relationship between traditional markets and crypto — and raises questions about what Bitcoin needs to break higher.
U.S. stocks are having a strong August, but Bitcoin has largely refused to join the party.
The S&P 500 has climbed roughly 3.12% this month, adding an estimated $2.1 trillion to its market capitalization and pushing its total value to around $70.5 trillion. The Nasdaq and Dow Jones have also remained firmly supported.
Bitcoin, meanwhile, has gained only around 2% this month and continues to trade near the $64,000–$65,000 area.
That disconnect is notable because Bitcoin has increasingly traded alongside traditional risk assets since the 2020 market crash. Yet the latest stock-market rally appears to be driven by factors that do not necessarily translate into cryptocurrency demand.
AI Is Driving Stocks — But Not Bitcoin
One of the biggest reasons for the divergence is the composition of the equity rally.
The latest move higher in U.S. stocks has been heavily concentrated in artificial intelligence, semiconductor and mega-cap technology companies.
Those sectors have little direct exposure to Bitcoin.
As a result, investors can be aggressively buying equities without necessarily increasing their exposure to crypto.
The distinction matters. A broad-based improvement in global risk appetite could potentially lift stocks and Bitcoin together. But when capital is flowing specifically toward AI and semiconductor companies, the transmission into crypto becomes much weaker.
Falling Oil Prices Could Eventually Help Bitcoin
Another important development is the renewed decline in oil prices and expectations that energy markets could normalize as conditions around the Strait of Hormuz improve.
Lower oil prices are generally supportive of equities because they can reduce costs for businesses.
For Bitcoin, however, the impact is more indirect.
Lower energy prices could reduce inflationary pressure, potentially influencing expectations for Federal Reserve monetary policy. If markets eventually begin pricing in a less restrictive Fed, liquidity-sensitive assets such as Bitcoin could benefit.
But that process takes time.
For now, uncertainty surrounding the Federal Reserve's next moves continues to keep investors cautious.
Crypto Has Its Own Problems
Bitcoin's underperformance isn't entirely about stocks.
The cryptocurrency market is also dealing with several crypto-specific pressures.
Recent concerns include the reported $120 million Coldcard exploit, uncertainty surrounding the Clarity Act, and reports involving Strategy's Bitcoin holdings.
These developments have weighed on sentiment and contributed to a more cautious market environment.
At the same time, the supply of major stablecoins has declined.
USDT supply reportedly fell from approximately $190 billion in April to $183 billion, while USDC declined from roughly $79.5 billion to $72 billion.
That matters because stablecoins provide an important source of liquidity within crypto markets.
If investors can earn attractive real returns through traditional fixed-income markets, there is less incentive to keep capital sitting inside crypto.
Bitcoin's Four-Year Cycle Is Also Affecting Investor Behaviour
Perhaps one of the most interesting factors is the market's belief in Bitcoin's traditional four-year cycle.
Some traders now expect Bitcoin to experience a significant bottom around October.
That expectation itself may be influencing behaviour.
Rather than aggressively buying Bitcoin during the current stock-market rally, some traders appear to be waiting for a potential correction later in the year.
This creates a curious situation: the expectation of a future Bitcoin bottom could actually be helping prevent traders from positioning aggressively today.
But there is another interpretation.
Bitcoin has remained relatively resilient despite a still-hawkish Federal Reserve environment. If monetary policy becomes less restrictive than expected, the market may discover that Bitcoin's anticipated cycle bottom has already occurred.
ETF Demand Needs to Prove Itself
Institutional Bitcoin demand is another major piece of the puzzle.
U.S.-listed spot Bitcoin ETFs recently recorded an outflow of approximately $61.5 million, interrupting a weak period of inflows.
However, this week's ETF flows have reportedly turned positive, bringing in approximately $626 million the strongest weekly inflow figure since early May.
The question now is whether that demand can continue.
A few positive sessions are not enough to establish a new trend. Sustained ETF inflows would provide stronger evidence that institutional investors are returning to Bitcoin.
The Key Levels Traders Are Watching
Bitcoin is currently caught in a relatively narrow range.
Market observers are watching approximately $63,000–$63,400 as support, while $64,500–$66,000 represents an important resistance area.
A decisive move above the upper resistance zone could change the short-term market structure and potentially attract momentum buyers.
Conversely, a breakdown below the $63,000 region would reinforce concerns that Bitcoin remains vulnerable to another leg lower.
Bitcoin Needs Its Own Catalyst
The bigger story is that Bitcoin can no longer simply rely on Wall Street's strength to generate upside.
The S&P 500 has demonstrated that investors are willing to take risk — but that risk appetite is currently being directed toward AI, semiconductors and mega-cap equities rather than crypto.
Bitcoin therefore needs a catalyst of its own.
That could come from stronger ETF inflows, improving liquidity, regulatory clarity, stablecoin growth, easier monetary policy or renewed institutional demand.
Until then, Bitcoin's inability to follow a surging S&P 500 suggests that the crypto market is still waiting for its next major narrative.
The Bottom Line
The current divergence does not necessarily mean Bitcoin is permanently disconnected from stocks.
Instead, it shows that not every risk-on rally is created equally.
Wall Street can add trillions in value while Bitcoin remains trapped below $65,000 when the money is concentrated in sectors with little direct connection to crypto.
For Bitcoin, the next major move may therefore depend less on whether stocks continue higher and more on whether crypto-specific liquidity and institutional demand return with enough force to break the current range.
Bitcoin is not necessarily being left behind. The market may simply be waiting for its own reason to move.
U.S. stocks are having a strong August, but Bitcoin has largely refused to join the party.
The S&P 500 has climbed roughly 3.12% this month, adding an estimated $2.1 trillion to its market capitalization and pushing its total value to around $70.5 trillion. The Nasdaq and Dow Jones have also remained firmly supported.
Bitcoin, meanwhile, has gained only around 2% this month and continues to trade near the $64,000–$65,000 area.
That disconnect is notable because Bitcoin has increasingly traded alongside traditional risk assets since the 2020 market crash. Yet the latest stock-market rally appears to be driven by factors that do not necessarily translate into cryptocurrency demand.
AI Is Driving Stocks — But Not Bitcoin
One of the biggest reasons for the divergence is the composition of the equity rally.
The latest move higher in U.S. stocks has been heavily concentrated in artificial intelligence, semiconductor and mega-cap technology companies.
Those sectors have little direct exposure to Bitcoin.
As a result, investors can be aggressively buying equities without necessarily increasing their exposure to crypto.
The distinction matters. A broad-based improvement in global risk appetite could potentially lift stocks and Bitcoin together. But when capital is flowing specifically toward AI and semiconductor companies, the transmission into crypto becomes much weaker.
Falling Oil Prices Could Eventually Help Bitcoin
Another important development is the renewed decline in oil prices and expectations that energy markets could normalize as conditions around the Strait of Hormuz improve.
Lower oil prices are generally supportive of equities because they can reduce costs for businesses.
For Bitcoin, however, the impact is more indirect.
Lower energy prices could reduce inflationary pressure, potentially influencing expectations for Federal Reserve monetary policy. If markets eventually begin pricing in a less restrictive Fed, liquidity-sensitive assets such as Bitcoin could benefit.
But that process takes time.
For now, uncertainty surrounding the Federal Reserve's next moves continues to keep investors cautious.
Crypto Has Its Own Problems
Bitcoin's underperformance isn't entirely about stocks.
The cryptocurrency market is also dealing with several crypto-specific pressures.
Recent concerns include the reported $120 million Coldcard exploit, uncertainty surrounding the Clarity Act, and reports involving Strategy's Bitcoin holdings.
These developments have weighed on sentiment and contributed to a more cautious market environment.
At the same time, the supply of major stablecoins has declined.
USDT supply reportedly fell from approximately $190 billion in April to $183 billion, while USDC declined from roughly $79.5 billion to $72 billion.
That matters because stablecoins provide an important source of liquidity within crypto markets.
If investors can earn attractive real returns through traditional fixed-income markets, there is less incentive to keep capital sitting inside crypto.
Bitcoin's Four-Year Cycle Is Also Affecting Investor Behaviour
Perhaps one of the most interesting factors is the market's belief in Bitcoin's traditional four-year cycle.
Some traders now expect Bitcoin to experience a significant bottom around October.
That expectation itself may be influencing behaviour.
Rather than aggressively buying Bitcoin during the current stock-market rally, some traders appear to be waiting for a potential correction later in the year.
This creates a curious situation: the expectation of a future Bitcoin bottom could actually be helping prevent traders from positioning aggressively today.
But there is another interpretation.
Bitcoin has remained relatively resilient despite a still-hawkish Federal Reserve environment. If monetary policy becomes less restrictive than expected, the market may discover that Bitcoin's anticipated cycle bottom has already occurred.
ETF Demand Needs to Prove Itself
Institutional Bitcoin demand is another major piece of the puzzle.
U.S.-listed spot Bitcoin ETFs recently recorded an outflow of approximately $61.5 million, interrupting a weak period of inflows.
However, this week's ETF flows have reportedly turned positive, bringing in approximately $626 million the strongest weekly inflow figure since early May.
The question now is whether that demand can continue.
A few positive sessions are not enough to establish a new trend. Sustained ETF inflows would provide stronger evidence that institutional investors are returning to Bitcoin.
The Key Levels Traders Are Watching
Bitcoin is currently caught in a relatively narrow range.
Market observers are watching approximately $63,000–$63,400 as support, while $64,500–$66,000 represents an important resistance area.
A decisive move above the upper resistance zone could change the short-term market structure and potentially attract momentum buyers.
Conversely, a breakdown below the $63,000 region would reinforce concerns that Bitcoin remains vulnerable to another leg lower.
Bitcoin Needs Its Own Catalyst
The bigger story is that Bitcoin can no longer simply rely on Wall Street's strength to generate upside.
The S&P 500 has demonstrated that investors are willing to take risk — but that risk appetite is currently being directed toward AI, semiconductors and mega-cap equities rather than crypto.
Bitcoin therefore needs a catalyst of its own.
That could come from stronger ETF inflows, improving liquidity, regulatory clarity, stablecoin growth, easier monetary policy or renewed institutional demand.
Until then, Bitcoin's inability to follow a surging S&P 500 suggests that the crypto market is still waiting for its next major narrative.
The Bottom Line
The current divergence does not necessarily mean Bitcoin is permanently disconnected from stocks.
Instead, it shows that not every risk-on rally is created equally.
Wall Street can add trillions in value while Bitcoin remains trapped below $65,000 when the money is concentrated in sectors with little direct connection to crypto.
For Bitcoin, the next major move may therefore depend less on whether stocks continue higher and more on whether crypto-specific liquidity and institutional demand return with enough force to break the current range.
Bitcoin is not necessarily being left behind. The market may simply be waiting for its own reason to move.
94
·
--
🚨 $14.6 BILLION IS MOVING AND THE REASON MATTERS
A major shift is happening underneath crypto.
BitGo is moving $7.3B of WBTC cross-chain infrastructure away from LayerZero and toward Chainlink CCIP.
That pushes announced LayerZero → Chainlink migrations to roughly $14.6B.
Why the migration?
The wave accelerated after the $292M Kelp DAO bridge exploit, putting renewed attention on cross-chain security and infrastructure design.
And this isn't just about WBTC.
Projects including Mantle, Kelp, Lombard, Solv, Virtuals, Re and Kraken have also announced moves toward Chainlink CCIP.
The bigger story:
🔗 Cross-chain infrastructure is becoming a serious battleground.
🛡️ Security and control are becoming increasingly important.
💰 Billions in assets are being positioned around the infrastructure that connects blockchains.
For Bitcoin, Ethereum, DeFi and tokenized assets, the bridges matter almost as much as the assets moving across them.
The question now isn't simply which blockchain wins?
It's:
WHO BUILDS THE RAILS THAT CONNECT THEM ALL? 👀
Follow Sackman for the next crypto signal. 🔥 $BTC $ETH $BNB
#Chainlink #LINK #bitcoin #WBTCUpdate #DeFi #Web3 #CryptoNews
🚨 $14.6 BILLION IS MOVING AND THE REASON MATTERS
A major shift is happening underneath crypto.
BitGo is moving $7.3B of WBTC cross-chain infrastructure away from LayerZero and toward Chainlink CCIP.
That pushes announced LayerZero → Chainlink migrations to roughly $14.6B.
Why the migration?
The wave accelerated after the $292M Kelp DAO bridge exploit, putting renewed attention on cross-chain security and infrastructure design.
And this isn't just about WBTC.
Projects including Mantle, Kelp, Lombard, Solv, Virtuals, Re and Kraken have also announced moves toward Chainlink CCIP.
The bigger story:
🔗 Cross-chain infrastructure is becoming a serious battleground.
🛡️ Security and control are becoming increasingly important.
💰 Billions in assets are being positioned around the infrastructure that connects blockchains.
For Bitcoin, Ethereum, DeFi and tokenized assets, the bridges matter almost as much as the assets moving across them.
The question now isn't simply which blockchain wins?
It's:
WHO BUILDS THE RAILS THAT CONNECT THEM ALL? 👀
Follow Sackman for the next crypto signal. 🔥 $BTC $ETH $BNB
#Chainlink #LINK #bitcoin #WBTCUpdate #DeFi #Web3 #CryptoNews
A major shift is happening underneath crypto.
BitGo is moving $7.3B of WBTC cross-chain infrastructure away from LayerZero and toward Chainlink CCIP.
That pushes announced LayerZero → Chainlink migrations to roughly $14.6B.
Why the migration?
The wave accelerated after the $292M Kelp DAO bridge exploit, putting renewed attention on cross-chain security and infrastructure design.
And this isn't just about WBTC.
Projects including Mantle, Kelp, Lombard, Solv, Virtuals, Re and Kraken have also announced moves toward Chainlink CCIP.
The bigger story:
🔗 Cross-chain infrastructure is becoming a serious battleground.
🛡️ Security and control are becoming increasingly important.
💰 Billions in assets are being positioned around the infrastructure that connects blockchains.
For Bitcoin, Ethereum, DeFi and tokenized assets, the bridges matter almost as much as the assets moving across them.
The question now isn't simply which blockchain wins?
It's:
WHO BUILDS THE RAILS THAT CONNECT THEM ALL? 👀
Follow Sackman for the next crypto signal. 🔥 $BTC $ETH $BNB
#Chainlink #LINK #bitcoin #WBTCUpdate #DeFi #Web3 #CryptoNews

26
·
--
Хранение $BNB 0.3 USDT
🚨 BITCOIN HAS REASONS TO PANIC — BUT IT ISN’T
Bitcoin is sitting near $64,000, with plenty of pressure building underneath the surface:
📉 U.S. spot Bitcoin ETFs recorded $61.53M in weekly outflows
💵 USDT and USDC market caps are declining
🏦 Institutional demand remains weak
📊 Real Treasury yields are at their highest levels since 2008
⚖️ U.S. crypto regulation remains uncertain
Yet Bitcoin’s fear gauge, BVIV, has fallen to around 36% — its lowest level since May 31.
That is the interesting part.
Markets can stay surprisingly calm even when the headlines look ugly.
Meanwhile, approximately 155,000 BTC moved into the $62K–$65K cost-basis range, suggesting buyers have absorbed selling around current levels.
So Bitcoin may currently be range-bound rather than broken.
But volatility sitting near historical floor levels means one thing:
⚠️ Stay alert.
The next major move could be triggered by a catalyst — and volatility can explode in either direction.
Bitcoin isn't panicking.
The question is: who moves first? 👀
Follow Sackam for the next crypto market signal. 🔥$BTC $ETH $BNB
#bitcoin.” #BTC☀ #CryptoNews🚀🔥 #BitcoinNews #CryptoMarket
🚨 BITCOIN HAS REASONS TO PANIC — BUT IT ISN’T
Bitcoin is sitting near $64,000, with plenty of pressure building underneath the surface:
📉 U.S. spot Bitcoin ETFs recorded $61.53M in weekly outflows
💵 USDT and USDC market caps are declining
🏦 Institutional demand remains weak
📊 Real Treasury yields are at their highest levels since 2008
⚖️ U.S. crypto regulation remains uncertain
Yet Bitcoin’s fear gauge, BVIV, has fallen to around 36% — its lowest level since May 31.
That is the interesting part.
Markets can stay surprisingly calm even when the headlines look ugly.
Meanwhile, approximately 155,000 BTC moved into the $62K–$65K cost-basis range, suggesting buyers have absorbed selling around current levels.
So Bitcoin may currently be range-bound rather than broken.
But volatility sitting near historical floor levels means one thing:
⚠️ Stay alert.
The next major move could be triggered by a catalyst — and volatility can explode in either direction.
Bitcoin isn't panicking.
The question is: who moves first? 👀
Follow Sackam for the next crypto market signal. 🔥$BTC $ETH $BNB
#bitcoin.” #BTC☀ #CryptoNews🚀🔥 #BitcoinNews #CryptoMarket
Bitcoin is sitting near $64,000, with plenty of pressure building underneath the surface:
📉 U.S. spot Bitcoin ETFs recorded $61.53M in weekly outflows
💵 USDT and USDC market caps are declining
🏦 Institutional demand remains weak
📊 Real Treasury yields are at their highest levels since 2008
⚖️ U.S. crypto regulation remains uncertain
Yet Bitcoin’s fear gauge, BVIV, has fallen to around 36% — its lowest level since May 31.
That is the interesting part.
Markets can stay surprisingly calm even when the headlines look ugly.
Meanwhile, approximately 155,000 BTC moved into the $62K–$65K cost-basis range, suggesting buyers have absorbed selling around current levels.
So Bitcoin may currently be range-bound rather than broken.
But volatility sitting near historical floor levels means one thing:
⚠️ Stay alert.
The next major move could be triggered by a catalyst — and volatility can explode in either direction.
Bitcoin isn't panicking.
The question is: who moves first? 👀
Follow Sackam for the next crypto market signal. 🔥$BTC $ETH $BNB
#bitcoin.” #BTC☀ #CryptoNews🚀🔥 #BitcoinNews #CryptoMarket
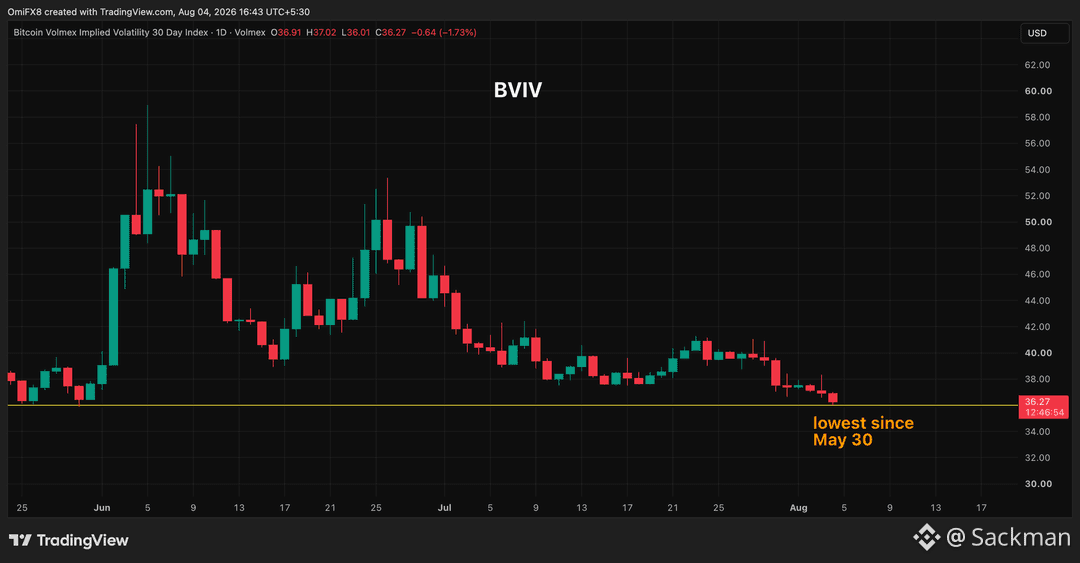
22
·
--
LIVE NEWS: BITCOIN HOLDS $63,600 AS U.S.–JAPAN YEN MOVE BRINGS CARRY-TRADE FEARS BACK
Bitcoin is holding around $63,600 after a rare move by the United States and Japan to support the yen and bring fresh attention to the carry trade and the risk it could create across global markets.
Japan and the U.S. confirmed they bought yen on Friday after it weakened to ¥163.73 per dollar. Bank of Japan data suggests Tokyo may have spent as much as $36.6 billion, while the U.S. contribution has not been disclosed.
The yen then strengthened to ¥157.57 on Friday and remained close to ¥157 on Monday.
Why does crypto care?
Because investors can borrow cheaply in Japan, where the policy rate is 1%, and move that money into assets offering higher returns.
If the yen suddenly strengthens, those positions can become more expensive to maintain. Traders may then be forced to close positions and sell assets to repay their yen-based loans.
Bitcoin hasn't reacted strongly so far.
BTC is around $63,600, up roughly 1.8% over 24 hours and little changed over the past seven days.
Bitget Wallet COO Alvin Kan described the intervention more as an attempt to prevent disorderly trading than the beginning of a lasting yen recovery.
The key number to watch is still the interest-rate gap: the Federal Reserve is at 3.50%–3.75%, compared with 1% in Japan.
Unless that gap narrows or investors begin unwinding yen-funded trades themselves, intervention could simply slow the yen's decline rather than reverse it.
I'm watching Bitcoin but I'm also watching the yen. Because sometimes the next crypto move starts somewhere outside crypto.
Follow Sackam for the next crypto update as it develops.
#Bitcoin #BTC #CryptoNews🚀🔥 #CryptoMarket #Japan #Yen #CarryTrade #FederalReserve #Crypto #BitcoinNews
LIVE NEWS: BITCOIN HOLDS $63,600 AS U.S.–JAPAN YEN MOVE BRINGS CARRY-TRADE FEARS BACK
Bitcoin is holding around $63,600 after a rare move by the United States and Japan to support the yen and bring fresh attention to the carry trade and the risk it could create across global markets.
Japan and the U.S. confirmed they bought yen on Friday after it weakened to ¥163.73 per dollar. Bank of Japan data suggests Tokyo may have spent as much as $36.6 billion, while the U.S. contribution has not been disclosed.
The yen then strengthened to ¥157.57 on Friday and remained close to ¥157 on Monday.
Why does crypto care?
Because investors can borrow cheaply in Japan, where the policy rate is 1%, and move that money into assets offering higher returns.
If the yen suddenly strengthens, those positions can become more expensive to maintain. Traders may then be forced to close positions and sell assets to repay their yen-based loans.
Bitcoin hasn't reacted strongly so far.
BTC is around $63,600, up roughly 1.8% over 24 hours and little changed over the past seven days.
Bitget Wallet COO Alvin Kan described the intervention more as an attempt to prevent disorderly trading than the beginning of a lasting yen recovery.
The key number to watch is still the interest-rate gap: the Federal Reserve is at 3.50%–3.75%, compared with 1% in Japan.
Unless that gap narrows or investors begin unwinding yen-funded trades themselves, intervention could simply slow the yen's decline rather than reverse it.
I'm watching Bitcoin but I'm also watching the yen. Because sometimes the next crypto move starts somewhere outside crypto.
Follow Sackam for the next crypto update as it develops.
#Bitcoin #BTC #CryptoNews🚀🔥 #CryptoMarket #Japan #Yen #CarryTrade #FederalReserve #Crypto #BitcoinNews
Bitcoin is holding around $63,600 after a rare move by the United States and Japan to support the yen and bring fresh attention to the carry trade and the risk it could create across global markets.
Japan and the U.S. confirmed they bought yen on Friday after it weakened to ¥163.73 per dollar. Bank of Japan data suggests Tokyo may have spent as much as $36.6 billion, while the U.S. contribution has not been disclosed.
The yen then strengthened to ¥157.57 on Friday and remained close to ¥157 on Monday.
Why does crypto care?
Because investors can borrow cheaply in Japan, where the policy rate is 1%, and move that money into assets offering higher returns.
If the yen suddenly strengthens, those positions can become more expensive to maintain. Traders may then be forced to close positions and sell assets to repay their yen-based loans.
Bitcoin hasn't reacted strongly so far.
BTC is around $63,600, up roughly 1.8% over 24 hours and little changed over the past seven days.
Bitget Wallet COO Alvin Kan described the intervention more as an attempt to prevent disorderly trading than the beginning of a lasting yen recovery.
The key number to watch is still the interest-rate gap: the Federal Reserve is at 3.50%–3.75%, compared with 1% in Japan.
Unless that gap narrows or investors begin unwinding yen-funded trades themselves, intervention could simply slow the yen's decline rather than reverse it.
I'm watching Bitcoin but I'm also watching the yen. Because sometimes the next crypto move starts somewhere outside crypto.
Follow Sackam for the next crypto update as it develops.
#Bitcoin #BTC #CryptoNews🚀🔥 #CryptoMarket #Japan #Yen #CarryTrade #FederalReserve #Crypto #BitcoinNews

16
·
--
SOLANA JUST PROPOSED A MAJOR SUPPLY SHIFT
Solana validators are signaling support for proposals that could push daily SOL burns from roughly $47,000 to as much as $650,000 — while also accelerating the network’s reduction in new SOL issuance.
But here’s the catch: about 40 million more SOL in validator support is still needed to reach the 15% threshold for a formal vote by August 18.
And don’t mistake this for instant deflation even 9,000 SOL burned daily would still be below roughly 60,000 SOL currently issued each day.
This could become one of Solana’s biggest tokenomics stories.
👀 I’m watching it. Are you? Follow Sackam for crypto news and market developments as they happen.
#solana #sol #CryptoNews #blockchaineconomy #altcoins
Real news image from the CoinDesk report.
SOLANA JUST PROPOSED A MAJOR SUPPLY SHIFT
Solana validators are signaling support for proposals that could push daily SOL burns from roughly $47,000 to as much as $650,000 — while also accelerating the network’s reduction in new SOL issuance.
But here’s the catch: about 40 million more SOL in validator support is still needed to reach the 15% threshold for a formal vote by August 18.
And don’t mistake this for instant deflation even 9,000 SOL burned daily would still be below roughly 60,000 SOL currently issued each day.
This could become one of Solana’s biggest tokenomics stories.
👀 I’m watching it. Are you? Follow Sackam for crypto news and market developments as they happen.
#solana #sol #CryptoNews #blockchaineconomy #altcoins
Real news image from the CoinDesk report.
Solana validators are signaling support for proposals that could push daily SOL burns from roughly $47,000 to as much as $650,000 — while also accelerating the network’s reduction in new SOL issuance.
But here’s the catch: about 40 million more SOL in validator support is still needed to reach the 15% threshold for a formal vote by August 18.
And don’t mistake this for instant deflation even 9,000 SOL burned daily would still be below roughly 60,000 SOL currently issued each day.
This could become one of Solana’s biggest tokenomics stories.
👀 I’m watching it. Are you? Follow Sackam for crypto news and market developments as they happen.
#solana #sol #CryptoNews #blockchaineconomy #altcoins
Real news image from the CoinDesk report.

29
·
--
🚨 JIM CRAMER SAYS HE’S SELLING BITCOIN — BUT BTC ISN’T PANICKING
Jim Cramer says he plans to sell his Bitcoin because he believes quantum computing could threaten Bitcoin’s security within the next few years. The warning follows comments from IBM CEO Arvind Krishna about the potential timeline for quantum threats.
Yet Bitcoin is holding around $64K, showing that the market isn't treating Cramer’s warning as an immediate reason to abandon BTC.
The important question isn't “Is Cramer right or wrong?”
It is:
Can Bitcoin’s cryptography evolve fast enough before quantum computers become a real threat?
That is the conversation I’m watching.
Follow Sackam 💱 for crypto news, market developments, predictions and analysis as they happen.
What do you think REAL THREAT or TOO EARLY TO PANIC? 👇
#Bitcoin #CryptoNews🔒📰🚫 #quantumcomputing #DeFi! #CryptoAnalysis
🚨 JIM CRAMER SAYS HE’S SELLING BITCOIN — BUT BTC ISN’T PANICKING
Jim Cramer says he plans to sell his Bitcoin because he believes quantum computing could threaten Bitcoin’s security within the next few years. The warning follows comments from IBM CEO Arvind Krishna about the potential timeline for quantum threats.
Yet Bitcoin is holding around $64K, showing that the market isn't treating Cramer’s warning as an immediate reason to abandon BTC.
The important question isn't “Is Cramer right or wrong?”
It is:
Can Bitcoin’s cryptography evolve fast enough before quantum computers become a real threat?
That is the conversation I’m watching.
Follow Sackam 💱 for crypto news, market developments, predictions and analysis as they happen.
What do you think REAL THREAT or TOO EARLY TO PANIC? 👇
#Bitcoin #CryptoNews🔒📰🚫 #quantumcomputing #DeFi! #CryptoAnalysis
Jim Cramer says he plans to sell his Bitcoin because he believes quantum computing could threaten Bitcoin’s security within the next few years. The warning follows comments from IBM CEO Arvind Krishna about the potential timeline for quantum threats.
Yet Bitcoin is holding around $64K, showing that the market isn't treating Cramer’s warning as an immediate reason to abandon BTC.
The important question isn't “Is Cramer right or wrong?”
It is:
Can Bitcoin’s cryptography evolve fast enough before quantum computers become a real threat?
That is the conversation I’m watching.
Follow Sackam 💱 for crypto news, market developments, predictions and analysis as they happen.
What do you think REAL THREAT or TOO EARLY TO PANIC? 👇
#Bitcoin #CryptoNews🔒📰🚫 #quantumcomputing #DeFi! #CryptoAnalysis

44
Войдите, чтобы посмотреть больше материала
Присоединяйтесь к пользователям криптовалют по всему миру на Binance Square
⚡️ Получайте новейшую и полезную информацию о криптоактивах.
💬 Нам доверяет крупнейшая в мире криптобиржа.
👍 Получите достоверные аналитические данные от верифицированных создателей контента.
Эл. почта/номер телефона
В тренде
USAugustPPIRisesLessThanExpected
Просмотров: 17,822
443 обсуждают
🚨 US AUG PPI: Rises LESS Than Expected! Bullish for Crypto? 🚀
PPI +0.4% MoM as expected, but CORE PPI only +0.2% vs +0.3% expected - cooling!
What it means:
• Wholesale inflation softer than feared
• Fed rate hike chance now 62% - but dovish signals coming
• Core PCE revisions expected downward - bullish
• BTC usually pumps on softer PPI
Fed meeting Sep 15-16 - Market now expects pause, not hike?
Is this the green light for Q4 rally?
#Bitcoin #PPI #Fed #CryptoNews #BTC#usaugustppiriseslessthanexpected
True News
·Лайков: 1
·Просмотров: 1.2k
SECApprovesNasdaqTexasCommodityTrustRule
Просмотров: 13,105
389 обсуждают
ECBRaisesRatesSecondTimeTo2.5%
Просмотров: 9,504
278 обсуждают