
khan-analysis
1 Публикации

khan-analysis
Отправить жалобу
Заблокировать пользователя
Открытая сделка
Трейдер с регулярными сделками
13 дн.
1 подписок(и/а)
0 подписчиков(а)
0 понравилось
Посты
Портфель
$BTC
{spot}(BTCUSDT)
📈Bitcoin ($BTC/USDT) Technical Analysis: Short-Term Market Outlook
As the crypto market continues to show dynamic price action, here is a detailed breakdown of the current technical setup for BTC/USDT based on recent chart indicators:
1. Price Action & 24-Hour Range
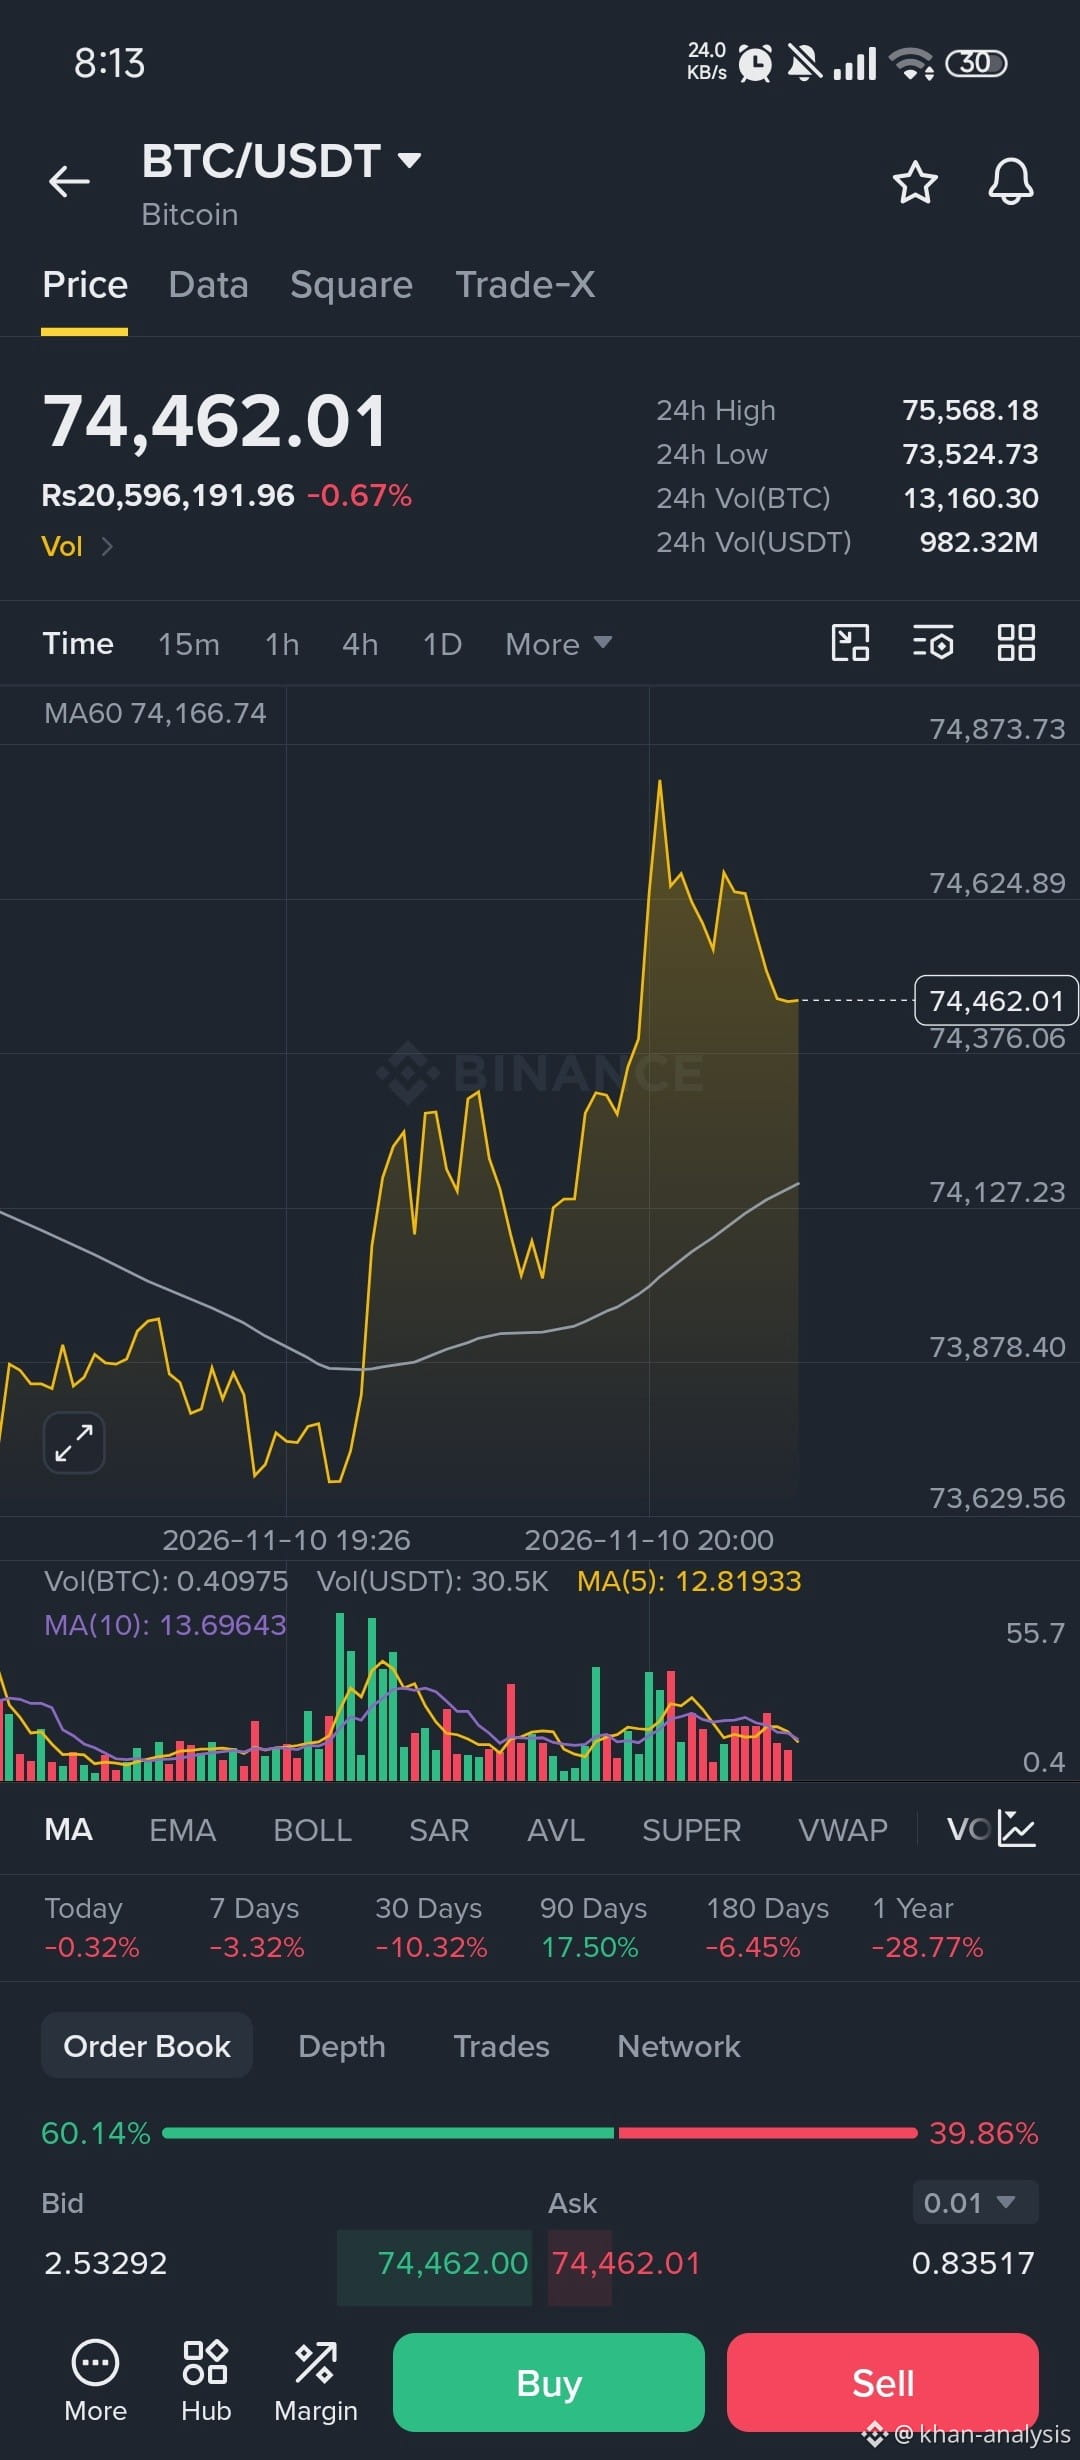
Current Price: Trading around $74,462.01 (approx. Rs 20,596,191) with a minor intraday adjustment of -0.67%.
24h High / Low: The market tested a low of $73,524.73 before rallying up to a high of $75,568.18. This healthy bounce from the lower support level indicates strong buying interest at dips.
2. Moving Average (MA60) & Trend Alignment
The 60-period Moving Average sits at $74,166.74.
Market Implication: The current price is hovering comfortably above the MA60 line, signaling that short-term bullish momentum remains intact as long as prices sustain above this moving average baseline.
3. Order Book & Market Sentiment
Bids (Buyer Pressure): 60.14%
Asks (Seller Pressure): 39.86%
Insight: The order book heavily favors the bulls, with significantly higher buy-side liquidity compared to sell-side pressure. This imbalance suggests potential continuation toward upper resistance zones if volume sustains.
(Disclaimer: This technical analysis is for informational purposes only and does not constitute financial advice. Always conduct your own research before trading.)
#BTC #CryptoTrading. #Bitcoin❗ #MarketAnalysis
$BTC
📈Bitcoin ($BTC /USDT) Technical Analysis: Short-Term Market Outlook
As the crypto market continues to show dynamic price action, here is a detailed breakdown of the current technical setup for BTC/USDT based on recent chart indicators:
1. Price Action & 24-Hour Range
Current Price: Trading around $74,462.01 (approx. Rs 20,596,191) with a minor intraday adjustment of -0.67%.
24h High / Low: The market tested a low of $73,524.73 before rallying up to a high of $75,568.18. This healthy bounce from the lower support level indicates strong buying interest at dips.
2. Moving Average (MA60) & Trend Alignment
The 60-period Moving Average sits at $74,166.74.
Market Implication: The current price is hovering comfortably above the MA60 line, signaling that short-term bullish momentum remains intact as long as prices sustain above this moving average baseline.
3. Order Book & Market Sentiment
Bids (Buyer Pressure): 60.14%
Asks (Seller Pressure): 39.86%
Insight: The order book heavily favors the bulls, with significantly higher buy-side liquidity compared to sell-side pressure. This imbalance suggests potential continuation toward upper resistance zones if volume sustains.
(Disclaimer: This technical analysis is for informational purposes only and does not constitute financial advice. Always conduct your own research before trading.)
#BTC #CryptoTrading. #Bitcoin❗ #MarketAnalysis
📈Bitcoin ($BTC /USDT) Technical Analysis: Short-Term Market Outlook
As the crypto market continues to show dynamic price action, here is a detailed breakdown of the current technical setup for BTC/USDT based on recent chart indicators:
1. Price Action & 24-Hour Range
Current Price: Trading around $74,462.01 (approx. Rs 20,596,191) with a minor intraday adjustment of -0.67%.
24h High / Low: The market tested a low of $73,524.73 before rallying up to a high of $75,568.18. This healthy bounce from the lower support level indicates strong buying interest at dips.
2. Moving Average (MA60) & Trend Alignment
The 60-period Moving Average sits at $74,166.74.
Market Implication: The current price is hovering comfortably above the MA60 line, signaling that short-term bullish momentum remains intact as long as prices sustain above this moving average baseline.
3. Order Book & Market Sentiment
Bids (Buyer Pressure): 60.14%
Asks (Seller Pressure): 39.86%
Insight: The order book heavily favors the bulls, with significantly higher buy-side liquidity compared to sell-side pressure. This imbalance suggests potential continuation toward upper resistance zones if volume sustains.
(Disclaimer: This technical analysis is for informational purposes only and does not constitute financial advice. Always conduct your own research before trading.)
#BTC #CryptoTrading. #Bitcoin❗ #MarketAnalysis
84
Войдите, чтобы посмотреть больше материала
Присоединяйтесь к пользователям криптовалют по всему миру на Binance Square
⚡️ Получайте новейшую и полезную информацию о криптоактивах.
💬 Нам доверяет крупнейшая в мире криптобиржа.
👍 Получите достоверные аналитические данные от верифицированных создателей контента.
Эл. почта/номер телефона
В тренде
HotCPIDecemberHikePriced
Просмотров: 26,129
619 обсуждают
CPI Market Watch | US CPI Rises 0.4% in October, Hotter Than 0.3% Forecast
Binance News
·Лайков: 18
·Просмотров: 30.9k
AnthropicRejectsIPODelayValuationinQuestion
Просмотров: 161,790
1,505 обсуждают
NvidiaInvestigatesAfterHuang’sAffairApology
Просмотров: 423,929
2,978 обсуждают