

Hamido
164 Публикации

Hamido
Отправить жалобу
Заблокировать пользователя
What deos means binance square
Открытая сделка

Владелец BNB
Случайный трейдер
4.4 г
570 подписок(и/а)
162 подписчиков(а)
214 понравилось
Посты
Портфель
Все
Цитирования
Видео
·
--
#compare my portofalio performances with market performances Your portfolio materially underperformed the overall crypto market over the latest 24-hour window: -5.04% versus approximately +0.97% for the total crypto market, a gap of about 6.01 percentage points.
The weakness appears portfolio-specific rather than market-wide, but the holding-level payload contains inconsistent value and allocation fields, so the exact source of the drag cannot be ranked reliably from this snapshot.
Deep Dive
Performance gap
| Measure | Portfolio | Overall crypto market | | --- | ---: | ---: | | Period | 26 Sep 2026 12:06 UTC to 27 Sep 2026 12:06 UTC | 26 Sep 2026 12:10 UTC to 27 Sep 2026 12:06 UTC | | Return | -5.04% | +0.97% | | Dollar change | -$1.03 | Market cap rose from $2.89T to $2.91T | | Relative difference | | Portfolio lagged by 6.01 percentage points |
The market advanced while the portfolio lost value, so broad market direction does not explain the portfolio’s decline.
What the holdings show
Bitcoin was up 1.01% over 24 hours, BNB was up 0.67%, and USDC was essentially flat at +0.01%. Several smaller holdings were also positive, including BONK at +0.27% and SHIB at +1.01%, while some positions were negative, such as VTHO at -4.78%, USTC at +1.19%, and SLP at -2.06%.
However, the reported BNB value of $47.01 exceeds the portfolio’s reported total value of $19.36, so the snapshot cannot support a trustworthy contributor or concentration ranking.
Market context
Total crypto market capitalization ended at approximately $2.91T, up from $2.89T over the same roughly 24-hour period. That combination of rising market capitalization and negative portfolio performance points to either portfolio-specific exposure, stale or inconsistent portfolio accounting, or both.
Bottom line: The portfolio’s reported 24-hour performance was substantially weaker than the market’s, with the market up about 1% while the portfolio fell about 5%. The read would change if the portfolio valuation fields were reconciled or if a longer performance window showed that this was only a one-day accounting or exposure anomaly.$BITCOIN
{alpha}(10x72e4f9f808c49a2a61de9c5896298920dc4eeea9)
#compare my portofalio performances with market performances
Your portfolio materially underperformed the overall crypto market over the latest 24-hour window: -5.04% versus approximately +0.97% for the total crypto market, a gap of about 6.01 percentage points.
The weakness appears portfolio-specific rather than market-wide, but the holding-level payload contains inconsistent value and allocation fields, so the exact source of the drag cannot be ranked reliably from this snapshot.
Deep Dive
Performance gap
| Measure | Portfolio | Overall crypto market | | --- | ---: | ---: | | Period | 26 Sep 2026 12:06 UTC to 27 Sep 2026 12:06 UTC | 26 Sep 2026 12:10 UTC to 27 Sep 2026 12:06 UTC | | Return | -5.04% | +0.97% | | Dollar change | -$1.03 | Market cap rose from $2.89T to $2.91T | | Relative difference | | Portfolio lagged by 6.01 percentage points |
The market advanced while the portfolio lost value, so broad market direction does not explain the portfolio’s decline.
What the holdings show
Bitcoin was up 1.01% over 24 hours, BNB was up 0.67%, and USDC was essentially flat at +0.01%. Several smaller holdings were also positive, including BONK at +0.27% and SHIB at +1.01%, while some positions were negative, such as VTHO at -4.78%, USTC at +1.19%, and SLP at -2.06%.
However, the reported BNB value of $47.01 exceeds the portfolio’s reported total value of $19.36, so the snapshot cannot support a trustworthy contributor or concentration ranking.
Market context
Total crypto market capitalization ended at approximately $2.91T, up from $2.89T over the same roughly 24-hour period. That combination of rising market capitalization and negative portfolio performance points to either portfolio-specific exposure, stale or inconsistent portfolio accounting, or both.
Bottom line: The portfolio’s reported 24-hour performance was substantially weaker than the market’s, with the market up about 1% while the portfolio fell about 5%. The read would change if the portfolio valuation fields were reconciled or if a longer performance window showed that this was only a one-day accounting or exposure anomaly.$BITCOIN
The weakness appears portfolio-specific rather than market-wide, but the holding-level payload contains inconsistent value and allocation fields, so the exact source of the drag cannot be ranked reliably from this snapshot.
Deep Dive
Performance gap
| Measure | Portfolio | Overall crypto market | | --- | ---: | ---: | | Period | 26 Sep 2026 12:06 UTC to 27 Sep 2026 12:06 UTC | 26 Sep 2026 12:10 UTC to 27 Sep 2026 12:06 UTC | | Return | -5.04% | +0.97% | | Dollar change | -$1.03 | Market cap rose from $2.89T to $2.91T | | Relative difference | | Portfolio lagged by 6.01 percentage points |
The market advanced while the portfolio lost value, so broad market direction does not explain the portfolio’s decline.
What the holdings show
Bitcoin was up 1.01% over 24 hours, BNB was up 0.67%, and USDC was essentially flat at +0.01%. Several smaller holdings were also positive, including BONK at +0.27% and SHIB at +1.01%, while some positions were negative, such as VTHO at -4.78%, USTC at +1.19%, and SLP at -2.06%.
However, the reported BNB value of $47.01 exceeds the portfolio’s reported total value of $19.36, so the snapshot cannot support a trustworthy contributor or concentration ranking.
Market context
Total crypto market capitalization ended at approximately $2.91T, up from $2.89T over the same roughly 24-hour period. That combination of rising market capitalization and negative portfolio performance points to either portfolio-specific exposure, stale or inconsistent portfolio accounting, or both.
Bottom line: The portfolio’s reported 24-hour performance was substantially weaker than the market’s, with the market up about 1% while the portfolio fell about 5%. The read would change if the portfolio valuation fields were reconciled or if a longer performance window showed that this was only a one-day accounting or exposure anomaly.$BITCOIN

Best Wishes!
От Hamido
Все получено
3
1
54
·
--
Рост

Alpha Trader Official
·
--
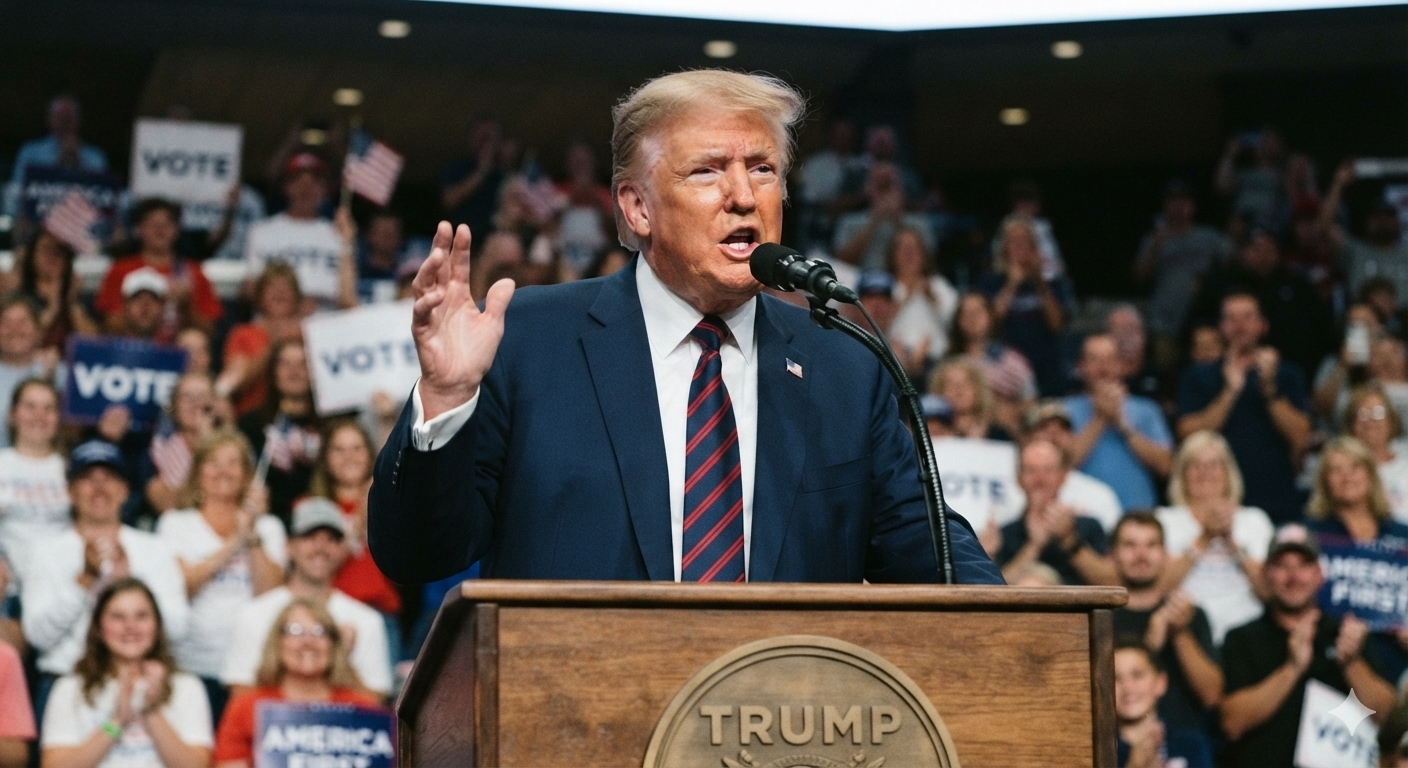
🇺🇸 TRUMP CRYPTO 🇺🇸 Trump's pushing to bring $62 TRILLION "perps" trading mainstream 🤯, while his own $1.4B crypto haul is exactly why his CLARITY Act keeps stalling in the Senate 😅. Meanwhile $TRUMP coin sits flat near $2.10 as 50+ federal prosecutors slam a pay deal tied to him 👀 — big moves for crypto's future, quiet chart for his own coin 🎰
$COIN #FollowYourBrotherForMore
NVDAB-1,21%
AAPLUS-0,06%
1
3
·
--
Рост

ONYX72
·
--
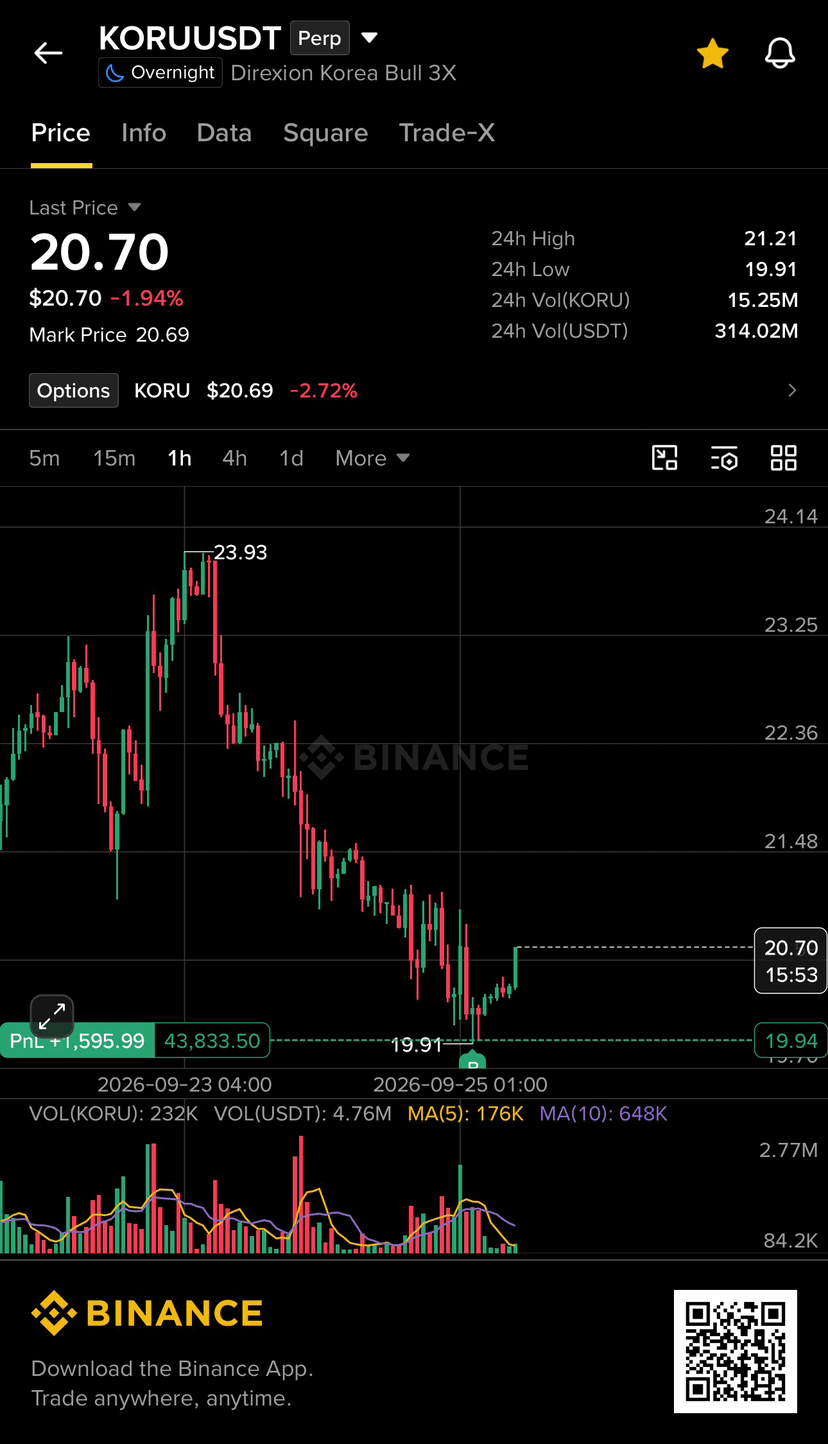
РостBuy the dip 🔥🔥 $KORU
1
73
·
--
OstiumLoanDisputeHearingSetInNYFederalCourgro-202609tls4-homepage-sharing-msg [https://www.binance.com/activity/trading-competition/202609tradersleague4?ref=OAD84V07](https://www.binance.com/activity/trading-competition/202609tradersleague4?ref=OAD84V07)#ParadigmDisclosesZECHolding $NVDAB
OstiumLoanDisputeHearingSetInNYFederalCourgro-202609tls4-homepage-sharing-msg https://www.binance.com/activity/trading-competition/202609tradersleague4?ref=OAD84V07#ParadigmDisclosesZECHolding $NVDAB
1
1
·
--
#ANALYSIS#XRP with #ETH $XRP
{spot}(XRPUSDT)
ETH vs XRP — Quick Answer
XRP is outperforming ETH over the last 24 hours by 6.89 percentage points: XRP +3.96% vs ETH -2.93%. Current prices: ETH $2,410.91, XRP $1.46.
24‑Hour Price Detail
ETH (Ethereum) — Price: $2,410.91; 24h change: -2.93%.
XRP (XRP) — Price: $1.46; 24h change: +3.96%.
Recent intra‑day action (5m snapshots over 24h)
ETH: recent high around $2,518.76, then drifted down to current ~$2,410, with higher volume earlier in the window and tapering volumes later.
XRP: ranged $1.41–$1.55 within the 24h window, finishing near $1.46 with volumes remaining elevated relative to earlier in the window.
What this means: XRP’s outperformance (+6.89 percentage points) is clear over the last 24 hours and driven by a rally earlier in the window while ETH faced selling pressure. If you want, I can:
Show a chart of both prices over the 24h window; or
Break the comparison into 1h, 6h, and 24h returns and compute relative outperformance numerically.
Confidence: High — based on CoinMarketCap live prices and 24h historical price points.
As of 23 Aug 2026 12:51 AM UTC+3 using CoinMarketCap live price and 24h historical prices.
#ANALYSIS
#XRP with #ETH $XRP
ETH vs XRP — Quick Answer
XRP is outperforming ETH over the last 24 hours by 6.89 percentage points: XRP +3.96% vs ETH -2.93%. Current prices: ETH $2,410.91, XRP $1.46.
24‑Hour Price Detail
ETH (Ethereum) — Price: $2,410.91; 24h change: -2.93%.
XRP (XRP) — Price: $1.46; 24h change: +3.96%.
Recent intra‑day action (5m snapshots over 24h)
ETH: recent high around $2,518.76, then drifted down to current ~$2,410, with higher volume earlier in the window and tapering volumes later.
XRP: ranged $1.41–$1.55 within the 24h window, finishing near $1.46 with volumes remaining elevated relative to earlier in the window.
What this means: XRP’s outperformance (+6.89 percentage points) is clear over the last 24 hours and driven by a rally earlier in the window while ETH faced selling pressure. If you want, I can:
Show a chart of both prices over the 24h window; or
Break the comparison into 1h, 6h, and 24h returns and compute relative outperformance numerically.
Confidence: High — based on CoinMarketCap live prices and 24h historical price points.
As of 23 Aug 2026 12:51 AM UTC+3 using CoinMarketCap live price and 24h historical prices.
ETH vs XRP — Quick Answer
XRP is outperforming ETH over the last 24 hours by 6.89 percentage points: XRP +3.96% vs ETH -2.93%. Current prices: ETH $2,410.91, XRP $1.46.
24‑Hour Price Detail
ETH (Ethereum) — Price: $2,410.91; 24h change: -2.93%.
XRP (XRP) — Price: $1.46; 24h change: +3.96%.
Recent intra‑day action (5m snapshots over 24h)
ETH: recent high around $2,518.76, then drifted down to current ~$2,410, with higher volume earlier in the window and tapering volumes later.
XRP: ranged $1.41–$1.55 within the 24h window, finishing near $1.46 with volumes remaining elevated relative to earlier in the window.
What this means: XRP’s outperformance (+6.89 percentage points) is clear over the last 24 hours and driven by a rally earlier in the window while ETH faced selling pressure. If you want, I can:
Show a chart of both prices over the 24h window; or
Break the comparison into 1h, 6h, and 24h returns and compute relative outperformance numerically.
Confidence: High — based on CoinMarketCap live prices and 24h historical price points.
As of 23 Aug 2026 12:51 AM UTC+3 using CoinMarketCap live price and 24h historical prices.
1
158

·
--
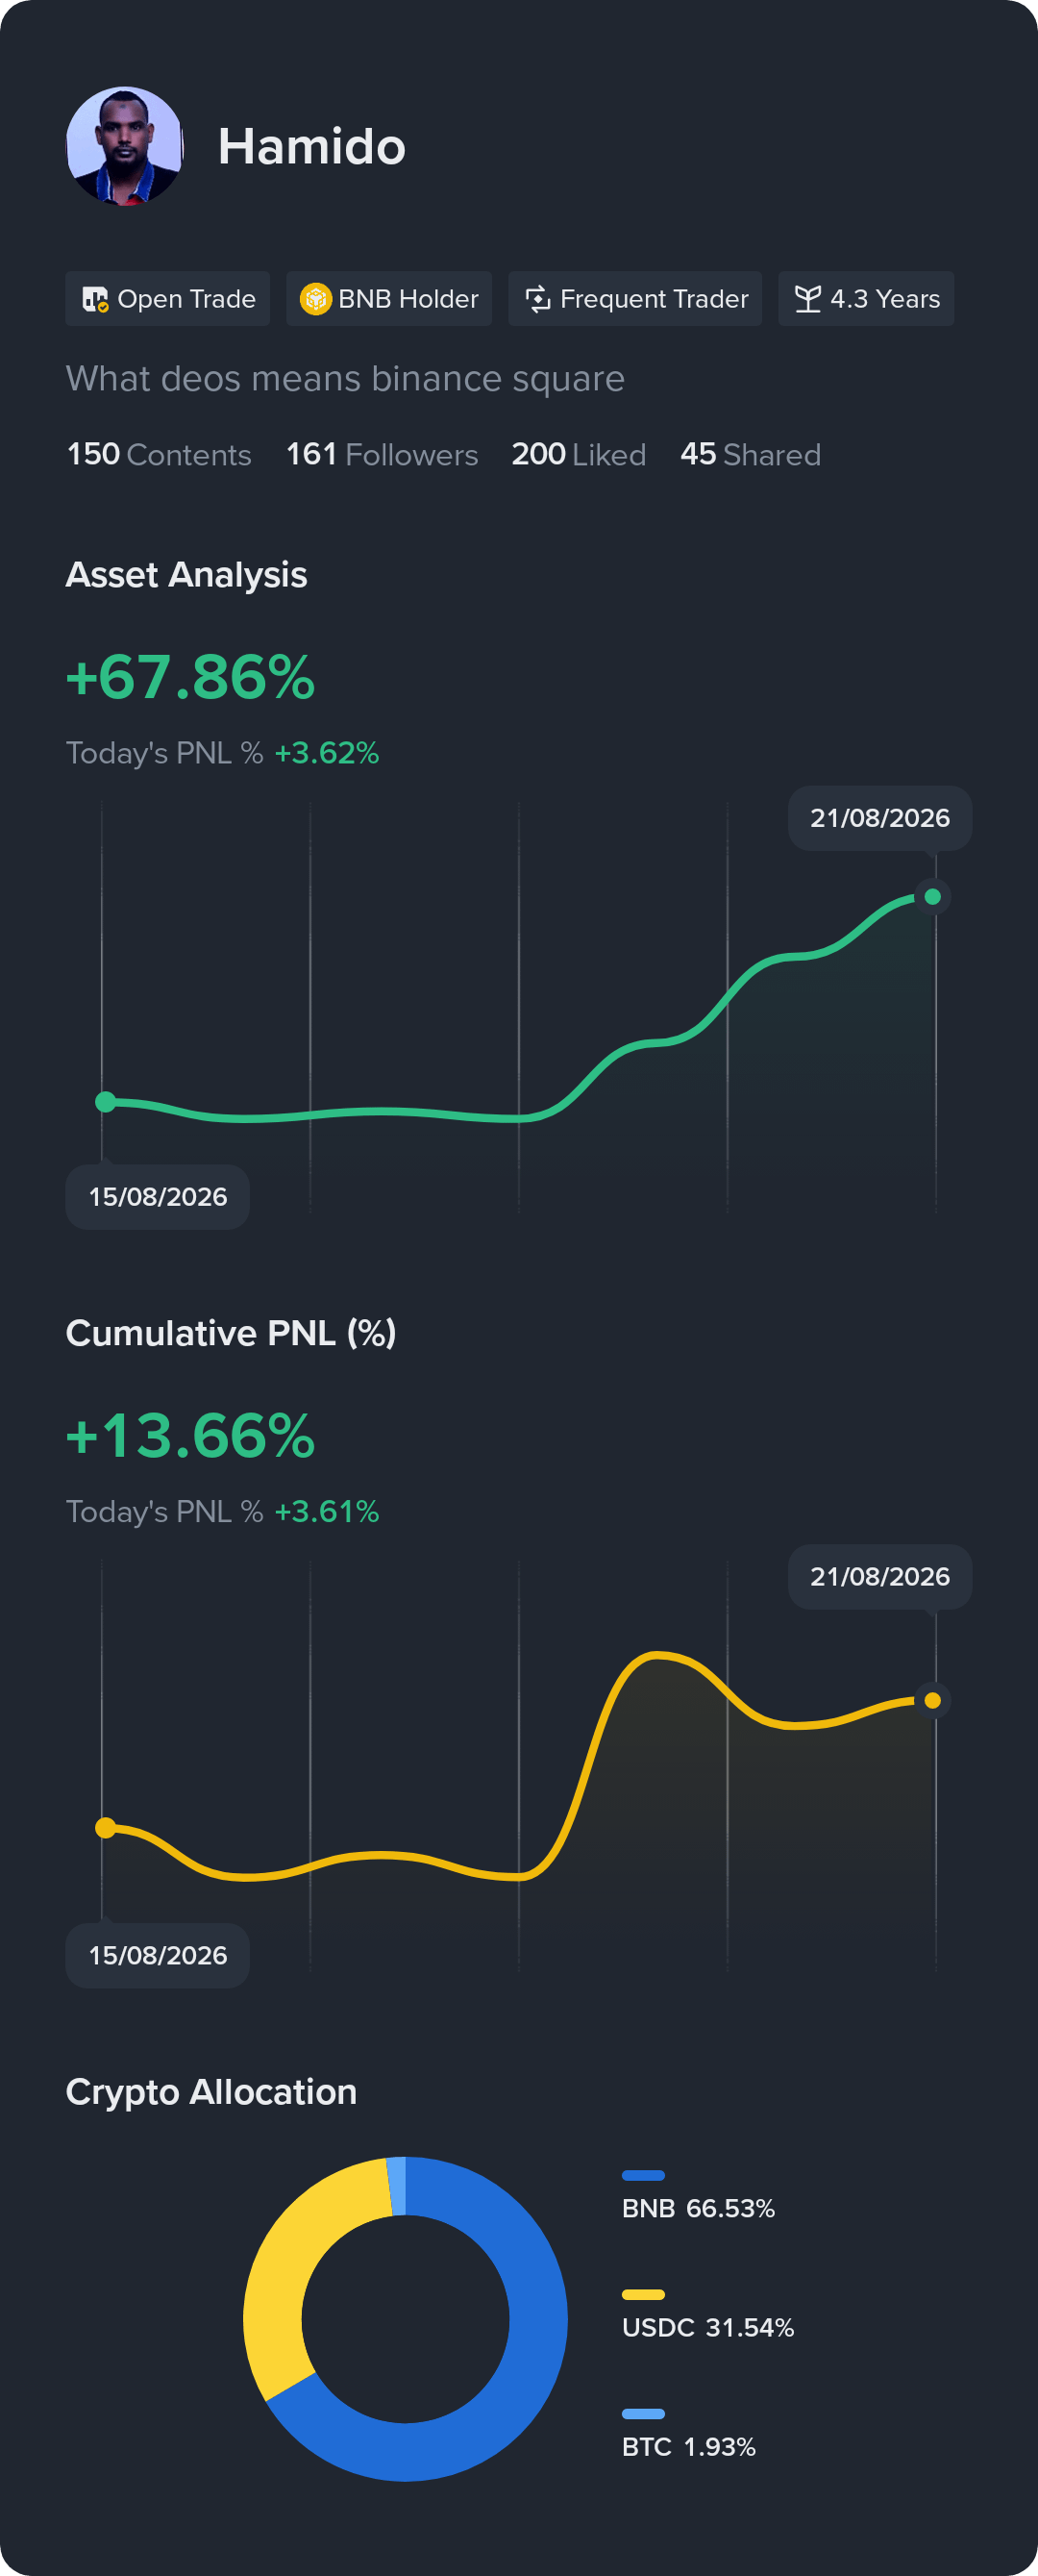
See my returns and portfolio breakdown. Follow for investment tips
See my returns and portfolio breakdown. Follow for investment tips
1
5
·
--
Рост
$BTCUSDT $WBS.US
BTC is at $77,046.00 on Binance Spot, +5.96% over the past 24 hours as of August 21, 2026. Today’s 24h range is $72,498.00–$79,500.00, with about $3.29B in BTCUSDT spot quote-volume—an indication of strong trading activity, though not a full cross-market capital-flow measure.
This spot flow snapshot does not include ETF subscriptions/redemptions, exchange wallet flows, or futures positioning; those are separate channels.
Market data only, not investment advice.
$BTCUSDT $WBS.US
BTC is at $77,046.00 on Binance Spot, +5.96% over the past 24 hours as of August 21, 2026. Today’s 24h range is $72,498.00–$79,500.00, with about $3.29B in BTCUSDT spot quote-volume—an indication of strong trading activity, though not a full cross-market capital-flow measure.
This spot flow snapshot does not include ETF subscriptions/redemptions, exchange wallet flows, or futures positioning; those are separate channels.
Market data only, not investment advice.
BTC is at $77,046.00 on Binance Spot, +5.96% over the past 24 hours as of August 21, 2026. Today’s 24h range is $72,498.00–$79,500.00, with about $3.29B in BTCUSDT spot quote-volume—an indication of strong trading activity, though not a full cross-market capital-flow measure.
This spot flow snapshot does not include ETF subscriptions/redemptions, exchange wallet flows, or futures positioning; those are separate channels.
Market data only, not investment advice.
1
55
·
--
#Why is bitcoin up today Bitcoin is up 6.64% to $77,359.17 in 24h, outperforming a broader market rally and primarily driven by a powerful combination of macro liquidity and regulatory optimism. It shows a strong correlation (92%) with Gold, indicating inflation-hedge positioning.
Primary reason: Macro policy catalysts, specifically the U.S. Treasury doubling long-end bond buybacks and renewed White House push for the CLARITY Act, improving liquidity and regulatory outlook.
Secondary reasons: A historic short squeeze liquidating over $826 million in BTC bearish bets, amplified by a technical breakout above key resistance near $76,000.
Near-term market outlook: If Bitcoin holds above the $75,310 support, it could retest the recent high near $79,463; a break below risks a pullback toward $72,000. The key trigger is the U.S. Senate cloture vote on the CLARITY Act scheduled for September 15.
Deep Dive
1. Macro & Policy Catalysts
Overview: The rally was ignited by a dual catalyst: the U.S. Treasury's announcement to double its long-end bond buybacks, which eased financial conditions (Business Insider), and a White House meeting where President Trump urged Congress to advance the CLARITY Act, boosting regulatory optimism (CNBC). This spurred institutional demand, with spot Bitcoin ETFs seeing $606.3 million in inflows on August 20 alone (FabiusDefi).
What it means: The move is fundamentally driven by improved macro liquidity and perceived regulatory progress, attracting institutional capital.
Watch for: Sustained ETF inflow data and developments around the September 15 Senate vote.
2. Short Squeeze & Technical Breakout
Overview: The sharp upward move triggered a massive liquidation of leveraged short positions. Over $826 million in BTC shorts were wiped out in 24 hours, creating a feedback loop that accelerated gains (TokenPost). Technically, Bitcoin decisively broke above the $76,000 resistance level, confirming the breakout with high volume.
What it means: While not the root cause, extreme leverage on the bearish side acted as a powerful amplifier, turning a strong rally into a parabolic move.
Watch for: Shifts in derivatives data, particularly open interest and funding rates, to gauge if squeeze pressure is easing.
3. Near-term Market Outlook
Overview: The immediate structure is bullish but extended. Key support is the 50% Fibonacci retracement level at $75,310, with major resistance at the recent swing high of $79,463. The upcoming Senate cloture vote on the CLARITY Act (Sept. 15) is a concrete event that could dictate sentiment.
What it means: The trend favors continuation, but the rapid ascent makes the market vulnerable to a volatile pullback if support fails.
Watch for: A daily close below $75,310 to signal exhaustion and a potential test of the next support near $72,934.
Conclusion
Market Outlook: Bullish Momentum Bitcoin's surge is anchored in tangible macro and policy improvements, amplified by a historic squeeze. The path of least resistance remains up, but the pace is unsustainable without consolidation. Key watch: Can Bitcoin establish a new support base above $75,300, or will profit-taking ahead of the September regulatory vote trigger a deeper correction?$BTC
#Why is bitcoin up today
Bitcoin is up 6.64% to $77,359.17 in 24h, outperforming a broader market rally and primarily driven by a powerful combination of macro liquidity and regulatory optimism. It shows a strong correlation (92%) with Gold, indicating inflation-hedge positioning.
Primary reason: Macro policy catalysts, specifically the U.S. Treasury doubling long-end bond buybacks and renewed White House push for the CLARITY Act, improving liquidity and regulatory outlook.
Secondary reasons: A historic short squeeze liquidating over $826 million in BTC bearish bets, amplified by a technical breakout above key resistance near $76,000.
Near-term market outlook: If Bitcoin holds above the $75,310 support, it could retest the recent high near $79,463; a break below risks a pullback toward $72,000. The key trigger is the U.S. Senate cloture vote on the CLARITY Act scheduled for September 15.
Deep Dive
1. Macro & Policy Catalysts
Overview: The rally was ignited by a dual catalyst: the U.S. Treasury's announcement to double its long-end bond buybacks, which eased financial conditions (Business Insider), and a White House meeting where President Trump urged Congress to advance the CLARITY Act, boosting regulatory optimism (CNBC). This spurred institutional demand, with spot Bitcoin ETFs seeing $606.3 million in inflows on August 20 alone (FabiusDefi).
What it means: The move is fundamentally driven by improved macro liquidity and perceived regulatory progress, attracting institutional capital.
Watch for: Sustained ETF inflow data and developments around the September 15 Senate vote.
2. Short Squeeze & Technical Breakout
Overview: The sharp upward move triggered a massive liquidation of leveraged short positions. Over $826 million in BTC shorts were wiped out in 24 hours, creating a feedback loop that accelerated gains (TokenPost). Technically, Bitcoin decisively broke above the $76,000 resistance level, confirming the breakout with high volume.
What it means: While not the root cause, extreme leverage on the bearish side acted as a powerful amplifier, turning a strong rally into a parabolic move.
Watch for: Shifts in derivatives data, particularly open interest and funding rates, to gauge if squeeze pressure is easing.
3. Near-term Market Outlook
Overview: The immediate structure is bullish but extended. Key support is the 50% Fibonacci retracement level at $75,310, with major resistance at the recent swing high of $79,463. The upcoming Senate cloture vote on the CLARITY Act (Sept. 15) is a concrete event that could dictate sentiment.
What it means: The trend favors continuation, but the rapid ascent makes the market vulnerable to a volatile pullback if support fails.
Watch for: A daily close below $75,310 to signal exhaustion and a potential test of the next support near $72,934.
Conclusion
Market Outlook: Bullish Momentum Bitcoin's surge is anchored in tangible macro and policy improvements, amplified by a historic squeeze. The path of least resistance remains up, but the pace is unsustainable without consolidation. Key watch: Can Bitcoin establish a new support base above $75,300, or will profit-taking ahead of the September regulatory vote trigger a deeper correction?$BTC
Primary reason: Macro policy catalysts, specifically the U.S. Treasury doubling long-end bond buybacks and renewed White House push for the CLARITY Act, improving liquidity and regulatory outlook.
Secondary reasons: A historic short squeeze liquidating over $826 million in BTC bearish bets, amplified by a technical breakout above key resistance near $76,000.
Near-term market outlook: If Bitcoin holds above the $75,310 support, it could retest the recent high near $79,463; a break below risks a pullback toward $72,000. The key trigger is the U.S. Senate cloture vote on the CLARITY Act scheduled for September 15.
Deep Dive
1. Macro & Policy Catalysts
Overview: The rally was ignited by a dual catalyst: the U.S. Treasury's announcement to double its long-end bond buybacks, which eased financial conditions (Business Insider), and a White House meeting where President Trump urged Congress to advance the CLARITY Act, boosting regulatory optimism (CNBC). This spurred institutional demand, with spot Bitcoin ETFs seeing $606.3 million in inflows on August 20 alone (FabiusDefi).
What it means: The move is fundamentally driven by improved macro liquidity and perceived regulatory progress, attracting institutional capital.
Watch for: Sustained ETF inflow data and developments around the September 15 Senate vote.
2. Short Squeeze & Technical Breakout
Overview: The sharp upward move triggered a massive liquidation of leveraged short positions. Over $826 million in BTC shorts were wiped out in 24 hours, creating a feedback loop that accelerated gains (TokenPost). Technically, Bitcoin decisively broke above the $76,000 resistance level, confirming the breakout with high volume.
What it means: While not the root cause, extreme leverage on the bearish side acted as a powerful amplifier, turning a strong rally into a parabolic move.
Watch for: Shifts in derivatives data, particularly open interest and funding rates, to gauge if squeeze pressure is easing.
3. Near-term Market Outlook
Overview: The immediate structure is bullish but extended. Key support is the 50% Fibonacci retracement level at $75,310, with major resistance at the recent swing high of $79,463. The upcoming Senate cloture vote on the CLARITY Act (Sept. 15) is a concrete event that could dictate sentiment.
What it means: The trend favors continuation, but the rapid ascent makes the market vulnerable to a volatile pullback if support fails.
Watch for: A daily close below $75,310 to signal exhaustion and a potential test of the next support near $72,934.
Conclusion
Market Outlook: Bullish Momentum Bitcoin's surge is anchored in tangible macro and policy improvements, amplified by a historic squeeze. The path of least resistance remains up, but the pace is unsustainable without consolidation. Key watch: Can Bitcoin establish a new support base above $75,300, or will profit-taking ahead of the September regulatory vote trigger a deeper correction?$BTC
1
48
·
--
Статья
#PORTFOLIO 请发一下你的持仓清单,我会直接帮你整理成组合分析:
1. 币种 + 数量
2. 建仓均价
3. 仓位占比
4. 你想看的维度(例如:盈亏、风险、再平衡、是否该减仓)
#PORTFOLIO
请发一下你的持仓清单,我会直接帮你整理成组合分析:
1. 币种 + 数量
2. 建仓均价
3. 仓位占比
4. 你想看的维度(例如:盈亏、风险、再平衡、是否该减仓)
1. 币种 + 数量
2. 建仓均价
3. 仓位占比
4. 你想看的维度(例如:盈亏、风险、再平衡、是否该减仓)
1
42
·
--
Рост
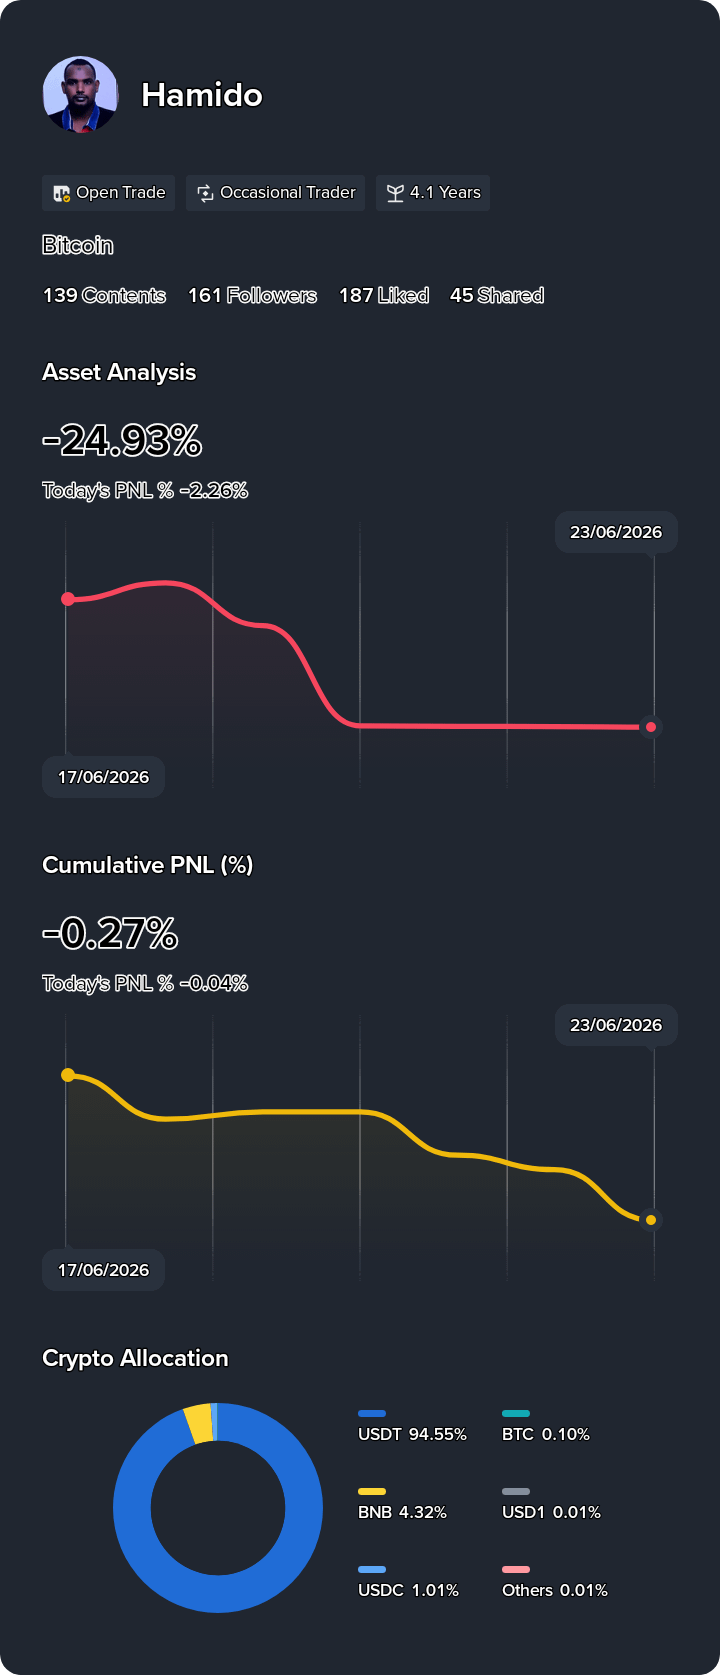
#BinanceToList4BStocksUSDTPairs $BTC See my returns and portfolio breakdown. Follow for investment tips
#BinanceToList4BStocksUSDTPairs $BTC See my returns and portfolio breakdown. Follow for investment tips
1
64
·
--
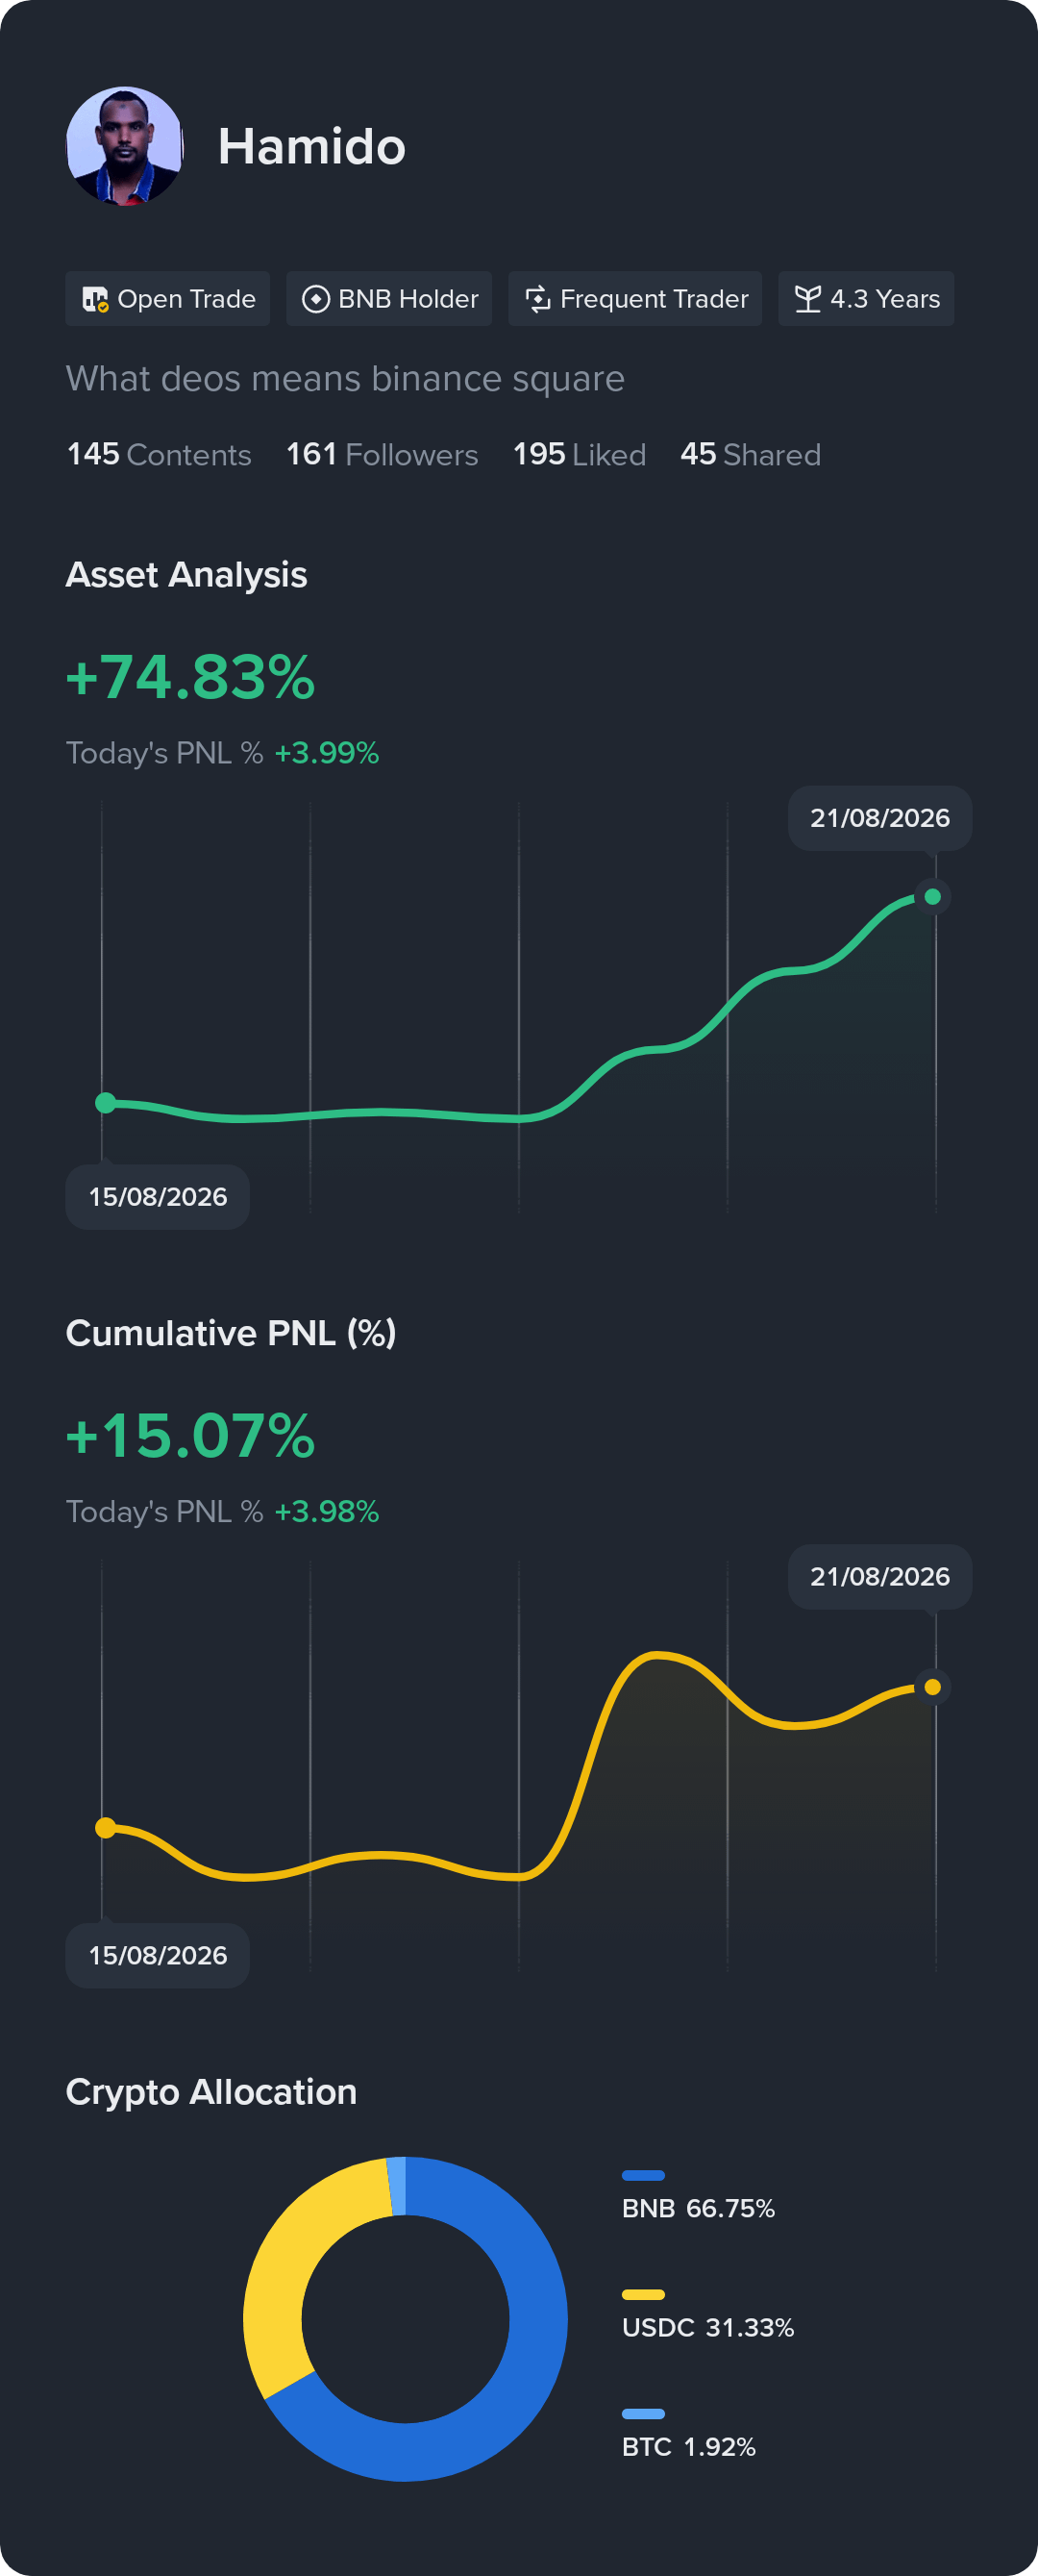
See my returns and portfolio breakdown. Follow for investment tips
See my returns and portfolio breakdown. Follow for investment tips
1
75
Войдите, чтобы посмотреть больше материала
Присоединяйтесь к пользователям криптовалют по всему миру на Binance Square
⚡️ Получайте новейшую и полезную информацию о криптоактивах.
💬 Нам доверяет крупнейшая в мире криптобиржа.
👍 Получите достоверные аналитические данные от верифицированных создателей контента.
Эл. почта/номер телефона
В тренде
BinanceKZ
Просмотров: 15,562
69 обсуждают
Как я потерял 180 000 тенге на «менеджере Binance» из WhatsApp — и почему всё равно остался в крипте
phpdead
·Лайков: 6
·Просмотров: 2.4k
SECToClarifyOnChainFundraisingRules
Просмотров: 25
26 обсуждают
UKFCAOpensCryptoFirmAuthorization
Просмотров: 1,096
79 обсуждают